asia pacific healthcare outlook focus : australia analysis of best opportunities 24 th february 2010
TRANSCRIPT

Asia Pacific Healthcare OutlookFocus : Australia
Analysis of Best Opportunities
24th February 2010

2
1. Overview of Healthcare Market: Key Takeaways
2. In-depth Sectoral Analysis, APAC and Australia
3. Summary: Best Opportunity Analysis, Australia
Agenda

3
Global Healthcare Market: 2009
• US and Europe were impacted in a major way by global crisis
• Asia also slowed down but not as much as the West
• Valuations were low and M&A was high, many smaller Biotech companies struggled
• Major organizational restructuring occurred, along with portfolios being reassessed
• Recovery of the markets to a large extent with strong growth in Asia
• Start of major patent expiries
• M&A activity down in the West but could be important in Asia, restructuring will continue
• Asia becoming increasingly important as a market and outsourcing hub
• 5Ps to drive market: Preventive, Preemptive, Personalized, Predictive, Personal Responsibility
Global Healthcare Market: 2010-12
Setting the Scene Outlook for Healthcare Industry from 2010-12
Source: Frost & Sullivan

4
23.9%23.9%
27.2%27.2%
23.2%23.2%
26.4%26.4%
CAGR12.2%CAGR12.2%
CAGR6.5%
CAGR6.5%
Global & APAC Healthcare Revenues US$ Bn, 2009-2012
• By 2015 APAC could represent ~40% of global market!Source: Frost & Sullivan
Rest of the World
APAC
Global vs. Apac: The New Frontier By 2012 APAC expected to be close to 27% of global market

5
Asia Pacific Market : 2009
• Slowing down of GDP in mature markets – Japan took a big hit
• Global consolidation left a difficult mess for integration on a local level – job losses and portfolio realignment
• Price cutting and playing the margins game
• The bubble burst for Medical Tourism
• Asia started to set up infrastructure for offshoring and outsourcing for US/EU companies
Asia Pacific Market : 2012
• A shift in the center of the world economically and strategically to Asia
• Asia to move from export led development to consumption led growth
• APAC the fastest growing pharma market and API production hub
• Increased government attention to primary and community based healthcare.
• Increased use of mobile technology in healthcare service delivery
Asia is However Transitionaing Moving toward a Multi–Polar World Order
Source: Frost & Sullivan

6
Australian Healthcare MarketBy 2012, Australia is estimated to be almost 5% of the APAC market
Australian Healthcare Revenues, US$ Bn, 2009-2012
Source: Frost & Sullivan
7
1. Overview of Healthcare Market: Key Takeaways
2. In-depth Sectoral Analysis, APAC and Australia
3. Summary: Best Opportunity Analysis, Australia
Agenda

8
Unresolved political and regulations issues Quality concern of generics & counterfeits
Government tenders favour local manufacturers
24.6% 28.5%
APAC Pharmaceuticals MarketEarlier diagnosis improves disease management and length of therapy
Note: All figures are rounded; the base year is 2009. Source: Frost and SullivanNote: All figures are rounded; the base year is 2009. Source: Frost and Sullivan
Market Drivers
Market Restraints
Long term use of multiple and specialized drugs for the ageing population
Government support for generics and biosimilars
Enhanced diagnosis and management in oncology, cardiovascular, pain etc
CAGR6.6 %
CAGR6.6 %
CAGR12.9 %CAGR12.9 %
Pharma Revenues, US$ Bn, 2009-2012
APAC Share
750825 866 909

9
Saturated market with low unmet needs
Government attempts to restrain PBS expenditure & BPS reforms
• Growing demand for lifestyle diseases drugs in an aging population e.g. cancer, cardiovascular, diabetes
• Uptake of new, expensive drugs
• Strong government support for generics
Australia Pharmaceuticals MarketMature market driven by lifestyle diseases
Pharmaceuticals Revenues, US$ Bn, 2009-2012
Market Drivers
Market Restraints
Source: Frost & Sullivan
10
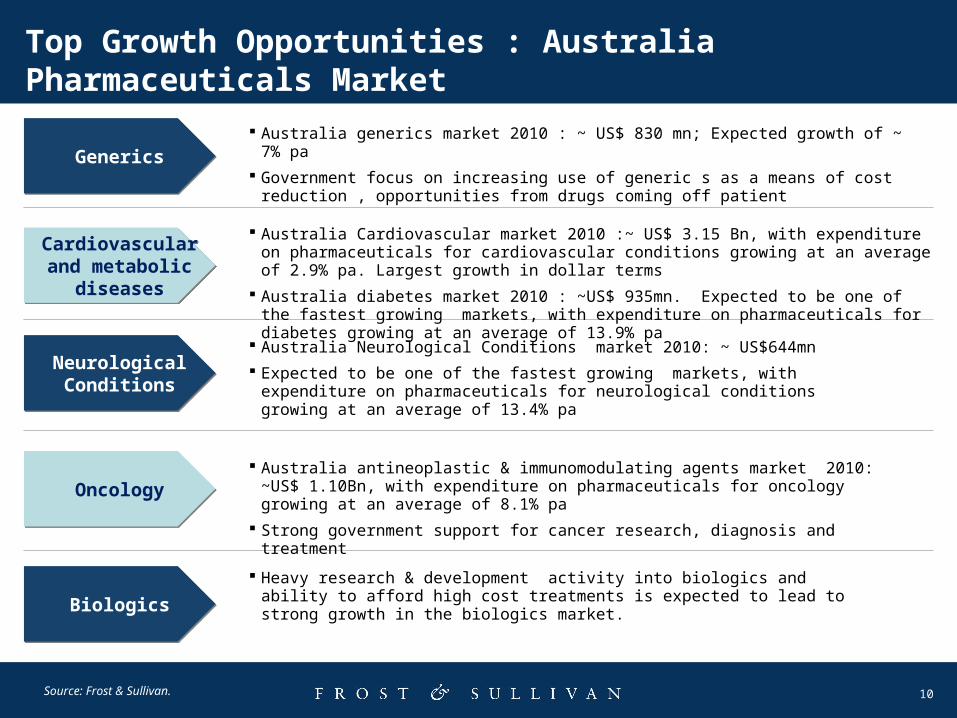
Australia Cardiovascular market 2010 :~ US$ 3.15 Bn, with expenditure on pharmaceuticals for cardiovascular conditions growing at an average of 2.9% pa. Largest growth in dollar terms
Australia diabetes market 2010 : ~US$ 935mn. Expected to be one of the fastest growing markets, with expenditure on pharmaceuticals for diabetes growing at an average of 13.9% pa
0
0
Source: Frost & Sullivan.
GenericsGenerics
Cardiovascular and metabolic
diseases
Cardiovascular and metabolic
diseases
Neurological Conditions
Neurological Conditions
OncologyOncology
Australia Neurological Conditions market 2010: ~ US$644mn
Expected to be one of the fastest growing markets, with expenditure on pharmaceuticals for neurological conditions growing at an average of 13.4% pa
Top Growth Opportunities : Australia Pharmaceuticals Market
Australia generics market 2010 : ~ US$ 830 mn; Expected growth of ~ 7% pa
Government focus on increasing use of generic s as a means of cost reduction , opportunities from drugs coming off patient
Australia antineoplastic & immunomodulating agents market 2010: ~US$ 1.10Bn, with expenditure on pharmaceuticals for oncology growing at an average of 8.1% pa
Strong government support for cancer research, diagnosis and treatment
BiologicsBiologics
Heavy research & development activity into biologics and ability to afford high cost treatments is expected to lead to strong growth in the biologics market.

11
•Regulatory and reimbursement hurdles
•Lack of sufficient distribution networks
•Inadequate training/certification for allied staff
APAC Medical Devices MarketTransition to a mindset of monitoring
23.8%23.8%
25.8%25.8%
Market Drivers
Market Restraints
•Safety, accuracy, efficiency, cost
•Silver industry devices
•Convergence of devices and pharma products
Medical Devices Revenues, US$ Bn, 2009-2012
APAC Share
CAGR5.8%
CAGR5.8%
CAGR10.2%CAGR10.2%
Note: All figures are rounded; the base year is 2009. Source: Frost and SullivanNote: All figures are rounded; the base year is 2009. Source: Frost and Sullivan

12
Medical Devices Revenues, US$ Bn, 2009-2012
Government’s commitment to reduce elective surgery waiting time
Increasing number of joint replacement procedures due to ageing population
Expansion of private health insurance results in demand for better medical care
Market Drivers
Increased medical device safety concerns could slow device approval cycle
Development of new technologies will replace conventional treatment methods.
Market Restraints
Australian Medical Devices MarketDemand for better quality of healthcare driving growth
Note: All figures are rounded; the base year is 2009. Source: Frost and SullivanNote: All figures are rounded; the base year is 2009. Source: Frost and Sullivan

13
High cost of genomics and proteomics tests
Mutually exclusive target customers
Reimbursement issues
APAC Clinical Diagnostics Market Shift in business model from instrumentation to service revenues
17.8%17.8%
18.5%18.5%
Market Drivers
Market Restraints
Lab automation
Home care monitoring
Emphasis on early detection
Clinical Diagnostics Revenues, US$ Bn, 2009-2012
APAC Share
CAGR7.3%
CAGR7.3%
CAGR6%
CAGR6%
Note: All figures are rounded; the base year is 2009. Source: Frost and SullivanNote: All figures are rounded; the base year is 2009. Source: Frost and Sullivan
14
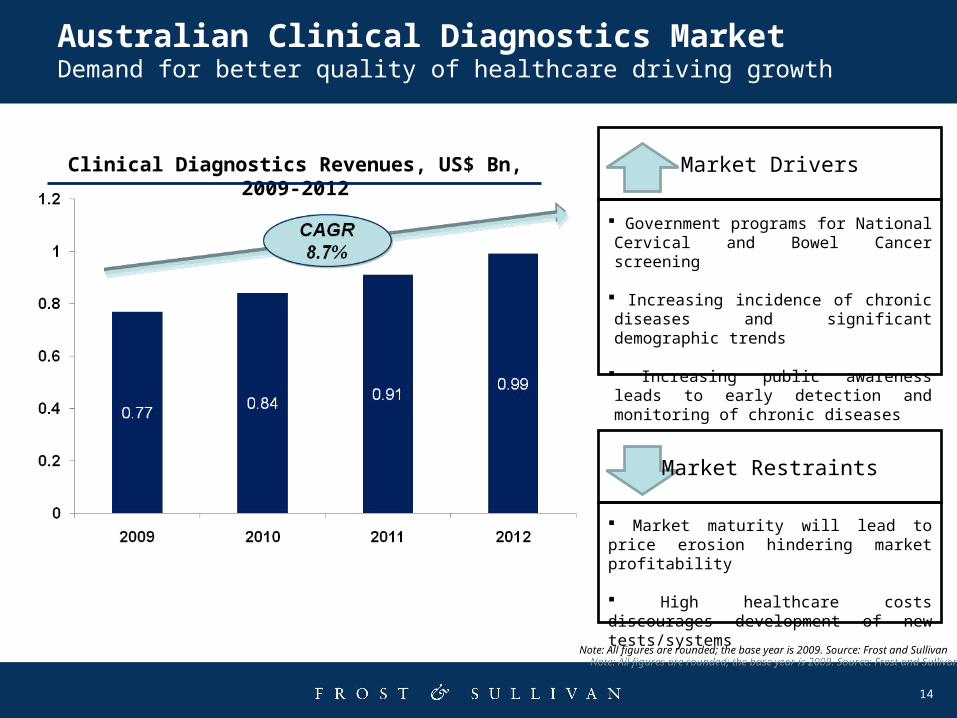
Clinical Diagnostics Revenues, US$ Bn, 2009-2012
Government programs for National Cervical and Bowel Cancer screening
Increasing incidence of chronic diseases and significant demographic trends
Increasing public awareness leads to early detection and monitoring of chronic diseases
Market Drivers
Market maturity will lead to price erosion hindering market profitability
High healthcare costs discourages development of new tests/systems
Market Restraints
Australian Clinical Diagnostics MarketDemand for better quality of healthcare driving growth
Note: All figures are rounded; the base year is 2009. Source: Frost and SullivanNote: All figures are rounded; the base year is 2009. Source: Frost and Sullivan
15
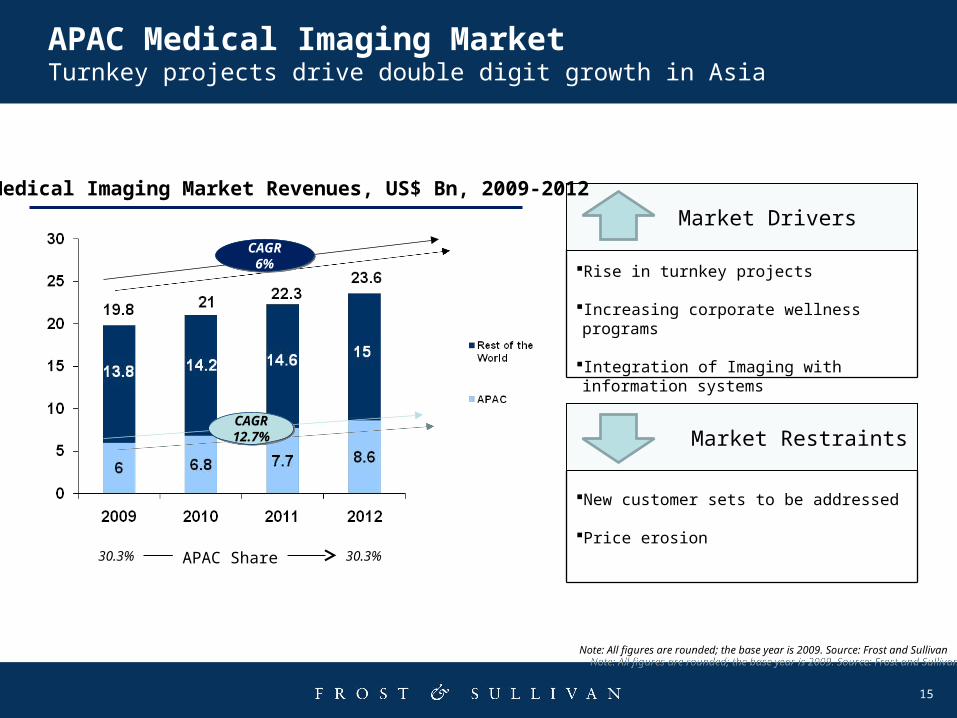
APAC Medical Imaging MarketTurnkey projects drive double digit growth in Asia
Market Drivers
Market Restraints
Rise in turnkey projects
Increasing corporate wellness programs
Integration of Imaging with information systems
New customer sets to be addressed
Price erosion
CAGR6%
CAGR6%
CAGR12.7%CAGR12.7%
Medical Imaging Market Revenues, US$ Bn, 2009-2012
Note: All figures are rounded; the base year is 2009. Source: Frost and SullivanNote: All figures are rounded; the base year is 2009. Source: Frost and Sullivan
APAC Share30.3% 30.3%

16
Medical Imaging Revenues, US$ Bn, 2009-2012
Increase in patient demand
Increase in the number of Medicare funded diagnostic imaging services
Increasing competition in the diagnostic imaging services sector
Government initiatives such as BreastScreen
Market Drivers
Market saturation due to high penetration of medical imaging modalities
Increasing pricing pressure
Market Restraints
Australian Medical Imaging MarketDigital imaging to drive growth
Note: All figures are rounded; the base year is 2009. Source: Frost and SullivanNote: All figures are rounded; the base year is 2009. Source: Frost and Sullivan

17
PACSPACS
Australian PACS market in 2010: ~US$ 49 million; CAGR: 9.0%
Focus by healthcare providers to integrate imaging with IT and integrate PACS with
the hospital information system to improve efficiency and quality of healthcare
Increasing demand for cardiology PACS and orthopedics PACS solutions outside the
radiology department
Top Growth Opportunities
CR/DR CR/DR
Australian CR/DR market in 2010: ~US$ 66 million ; CAGR: 10.0%
Teleradiology - Shortages of radiologists require better information sharing and the
need to share and transfer reports and images
Increase in the number of diagnostic imaging procedures. Around 15 million diagnostic
imaging procedures performed in Australia. Around 3 million procedures performed in
the public hospitals.
Note: All figures are rounded; the base year is 2009. Source: Frost and SullivanNote: All figures are rounded; the base year is 2009. Source: Frost and Sullivan

18
Top Growth Opportunities
Note: All figures are rounded; the base year is 2009. Source: Frost and SullivanNote: All figures are rounded; the base year is 2009. Source: Frost and Sullivan
SMBGSMBG
Australian self monitoring of blood glucose (SMBG) devices market in 2010: ~US$ 150
million; CAGR: 6.0
Increasing public awareness about diabetes and the need for glucose monitoring
Strong government support in form of initiatives such as National Diabetes Services
Scheme
The total number of diabetic patients registered with NDSS has increased to 897, 867
at a CAGR of 9.8% in the period 2002-2008
Minimally Invasive Surgery
Minimally Invasive Surgery
Increase in day surgery procedures - In 2009, around 57% of total patient separations
in hospitals were same day separations.
Number of day procedures in 2009: ~4.8 million; CAGR: 4.5%
Gastrointestinal endoscopy (around 0.64 million), Arthroscopy (0.14 million) are among
the top 5 high volume procedures in Australia
Technological advancement, benefits to hospitals (economic savings) and patient
benefits (shorter stay in hospital, reduction in risk of acquiring hospital infections)

19
Interoperability
Integration
Lack of skilled resources
*Life Sciences & Healthcare IT includes: Software, Hardware, IT services
Asia Pacific Lifesciences and Health IT MarketInteroperability challenges hinder adoption
14.5%14.5%
15.7%15.7%
Market Drivers
Market Restraints
Operational efficiency Strong and sustained demand for healthcare services
Consumer demand for quality and access to information
Lifesciences & Healthcare IT, US$ Bn, 2009-2012
CAGR7%
CAGR7%
CAGR11.3%CAGR11.3%
APAC Share
50.654.6
58.4 62.5
Note: All figures are rounded; the base year is 2009. Source: Frost and SullivanNote: All figures are rounded; the base year is 2009. Source: Frost and Sullivan
20
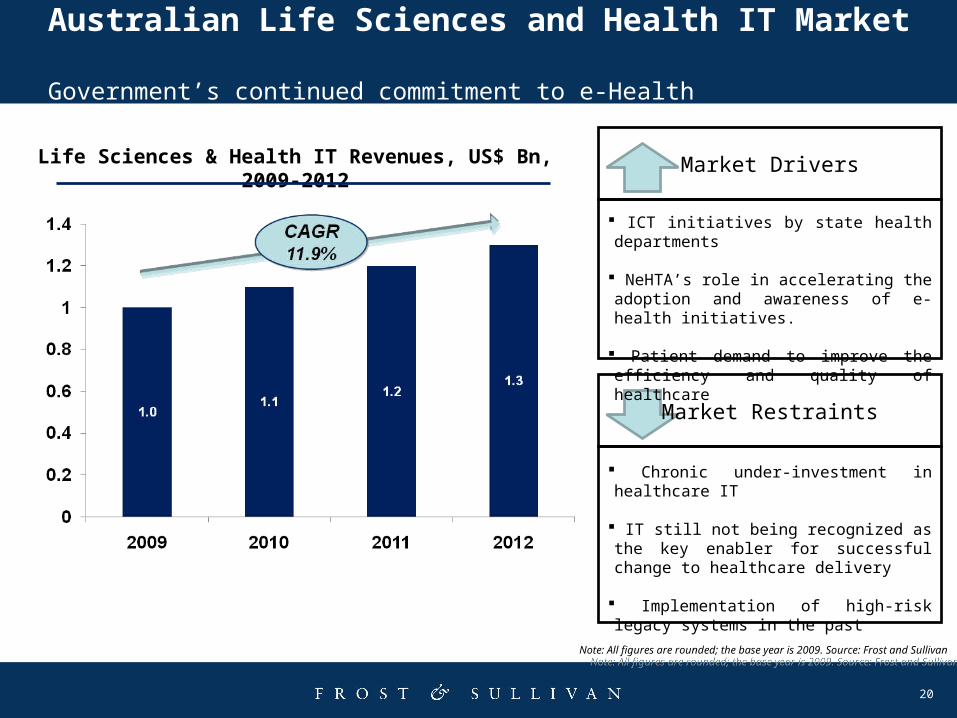
Australian Life Sciences and Health IT Market Government’s continued commitment to e-Health
Life Sciences & Health IT Revenues, US$ Bn, 2009-2012
ICT initiatives by state health departments
NeHTA’s role in accelerating the adoption and awareness of e-health initiatives.
Patient demand to improve the efficiency and quality of healthcare
Market Drivers
Chronic under-investment in healthcare IT
IT still not being recognized as the key enabler for successful change to healthcare delivery
Implementation of high-risk legacy systems in the past
Market Restraints
Note: All figures are rounded; the base year is 2009. Source: Frost and SullivanNote: All figures are rounded; the base year is 2009. Source: Frost and Sullivan

21
0
0
0
Clinical IT SystemsClinical IT Systems
Spending on departmental systems (radiology, cardiology, pharmacy, acute care, etc,) 2010: ~US$ 160 mn; CAGR: 15.3%
Modernization of the healthcare system, implementation of more accurate and reliable systems and shift from lengthy to short and more clinically intense hospital stays is driving investment in departmental systems.
Spending on infrastructure, interoperability and EHR solutions: ~US$ 45mn; CAGR: ~17.3%
State eHealth programs such as Healthelink (NSW Health) and government’s commitment to development of the right technology necessary to deliver the best e-health system is accelerating the growth in this segment.
Top Opportunities – Australian Life Sciences and Health IT Market
Solutions for Patient and Revenue Cycle
Management
Solutions for Patient and Revenue Cycle
Management
Spending on patient and revenue cycle management solutions 2010: ~US$ 104 mn; CAGR: 6.1%
The steps taken by healthcare facilities to improve the quality and outcome of healthcare, reduce the administrative burden, and adopt a more standardized approach towards application of information systems is the key driver for this market segment.
Patient administration solutions being adopted in public hospitals in South Australia (careconnect.sa), Western Australia (eHealthWA) and Victoria (HealthSMART).
Note: All figures are rounded; the base year is 2009. Source: Frost and SullivanNote: All figures are rounded; the base year is 2009. Source: Frost and Sullivan

22
1. Overview of Healthcare Market : Key Takeaways
2. In-depth Sectoral Analysis, APAC and Australia
3. Summary: Best Opportunity Analysis, Australia
Agenda

23
Time
Gro
wth Home-based
care
Personalized medicine
POCT/Self Monitoring
Clinical IT
Endoscopy
Administrative IT
EMR/EHR
INNOVATIONTRIGGER
SUPERGROWTH
NORMALISATION LEADERSHIP
Source: Frost & Sullivan.
Where to place your bets in 2010- 2012 : Australia
Biologics
Joint replacement
Oncology, Diabetes
Cardiovascular

Thank You