asi junel2019-12eands.dacnet.nic.in/pdf/june2019.pdf · sowing and harvesting operations normally...
TRANSCRIPT


VOL. LXXVI June, 2019 No. 3
Contents
Farm seCtor news
General survey oF aGriCulture
artiCles Agrarian Change: Income and Productivity Differential of Various Crops in India-Dr. Tarujyoti BuragohainPerformance of Onion in Rajasthan-An Economic Analysis- Shirish Sharma and Naveen P. Singh
aGro-eConomiC researChDecision-oriented Information System for Farmers: A Study of Kisan Call Centres, Kisan Knowledge Management System, Farmers Portal and M-Kisan Portal in Punjab -D K Grover, Arjinder Kaur, Sanjay Kumar and J M Singh-Agro-Economic Research Centre, Punjab Agricultural University, Ludhiana.Impact of Neem Coated Urea on Production, Productivity and Soil Health in India-K.B. Ramappa and A.V. Manjunatha-Agricultural Development and Rural Transformation Centre, Institute for Social and Economic Change, Bengaluru.
Commodity reviews Foodgrains Commercial Crops
statistiCal tables Wages
1. Daily Agricultural Wages in Some States— Category-wise. 1.1. Daily Agricultural Wages in Some States—Operation-wise.
Prices2. Wholesale Prices of Certain Important Agricultural Commodities and Animal Husbandry Products at Selected Centres in India.3. Wholesale Prices of Some Important Agricultural Commodities in International Market during the year, 2019
Crop produCtionSowing and Harvesting Operations Normally in Progress during July, 2019.
Pages
1
7
8
23
35
40
4446
48
48
51
54
56
AGRICULTURALSITUATION IN INDIA
Editorial Board
ChairmanDr. K. L. Prasad
EditorP. C. Bodh
Asstt. Economic AdviserSwati Singla
Economic OfficerDr. Prosenjit Das
Officials Associated in Preparation of the Publication
D. K. Gaur — Sub-Editor S. K. Kaushal — Tech. Asstt. (Printing)
Uma Rani — Tech. Asstt. (Printing)Sanjay Raj- Tech. Asstt.(Economics)Anupama -Junior Statistical Officer
Sachin Mittal -Tech. Asstt.Shripal Singh— MTS
Cover Design By:Yogeshwari Tailor— Asstt. Graph
Publication Division
Directorate of Economicsand Statistics
Department of Agriculture, Cooperation & Farmers Welfare
Ministry of Agriculture & Farmers WelfareGovernment of India
C-1, Hutments, Dara Shukoh Road,New Delhi-110 011Phone : 23012669
(Email: [email protected])
Subscription Inland Foreign Single Copy : `40.00 £ 2.9 or $ 4.5 Annual : `400.00 £ 29 or $ 45
Available fromThe Controller of Publications,
Ministry of Urban Development,Deptt. of Publications,
Publications Complex (Behind Old Secretariat),Civil Lines, Delhi-110 054.
Phone : 23813761, 23813762, 23813764, 23813765(Email: [email protected])
©Articles Published in the Journal cannot be reproduced in any form without the permission of Economic and Statistical Adviser.For submission see last page.

From Editor’s Desk
P. C. Bodh
This issue of ‘Agricultural Situation in India’ offers our readers an overview of the current policy and schemes of the Government in the farm sector, the latest agricultural outlook, two academic research articles, one on income and productivity differential of rabi and kharif crops and other on performance of onion in Rajasthan and two agro-economic research studies, one on Kisan Call Centres, Kisan Knowledge Management System, etc.; and second on impact of Neem Coated Urea on production, productivity and soil health. Important in the farm sector news are a field visitreport on the village Satna Hatna, Rajnagar block, District Chhatarpur, Madhya pradesh.; the approval of a new landmark pension scheme of the Central Government that aimstobenefitfivecroresmallandmarginalfarmersacrossthe nation; the extension of PM-KISAN Yojana in order to increase its coverage among farmers; the Union Cabinet’s clearance of a new initiative to control foot and mouth disease and Brucellosis to help the livestock rearing farmers; and the release of Second Advanced Estimate (2018-19) of area and production of various horticulture crops.
So far as the agricultural scenario is concerned, the Wholesale Price Index (WPI) of foodgrains, pulses, cereals, wheat, paddy and oilseeds increased by 9.33 percent, 14.32 percent, 8.43 percent, 7.52 percent and 2.48 percent, 6.79 percent, respectively, in April, 2019 as compared to that in April, 2018. The cumulative pre-monsoon season rainfall in the country has been 24 percent lower than the long period average during 1st March to 29th May, 2019. Current live storage in 91 major water reservoirs in the country was 31.65 BCM as against 30.74 BCM of normal storage based on the average storage of last 10 years.
In articles column, we are sharing two interesting research papers on the topics pertaining to the income and productivity differential of different crops; and performance ofonioninRajasthan.Thefirstarticleaimsatexaminingtheagricultural sector growth and the differences in yield of and income from rabi vis-á-vis kharif crops. For this purpose, data is collected from various published sources of the Ministry of Agriculture and Farmers Welfare for the period of 1970-71 to 2016-17 and NSSO’s 70th Round survey of agricultural households during January, 2013 to December, 2013. The findings reveal that the contribution of rabi foodgraincrops is more than the kharif foodgrain crops to the total foodgrain production despite lower land cultivated under rabi crops than the kharif crops. The return on investment for agricultural inputs in kharif crops is much lower than that of the rabi crops. Moreover, on an average, the productivity of rabi crops is higher than that of the kharif crops during the study period. In policy front, the study suggests the government to provide more emphasis on rabi crops in order to achieve the goal of doubling farmers’ income; to increase Minimum Support Price substantially to help farmers to get better return; to focus on horticulture products like fruits and vegetables; to set up more Krishivigyan Kendra to increase the
access to technical advice for crops, etc. In the second article, the authors study the performance of onion in Rajasthan by analysing the cost, returns and yield gap of onion cultivation; and examining the inter-temporal behaviour of onion prices. Based on the primary as well as secondary data, the study witness marginal role of government in the study area and most of the respondent farmers are found dissatisfiedwiththe local market performance in terms of stable pricing. Shortage in storage facility is noticed as a key constraint faced by the respondents. Costs of curing and storage are found to be the major source of cost incurred by the farmers. Onion price indicates volatile behaviour, especially in the month of September. The policy implications of the study suggest creation of proper storage facilities at major production centres; phase-wise purchase of onion by the state and central cooperative agricultural agencies; development of sufficientpost-harvest infrastructure facilities for onion to protect farmers from unwarranted low prices; vigorous pursuance of technological innovation of harvesting and setting up of cold storage units on cooperative or PPP mode to contain seasonal pricefluctuation,etc.
In agro-economic research section, two reports shared in this issue on various ongoing decision-oriented information system for farmers such as Kisan Call Centre (KCC), Kisan Knowledge management System (KKMS), Farmers Portal and M-Kisan Portal in Punjab and impact of Neem Coated Urea (NCU) on production, productivity and soil health in India prepared by AERC, Punjab Agricultural University, Ludhiana and ADRTC, ISEC, Bangaluru, respectively. The major objectivesofthefirstreportaretoidentifytheorganizedsetup,infrastructure, etc., of the aforementioned information systems; to record the use of the systems; to analyse the performance ofthesystems,etc.Inordertofulfiltheseobjectives,thestudycollects primary data through both census and sample survey methods.Onthebasisofmajorfindings,thestudyproposesto strengthen and continue the KCC; to spread awareness about KCC facility through mediums like radio, television, newspapers, etc.; to increase training facilities for Farmers Tele Advisors (FTA) to equip them about all aspects of agriculture; etc. The primary objectives of the second report are to study the trends in usage and pricing of urea and NCU; to analyse the adoption behaviour of NCU among farmers under irrigated and rain-fed conditions; to analyse the impact of the useofNCUonyield and income; andfinally, todocumentthe status and implementation of the Soil Health Card (SHC) scheme. In view of this, both primary and secondary data is collected from six states, viz. Karnataka, Maharashtra,Madhya Pradesh, Bihar, Punjab and Assam for kharif 2015. Thepolicyimplicationsofthestudyrecommendtoorganizespecial training programmes/ camps/ demonstrations to educatethefarmersregardingsoilsampling,benefitsofsoiltesting,balanceduseofsoilfertilizers;todistributethehardcopies of SHCs among farmers on time, etc.
Farm Sector NewS
June, 2019 │ Agricultural Situation in India │ 1
Farm Sector NewsA Tale of Farmers’ Distress
*The opinion expressed in this writing is the author’s personal views, and not that of the organization in which he is working.Source: www.pib.nic.in
Ministry of Agriculture and Farmers Welfare has a vibrant field economic information and statistical data collection system for providing inputs for development policy making. This is supported by a grass-root level network of 31 agro-economic research centres and cost of cultivation centres set-up in different state and central agricultural universities, general universities and institutes of repute and State Agricultural Statistics Authorities. During the Governing Body Meetings of different Agro-Economic Research and Cost of Cultivation Centres, field visits are undertaken as an important part of the official need to understand the agriculture related issues.
Meeting a Tragedy Struck Family
In my recent visit, I met the family of a farmer who had committed suicide. I knew nothing of the family except that its head had died by suicide while struggling to eke out a living from farming in a plateau district of Madhya Pradesh in India. The family had been identified and contacted by the officials of the field study wing of Ministry of Agriculture & Farmers’ Welfare. The field input study branches of the Ministry are mandated to collecting, compilation and analysis of farming data to calculate costs of cultivation and income; and to carry out agricultural economics studies to diagnose regional and national agricultural problems and recommend solutions. These inputs go into making agricultural development policy making on numerous agricultural development schemes, and increasing income, area, yield and production, and fixing minimum support price. It was an Ahirwar joint family of village Satna Hatna, Rajnagar block, District Chhatarpur, M.P. The widow Mrs. Nanni Bai of the deceased farmer, late Shri Hardeena Ahirwar, and her three sons were waiting for me. The families of the two married sons and an unmarried son were living in the undivided family with the widowed mother. As the humble souls sat comfortably, squatting in the verandah
of the house facing Kisan Mitra who had arranged this meeting, I greeted the woman, and offered her some fruits I had taken with me like a social visitor. I was rather uncomfortable with the idea of troubling the family with an unwanted official presence at her home. She humbly received it, and showed her willingness to talk to me as her two sons sat by her side. As I proceeded on with my conversation with them, she told in a rather unaffected voice that it was in 2012 when her husband died by suicide seven years ago, when two of her sons were away to Delhi working on construction sites, and she was alone with her youngest son. Neither she nor her sons talked of the distress they had undergone. Rather the tragedy of the death of the head of the family, who from all accounts appeared to have been an impressive man supporting a proud turban and gray wiry moustaches, seemed to have left no sign of tragic memory of their plight at that time. At such moment one might even wonder whether it was difficult economic conditions that led to this tragedy or there was no clear relation to agrarian distress. In their humility and simplicity of a typical Indian villager, neither the mother, nor the sons, grabbed on the issue of their economic plight that had led to the tragedy.
Social Conditions
Wondering how to bring out the socio-economic conditions that might have led to the tragedy, I followed an incisive conversation that might reveal subtle indicators rather than hard data. I began with posing questions about the children’s education and marriage. The mother told that they had got married all three daughters by 2012, gave them some education. The elder son had schooling up to eighth standard, while the middle one had completed his matriculation and the youngest too had some education. Needless to say, the family must have observed religious and social rituals concerning upbringing of the children and children’s children. It was around this time that the two sons had to work at construction sites in Delhi. This indicates the social conditions in which the family was struggling.
Field Visit Report: By P.C. Bodh, Adviser, DAC&FW

Farm Sector NewS
2 │ Agricultural Situation in India │ June, 2019
Farming Condition & Indebtedness
Then I came to their farming conditions. The family owns eight acres of land with no irrigation facility of its own. A probe into details during the conversation reveals that the deceased before his death must have put a brave and relentless fight against the adversity of his farming which depended on rains for irrigation. He had made three attempts to set up a bore well for irrigating his land. Each time he borrowed money from one source or the other. Even at that time each bore well might have cost close to one lakh rupee, depending on the depth of the bore well, which goes upto 140 feet. Added to this were other expenditures, as maintaining soil in good health and land development activities. Then to ascertain the nature of indebtedness, I put further questions. The woman remembered her husband resorting to the Cooperative Society for agricultural loans, then to the bank and finally falling into the net of money-lenders. At the time of death her husband owed fifty to sixty thousand rupees each to the Cooperative Society and the banks; and about one lakh to the village money-lender. Whereas in the case of the earlier two, not only interest was nominal but also there was no atrocious pressure-building; the later was charging not only interest rate as high as 36%, but also resort to all atrocious tactics to seize the farmer’s land.
Rain-fed Irrigation
After having gauged the socio-economic conditions of the farmer that clearly might have pushed him to the unfortunate end, I posed an array of questions to them regarding the problems that a small farmer typically faced in the rain-fed central plateau districts of Madhya Pradesh. The two sons and the mother explained how in their part of the world farming depended on the twin-phenomena of ground water level and rains. It goes without saying that the rain-fed area farming in reality most of the time meant farming on the strength of open-wells and bore wells, which see the farmers through the dry seasons of drought-hit years. The problem of this family lay in the fact that after having failed to get water at the deepest table in their land, now they are dependent on water bought from other farmers’ bore well charged in kind, i.e., one third of the produce would go to the water provider. Even this seemingly high rate is acceptable because water is so precious and the option
of leaving land fallow is dreadful. This irrigation economics has compelled the family to keep half of its eight acre land fallow this year. What they grow just meet the consumption needs of the family in drought-hit years and turn out good production during normal rains years. The only solution to this problem lies in providing irrigation through canal with the objective of direct irrigation as well as recharging the ground water to maintain the water table.
Suicidal Bore well Irrigation Economics
The suicidal attempt to dig bore wells upto 140 feet depth for irrigation is most common cause of economic devastation of farm economies of the distressed families in this state or other plateau region states. The cause of this is the desperation of a farmer to see his land irrigated and his stark ignorance of the economics of well irrigation in the plateau region geo-climatic conditions. My irrigation economics insights from the literature available and the visits to the plateau regions farmers tell that sustainable well-irrigation beyond 40-50 feet of depth consisting of soft soil is suicidal because thereafter begins hard-rock bed yielding less and less water, adding more and more to cost and making it more and more susceptible to drying up. This is overlooked not only because of the farmers’ desperate optimism but also due to the absence of right advisories in general and at the critical times on one hand and connivance of the vested interest groups of investors and money-lenders and functionaries of regulatory agencies engaged in fishing in the troubled waters. An aggressive campaign against the suicidal economic futility of attempting to get water beyond 50 feet of depth for geographical reasons of scarcity of water below this depth and proneness to drought needs to be begun. The only long-term solution is getting surface water supply. There is a long pending demand of the villagers for a canal irrigation project with a length of 40-45 km to take water from Wan Sujara Dam at river Dhasan to provide water for this area. This project will provide not only for surface irrigation of the fields directly, but also help in drought-proofing of the region by recharging ground water for bore wells and open wells.
New Farming Realities
The family felt its dependence on mechanized farming has increased after its head’s death. Till this time the family had cows and a pair of oxen; after his death it had to sell the oxen since nobody in the

Farm Sector NewS
June, 2019 │ Agricultural Situation in India │ 3
family knew how to plow; and later they had to sell the cows also due to the problem of their care. Now its farming is dependent on hired tractors for plowing and farm-manures in place of cow-dung. Tractor services at various stages of sowing and thrashing cost farming considerably, though the manpower inputs is reduced as compared to the use of draft animals in farm operations. While sharing their farming problems the members of the family and other farmers talked of the issue of non-availability of fertilizers, insecticides and pesticides in the regulated market and high prices of the same in the open market; and the black-marketing by the businessmen in connivance with the functionaries of the fair price shops selling these inputs. Same is true of availability, prices, quality and quantity of insecticides and pesticides. And as if all this is not enough, wild animals frequently destroy the crops. The crop complex of the region is typical of rain-fed plateau regions. It undergoes quick year-to-year change in response to the market opportunities and irrigations prospects in view of the emerging monsoon mood and ground-water availability. Attractive market scenarios provided by announcement of high MSP and trade opportunities incentivize the farmers to go for higher allocation of land and farm-input allocation. The major kharif crops include urad and sesamum; while rabi crops include wheat. This family grows wheat on four acre and leaves the rest of four acre as fallow. The irrigation water is obtained from another farmer on crop sharing at the rate of 1/3, which suggests that this mode of sourcing irrigation water should be facilitated by a mechanism of payment of charges by the State Government. The wheat grown is that of a less water consuming variety known as WHI47, which is known for its high chapatti making quality. The general estimated crop production in a normal season comes to 13-14 quintal of urad, 60 kg of sesamum. The usual price that the farmers get is Rs.1500-1600 for wheat and Rs.35-40 per kg. for urad in a normal price year.
Welfare and the Reach of Development Schemes
The family at the time of death of its man was housed in a thatched mud house, but now lives in a pucca house of three rooms with toilet and bathroom. The new house came up with an aid under Pradhan Mantri Awas Yojana of around one lakh and with some additional investment by the family. It also
enjoys countable financial assistance for farming under the loan facility through Kisan Credit Card, and also holds the details of coverage under PMFBY, under which the family enjoyed a insurance coverage of Rs. 5000/- for the drought it suffer in the year 2015. The insurance coverage, though received late, family tells, was received without any special effort, and was operated by HDFC in this area.
Regulation for Effective Implementation of Scheme
Among the problems discussed by the family and other farmers are the malpractices taking place openly in connivance of the traders and functionaries of the local co-operative market. On the one hand, hurdles in registrations of the farmers for sale of their produce are created by the mandi officials, on the other, the traders, in alliance with farmers with large unsown fields, engage in proxy sale of produce bought from smaller farmers unable to get registered and get into further exploitative practices to swindle the money available under Bhavantar Scheme. Also reported is similar connivance between the co-operative agencies selling fertilizers, especially urea, and the private sales outlets engaging in black marketing of urea, which most of the time the farmers find missing from the fair price outlets and being sold at exorbitant prices. There is a feeling among experts, officials and beneficiaries that the rampant malpractices that go in mandis can be checked only by a strict vigilance mechanism like that of Election Commission followed during elections.
Sample Farmers’ Cluster
Before meeting the family of the farmer who had committed suicide, I had an insightful meeting at Gulganj, Chhattarpur village, with 10 sample farmers who form the cluster from which cost of cultivation for 26 crops is being collected on daily basis following double-entry book keeping system. These farmers and the field-man and assistants as a part of regular data collection and generation system had interesting issues and solutions regarding farming in this area. Their suggestions and solutions have been reflected in various earlier sections of the report.
Conclusion
The field visit and the meeting with the farmer’s family underline the issue of rising proneness of small and marginal farmers to high costs farming mainly due to (i) unviable bore well irrigation economics in

Farm Sector NewS
4 │ Agricultural Situation in India │ June, 2019
low groundwater level scenario; (ii) increasing cost of farm inputs due to scarcity of inputs; (iii) failure of vigilance in effective implementation of schemes; and finally, (iv) socio-economic factors adding to the unviability of farming. The improvement in the family’s conditions in the post-suicide period took place because of housing welfare scheme and Kisan Credit Card facility for enabling farmers to carry on their farm business. From this case study, it is concluded on the policy suggestions: (a) charges for water shared by a neighborhood farmer with bore well should be borne by Government under a suitable scheme; (b) improving irrigation by drought-proofing the area and providing canal irrigation for the region with water from Wan Sujara Dam at Dhasan river; (c) enabling the family manage its affairs with full command of rural development activities through more inclusive Kisan Credit Card facilities; (d) providing farmers with more direct benefit transfer based welfare schemes like housing; and, (e) finally, setting up vigorous vigilance system to prevent malpractices in agricultural-inputs business and industry and agricultural mandis.
Pension scheme to secure lives of 5 crore farmers in three years
The Union Cabinet, chaired by the Hon’ble Prime Minister Shri Narendra Modi, on 31st May, 2019, approved a new Central Sector Scheme, a historic decision that will empower farmers across India. This is a path breaking scheme that will provide pension cover to our industrious farmers who toil day and night to keep our nation fed. It is also for the first time since independence that such pension coverage has been envisioned for farmers. It is estimated that 5 crore small and marginal farmers will benefit in the first three years itself. The Central Government would spend Rs. 10774.50 crore for a period of 3 years towards its contribution (matching share) for providing social security cover as envisaged under the scheme.
The salient features of this scheme are
It is a voluntary and contributory pension scheme for all Small and Marginal Farmers (SMF) across the country.
Entry age of 18 to 40 years with a provision of minimum fixed pension of Rs.3,000/- on attaining the age of 60 years. For example, a beneficiary farmer is required to contribute Rs 100/ - per month at median entry age of 29 years. The Central Government shall also contribute to the Pension Fund an equal amount as contributed by the eligible farmer. After the subscriber’s death while receiving pension, the spouse of the SMF beneficiary shall be entitled to receive 50% of the pension received by the beneficiary as family pension, provided he/she is not already an SMF beneficiary of the Scheme. If the death of the subscriber happens during the period of contribution, the spouse shall have the option of continuing the Scheme by paying regular contribution.
Synergy between schemes, prosperity for farmers
An interesting feature of the Scheme is that the farmers can opt to allow his/her monthly contribution to the Scheme to be made from the benefits drawn from the Pradhan Mantri KisanSAmman Nidhi (PM-KISAN) Scheme directly. Alternatively, a farmer can pay his monthly contribution by registering through Common Service Centres (CSCs) under Ministry of Electronics and Information Technology.
PM-KISAN Scheme extension to include all eligible farmer families irrespective of the size of land holdings
The Union Cabinet, chaired by the Hon’ble Prime Minister Shri Narendra Modi, on 31st May, 2019, approved that the ambit of the Pradhan Mantri Kisan Samman Nidhi (PM-KISAN) would be comprehensively extended. With this decision, all land holding eligible farmer families (subject to the prevalent exclusion criteria) would avail of the benefits under this scheme.
More beneficiaries, greater progress:
The revised Scheme is expected to cover around 2 crore more farmers, increasing the coverage of PM-KISAN to around 14.5 crore beneficiaries, with an estimated expenditure by Central Government of Rs. 87,217.50 crores for year 2019-20.

Farm Sector NewS
June, 2019 │ Agricultural Situation in India │ 5
Speed, scale and a major promise delivered:
This Cabinet decision pertaining to expanding the ambit of PM-KISAN marks the fulfilment of a major promise made by the Prime Minister to the people of India in the run-up to the 2019 Parliamentary elections. It may also be noted that certain operational issues like lack of updated land records in Jharkhand and lack of Aadhaar penetration in states of Assam, Meghalaya and Jammu & Kashmir have also been resolved.
PM-KISAN: A path-breaking support incentive for farmers
The genesis of the PM-KISAN Yojana dates back to the interim Budget for the year 2019-2020.
The key element of PM-KISAN is income support of Rs. 6000/- to the small and marginal landholder farmer families with cultivable land holding upto 2 hectare across the country. The amount is being released in three 4-monthly instalments of Rs.2000/- each over the year, to be credited into the bank accounts of the beneficiaries held in destination banks through Direct Benefit Transfer mode. The scheme was launched in a record time of 3 weeks, on 24th February, 2019, at a huge programme in Gorakhpur, Uttar Pradesh where the first rounds of instalments was paid to several farmers.
So far, 1st instalment to 3.11 crore beneficiaries and 2nd instalment to 2.66 crore beneficiaries have been credited directly to the bank accounts of the farmer families.
Serving India’s Annadatas with renewed vigour
Time and again, Prime Minister Shri Narendra Modi spoke with great reverence for India’s farmers. He has described India’s farmers as our Annadatas who undertake great efforts to feed 1.3 billion Indians. Between 2014 and 2019, numerous measures were taken to empower the hardworking farmer. This includes increase in the Minimum Support Prices (MSP) for 22 crops, Soil Health Cards, PM Krishi Sinchai Yojana, PM Kisan Sampada Yojana, e-NAM
for better markets and more. These steps have made agriculture more prosperous and ensured greater productivity for farmers. They will go a long way in fulfilling the Prime Minister’s dream of doubling farmer incomes by 2022, when India marks 75 years of freedom.
The Union Cabinet cleared new initiative to control Foot and Mouth Disease (FMD) and Brucellosis to support the livestock rearing farmers
During the Union Cabinet Meeting, chaired by the Hon’ble Prime Minister Shri Narendra Modi , on 31st
May, 2019, the first since the outcome of the 2019 Lok Sabha election, a novel initiative was cleared that will benefit crores of farmers and improve the health of animals. This initiative pertains to controlling Foot and Mouth Disease (FMD) and Brucellosis to support the livestock rearing farmers. The Cabinet had cleared a total outlay of Rs. 13,343 crores to fully control these diseases amongst the livestock in the country in the next five years and subsequently eradicate these diseases. This decision indicates the spirit of compassion towards those animals who are a valued part of our planet but are not able to speak.
The threat of Foot and Mouth Disease (FMD) and Brucellosis
These diseases are very common amongst the livestock – cow-bulls, buffaloes, sheep, goats, pigs, etc. If a cow/buffalo gets infected with FMD, the milk loss is upto 100% which could last for four to six months. Further, in case of Brucellosis the milk output reduces by 30%, during the entire life cycle of animal. Brucellosis also causes infertility amongst the animals. The infection of brucellosis can also be transmitted to the farm workers and livestock owners. Both the diseases have a direct negative impact on the trade of milk and other livestock products. This decision of the Cabinet fulfils the major promise made in the manifesto as it provides much relief to crores of farmers in the country who rear livestock.
Care and compassion for animals
In case of FMD, the scheme envisages vaccination

Farm Sector NewS
6 │ Agricultural Situation in India │ June, 2019
coverage to 30 crore bovines (cows-bulls and buffaloes) and 20 crore sheep/goat and 1 crore pigs at six months’ interval along with primary vaccination in bovine calves, while the Brucellosis control programme shall extend to cover 100% vaccination coverage of 3.6 crore female calves. The programme so far has been implemented on cost sharing basis between the Central and State Governments. In a rare instance of departure, the Central Government has decided to now bear the entire cost of the programme to ensure complete eradication of these diseases and better livelihood opportunities for all the livestock rearing farmers in
the country.
Department of Agriculture, Cooperation and Farmers Welfare Released the Second Advanced Estimate (2018-19) of Area and Production of various Horticulture Crops
Department of Agriculture, Cooperation and Farmers Welfare released the Second Advanced Estimate (2018-19) of Area and Production of various Horticulture Crops, as compiled from information received from different State/UTs and source agencies. This may be seen as under:
TABLE 1: ToTal HorTiculTure wiTH respecT To area and producTion
Total Horticulture 2017-18 2018-19(Second Advanced Estimate)
Area (Million Ha) 25.43 25.61 (0.1)Production (Million Tonnes) 311.71 314.87 (1.01)Note: Figures in parentheses indicate percentage change.
TABLE 2: crop-wise HorTiculTure producTion
Horticulture Crops 2017-18(Final)
2018-19(Second Advanced Estimate)
Fruits 97.36 97.38 (0.02)Vegetables 184.39 187.36 (1.61)Onion 23.26 23.28 (0.08)Potato 51.31 52.96 (3.2)Tomato 19.78 19.66 (-0.6)Spices 8.12 8.61 (6.03)Note: Figures in parentheses indicate percentage change.

General Survey of aGriculture
June, 2019 │ Agricultural Situation in India │ 7
Trends in foodgrain prices
Based on Wholesale Price Index (WPI) (2011-12=100), WPI for foodgrains increased by 9.33 percent in April, 2019, over April, 2018. Among foodgrains, WPI of pulses, cereals and oilseeds increased by 14.32 percent, 8.43 percent, and 6.79 percent, respectively, in April, 2019, over April, 2018.
Among cereals, WPI of wheat and paddy increased by 7.52 percent and 2.48 percent, respectively, in April, 2019, over April, 2018.
Similarly, WPI in case of foodgrains increased by 0.07 percent in April, 2019, over March, 2019.
Among foodgrains, WPI of pulses and oilseeds increased by 2.07 percent and 1.58 percent, respectively, in April, 2019, over March, 2019. However, WPI of cereals decreased by 0.32 percent in April, 2019, over March, 2019.
Among cereals, WPI of paddy increased by 0.32 percent and WPI of Wheat decreased by 2.57 percent in April, 2019, over March, 2019.
General Survey of AgricultureRainfall Situation Cumulative Pre-Monsoon Season rainfall for the country as a whole during the period 01st March to 29th May, 2019 has been 24% lower than the Long Period Average (LPA). Rainfall in the four broad geographical divisions of the country during the above period has been lower than LPA by 48% in South Peninsula, by 29% in North-West India, by 17% in Central India and by 12% in East & North East India.
For the period of 01.03.2019 to 29.05.2019, out of total 36 meteorological Sub-divisions, 04 subdivisions received large excess/excess rainfall, 8 subdivisions received normal rainfall and 24 Sub-divisions received deficient/large deficient.
Water Storage in Major Reservoirs
Central Water Commission monitors 91 major reservoirs in the country which have total live capacity of 161.99 Billion Cubic Metre (BCM) at Full Reservoir Level (FRL). Current live storage in these reservoirs (as on 30th May, 2019) was 31.65 BCM as against 27.78 BCM on 30.05.2018 (last year) and 30.74 BCM of normal storage (average storage of last 10 years). Current year’s storage is 114% of last year’s storage and 103% of the normal storage.
8 │ Agricultural Situation in India │ June, 2019
Articles
Articles
agrarian cHange: income and producTiviTy differenTial of various crops in india
dr. TarujyoTi BuragoHain*
*Associate Fellow at National Council of Applied Economic research (NCAER), 11 Indraprastha Estate,ParisilaBhawan, New Delhi-110002, India and Email: [email protected] expressed in the paper are researcher’s own and not necessarily those of NCAER”.
Abstract
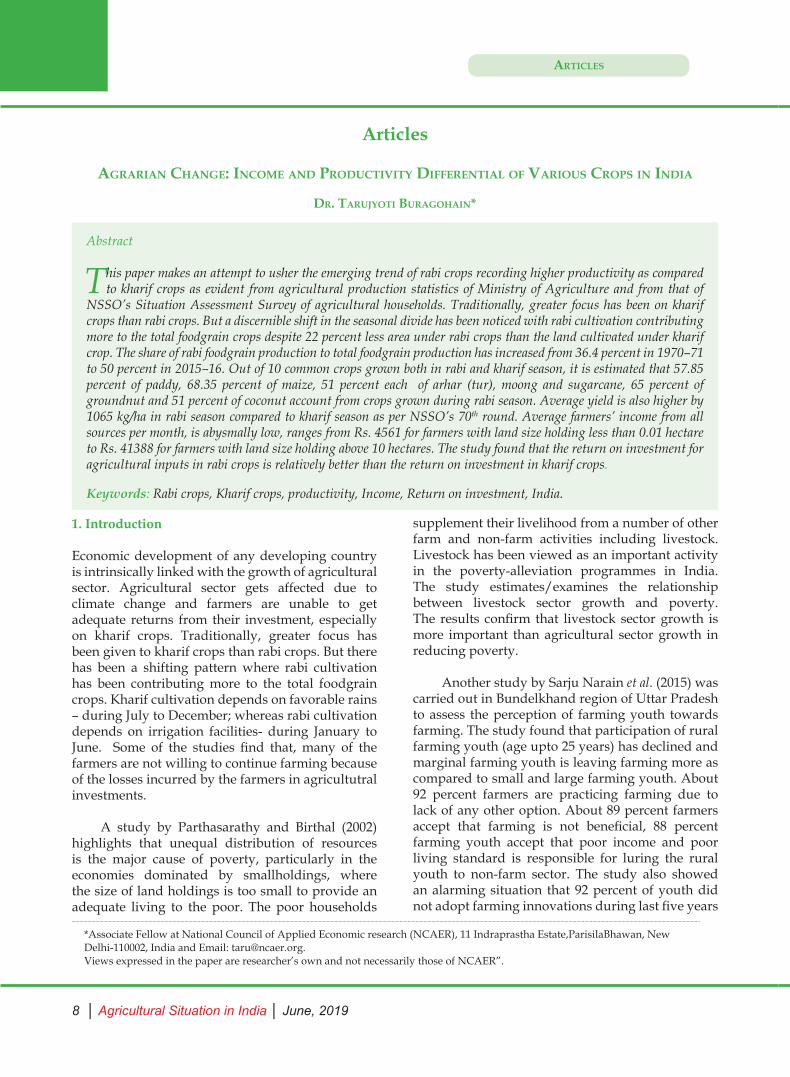
This paper makes an attempt to usher the emerging trend of rabi crops recording higher productivity as compared to kharif crops as evident from agricultural production statistics of Ministry of Agriculture and from that of
NSSO’s Situation Assessment Survey of agricultural households. Traditionally, greater focus has been on kharif crops than rabi crops. But a discernible shift in the seasonal divide has been noticed with rabi cultivation contributing more to the total foodgrain crops despite 22 percent less area under rabi crops than the land cultivated under kharif crop. The share of rabi foodgrain production to total foodgrain production has increased from 36.4 percent in 1970–71 to 50 percent in 2015–16. Out of 10 common crops grown both in rabi and kharif season, it is estimated that 57.85 percent of paddy, 68.35 percent of maize, 51 percent each of arhar (tur), moong and sugarcane, 65 percent of groundnut and 51 percent of coconut account from crops grown during rabi season. Average yield is also higher by 1065 kg/ha in rabi season compared to kharif season as per NSSO’s 70th round. Average farmers’ income from all sources per month, is abysmally low, ranges from Rs. 4561 for farmers with land size holding less than 0.01 hectare to Rs. 41388 for farmers with land size holding above 10 hectares. The study found that the return on investment for agricultural inputs in rabi crops is relatively better than the return on investment in kharif crops.
Keywords: Rabi crops, Kharif crops, productivity, Income, Return on investment, India.
1. Introduction
Economic development of any developing country is intrinsically linked with the growth of agricultural sector. Agricultural sector gets affected due to climate change and farmers are unable to get adequate returns from their investment, especially on kharif crops. Traditionally, greater focus has been given to kharif crops than rabi crops. But there has been a shifting pattern where rabi cultivation has been contributing more to the total foodgrain crops. Kharif cultivation depends on favorable rains – during July to December; whereas rabi cultivation depends on irrigation facilities- during January to June. Some of the studies find that, many of the farmers are not willing to continue farming because of the losses incurred by the farmers in agricultutral investments. A study by Parthasarathy and Birthal (2002) highlights that unequal distribution of resources is the major cause of poverty, particularly in the economies dominated by smallholdings, where the size of land holdings is too small to provide an adequate living to the poor. The poor households
supplement their livelihood from a number of other farm and non-farm activities including livestock. Livestock has been viewed as an important activity in the poverty-alleviation programmes in India. The study estimates/examines the relationship between livestock sector growth and poverty. The results confirm that livestock sector growth is more important than agricultural sector growth in reducing poverty. Another study by Sarju Narain et al. (2015) was carried out in Bundelkhand region of Uttar Pradesh to assess the perception of farming youth towards farming. The study found that participation of rural farming youth (age upto 25 years) has declined and marginal farming youth is leaving farming more as compared to small and large farming youth. About 92 percent farmers are practicing farming due to lack of any other option. About 89 percent farmers accept that farming is not beneficial, 88 percent farming youth accept that poor income and poor living standard is responsible for luring the rural youth to non-farm sector. The study also showed an alarming situation that 92 percent of youth did not adopt farming innovations during last five years

June, 2019 │ Agricultural Situation in India │ 9
Articles
in their fields and the educated youth did not take interest in farming. A study by Rakib et al. (2014) finds that 40 percent of the farmers with agricultural ownership and 45 percent farmers who are owners-cum-tenant felt that temperature has increased and rainfall has decreased due to environmental imbalance. About 37 percent farmers indicated that ground water level has depleted owing to over extraction of water which has an impact on climate change. Not only ground water, the farmers felt that the other climate variables have also changed and negatively impacted agricultural production. Some of the farmers managed to cope with drought using different tools and techniques but rest of the farmers tend to engage in other jobs. A study by the Centre for Study of Developing Societies (CSDS), 2013, found that given an option, majority of farmers in the country would prefer to take up some other work. Poor income, bleak future and stress are the main reasons why they want to give up farming. A survey of 5000 farm households across 18 states found that 76 percent of farmers would prefer to do some work other than farming. A high percentage of farmers complained of repeated losses, 70 percent of respondents said their crops were destroyed due to unseasonal rains, drought, floods and pest attack. NSSO and Census survey also pointed agrarian crisis and increasing number of people giving up farming.
Against this backdrop, an attempt has been made to discern (i) Growth of agricultural sector, (ii) Yield of various crops grown in rabi vis-a-vis kharif season to assess the productivity differentials, and (iii) income and expenditure of farmers.
2. Data Sources
Data has been taken from various rounds of
Agricultural Statistics at a Glance, Ministry of Agriculture and NSSO 70th Round-Situation Assessment Survey of Agricultural Households—during January–December, 2013. The survey schedule was designed for collecting information on various aspects relating to farming and other socio-economic characteristics of agricultural households. It provides information on consumer expenditure, income and productive assets, their indebtedness, farming practices and preferences, resource availability, their awareness of technological developments and access to modern technology in the field of agriculture, information on crop loss, crop insurance and awareness about Minimum Support Price (MSP). The information was collected in two visits from the same set of sample households with a view to collect information separately for the two major agricultural seasons—rabi season (January to July) and kharif season (August to December).
Average monthly expenditure on various inputs and receipts from crop production per agricultural household engaged in crop production for each class size of land possessed was collected. These land size categories in hectares are (i) <0.01, (ii) 0.01– 0.40, (iii) 0.41–1.00, (iv) 1.01–2.00, (v) 2.01– 4.00, (vi) 4.01–10.00 and (vii) above 10.00.
3. Growth of Agricultural Sector
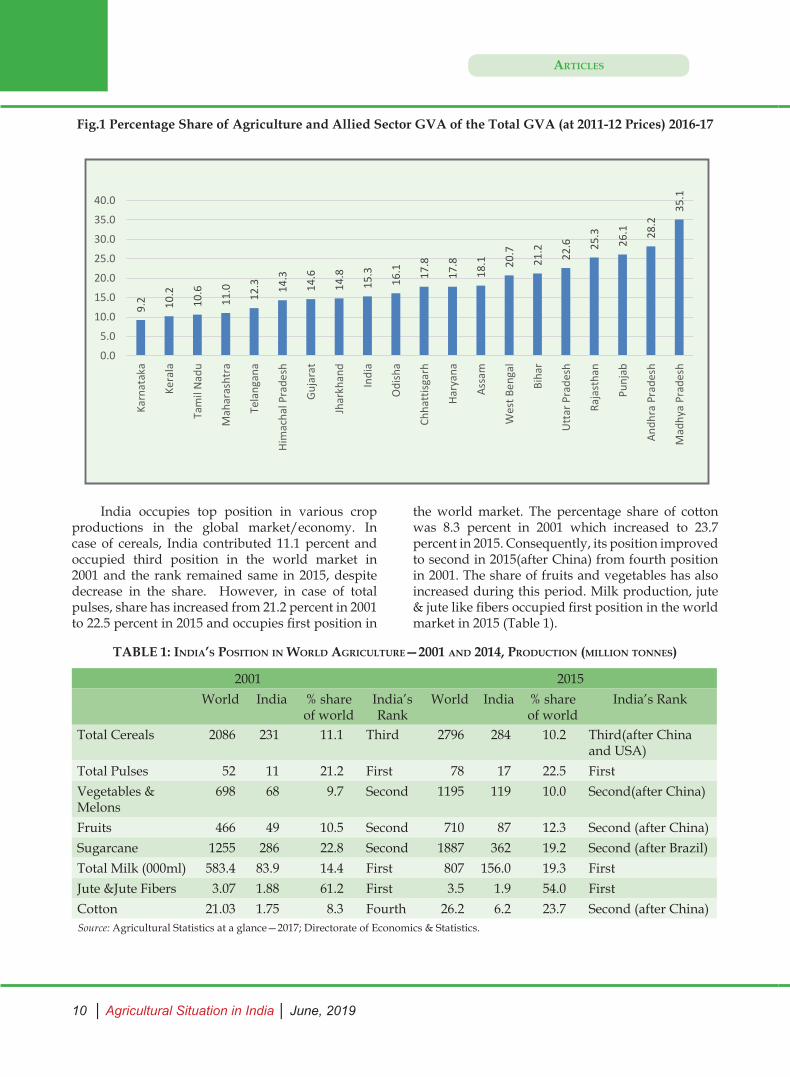
India’s agricultural sector has been growing significantly over the years. The gross value added (GVA) of agriculture and allied sector at constant price (base year 2011–12) has increased from Rs15018.16 billion in 2011–12 to Rs.17745.73 billion in 2017–18, registering an annual growth of 3.33 percent. Nevertheless, the percentage share to total GVA has declined from 18.5 to 15.3 percent during the same period (Economic Survey-2016-17). Fig.1 presents the inter-states differential of contribution of GVA of agriculture and allied sector to GVA at constant price.
10 │ Agricultural Situation in India │ June, 2019
Articles
India occupies top position in various crop productions in the global market/economy. In case of cereals, India contributed 11.1 percent and occupied third position in the world market in 2001 and the rank remained same in 2015, despite decrease in the share. However, in case of total pulses, share has increased from 21.2 percent in 2001 to 22.5 percent in 2015 and occupies first position in
the world market. The percentage share of cotton was 8.3 percent in 2001 which increased to 23.7 percent in 2015. Consequently, its position improved to second in 2015(after China) from fourth position in 2001. The share of fruits and vegetables has also increased during this period. Milk production, jute & jute like fibers occupied first position in the world market in 2015 (Table 1).
TABLE 1: india’s posiTion in world agriculTure—2001 and 2014, producTion (million Tonnes)
2001 2015World India % share
of world India’s Rank
World India % share of world
India’s Rank
Total Cereals 2086 231 11.1 Third 2796 284 10.2 Third(after China and USA)
Total Pulses 52 11 21.2 First 78 17 22.5 FirstVegetables & Melons
698 68 9.7 Second 1195 119 10.0 Second(after China)
Fruits 466 49 10.5 Second 710 87 12.3 Second (after China)Sugarcane 1255 286 22.8 Second 1887 362 19.2 Second (after Brazil)Total Milk (000ml) 583.4 83.9 14.4 First 807 156.0 19.3 FirstJute &Jute Fibers 3.07 1.88 61.2 First 3.5 1.9 54.0 FirstCotton 21.03 1.75 8.3 Fourth 26.2 6.2 23.7 Second (after China)Source: Agricultural Statistics at a glance—2017; Directorate of Economics & Statistics.
Fig.1 Percentage Share of Agriculture and Allied Sector GVA of the Total GVA (at 2011-12 Prices) 2016-17

June, 2019 │ Agricultural Situation in India │ 11
Articles
A comparison of annual average growth rates of production between India and World in cereals, pulses, vegetables, fruits, sugarcane, milk and milk products and cotton have been worked out. Except
cereals, sugar cane and jute and jute fibers, growth rates of all other crops were much higher in India as compared to the world averages between 2001 to 2015 (Table 2).
TABLE 2: average annual growTH raTe of various crops in india and world
Years Products World India2001–2015 Cereals 2.1 1.52001–2015 Pulses 2.9 3.22001–2015 Vegetables 3.9 4.12001–2015 Fruits 3.1 4.12001–2015 Sugarcane 3.76 1.912001–2015 Milk and Milk products 2.3 4.52001-2015 Jute & Jute Fibres 0.9 0.12001–2015 Cotton 1.6 9.5
Source: Author’s calculation from various issues of Agricultural Statistics at a Glance.
3.1. Trend of agricultural trade
Agricultural export and imports have also increased considerably since liberalization. Since 2000-01, there has been marked increase in both export and import of agricultural
commodities. Table 3 presents export and import and net agricultural trade. The net agricultural trade value has increased from Rs. 4807 crores in 1990-91 to Rs. 61925 crores in 2016-17, increased by 13 times over the years.
TABLE 3: Trend of agriculTural Trade (Rs. CRoRe)
Years Products World India1990-91 6013 1206 48071995-96 20398 5890 145082000-01 28657 12086 165712005-06 45711 15978 297332010-11 113047 51074 619732015-16 215396 140289 751072016-17 226652 164727 61925
Source: Various issues of Agricultural Statistics at a Glance. 3.2. Trend of contribution of rabi vis-a-vis kharif foodgrain to total foodgrain
The production of total foodgrain has increased from
108.42 million tonnes in 1970–71 to 275.68 million tonnes in 2016-17. The share of rabi foodgrain crops has increased from 36.4 percent in 1970–71to about 50 percent in 2016-17; whereas the share of kharif foodgrain crops declined from 63.6 percent to 50

12 │ Agricultural Situation in India │ June, 2019
Articles
percent during the same period (Table 4).TABLE 4: sHare of raBi and KHarif crops To ToTal foodgrain in india (million Tonnes)
Year Production of Kharif (million
tonnes)
Percentage share of Kharif production to
total(%)
Production of Rabi Crops
(million tonnes)
Percentage share of Rabi production to
total (%)
TotalFood grains (million
tonnes)
1970–71 68.92 63.6 39.50 36.4 108.421980–81 77.65 59.9 51.94 40.1 129.591990–91 99.44 56.4 76.95 43.6 176.392000–01 102.09 51.9 94.73 48.1 196.812010–11 120.90 49.4 123.6 50.6 244.502015–16 124.01 49.2 128.21 50.8 252.222016-17 138.52 50.2 137.16 49.8 275.68Source: Agricultural Statistics at a Glance-2017.
4. Yield of Various crops in Rabi and Kharif Seasons
Income of the farmers is mostly determined by the crop productions; and production of crops depends on the contribution of yield of various crops cultivated.
4.1. Yield of foodgrain
Yield of rabi crops has been contributing significantly
Fig.2: Trend of Yield of Foodgrain -Kharif and Rabi Season (Kg/Hectare)
Source: Agricultural Statistics at a Glance-2017; Directorate of Economics & Statistics.
Figure 3 depicts the yield differentials in kharif and rabi seasons of foodgrains in major states. Yield of foodgrain in kg/hectare for rabi crops is much higher than the yield of foodgrain in kharif crops in all the major states, viz., Andhra Pradesh, Assam, Bihar, Gujarat, Haryana, Kerala, Madhya
Pradesh, Punjab, Rajasthan, Uttar Pradesh and West Bengal. The yield of rabi crops is lower than yield of kharif crops in 5 states viz: Chhattisgarh, Himachal Pradesh, Jharkhand, Karnataka, Maharashtra and Tamil Nadu.
to the production of total food grains over the years (Fig.2). Yield of rabi foodgrain crop increased from 941 kg/hectare in 1970–71 to 2467 kg/hectare in 2016-17, whereas the yield of kharif foodgrain increased from 837 kg/hectare to 1913kg/hectare during the same period. The annual average growth rates of yield are 2.1 percent and 1.8 percent for rabi and kharif foodgrain crops respectively during the same period.

June, 2019 │ Agricultural Situation in India │ 13
Articles
4.2. Yield of rice
Figure 4 presents the yield of rice in both kharif and rabi season in all major rice growing states. In all major rice producing states, viz., Andhra Pradesh, Assam, Bihar, Gujarat, Karnataka, Kerala, Maharastra, Odisha, Tamil Nadu, Uttar Pradesh,
and West Bengal, the yield of rice in rabi season is much higher than the yield of rice in kharif season. On an average the yield of rice grown in rabi season is higher by 767 kg/hectare than the yield of rice grown in kharif season. However, it varies across the states.
Fig.3: Season -wise Yield of Foodgrain by States -2016-17
Fig.4 –Season-wise Yield of Rice in major rice producing states-2016-17.
Source: Agricultural Statistics at a glance-2017; Directorate of Economics & Statistics
Source: Agricultural Statistics at a glance-2017; Directorate of Economics & Statistics

14 │ Agricultural Situation in India │ June, 2019
Articles
4.3. Yield of maize
Maize is the staple diet in many states and bulk has been used by the industries. Yield of maize grown in rabi season is remarkably higher in Andhra
Pradesh, Bihar, Karnataka, Odisha, Rajasthan and West Bengal for the year 2016-17. On an average the yield of maize grown in rabi season is higher by about 1609 kg/hectare than the yield of maize grown in kharif season. (Fig. 5).
Fig. 5 Season-wise Yield of major Maize producing states-2016-17.
Source: Agricultural Statistics at a Glance-2017; Directorate of Economics & Statistics.
4.4. Yield of oilseeds
Figure 6 presents the yield differentials of oilseeds in rabi and kharif seasons in all major oilseeds producing states. The yield of oilseeds grown in rabi season is higher in 13 states out of 18 states considered under the study. The yield of oilseeds
grown in rabi season as compared to kharif season is significantly higher in Andhra Pradesh, Haryana, Kerala, Odisha, Punjab, Rajasthan, Tamil Nadu, Uttar Pradesh and West Bengal for the year 2016-17. A somewhat lower yield of oilseeds in rabi season is observed in Chhattisgarh, Jharkhand and Maharashtra.
Fig.6. Season-wise Yield of Oilseeds by states-2016-17.
Source: Agricultural Statistics at a Glance-2017; Directorate of Economics & Statistics

June, 2019 │ Agricultural Situation in India │ 15
Articles
4.5. Yield of groundnut
Figure 7 highlights the extent of yield variation of groundnuts (kg/hectare) in major groundnut
producing states in rabi and kharif season. The yield of groundnut grown in rabi season is again much higher than the yield of groundnut grown in kharif season in all the states under consideration.
Fig.7 Season-wise Yield of Groundnut by states-2016-17
Fig. 8 Season-wise Yield of Sunflower by States- 2016-17.
Source: Agricultural Statistics at a Glance-2017; Directorate of Economics & Statistics.
Source: Agricultural Statistics at a Glance-2017; Directorate of Economics & Statistics.
4.6. Yield of sunflower
Figure 8 highlights the extent of yield variation of sunflower in major sunflower growing states. Except Karnataka, the yield of sunflower is also higher in
rabi seasons than the yield of kharif seasons in all the major sunflower growing states. This scenario, further justifies that rabi crops are more profitable than the kharif crops in India.

16 │ Agricultural Situation in India │ June, 2019
Articles
In order to further justify our argument that rabi crops are getting more profitable than the crops grown in kharif season, we considered 10 common crops grown both in rabi and kharif seasons to compare the yield differentials of these crops from NSSO’s 70th Round data. These are paddy, jowar, maize, arhar (tur), moong, sugarcane, groundnut, coconut and cotton. Except two crops viz. jowar and cotton, the productivity in kg/ha is much higher in rabi season than in kharif season. On an average, the yield is higher by 1065 kg/ha in rabi season as
compared to kharif season (figure 9).
Out of the total production together—both of rabi and kharif season in the country—57.85 percent of paddy, 68.35 percent of maize, 51 percent each of arhar (Tur), moong and sugarcane, 65 percent of groundnut and 51 percent of coconut account from the crops grown during rabi season. On an average 53 percent of total production comes from the crops grown during rabi season.
Fig. 9: Crop-wise Yield for Kharif and Rabi crops (Kg/Hectare).
Source: Author's calculation from NSSO 70th Round; Report No. 569
5. Distribution of Land Holdings and Income of Farmers
Growth of agriculture is on priority not only to achieve the targeted production at national level but also to ensure food security and to bring about equity in distribution of income and wealth of the producers. Food security of any country depends on the wellbeing of the farmers to secure a fair standard of living and discourage their families from migrating to urban areas for employment.
One-third of the economically active population obtains its livelihood from agriculture of which the vast majority of the world’s farms are small or very small in size. Globally, farms of less than 1 hectare account for 72 percent of all, but control only 8 percent of all agricultural land.
In India, 67 percent of marginal farmers operate only 22 percent of agricultural land. Farmers’ income
is closely linked with the land size of cultivation. Various studies also found that unequal distribution of land size is the major cause of poverty among agricultural households. Higher the land size under operation, higher the incomes derived from cultivation. In India, the total number of rural operational holdings increased from 88.9 million in 1980–81 to 145.73 million in 2015-16. The operational holdings increased among marginal holdings (who cultivate less than 1hectare of land) from 56.37 percent in 1980–81 to 68.52 percent in 2015-16, while the shares of small, semi-medium, medium and large holding groups decreased from 18.11 to 17.94 percent, 14.01 to 10.05 percent, 9.08 to 4.25 percent and 2.44 to 0.57 percent, respectively, during the same period (Table 5). On an average, these farmers cultivate 0.39 hectare, 1.42 hectare, 2.21 hectare, 5.73 hectare and 17.38 hectare, respectively. The average land size operated by the farmers was 1.08 hectare in 2015-16, which saw a decline from 1.84 hectare in 1980–81 (Figure-10).

June, 2019 │ Agricultural Situation in India │ 17
Articles
Fig 10 : Average Size of Holding (Hectare
Sources: Several rounds of Agricultural Census, Department of Agriculture, Cooperation and farmers welfare, Government of India, Ministry of Agriculture and farmers welfare.
TABLE 5: opeRational Holdings in india by Land Size
Years Marginal(%)
Small(%)
Semi-Medium
(%)
Medium(%)
Large(%)
Total(%)
All Holdings (million)
Average size of holding
(ha)1980–81 56.37 18.11 14.01 9.08 2.44 100 88.92 1.841985–86 57.80 18.45 13.64 8.15 1.97 100 97.15 1.691990–91 59.44 18.84 13.06 7.11 1.55 100 106.62 1.571995–96 61.59 18.72 12.34 6.13 1.21 100 115.57 1.412000–01 62.88 18.93 11.69 5.50 1.00 100 119.93 1.332005–06 64.77 18.52 10.93 4.95 0.85 100 129.22 1.232010–11 67.04 17.94 10.05 4.25 0.73 100 137.76 1.152015-16 68.52 17.69 9.45 3.76 0.57 100 145.73 1.08Avg. land size (Ha)
0.39 1.42 2.71 5.73 17.38
Sources: Several rounds of Agricultural Census,Department of Agriculture, Cooperation and farmers welfare,Government of India, Ministry of Agriculture and farmers welfare.
5.1. Area under various crops during rabi and kharif season
The information related to gross cropped area as well as allocation of area under various crops during rabi and kharif season have been used to have an assessment of the extent of land used differential by the agricultural households by seasons. Under the ten common crops considered for the study,
it was found that during kharif season 0.5571 hectare of land per household was used under ten various crops as against 0.5057 hectare of area per agricultural household during rabi season. The allocation of area under rabi season is lower than the allocation of area under kharif season in paddy, arhar, moong, sugarcane and groundnut. Figure 11 presents the extent of land used under various crops both in rabi and kharif season.

18 │ Agricultural Situation in India │ June, 2019
Articles
Fig.11: Average gross cropped area (hectare) per agricultural households under the Kharif and Rabi Crops
Source: NSSO 70th Round; Report No. 569.
6. Income and Expenditure of Farmers by Land Holding Size
NSSO’s Situation Assessment Survey of agricultural households provides information on average income of agricultural households which includes net receipts from cultivation, farming of animals, non-farm businesses and income from wages and salaries. Income from various sources varies across land size of the households (Fig.12). Income received from all sources ranges from Rs. 4561 for land size groups less than 0.01 hectare to Rs. 41388 for farmers who owned 10 hectares and above. The net receipt of average income from cultivation is higher for medium and large farmers’ households whereas the receipt of average income from wages/salaries is higher for the first four groups of farmers’ households, viz., (i) <0.01, (ii) 0.01-0.40, (iii) 0.41-
1.00 (iv) 1.01-2.00. The study found, a huge income deficit among the first three categories of farmers’ households.
The farmers also earned a significant portion of income from livestock. The income received from animals/livestock ranges from Rs. 3214 for land size category – less than 0.01 hectare to Rs. 10016 for large land holding size category - 10 hectares and above. Income from milk contributes 52 percent of total income from animals, for <0.01 land size holding groups to 71 percent for large land holding groups (Table 6). Significant investment is required in livestock sector from where farmers can derive larger share of their income which in turn will contribute towards doubling farmers’ income in near future.
Fig.12: Incomes and Expenditure of Agricultural Households (Rs./per month)
Source: Author’s calculation from Situation Assessment surveys of Agricultural Households NSSO, 70th Round-2013-14.
<0.01 0.01-040 1.01-1 1.01-2.00 2.01-4.00 4.01-10 >10.00 all size

June, 2019 │ Agricultural Situation in India │ 19
Articles
Source: Author’s calculation from Situation Assessment surveys of Agricultural Households NSSO, 70th Round-2013-14.
TABLE 6: income from animals/livesTocK (rs/per monTH)
Land size categories(hectares)
Average Income Rs/per month
Average Income from Milk Rs/per
month
% share of Income from milk (%)
Average Input cost Rs/per month
<0.01 3214.82 1681 52 13110.01–0.40 3205.85 2271 71 17850.41–1.00 1362.83 832 61 14171.01–2.00 1800.17 1131 63 9902.01–4.00 2717.03 1592 59 16054.01–10.00 8047.55 2836 35 253310.00+ 10016.54 7149 71 4762Source: Author’s calculation from Situation Assessment surveys of Agricultural Households NSSO, 70th Round.
6.1. Income from production of rabi vis-à-vis kharif
Figure 13 presents the average value of production received per household from the crops grown in rabi and kharif season. As per NSSO’s 70th Round, out of 90.2 million agricultural households in the country, 86.5 percent households were engaged in crop production during kharif season; whereas only 71.1 percent were engaged in cultivation in rabi season. The average value of production of ten common crops (which included value of harvested crop, pre-harvested sale and value of by products) per
households during the kharif period was marginally higher at Rs. 26258 as against Rs. 25491 during for rabi crops. However, the income received from the five products, viz., paddy, jowar, maize, potato and coconut is higher for rabi season than the income received from these same crops groups grown in kharif seasons because of seasonal price variations.
These findings too support that investment in rabi crops is an essential condition to meet the goal of doubling the farmers’ income in near future.
Fig.13:Average Value of Production per agricultural Households for Kharif and Rabi cultivation (Rs.)
Source: Author's calculation from NSSO 70th Round; Report No. 569.

20 │ Agricultural Situation in India │ June, 2019
Articles
6.2. Crop produce sold at MSP in kharif and rabi season
Income of the farmers depends on the price received from the product they sell. The Minimum support price (MSP), which is crop specific procurement price, is announced by the Government. NSSO
collected information regarding awareness about MSP and extent of product sale at MSP. A very few agricultural households were aware about the MSP. Figure 14 presents the percent of sale at MSP both in kharif and rabi seasons by crops out of total sale of the crops. That is one of the major reasons for low income of the farmers.
Figure 14. Percent of total sale at MSP by agricultural households
Source: NSSO 70th Round; Report No. 569. * Wheat is grown in Rabi season only
7. Conclusion and Policy Suggestions
Contribution of rabi foodgrain crops is more than the kharif foodgrain crops to the total foodgrain production despite lower land use and lower engagement of rural agricultural households in the rabi crops. The production of foodgrain grown in rabi seasons contributes 50 percent to the total foodgrain production. The income received from some crops, viz., paddy, maize, jowar, potato, coconut is also higher for the rabi crops due to the seasonal variation of price than the income received from the kharif crops.The agricultural sector has been suffering from decreasing returns to scale for all categories of farmers. The return on investment on kharif crops is much lower than the return on investment on rabi crops.
Productivity is the major determinant of foodgrain production. On an average the productivity of rabi crops is higher by 1065 kg/ha than the productivity of kharif crops. Productivity of foodgrain for rabi crops is much higher than the productivity of foodgrain of kharif crops in
all major states, viz., Andhra Pradesh, Assam, Bihar, Gujarat, Haryana, Kerala, Madhya Pradesh, Punjab, Rajasthan, Uttar Pradesh and West Bengal. The individual crops, viz., rice, maize, oilseeds, groundnuts, sunflower also give enough evidence that diversification of cropping pattern—shifting from kharif to rabi crops-yields better results.
Livestock sector too contributes a sizable income to all agricultural households. Milk alone contributes 52 percent of income derived from livestock sector in lowest land holding categories to 71 percent in the large landholding category.
7.1. Policy Suggestions
On the basis of the major findings, some policy prescriptions are summarized below:
• More emphasis on rabi crops may help Government to achieve the goal of doubling farmers’ income as the study finds significant crop diversification—shifting from kharif to rabi crops.
June, 2019 │ Agricultural Situation in India │ 21
Articles
• Farmers should be encouraged to sell their product at MSP as majority of the farmers are not aware of MSP. Government should also increase MSP substantially which will help farmers to get better return.
• More focus should be given on horticulture products—fruits and vegetable as India occupies second position in the world after China on fruits and vegetable production. Better linkage should be established between fruit and vegetable growing farmers and agro-processing units.
• Linkage should be strengthened between milk producing farmers and diary processing units as India is placed at first position in milk production in the world.
• Government should also set up more Krishi Vigyan Kendra (KVKs) for coverage of all farmers for access to technical advice for crops.
• Increase in trade of agricultural produce as well as agri - raw material may also help in increasing farmers’ income as India has relative advantage in the world market on these products (Buragohain.T-2016).
• The non-institutional credit should be replaced with formal credit. Focus should be given on ground level credit for agri-infrastructure development.
REFERENCES
Agricultural Statistics at a Glance (2012): Ministry of Agriculture and Farmers Welfare, Directorate of Economics and Statistics, New Delhi.
Annual Report (2011–12): Department of Agriculture, Cooperation and Farmers Welfare, Ministry of Agriculture and Farmers Welfare, Government of India.
Buragohain.T (2016):“Is India Better off?” Financial Express on December 19th 2016,
Economic Survey of India—2016-17, Ministry of Finance.
Global Report (2012):“Agriculture at Crossroads: Findings and Recommendations for Future Farming”,Global Report of International Assessment of Agricultural Knowledge, Science and Technology for Development.
www.globalagriculture.org/report-topics/industrial-agriculture-and-small-scale-farming.html-2016
Rakib M.A., Md. Atiur Rahman, Akter M.S., Mohammad A.H. Bhuiyan (2014): “Climate change: Farmers perception and agricultural activities: Herald Journal of Geography and Regional Planning, Vol. 3.(3), June 2014.
Naik. B.K, (1998): Farming system in Uttar Kannada districts-An Econometric Analysis, Ph.D. Thesis, University of Agricultural Science, Dharwad.
Nagraj et al. (1996) employed Cobb–Douglas production function to evaluate the economics of maize–sunflower farming system at different size group of farmers of Tungabhadra command area
Nagaraj, T., H.S.S. Khan and N.N. Karnool (1996): Economic analysis of maize-sunflower farming in Tungabhadra, Karnakata, Farming Systems, 12(3-4) 28-36.
Parthasarathy, R. and P.S. Birthal (2002): Crop-Livestock System in India, Research and Policy Implication; “Policy Brief No.1”, National Centre for Agricultural Economics and Policy Research (NCAP).
Sarju Narain, A.K. Singh and S.R.K. Singh (2015), Perception of Farming Youth towards Farming. Indian Res. J. Ext. Edu. 15 (2), May 2015.
“State of Indian Farmers”(2013):Centre for Study of
Developing Societies (CSDS), Delhi. http://indianexpress.com/article/explained/lokniti-csds-kas-survey-mind-of-the-youth-4597199
Singh, M.P. (2004): Economics cropping systems in Madhya Pradesh. Rural India, 67(1): 29-33.
Sunanda N. and I. Narendra (2003): Resource Productivity of mesta farms in Srikakulam
22 │ Agricultural Situation in India │ June, 2019
Articles
district of Andhra Pradesh, The Andhra Agricultural Journal, 50 (3&4): 327-331.
Verma, A.R.( 2002): Economics of production,
resource use efficiency and constraints: A case study of onion in Shajapur district of Madhya Pradesh, The Bihar journal of Agricultural Marketing,10 (4): 429-439

June, 2019 │ Agricultural Situation in India │ 23
Articles
performance of onion in rajasTHan-an economic analysis
shiRish shaRma1 and naveen p. singh2
Abstract
Onion is a multi-faced crop; it brings cheers to traders, fear to farmers and tears to consumers. Major studies on the dynamic nature of price fluctuation throughout the year conclude two things, one is associated with
irregular monsoon and another is holding by the market intermediaries. However, it is interesting to note here that price fluctuation are almost following a uniform trend by reaching peak level in September as majority of districts witnessed peak prices of onion in the month of September only. Problems/ constraints are the challenges that pose threat to production, mostly uncertain. In the study area, marginal role of government was witnessed and majority of the respondent were dissatisfied with the local market performance in terms of stable pricing. Storage facility was also a major constraint faced by the respondents. Costs are key driver to ascertain net farm income. It looks quite small on an individual basis but at aggregate level they add up to total cost. Study witnessed the cost of curing and storage as a major cost incurred by the farmers. In spite of the fact that onion farming incurs huge cost, the net income from onion cultivation is fairly well in all the states except during the time when there is a glut in market. Price trend noticed from the study has shown erratic behaviour, peaking in a particular month and the year. As stated earlier, price shooting occurred in the month of September and this particular month created new high average price of that particular year. Thus, the study has been taken within the demarcated objectives and the elucidation of data from the respondents in study area was made to meet the study requirement. The policy measures are recommended based on the facts evidenced from the study.
Keywords: Onion, Price fluctuation, Price behaviour, Rajasthan.
1 Assistant Professor, SK Rajasthan Agricultural University, Bikaner, Rajasthan.2 Principal Scientist,ICAR-NIAP, New Delhi
1. Introduction
Onion (Allium cepa L.) has about 500 species of herbs, occurring throughout the northern hemisphere, with the greatest number in the USSR (Wright, 1992). Onions, compared with other fresh vegetables, are relatively high in food value, intermediate in protein content and are rich in calcium and riboflavin (Purse glove et al., 2000). Onion is not known with certainty as a wild plant. It is believed to have originated in an area which includes Iran, West Pakistan and the mountainous countries to the North (Purse glove et-al, 2000). In India, onion is one of the most important commercial vegetable crops cultivated extensively not just for their broad culinary uses, but also because their price swings can influence political outcomes. It belongs to the family Alliaceae. India is the world’s second-largest producer of onion, after China. A global review of area and production of major vegetables shows that the world production is 75977209 million tonnes from an area of 3971505 hectares. India ranks third in export after Netherland and Spain (Horticulture Statistics, 2016). India accounts for 19.90 percent of the world production and ranks first in total area under onion cultivation.
Onion is an important crop in all the continents and is commercially cultivated in various countries. It is a crucial item in every kitchen as vegetable and condiment in India. In India it is being grown in an area of 1305.62 thousand hectares with a production of 22427.42 thousand million tones and the productivity is 17.18 tons per hectare. Maharashtra is one of the leading states in the cultivation of onion in the country next to Madhya Pradesh and Karnataka (www. gov. in/area-pro/database-2016. pdf). India is exporting 1163472.60 million tonnes of onion worth ̀ 174155.40 lakh (www.apeda.gov.in). Total onion production and area in Maharashtra is 6734.74 MT and 4, 81,000 ha, respectively. During 2016-17, this state accounted for 36.84 percent in terms of area and 30.03 percent in total output of onion in the country (NHRDF-2016-17). The state of Maharashtra is, therefore, called as onion basket of India.
1.1. Rationale of the study
Although it is widely believed that the marketing of fruits and vegetables is a complex process due to their perishability, fragility, seasonality and bulkiness. Owing to inelastic demand and seasonal

24 │ Agricultural Situation in India │ June, 2019
Articles
production of onion, the prices for onion are not stable throughout the year. Price fluctuation creates uncertainty in the income levels of onion growers and price paid by the consumer. The low share of producer’s in the consumer’s rupees, particularly during high production and arrival period has been a matter of serious concern for policy makers in India. An understanding of price fluctuations is a pre-requisite for stabilization programme. It gives some idea to the government procurement agency regarding the suitable time for making purchases. To farmers, it is helpful in providing guidance as to when and where it will be more profitable for them to dispose-off their produce. In the past, various attempts have been made to investigate the behaviour of price and arrivals and its relationship in vegetables like potato, tomato, brinjal, chillies, etc [Shiskin (1958), Acharya and Agarwal (1994), Gupta (1997), Singh et al., (1993), Jha (1971), Gupta (1970), Kainth and Mehra (1988), Sidhu and Chahal (1988), Parthasarathy et al. (1988), Agarwal and Dhaka (1998), Goswami (1991)]. Most of the studies on the onion marketing are limited to identifying various marketing channels and measurement of their efficiencies. Therefore, the present study was undertaken in Rajasthan with the following objectives.
1.2. Objectives
• To analyse the cost, returns and yield gap of onion cultivation of sample farmers,• To study inter-temporal behaviour of onion prices,• To ascertain the problems experienced by the onion growers and their suggestions.
2. Database and Methodology
The research methodology and design of the study is an important component of research. To analyse various objectives of the study, an appropriate methodology describing sampling design, data collection and tools of analysis for conducting the study is important.Three leading districts based on substantial area and production under onion crop, namely, Banswara, Bhilwara and Jodhpur were selected for the present study. The primary data collection survey was conducted to know cost of cultivation, problems experienced by the onion growers and marketing behaviour of onion growers of the study area. Market Survey was conducted to assess marketing behaviour across different APMCs. One regulated market was selected from
each district for the present study. Primary as well as secondary data was used for the study. Primary data was collected on pre-structured schedules. The pre-testing of the schedule was done by collection of data from few farmers and relevant market information from commission agents, wholesalers, and retailers through personal interview method. Information regarding price received and cost incurred in marketing was collected and secondary data in respect of area, production, and prices of onion prevailing in these markets was obtained from Directorate of Economics and Statistics, RSAMB and other sources. All the data sets were analysed by using Statistical Package for Social Science (SPSS) computer software, which facilitated the generation of descriptive statistics using frequency and percentage.
2.1. Methodology & Analytical Techniques
The data collected for the purpose of the study was quantified, categorized and tabulated.
Karl Pearson’s Correlation Coefficient (r): Karl Pearson’s Correlation Coefficient (r) was computed in order to know the nature of relationship between the dependent and independent variables. The values of the correlation coefficients worked out as per the fallowing formula.
Where,r = correlation coefficient between variables X and Y∑x = sum of scores of variable X∑y= sum of scores of variable Y∑xy = sum of products of variable X and variable Y∑x2 =sum of squares of X variable∑y2 = sum of squares of Y variablen = paired number of observations
Cost and returns of onion production
In the present study, the economics of onion cultivation was arrived at by computing per ha cost and return structure. Total operational cost was worked out. The gross return, net return and benefit cost ratio was calculated by using the formula, Gross return (`/ha)B:C Ratio = Total operational cost (`/ha)
Gross return (`) = Actual per ha yield (q) of onion x market price (`/q)

June, 2019 │ Agricultural Situation in India │ 25
Articles
Net return (`) = Gross return (`)/ha-total operational cost/ha
Measurement of Price behavior
The behaviour of prices of onion was studied by analyzing the trend, and seasonal components of time series on prices (Croxton and Cowden, 1967). It involved separating and studying the nature and behaviour of these components from the price series. It was assumed that the components were joined together in a multiplicative fashion as represented below:
Pt = T x C x S x I (in monthly price series) Pt = T x C x I (in yearly price series)
Analysis of Trend in PricesFor examining the trend in prices, a linear function was estimated by using the Ordinary Least Squares (OLS) method. Linear Model, Pt = B0 + B1Tt + Ut
Where, Pt = Yearly index number of wholesale price of onion in year (t), Tt = Serial of number of the year (t), Ut = Random disturbance term with usual OLS assumptions, B0 and B1 are regression coefficients to be estimated.
Analysis of cyclical Component
The cyclical component in the yearly price series was worked out by
(i) Calculating the trend values
(ii) Dividing the original observations on prices by the estimated trend values and multiplying it by 100, and then
(iii) Taking three year moving average of (C x I) 100 series.
Symbolically: Pt Tt x Ct x It ------- x 100 = --------------------x 100 = (Ct x It) 100 Tt Tt Moving Average of (C x I) 100 = C x 100
Analysis of Irregular Component
The irregular component in an annual series of prices does not have a definite pattern. It was estimated as residual component by using the estimates of trend and cyclical components.
Symbolically: Pt Tt x Ct x It It = ---------- x 100= -------------------- x 100 = It x 100 Tt x Ct Tt x Ct Analysis of Seasonal Component
The seasonal pattern in price was analyzed by constructing seasonal index numbers. Seasonal index numbers are a set of numbers showing relative prices during different months of a year, the average for the year being 100 and total 1200. The seasonal price indices were compared to know the changes in seasonal pattern overtime. The 12 months moving average was a fairly good estimate of the trend and cyclical components combined. The steps involved in the construction of seasonal price index by this method were:
(i) Generating a series of 12 months moving totals
(ii) Generating a series of 12 months moving averages
(iii) Generating a series of centered 12 months moving averages
(iv) Expressing each original value as a percentage of corresponding centered moving average
(v) Arranging the percentages of moving averages in the form of monthly arrays and calculating the average index for each month
(vi) Adjusting the averages to make their sum equal to 1200, and
This was done by working out the correction factor and multiplying the average for the month by the correction factor, which was estimated as follows: 1200 K = ------------ SWhere, K is correction factor and S is sum of average indices for 12 months.
Multiplication of average for each of the month by the

26 │ Agricultural Situation in India │ June, 2019
Articles
correction factor yielded the index of seasonal prices. The percentage of Centered 12 monthly moving average provided an index of seasonal and irregular components combined because.
Pt T x C x S x I------- X 100 = ------------------------ x 100 = (S x I) 100M.At T x C
The irregular component was removed in the process of averaging each month’s ratio over the years and also through correction factor. This provided a good estimate of seasonal price index. The differences in the seasonal price indices for these two sub periods were compared with the help of F- statistic.
3. Results and Discussion
For the present study, three districts, namely, Banswara, Bhilwara and Jodhpur were selected from Rajasthan state. A sample of 400 farmers was drawn from each district.
3.1. Costs and returns
The knowledge of cost and return structure is essential to examine economic viability of crop enterprise. This section evaluates the cost of production, and profitability analysis for onion crops on the sampled farms belonging to onion farmers. Table-1 shows costs and returns per hectare of onion production in the study area, which reveals the total cost of cultivation being 90071.00 per hectare.
TABLE 1: cosTs and ReTurns ComponenTs for Onion farming in rajasTHan
Item Cost and returns (` /ha)Land preparation 6875Seeds 12450Nursery raising 10450Manures 11540Fertilizers 5217Pesticides 5780Irrigation 12054Transplanting 8570Weeding and hoeing 7510Harvesting and curing 5845
Item Cost and returns (` /ha)Transportation and marketing cost
3780
Total cost of cultivation
90071
Production in q / ha. 132.5Gross Return @`810/q 107325Net Return ha. 17254Cost of production per q/ha.
679.78
Profit per quintal 130.21Benefit cost Ratio 1.19
The study also reveals that the cost of seeds was found to be the major cost of cultivation i.e about ` 12,450 / ha. The study further reveals that ` 8,570 for transplanting, ` 7,810.00 for weeding and hoeing and ` 5845.00 for harvesting and curing per hectare. The average output per hectare of onion farmers in the study area was found to be 132.5 q/ha and the average price was ̀ 810 per q. The analysis shows that the gross returns ` 107325.00 were realized and the net return was ` 17254.00 / ha. Return of per rupee invested was worked out to be ̀ 1.19. Hence, the cost and return analysis indicated that onion production in the study area was sound and profitable.
3.2. Yield gap analysis
In Rajasthan, there is a considerable gap between productivity and yield potential of the improved onion technologies. These technologies are vital in production activity. The available agricultural technology fails to serve the very purpose if it does not reach the farm. Crop Cutting Experiment (CCE) is one of the widely used programmes to evaluate and demonstrate the production potential of the crop in the farmers’ fields. The three districts of Rajasthan state, viz., Banswara, Bhilwara and Jodhpur were selected in the year 2016 for the experiment. In an area of 0.44 ha, the Crop Cutting Experiments (CCEs) was carried out in these districts. The improved technologies consisting use of improved variety, seed treatment, balanced fertilizer use, green manure application and integrated pest management. The yield data were collected from both the demonstrated and control plots (farmers’ practices) by crop cutting experiment. The CCEs recorded higher yield as compared to farmers’ practice yield. It was observed

June, 2019 │ Agricultural Situation in India │ 27
Articles
from the results of CCEs data with improved production technologies that there exists a wide yield gap in onion under real farm situations across onion
growing areas of the state. Analysis based on CCE data showed that the yield gap I was 47.67 q/ha at the demonstration level, (Table 2a).
TABLE 2a: yield Gap Analysis i
District Area (ha) No. of Demonstration
Demonstration yield (q/ha)
Farmers practice yield (q/ha)
yield gap (q/ha)
Banswara 0.45 41 150 110 40Bhilwara 0.54 38 157 108 49Jodhpur 0.34 42 152 98 54Overall 0.44 121.00 153.00 105.33 47.67
The yield gap II was 42.23 q/ha. This may be due to the adoption of improved variety by the resource
endowed farmers of the state. Yield gap II has decreased by about 5.44 percent.
TABLE 2b: yield gap analysis ii
Districts Area (ha) No. of Demonstration
Demonstration yield (q/ha)
Farmers practice yield (q/ha)
yield gap (q/ha)
Banswara 0.38 38 152 112 40Bhilwara 0.47 47 148 107 41Jodhpur 0.45 45 138 92 46Overall 0.43 130.00 146.00 103.67 42.33
Trend in prices of onion
Table 3 represents the trend of whole sale price fluctuations of onion. Normally, the wholesale prices of onion were found to increase over time, but some fluctuations have been recorded during 2006 and 2016 (Table 3 and Figure 1). The wholesale onion prices increase in 2006 to 2013 with a decline in 2012.
The onion prices fell again from 2014. In general, wholesale prices of onion in Rajasthan increased from `388 per quintal in 2006 to `2095 per quintal in 2015 with a decline to `762 per quintal in 2012, showing thereby more than three-fold rise in whole sale prices of onion in Rajasthan during the period between 2006 and 2016, considering 2006 price.
TABLE 3: Trend in WHolesale Prices of Onion in RajasTHan 2006 – 2016 (`/q)
Year Jan. Feb. Mar. Apr. May June July Aug. Sept. Oct. Nov. Dec. Average annual
2006 457 357 323 272 271 305 348 356 370 479 479 644 3882007 960 1123 843 584 483 532 772 1266 1457 1414 853 552 9032008 482 384 420 381 369 490 547 665 678 773 1025 1125 6122009 1181 1019 981 588 441 528 640 717 865 1286 1079 1216 8782010 1139 1106 859 665 553 520 606 837 1309 1603 1666 2412 11062011 2226 1288 629 550 499 589 780 905 1168 1372 1089 703 9832012 583 548 599 622 542 597 713 722 713 1029 1351 1129 7622013 1172 1535 1090 1030 930 1061 1570 2712 4088 4509 3895 1543 20952014 1081 919 960 935 911 1017 1735 1581 1573 1669 1500 1471 12792015 1310 1586 1483 1252 1384 1628 1897 3602 4072 2782 2076 1342 20352016 1155 958 1036 807 727 733 813 791 942 1017 1076 869 910

28 │ Agricultural Situation in India │ June, 2019
Articles
The retail prices of onion followed a trend similar to wholesale price i.e. wide fluctuation down the line. The retail prices of onion increased from 2006 to 2007 with a decline in 2008, and a steady increase from 2008 to 2010 with a sharp decrease in 2008. The retail prices of onion showed a further decline between
2011and 2012 with a sudden increase in 2013, marking it the decadal record and a decline in the succeeding year (2014) (Table 4). Again in 2015 the prices were very close to the decadal record price i.e. ` 3071 and decreased thereafter.
TABLE 4: Trend in ReTail Prices of Onion in rajasTHan 2006 – 2016 (`/q)
Year Jan. Feb. Mar. Apr. May June July Aug. Sept. Oct. Nov. Dec. Average annual
2006 820 637 537 457 452 477 558 598 614 831 798 1053 6532007 1483 1730 1379 931 724 804 1250 1975 2435 2078 1450 938 14312008 831 654 716 614 588 778 868 1102 1130 1270 1754 1979 10242009 2092 1735 1659 981 756 862 1062 1170 1342 2200 1824 2004 14742010 1858 1878 1427 1093 907 852 952 1315 2088 2428 2648 3916 17802011 4192 2291 1014 905 828 965 1290 1483 2031 2487 1883 1163 17112012 937 863 967 1009 874 946 1136 1143 1157 1474 1817 1688 11682013 1838 2564 1863 1745 1579 1737 2817 4844 5812 5804 5062 2744 32012014 1852 1558 1541 1550 1502 1723 3200 2848 2812 3029 2661 2602 22402015 2306 2862 2673 2052 1743 1958 2950 4878 5978 4087 3267 2100 30712016 2292 1960 1848 1500 1368 1431 1500 1560 1720 1800 1854 1609 1704
It could be further discerned from Figure 1 that initially the gap between wholesale and retail prices of onion in Rajasthan was not much but it widened with the passage of time, showing increasing share
of market functionaries between wholesale and retail prices of onion. Higher difference in wholesale and retail prices of onion can be witnessed in 2013 to 2016.
Fig.1: Trend in wholesale and retail price of onion in Rajasthan 2006 – 2016 (`/q)
Trend in annual wholesale prices: The estimates of linear trend in wholesale prices of onion are presented in Fig.2.
Cyclical, irregular and seasonal behaviour of prices of onion
Of the four components of time series observations
on prices of onion, trend component has already been dealt with the help of graph. Cyclical variation is an oscillatory movement in a time series where the period oscillation happens to be of more than one year. Irregular price movements represent that part of the behaviour of prices, which is not systematic. No generalization can be made about such price

June, 2019 │ Agricultural Situation in India │ 29
Articles
fluctuations because of the irregularity in their occurrence. Oscillating movement of one-year periodicity is termed as intra year or seasonal variation. Generally, the cyclical movements take the form of a wave with uneven length (intervening period between one peak and the next or between one trough and the next) and amplitude (extent of upswings and downswings) because of complex combination of forces affecting the equilibrium of demand and supply. These cycles generally exhibit semi-regular periodicity as these are neither as regular as seasonal (intra-year) variations nor as accidental as random (irregular) fluctuations. Here, ten years price series data (2005-06 to 2015-16) in the form of indices were used to isolate the cyclical component from the wholesale prices. Cyclical and irregular components of wholesale prices of onion are presented in Table-5 and Figure-3. The table show that wholesale price of onion exhibited only one cycle, which is consisting of 7 years (2007-08 to 2013-14). It is also evident from the table that the irregular fluctuations did not exhibit any definite periodicity in their recurrence. The extent of fluctuations arising as a result of factors other than those causing trend, cyclical and seasonal movements varied from 98.69 (1.69 percent below 100) in 2010-11 to 130.16 (30.16 percent above 100) in 2014.15. Of the 9 observations, 4 observations fluctuated within the range of 103 to 130.
Fig.2: Linear trend in wholesale price of onion in Rajasthan
TABLE 5: Trend, Cyclical and Irregular ComponenTs in Annual WHolesale Price Series of
Onion in rajasTHan 2006 – 2016
Year Trend Cyclical Irregular2006 145.07 - -2007 172.4 145.60 95.712008 199.73 74.87 103.492009 227.06 103.59 95.692010 254.39 108.74 98.322011 281.72 105.19 85.452012 309.05 60.04 106.132013 336.38 149.76 105.952014 363.71 71.50 130.162015 391.04 146.38 95.712016 418.37 - -
The irregular price fluctuations in the wholesale prices of onion may be attributed to factors like span and distribution of monsoon, droughts, floods, and various government polices directly or indirectly affecting the production and consumption of onion.
Seasonal index of wholesale prices of onion
Albeit monthly wholesale of onion over the past one decade are shown in Table 6, this is not sufficient in revealing the general price trend as considerable amount of fluctuation in wholesale price could be observed during different years. Because of wide fluctuations, no concrete conclusion could be drawn as regards the degree of instability in monthly wholesale price during different years. In order to understand the underlying instabilities in wholesale price of onion, the monthly data for the period 2006 to 2015

30 │ Agricultural Situation in India │ June, 2019
Articles
was used to compute 12 month moving totals. These moving totals became the basis for computing specific seasonal relatives and, thereby, seasonal indices. The typical seasonal indices of wholesale price of onion
Fig. 3 Cyclical and irregular components in annual wholesale price series in Rajasthana
so obtained, in turn, formed the basis for delineating trend in monthly prices of onion during the past years. The seasonal indices for wholesale prices of onion are presented in Table 6 and figure 4.
TABLE 6: Typical Seasonal Index for WHolesale Prices of Onion in rajasTHan
Rank Jan. Feb. Mar. Apr. May June July Aug. Sept. Oct. Nov. Dec.1 - - - - - - 89.59 91.03 117.25 113.31 91.59 49.472 85.47 166.87 95.00 100.14 86.03 71.50 89.44 110.53 172.86 87.59 81.07 41.353 72.86 97.71 120.49 131.01 95.35 56.61 54.78 125.07 170.02 121.09 36.94 35.454 79.34 104.35 77.46 131.47 114.75 84.80 93.53 91.65 177.04 77.03 62.54 44.165 74.96 199.64 190.31 56.74 54.90 66.86 135.62 118.91 110.98 78.26 78.21 67.176 93.24 205.65 108.36 73.37 84.27 75.11 - - - - - -Total 405.86 774.23 591.62 492.73 435.30 354.87 462.96 537.19 748.14 477.27 350.35 237.60Mean 81.17 154.85 118.32 98.55 87.06 70.97 92.59 107.44 149.63 95.45 70.07 47.52Seasonal index
83.04 158.41 121.04 100.81 89.06 72.61 94.72 109.91 153.07 97.65 71.68 48.61
Correction Factor: 1.022
Table 6 shows that the wholesale prices of onion peaked in the month of February for initial six months of each year. In the next six months, September recorded the highest price and it was lowest in December. May through August marked the period when the wholesale prices of onion were found to be in the midst of a rising trend. In general, the wholesale prices of onion for the state peaked during the month of February, September, March and August (Table 6 and figure 4). June and November months marked lean season with lowest prices. A noticeable trend emerging out from this analysis was the steep and steady decline in wholesale prices of onion during the period between February and June, and a sharp increase thereafter.
Relationship between arrivals and prices of onion To know the relationship between arrivals and prices of onion during 10 years, the correlation coefficients (r) is employed. It was observed from the table that the correlation coefficients were negative for the market arrivals and prices of onion in the months of January to March and June to September. The positive correlation coefficients were observed in the months of April and May. Similarly the positive correlation coefficient was also observed in the months of October to December. The positive relationship between arrivals and prices showed that there exist a direct relationship between arrivals and prices. It means

June, 2019 │ Agricultural Situation in India │ 31
Articles
that the arrivals and prices of onion moved in similar direction. And negative relationship showed inverse relationship between arrivals and prices. The value of t- test indicated that the correlation coefficients for the market arrivals and prices for all the months were statistically non-significant except for the month of April and May. The coefficient of correlation between arrivals and prices for the month of April was noted to be significant at 5 percent level.
TABLE 7: coefficienT of CorrelaTions BeTween Arrivals and WHolesale prices of Onion in rajasTHan for THe Period 2006 To 2016
Months Correlation coefficients (r)January 0.102February 0.282March 0.142April 0.525*May 0.787*June 0.586July 0.530August 0.133September 0.085October 0.562
Fig. 4: Seasonal index of wholesale prices of onion in Rajasthan
Months Correlation coefficients (r)November 0.375December 0.124
*Significant at 5 percent level .
Extent of problems faced by respondents in improving cultivation practices of onion
On-farm problems On farm constraints of onion growing farmers of the three districts of Rajasthan have been furnished in Table 8. Poor quality of seeds, non-availability of fertilizer, poor water quality, shortage of labour for cultivation practices, non-availability of organic/bio manure and effective pest and disease control measure have been major farm constraints in all the three selected districts. Poor water quality was found a major problem in Jodhpur district with 95 percent of respondents agreeing to it. Irrigation facility and organic manure availability were the major concerns reported by the respondents of Bilwara and Jodhpur districts. Thus, it can be concluded that water quality needs more attention as it is main natural input for agricultural production.

32 │ Agricultural Situation in India │ June, 2019
Articles
TABLE 8: on Farm ProBlems Faced By RespondenTs in Improved CulTivaTion PracTices of Onion
(N=1200)Sr. No. Problems
Banswara Bhilwara JodhpurYes No Yes No Yes No
1.High cost/ Poor quality of seeds
320 80 280 120 330 70(80) (20) (70) (30) (82.5) (17.5)
2.Non-availability of fertilizer in time
240 160 260 140 280 120(60) (40) (65) (35) (70) (30)
3.Insufficient water availability 130 270 110 290 60 340
(32.5) (67.5) (27.5) (72.5) (15) (85)
4.Poor water quality 320 80 340 60 380 20
(80) (20) (85) (15) (95) (5)
5.Lack of drip / sprinkler irrigation facility
160 240 200 200 310 90(40) (60) (50) (50) (77.5) (22.5)
6.Shortage of labour for cultivation practices
270 130 220 180 300 100(67.5) (32.5) (55) (45) (75) (25)
7.Non-availability of organic manure
180 220 310 90 240 160(45) (55) (77.5) (22.5) (60) (40)
8.Non-availability of bio fertilizers
100 300 80 320 90 310(25) (75) (20) (80) (22.5) (77.5)
9.Non-availability of effective pest control measure
210 190 260 140 230 170(52.5) (47.5) (65) (35) (57.5) (42.5)
10.Non-availability of effective disease control measure
260 140 240 160 230 170(65) (35) (60) (40) (57.5) (42.5)
11.Lack of knowledge about curing and drying of onion
180 220 210 190 240 160(45) (55) (52.5) (47.5) (60) (40)
Note: Percentage figures are given in parentheses.
Off-farm problems
The off farm problems were not faced while operating farm but they do come as soon as the farm operation ends. The present study showed that non-purchase
of onion by Govt. agencies was the major problem faced by farmers. The second major constraint for onion marketing was high fluctuation in market prices, followed by lack of storage facility and lack of awareness about crop insurance.
TABLE 9: off Farm ProBlems Faced By RespondenTs in Improved CulTivaTion PracTices of Onion (N=1200)
Sr. No. Problems
Banswara Bhilwara JodhpurYes No Yes No Yes No
1. Shortage of Storage 320(80)
80(20)
330(82.5)
70(17.5)
340(85)
60(15)
2. High Fluctuations in market price 360(90)
40(10)
310(77.5)
90(22.5)
330(82.5)
70(17.5)
3. Govt agency NAFED/ RAJFED do not purchase onion regularly
350(87.5)
50(12.5)
330(82.5)
70(17.5)
380(95)
20(5)
4. Lack of awareness about crop insurance
290(72.5)
110(27.5)
320(80)
80(20)
270(67.5)
130(32.5)
Note: Percentage figures are given in parentheses.

June, 2019 │ Agricultural Situation in India │ 33
Articles
4. Conclusion and Policy Implications
The study was planned to analyse yield gap, constraint and performance of onion crop in the study area. The main findings alongwith relevant suggestions are listed below:
a) There is shortage of storage facilities in the study area and the onion prices are low during the peak season. Therefore, it is suggested that proper storage facilities need to be created at major production centres.
b) Off farm problems comes as and when the product is brought to market during lean season in an attempt to garner higher prices. State and central cooperative agricultural marketing agencies should go for staggered/ phase wise purchase as onion is consumed throughout the year.
c) Onion crop is beset with high price fluctuations due to their unstable production. The trader’s cartels, weak supply chain and market inefficiencies also influence prices of onion. Market price is highly volatile due to lack of storage, transportation and processing facilities, aside from weather and institutional risks, there is a dire need of a policy mechanism to be in place both at glut and dearth of onion in the market. Awareness about the crop insurance was least chosen option that indicates the off-farm problem in all the states as most of the respondents are unaware of the insurance products available to them.
d) The study also revealed that the onion prices remained at lower ebb during harvesting/peak period and high during lean period. Due to lack of storage facilities in case of onion most of the farmers preferred to dispose of their produce immediately after harvest (distress sale), which resulted in low prices on offer for onion. Hence, there is a need to develop adequate post-harvest infrastructure facilities for this crop in order to protect farmers from undue low prices for their produce. This will also benefit off season price inflation and consumer uproar.
e) Cost and returns are viable options to know profitability of an enterprise. Amongst various costs, the cost of harvesting and curing were found to be highest in the study area. Hence it is suggested that technological innovation in
mechanisation of harvesting and setting up of the cold storage units on PPP/ cooperative mode be pursued vigorously in order to stabilise the seasonal price fluctuation.
f) Returns per hectare were quite good and were found to be profitable in cost and return analysis. The present study reveals higher cost of production due to higher labour and input costs.
g) It was found that various physical, biological, socio-economic and institutional factors are responsible for yield gaps. This can be effectively improved through participatory research at different levels, contract farming and government attention. With greater push towards eNAM and digital literacy, markets can also be a driver for technological dissemination.
h) Trend of wholesale onion prices over past decade has indicated the uniform pattern of onion prices since 2006 till date except once in 2011 when a sudden decrease was observed followed by slight increase in 2012. Year 2013 also marked the highest price year in the trend. Further, the trend of prices showed swinging pattern of decreasing- increasing- decreasing trend in the year 2014, 2015 and 2016, respectively. This analysis revealed that policy instruments did not work well and market intelligence efforts need to be geared up.
i) Onion prices typically exhibit a seasonal trend. The trend in most of the states suggests that prices peaked between February-March, and September-October months. Government mechanism/institutions and other functionaries need to come forward to store the onion so that it can be released in off season when prices peak. Moreover, hoarding by private market players needs to be curbed.
REFERENCES
Agarwal, N. L., and Dhaka, J. M., 1998, Relationship between arrivals and prices of spice crops in Rajasthan. Ind. Jour. Agril. Mktg., 12(3 : 152-153)
Agricultural prices - analysis and policy. Ed. Sr.Sr. Acharya and N. L. Agarwal, Oxford & IBH Publishing Co. (PI Ltd., New Delhi. 1994.)
Alberda, T., 1962. Actual and potential production of

34 │ Agricultural Situation in India │ June, 2019
Articles
agricultural crops. Neth. J. Agric. Sci. 10, 325–332.
Chengappa, P.G. A.V. Manjunatha, VikasDimble and Khalil Shah (2012), „Competitive Assessment of onion Markets in India, Agricultural Development and Rural Transformation Centre Institute for Social and Economic Change, Bangalore, India.
Durgavati,W.; Rajput,A.M. and Saraf,G.P. (2005). Economic analysis of potato and onion in Malwa region of Madhya Pradesh. Research link. 38(3):77- 79.
Gadre, A. V., Talathi, J. M., and Wadkar, Sr.Sr., 2002. Price spread in marketing of white onion in Raigad district of Maharashtra state. Agril. Mktg., (October- December: 22-26)
Gadre,A.V.; Talathi,J.M. and Wadkar,Sr.Sr. (2002). Price Spread in marketing of white onion in Rajgad district of Maharashtra State. Agricultural Marketing. XLV: 3.
Kainth, G. Sr. and Mehra P. L., 1988. Seasonality pattern of market arrival and prices of potatos in Punjab. Ind. Jour. Agril. Mktg., 2 (113 - 120)
Katare, Subhash, Pandey, Sr.K. and Mustafa, Mohd. (2011). yield gap analysis of rapeseed– mustard through front line demonstrations. Agric. Update, 6 (2) : 5-7.
Kiresur,V.R.; Hiremath,K.C. and Kumar,H.Sr.V. (1993). Costs-returns profiles in vegetable production - a case study in Dharwad district. Karnataka Journal of Agricultural Sciences. 6(1):74-76.
Laborte, A.G., De Bie, C.A.J.M., Smaling, E.M.A., Moya, P.F., Boling, A.A., Van Ittersum, M.K., 2012. Rice yields and yield gaps in Southeast Asia: past trends and future outlook. Eur. J. Agron. 36, 9–20. Horticulture Statistics (2016) Division, DAC&FW
National Horticultural Research and Development Foundation (NHRDF) http://www.nhrdf.com/contentPage.asp?sub_section_code=104, Dated: 25 November 2012.
Pajankar, D. Sr., Aslokar, G. D., Pajankar, V. D.,
Lanjewar, A. D., and Yerne, A. Z., 2000. Economics of production and marketing of onion. Jour. soils crops. 10(131-135)
Parthasarathy, P. B., Rammohan, V. and Hemachandra, P. K., 1988. Price behavior of vegetables in Hyderabad markets. Ind. Jour. Agril. Mktg., 2(124-155)
Peter, Sr.F.(1996) “onion production in the tropics” American Journal of Agricultural
Pramanic,Sr.C.; Ganesh Kumar,B.; Shakila Nawaz and BalkriShan,M. (2003). Economics of production and marketing of vegetables in Andaman and Nicobar Islands. Annuals Agric. Res.New series. 24(4):776-781.
Purse glove, J.W. (2000) Tropical Crop Monocotyledons. Longman Group Limited, 407p.
Shah, D., 1999. An economic evaluation of onion production and its marketing in Maharashtra. Ind. Jour. Agril. Mktg., 3 (11-20)
Sharma, M. D., Neupane, K. R., Thapa, R. B., ShakyaSr. M., and Pokhrel, R. R. (1994) . Effect of sowing date on yield performance of four onion cultivars. F. P. Neupane (eds.) IAAS Research Reports, 1992-1993. TU, IAAS, Directorate of Research, Rampur, Chitwan, Nepal, pp. 61-63.
Shiskin, J., 1958. Decomposition of time series. Science. (1539-1546)
Sidhu, J. Sr. and Chahal, Sr.Sr., 1988. Price behavior of vegetables in Punjab. Ind. Jour. Agril. Mktg., 2 (1: 121)
Singh, J., Kumar, Sr., and Grover, D. K., 1993. Behavioural analysis of market arrivals and prices of potato in Punjab. Agril. Mktg., 3 (34-42)
Singh.M.K. (2005). Economics of production and marketing of vegetables in Madhya Pradesh, India. International Journal of Rural Studies. 12(2): 11-23.
Thakur, D. Sr. and Singh, N., 1971. Market supply and price of onion in Ludhiana and Panipat market of Punjab and Haryana. Agril. Mktg., 13(4 : 11-16)

June, 2019 │ Agricultural Situation in India │ 35
Agro-Economic rEsEArch
Agro-Economic Research
decision-orienTed informaTion sysTem for farmers: a sTudy of Kisan call cenTres, Kisan Knowledge managemenT sysTem, farmers porTal and m-Kisan porTal in punjaB*
d K grover, arjinder Kaur, sanjay Kumar and j m singH
*Agro-Economic Research Centre, Punjab Agricultural University, Ludhiana.
1. Introduction
Transition of agriculture sector from subsistence to commercial has not only made it input intensive, but also information intensive, in wake of ever changing technologies, practices, etc. In recent times, access to information has become a key to decision making in every aspect of life. Same is true to agriculture.
Different sources of information are used by the farmers to run their farming business in a profitable manner. Recent advancement in Information and Communication Technologies (ICT) have also ventured into it. In addition to traditional sources like fellow farmers, friends, input dealers, gadgets like radio, television, print material, modern tools like mobile, computers and internet connectivity are also emerging in a big way, in providing information to farming community on various aspects of decision making. So, the need is to provide the right advice, at the right time specially in a state like Punjab, passing through an agrarian crisis. Here, the profit margins have been dwindling since the last two decades due to rising input cost, stagnant yields leading to rising indebtedness and even farmers' suicides. Sharing of latest information about agricultural aspects can make the situation sustainable. The usage of ICT is a welcome step in this direction. It involves Government of India initiatives like Kisan Call Centres (KCC), Kisan Knowledge Management System (KKMS), Farmers Portal and M-Kisan Portal aimed at filling the information gaps. Government of India has set up 25 KCCs in different states of India to answer the queries of farmers free of cost instantly on a continuous basis.
Chandigarh based KCC is one of these centres catering to three states, i.e., Punjab, Haryana and Himachal Pradesh. Against this background, the present study was devised to bring out the decision oriented information system for farmers in the form of structure, design, implementation and performance of government system of KCC, KKMS, Farmers Portal and M-Kisan Portal. It would highlight the extent of
use of the system, responses given, performance of it and its’ impact on decision making. The specific objectives of the study were:
1) To know the organized set up, infrastructure, information and communication technology (ICT) and systems used, methods and information flows, types and abilities of the manpower involved.
2) To record the use of systems-the profile and patterns of the users, the extent of use of the system, and the responses given.
3) To analyze the performance of the systems from the point of view of users, its impact on decision making and gap between information delivered and sought.
4) To highlight the suggestions of users to make the system more effective in serving the agricultural sector.
2. Methodology
The present study was based on primary data collected through both census and sample survey methods. At first step, information about different aspects of KCC like infrastructure available, staff, facilities efficiency of call answering system, call handling system, etc., was collected through personal interview of the centre in charge. At second step, all the Farmer Tele Advisors (FTAs) answering the farmers queries were taken through census survey method and covered their profile, assessment about hardware and software being used, sources of information and knowledge, call answering efficiency, quality ratings of infrastructure available, etc. At the third step, farmers level data was collected through random sampling technique. Three districts were randomly selected, namely, Mansa, Moga and Sangrur. Then a sample of 100 KCC users and 20 non-KCC users were randomly selected from cluster of villages in each selected district. The farmers were asked

36 │ Agricultural Situation in India │ June, 2019
Agro-Economic rEsEArch
about their personal profile, sources of information related to agriculture, the use of ICT devices, specific queries from KCC, the responses, focus on important decisions in farming, impact of KCC on decision making, etc. The data was then analyzed with the help of simple statistical techniques.
3. Results and Discussion3.1. Performance assessment of KCC, Punjab
The results of Kisan Call Centre (KCC) at Chandigarh showed that since 2012, it has been working under IFFCO Kisan Sanchar Limited. As per the centre staff, the hardware works well and can handle the call load without frequent breakdowns. The software being used was also rated good with adequate database to answer the queries. Internet connectivity at the centre was found to be good and speed was sufficient even during heavy call loads. Regarding infrastructure availability like sufficient activity area, ventilation, privacy to handle the calls, etc., centre staff was found to be satisfied. As per centre in charge, FTAs were efficient to handle the calls and respond quickly, were well trained and, disciplined. Self- knowledge, extension material of various departments and training acquired at Agricultural University were frequently used by FTAs to answer the farmers’ queries and these sources were rated good by the respondent. FTAs were seeking help from various websites/portals while responding to the farmers. So, overall assessment of centre in charge was that farmers were satisfied with call handling system. The call escalation at the centre was found to be rare, that too only up to level 2, but never to level 3. It was agreed that information related to technical, price and market information aspects was adequate and up-to-date, but not on government related schemes. Overall, respondent rated the performance and usefulness of KCC as good, but systems and policies of KCC as satisfactory and was strongly in favour of continuation of the system.
3.2. Comments of KCC in charge
1. Need to give a pay hike to the staff.
2. Shortage of staff especially during kharif season.
3. Staff should be regularly updated about government schemes like prices, subsidies, insurance, etc.
4. There were ten help lines at KCC and need was expressed for four more lines to tackle the call load. Due to heavy call traffic, 39 per cent of calls could not be handled.
5. Timely information should be provided about trainings of the staff and some practical training should also be incorporated.
6. Headphones must be replaced after three months.
7. Downloading speed of information was reported to be slow.
8. Call escalation response at level – 2 was not satisfactory about animal husbandry activity.
9. Meals break should be of 30 minutes.
10. No automatic delivery of text messages.
3.3. Analysis of Farmer Tele Advisors (FTAs), KCC, Punjab
Farmer Tele Advisors working at KCC, Chandigarh were mostly agricultural graduates, while two were post graduates. These rated the hardware being used as good except for the headphones. The software being used was also found to be up-to-date, user friendly, adequate to take call load, but low on voice quality. FTAs agreed that internet connectivity at the centre was fast enough to respond to the queries and was adequate to work. Self knowledge was the main source of information to respond by FTAs, followed by extension material and prepared excel sheets. The material used by FTAs related to government departments was reported as outdated. FTAs at the centre agreed that information pertaining to technical, price and market related aspects was easily reliable, up- to-date and adequate, but not related to government schemes. The websites/portals related to agriculture were frequently searched by FTAs to answer the questions. FTAs found KKMS to answer the questions. FTAs found KKMS easy to use, but not fast enough. Similarly, Farmers Portal was found to be useful by them, but not regularly updated. M-Kisan Portal was working well as per the respondents. Majority of FTAs were found to be satisfied with call efficiency system, but were doubtful about farmers' capability to understand scientific terms. Overall, these were satisfied with their performance and found the trainings at Agricultural University useful.

June, 2019 │ Agricultural Situation in India │ 37
Agro-Economic rEsEArch
However, these seemed to be partially satisfied with available knowledge, information and data-base to answer the queries. The overall assessment of FTAs about KCC was found to be good and majority agreed that the scheme was useful to the farmers and should be continued.
3.4. Comments of FTAs
Farmers Tele Advisors working at KCC gave an overall 'good' rating to its performance. These were of the opinion that they try their best to satisfy the farmers’ queries. As per FTAs, it was a reliable source of information and was helpful to the farmers. So, according to them, this service should be continued and strengthened.
3.5. Problem faced by FTAs
The problems were mainly with the service rules like less salaries, no provision of even sick leave, lesser holidays, contractual job, lesser training for upgrading self knowledge, early timings, etc.
3.6. Suggestions
1. FTAs suggested a change in the name of service, i.e., instead of KCC, some technical nomenclature related to agriculture should be there.
2. The designation and salary should be refined to boost their morale.
3. Training facilities should be increased.
4. Infrastructure facilities – need was expressed for better drinking water facility, canteen, one more air conditioner and room heaters in winters for early morning and late night shifts.
5. Salary hike would attract better talent to the field.
6. Provision of casual leaves and holidays on festivals.
4. Results of Farmers’ Sample Survey
Transformation of agriculture in Punjab state in wake of Green Revolution has increased the availability of options to the farmers. So, planned decisions based on up-to-date information on all aspects have become vital for the farmers. Kisan Call Centre is a step to assist them in decision making. A random sample for
100 KCC users was selected for the study. Majority of these farmers had attained education upto higher secondary and illiterate percentage was only 2. The highest proportion of KCC users was between the age brackets of 40-50 years. Average number of calls to KCC per farmer was 6-7 in a year. Main interest area of these was about technical aspects with 79 per cent of queries related to it, followed by queries about weather with 19 per cent of total questions. Sampled farmers were tapping various sources and devices of information to seek advice about farming related matters. It was found that though the sample was of KCC users, but still traditional sources like fellow farmers, Kisan melas, farmers meets were of importance to them. Among modern devices, mobile phone was most frequently used to get information. However, awareness about agriculture related websites/portals was almost lacking among the sampled farmers. The quality rating of information provided by agricultural experts, kisan melas, KCC and Agricultural University scored high with the farmers. Mobile phone was the most frequently used gadget by these to access KCC and was rated as good, but use of other devices was found to be low. 75 per cent of sampled farmers agreed that overall call handling and efficiency was good at KCC and information provided was useful. The response of KCC to technical, weather related, price and market related aspects was rated as good by the sampled farmers, but not for government related schemes and animal husbandry aspects. The major focus of sampled farmers in farming was found to be on commercial aspects like higher profits/income/prices of the output along with its marketability. Other objectives like environment related/health/safety/sustainability were not the thrust areas of state farmers. So far as impact of KCC on important decisions was concerned, it was maximum on insect pest control followed by disease control and weather/rainfall related decisions. Small impact was also observed in variety selection and fertilizer application decisions. The queries related to majority of other farming decisions were never put forth by the sampled farmers. Overall assessment of KCC users about its performance was good/satisfactory and same for other aspects like response and efficiency of KCC and quality of information provided by it. But majority users were of the opinion that scheme should be improved and continued, it being an alternative, instant and free of cost source of information. However, the farmers found it a time consuming process and started getting regular SMS alerts on various aspects of farming.

38 │ Agricultural Situation in India │ June, 2019
Agro-Economic rEsEArch
Farmer Tele advisors complained about low salaries and less number of leaves as well as lack of some other facilities like canteen, room heaters etc. Four more help lines were needed to handle the call traffic as per the centre in charge.
The sample of non-KCC users were found to be relying more on traditional sources like fellow farmers, television, advice of agricultural experts/Agricultural University, etc., and were found to be less aware about KCC or other decision making systems like KKMS/Farmers Portal/M-Kisan Portal, etc. Though these were using modern devices like mobile phone, computers and internet but were not exploring for agricultural information on these systems. Lack of awareness and easy access to other sources of information seems to be the reason behind this.
4.1. Positive aspects about KCC as per the perception of users
Sampled farmers seem to be satisfied with performance of KCC to some extent, as they gave a moderate response. The existence of KCC, was an option to enquire about agricultural aspects at their convenience, and free of cost. So, these were of the opinion that KCC is providing reliable and helpful information to farmers especially on technical and weather related aspects as well as for new crop practices. So, in a way some aspects of decision making have shown positive impact of KCC like insect –pest control, disease control, variety selection, fertilizer application and weather. Sampled farmers found FTAs cooperative courteous and knowledgeable in answering their queries. Thus, it was found that sampled KCC users were taking it as an additional source of information, though not highly satisfied with it.
4.2. Negative aspects about KCC as per the perception of users
The problems faced by sampled farmers have shown that some find it a time consuming process. As has been discussed earlier, call traffic at the centre is high, so farmers often find the toll free number busy, though once through call pick-up time was not much. KCC is a telephonic service, but sampled farmers expect regular SMS alerts. This has emerged as a major limitation for the sampled farmers. While undertaking the survey, it also came to fore
that awareness about KCC service was low. Many farmers never knew about its existence or toll free number. Few farmers complained that information provided was outdated or different from mentioned in literature. The recommended pesticides by FTAs were not available in the market. Few farmers were of the opinion that FTAs lack practical knowledge and were not updated. Sometimes the recommendations were not very effective. One per cent were of the view that only basic guidance was provided by KCC. It was reported by the sampled farmers that information pertaining to government related schemes and allied activities like vegetable cultivation, animal husbandry was lacking on part of FTAs and they were not able to respond satisfactorily.
5. Suggestions by the sampled farmers
1. The main suggestion emerged from analysis was that more awareness should be generated about the KCC service.
2. Regular SMS alerts about different aspects of agriculture should be part of the service, so that farmers can prepare for the situation in advance.
3. FTAs should be more trained with practical knowledge and regularly updated.
4. Technical up gradation of KCC should be undertaken, to reduce the calling time.
5. Up-to-date information should be available regarding government schemes and policies as well as allied activities.
6. Implications of the study
1. The technical staff at KCC, Chandigarh as well as respondent farmers found the scheme useful as an alternative source of information. So, the scheme should be strengthened and continued.
2. Awareness about the KCC facility was found to be less during the farmers’ survey. It needs to be increased through mediums like radio, television, newspapers and during kisan melas/meets, etc.
3. Training facilities for FTAs should be increased to equip them in better way about all aspects of agriculture and allied activities especially in

June, 2019 │ Agricultural Situation in India │ 39
Agro-Economic rEsEArch
animal husbandry aspects.
4. Facilities at the centre and to the FTAs like higher wages, security of job, etc., should be provided to improve the efficiency of the scheme.
5. Aspects related to government schemes, marketing of produce, etc., should be given more stress in trainings of FTAs and information needs to be regularly updated for better response on their part.

40 │ Agricultural Situation in India │ June, 2019
Agro-Economic rEsEArch
impacT of neem coaTed urea on producTion, producTiviTy and soil HealTH in india*
K.B. ramappa and a.v. manjunaTHa
1. Introduction
Considering the importance of agriculture in meeting the increasing foodgrain requirements of the growing population of the country, fertilizers, as an input in agriculture production, assume greater significance in terms of ensuring sufficient foodgrain production. However, an overuse of fertilizers in general and urea in particular, over time, has affected soil quality, resulting thereby in a gradual reduction in yield levels across the country. Urea is one of the most prominent fertilizers, which alone accounts for 57 percent of the total fertilizer consumption in the country. The continued efforts of researchers have led to the development of Neem Coated Urea (NCU) which helps increasing Nitrogen Use Eficiency (NUE) in crops. Neem has proved to be a significantly superior material as compared to other bio-coatable agents on account of its agronomic traits which are very supportive of plant growth, yield, grain and straw yields, nitrogen uptake and recovery. There are added advantages associated with NCU use relative to Normal Urea (NU) in terms of a slow release of urea, prevention of unabsorbed nitrogen from leaching into ground water aquifers or air besides improving the fertilizer (NPK) use efficiency.
Earlier, because of the fast nitrogen-releasing property of NU, the subsidized urea was diverted from agricultural purposes to industrial uses. However, this diversion of NU appears to have completely stopped in view of an abundant supply of NCU in the market during the reference period (Kharif, 2015).
Recognizing the potential benefits associated with NCU relative to NU, the Ministry of Agriculture and Farmers Welfare (MoA & FW), Government of India, included NCU in the Fertilizer Control Order (FCO) since July 2004 and subsequently made the production and distribution of NCU mandatory from 25th May, 2015. Further, the Government of India launched the Soil Health Card Scheme (SHCS) on 19th February, 2015, with a focused attention on improving the soil quality through a judicious use of fertilizers.
*Agricultural Development and Rural Transformation Centre, Institute for Social and Economic Change, Bengaluru - 560 072
In order to explore the impact of NCU on production, productivity and income across select states of India and also to understand the status and implementation the SHC scheme, the Integrated Nutrient Management division of the MoA & FW entrusted a study to Agricultural Development and Rural Transformation Centre (ADRTC), Institute for Social and Economic Change (ISEC), Bengaluru. With this background in view, the following objectives were addressed in this study:
1. To study the trends in usage and pricing of Urea and NCU.
2. To analyse the adoption behaviour of NCU farmers under irrigated and rainfed conditions.
3. To analyse the impact of NCU, use on yield and income.
4. To document the status and implementation of the Soil Health Card Scheme.
2. Data
The present study relied upon both the primary and secondary data collected from six states, namely, Karnataka, Maharashtra, Madhya Pradesh, Bihar, Punjab and Assam for Kharif 2015. In the first stage, the crops occupying highest area under irrigated and rainfed conditions in the respective states were considered as a criterion for the selection of crops. Accordingly, six crops - paddy, tur/ redgram, sugarcane, maize, soyabean and jute were considered for the study. Of the six crops selected, paddy, sugarcane and jute were irrigated crops while maize, soyabean and tur/red gram were rainfed crops. In the next stage, two districts were selected based on the gross cropped area in each selected sample state. Overall, 200 sample farmers for each crop were selected for the study. The sample was post classified into two groups, namely, NCU users and non-users (Normal Urea users- NU) and information was collected using a pre-tested questionnaire.

June, 2019 │ Agricultural Situation in India │ 41
Agro-Economic rEsEArch
3. Major findings
The major findings of the study are as follows:
i. The Secondary data based results indicate an increase in consumption and price of urea at an annual rate of two percent for the period from 2006-07 to 2015-16. The rising prices of Diammonium Phosphate (DAP) and Muriate of Potash (MOP), as compared to those of urea, are considered one of the main reasons for an imbalanced usage of NPK fertilizers.
ii. Except the case of tur/ red gram, nearly 70 percent of the farmers growing all the reference crops are aware of the availability of NCU in the market. Although they have been using NCU since long, a majority of them are not aware of the potential benefits associated with NCU use relative to NU. On the other side, the main sources of information on NCU happen to be the Department of Agriculture, followed by input suppliers and fellow farmers. More importantly, the awareness level is very low among the rain-fed farmers as compared to irrigated farmers.
iii. A comprehensive adoption of NCU by farmers across states and crops is not found among the selected households with respect to Kharif 2015 which could be due to various reasons such as undue delays in the supply and distribution of NCU, availability of old NU stock with input dealers, drought and uneven climatic factors prevailing across the country.
iv. Leaf-figure (symbol) on the bag, colour and price-difference are the major indicators for farmers in differentiating between NCU and NU.
v. Only a small proportion of farmers has undergone trainings in the optimal application of fertilizers; and the State Department of Agriculture is the major organizer of trainings for farmers.
vi. Farmers’ perceptions reveal that the quality of NCU supplied is good, adequate, and is timely available, easily accessible in the market besides being evenly distributed.
vii. As regards the benefits of NCU, relative to NU, a majority of the sample farmers have observed
an improvement in the yield levels with respect to all crops and their by-products; however, different responses are observed in respect of the cost of pest and disease control and weed management; and there is no change in the cost of NCU as well as of other fertilizers in the context of the application of NCU in place of NU.
viii. Nearly 52 percent of tur farmers and 61 percent of paddy farmers have found an improvement in the soil health characteristics such as soil texture, soil moisture retention, water infiltration and soil softness and water infiltration, while a reduction in soil compaction post-NCU application.
ix. An improvement in soil quality post the application NCU has been clearly reflected in the incremental increase in yield levels of main product and by-product with regard to reference crops as noticed by 98 percent of sugarcane farmers, 63 percent of jute farmers, 40 percent of paddy and tur farmers each, 18 percent of maize farmers and four percent of soybean farmers. The increase in yield is to an extent of 38 percent (1.46 quintal/acre) in soybean, 34 percent (0.90 quintal/acre) in tur, 8 percent each (1.62 and 1.87 quintal/acre) in paddy and maize, 5 percent (26 quintal/acre) in sugarcane and 3 percent (0.26 quintal/ acre) in jute crops. However, in the case of by-products, an increase in yield has been observed with respect to paddy (3%=0.82 quintal/acre), tur/red gram (23%=0.45 quintal/ acre) and soybean (11%=0.80 quintal/acre), while there is no change observed in respect of jute, maize, and sugarcane reference crops.
x. A highest incremental yield of paddy is noticed in the case of Madhya Pradesh (17%=2 quintal/ acre), while the lowest in the case of Punjab (1%=0.28 quintal/ acre). With respect to tur, both the highest main product (56%=1.8 quintals/ acre) and by-product (71%=1 quintal/ acre) yields are observed for Maharashtra.
xi. An increase in the cost to an extent of four percent in respect of paddy and one percent in respect of maize has been reported. Conversely, while a reduction in cost is noticed in the case of soybean (6%) and jute (2%). Further, a reduction in the cost of pest and diseases
42 │ Agricultural Situation in India │ June, 2019
Agro-Economic rEsEArch
control and weed management has been noticed in respect of paddy, jute, maize and soybean post-adoption of NCU, whereas, these costs show an increase with respect to tur and sugarcane.
xii. A partial budget based results indicate highest incremental income in the case of tur (Rs.14940/acre), followed by sugarcane (Rs.5313/acre), soybean (Rs.2817/acre), paddy (Rs.2430/acre), jute (Rs.615/acre) and maize (Rs.363/acre) crops. Accordingly, the benefit- cost ratio works out to 10.21, 10.11, 4.28, 3.46 and 1.21 for the respective crops in the order of magnitude post-adoption of NCU.
xiii. A significant impact to be noted is that the diversion of NU to other than crop production purposes is negligible among the farmers and in fact, it has completely stopped post introduction of NCU.
xiv. Lack of awareness regarding the potential benefits associated with NCU use (100% in Madhya Pradesh and one-fourth in Assam and Karnataka) and high prices of NCU (95% in Punjab, 45% in Karnataka and 19% in Madhya Pradesh) are the major problems voiced by the farmers across states and crops.
xv. Under the SHC scheme, the achievement of targets in terms of sample testing and distribution of SHCs is limited to 50 percent of the total sample collection, due to the lack of infrastructure facilities. This might be the reason for the delay in the distribution of SHCs to farmers.
xvi. Major sources like the State Department of Agriculture and KVKs are involved in creating awareness among farmers on the SHC scheme even as a majority of the sugarcane farmers in Maharashtra are reported to have gathered information from officers with sugarcane factories.
xvii. Nearly half of the soil-tested-farmers have received SHCs on time, but only a few of them have partially followed the recommended doses of fertilizers application.
4. Policy Suggestions
Policy suggestions have been drawn based on the findings of the study and are presented under the following sub-headings:
4.1. Policy Suggestions on NCU
i. The increase in crop yield levels of reference crops reflects the potential of NCU use. In order to realize the full potential of NCU, awareness should be created among farmers regarding an optimal use of NCU in order to realize maximum possible yield levels.
ii. There is a need for re-estimating the recommended doses of fertilizers, while keeping in view the neem-coated urea and its further inclusion in the package of practices.
iii. There is a need for addressing the concerns voiced by NCU users about its quality, availability, adequacy, timely supply and price through a planning and regulation.
iv. Special efforts on the part of the government are needed for ensuring a uniform pricing of NCU throughout the country as well as reduction in the price of NCU, as expressed by farmers and other stakeholders.
v. The policy of mandatory production and distribution of NCU should be continued as its use helps improve soil health and crop productivity.
4.2. Policy Suggestions on SHC Scheme
i. Special training programmes/ camps/ demonstrations should be organized by the various stakeholders (SAUs, KVKs, SDAs, Private Companies) as part of educating the farmers regarding soil sampling, benefits of soil testing, balanced use of chemical fertilizers and knowledge about SHC recommendations.
ii. There is a need for capacity building of the field level staff, providing required facilities and equipments such as Soil Test Laboratories (STLs), manpower, high quality instruments/devices for a successful implementation of the SHCs Scheme in the sample states.
iii. The major field level staff shared the GPS available with the mobile does not work

June, 2019 │ Agricultural Situation in India │ 43
Agro-Economic rEsEArch
properly due to network and visibility problems during the day, as no GPS devices have been distributed to them. Hence, they are not able to collect the samples as per the procedures and targets set.
iv. A majority of the farmers across states and crops have reported delays in the distribution of soil testing reports/ soil health cards as the major problem facing the soil testing programmes, including SHC Scheme. As a result, farmers lose their confidence in these programmes. Therefore, timely distribution of SHCs (before sowing season) in hard copy and educating farmers on the information available with SHCs should be promoted for adoption of recommended doses of fertilizers on the basis of soil test reports.
v. A majority of the farmers have not treated SHC as an important document when it comes to testing their soil systems. Hence, there is a need for educating the farming community regarding the importance of soil health, benefits of soil testing, cards/ reports, and the information on SHCs, knowledge about SHC recommendations as part of encouraging farmers to make a judicious/ balanced use of chemical fertilizers.
vi. Gram Panchayats should be involved in undertaking soil testing campaigns on a war footing alongside the department of agriculture for a proper and better implementation of the soil health card scheme.

44 │ Agricultural Situation in India │ June, 2019
Commodity Reviews
Procurement of Rice The total procurement of r ice during khari f market ing season 2018-19 up to 30 .04 .2019 is 39 .28 mil l ion tonnes as against 32 .66
mil l ion tonnes during the corresponding per iod of last year . The detai ls are given below:
procuremenT of rice(In Thousand Tonnes)
State
Marketing Season2018-19
CorrespondingPeriod of last Year
(upto 30.04.2019) 2017-18
Procurement Percentage to Total Procurement Percentage to Total
1 2 3 4 5
Andhra Pradesh 3225.10 8.21 3164.51 9.69
Chhatisgarh 4080 10.39 3206.86 9.82
Haryana 3909.40 9.95 3992.17 12.22
Maharashtra 1653.23 4.21 35.92 0.11
Punjab 11334.01 28.86 11838.78 36.25
Tamil Nadu 1145.06 2.92 684.78 2.10
Uttar Pradesh 3232.99 8.23 2874.58 8.80
Uttarakhand 3403.53 8.67 1780.03 5.45
Others 7295.53 18.57 5079.67 15.55
Total 39278.85 100.00 32657.30 100.00
Source: Department of Food & Public Distribution.
COMMODITY REVIEWS
Foodgrains

June, 2019 │ Agricultural Situation in India │ 45
Commodity Reviews
procuremenT of wHeaT
(In Thousand Tonnes)
State
Marketing Season2019-20
(upto 30.04.2019)
CorrespondingPeriod of last Year
2018-19
Procurement Percentage to Total Procurement Percentage to Total
1 2 3 4 5
Haryana 7330.52 37.38 7906.49 29.71
Madhya Pradesh 3346.31 17.06 4687.36 17.62
Punjab 7555.44 38.53 11319.02 42.54
Rajasthan 433.58 2.21 901.20 3.39
Uttar Pradesh 914.84 4.67 1723.66 6.48
Others 29.94 0.15 70.25 0.26
Total 19610.63 100.00 26607.98 100.00
Source: Department of Food & Public Distribution
Procurement of Wheat The total procurement of wheat during rabi marketing season 2019-20 up to 30.04.2019
is 19.61 million tonnes as against 26.61 million tonnes during the corresponding period of last year. The details are given below:
46 │ Agricultural Situation in India │ June, 2019
Commodity Reviews
Oilseeds
The Wholesale Price Index (WPI) of nine major oilseeds as a group stood at 147.8 in April, 2019, showing an increase of 1.6 percent over the previous month. However, it increased by 6.8 percent over the previous year.
The WPI of all individual oilseeds showed a mixed trend. The WPI of groundnut seed (2.1 percent) cotton seed (2.6 percent), niger seed (5.7 percent) safflower (8.5 percent) and soybean (3 percent) increased over the previous month. However, the WPI of rape and mustard seed (-0.9 percent), copra (coconut) (-2.7 percent), gingelly seed (sesamum) (-1.8 percent), sunflower (-1.7 percent) decreased over the previous month. Manufacture of Vegetable and Animal Oils and Fats
The WPI of vegetable and animal oils and fats as a group stood at 113.2 in April, 2019, which shows a decrease of 0.9 percent over the previous month. Moreover, it decreased by 5 percent over the corresponding month of the previous year. The WPI of rapeseed oil (1.5 percent) and cotton seed oil (0.3 percent) increased over the previous month. However, the WPI of mustard oil (-2 percent), soybean oil (-0.6 percent), sunflower oil (-0.3 percent), groundnut oil (-8.9 percent), copra oil (-3.2 percent) decreased over the previous month.
Fruits & Vegetable
The WPI of fruits and vegetable as a group stood at 164.7 in April, 2019, showing an increase of 14.1 percent over previous month and an increase of 15.3 percent over the corresponding month of the previous year.Potato
The WPI of potato stood at 141.5 in April, 2019, showing an increase of 7 percent over the previous month. However, it decreased by 17.2 percent over the corresponding months of the previous year.
Onion
The WPI of onion stood at 118.4 in April, 2019, showing an increase of 9.6 percent over the previous month and a decrease of 3.4 percent over the corresponding months of the previous year.
Condiments & Spices
The WPI of condiments and spices (group) stood at 127.4 in April, 2019, showing an increase of 1.5 percent over the previous month and an increase of 0.2 percent over the corresponding months of the previous year.
The WPI of black pepper and turmeric increased by 0.7 percent and 0.9 percent, respectively, over the previous month. However, the WPI of chillies (dry) decreased by 1 percent over the corresponding months of the previous year.
Raw Cotton
The WPI of raw cotton stood at 125 in April, 2019, showing an increase of 6.7 percent over the previous month and an increase of 21.5 percent over the corresponding months of the previous year.
Raw Jute
The WPI of raw jute stood at 197.3 in April, 2019, showing a decrease of 2.6 percent over the previous month and an increase of 18.8 percent over the corresponding months of the previous year.
Commercial Crops
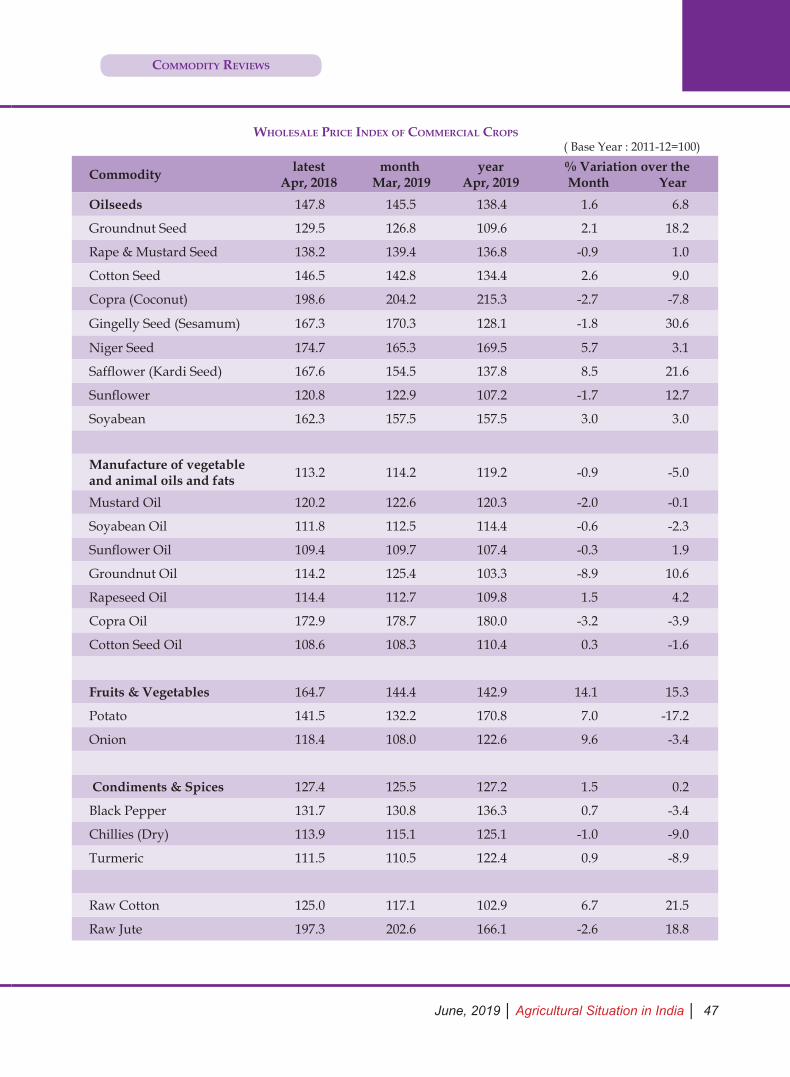
June, 2019 │ Agricultural Situation in India │ 47
Commodity Reviews
wHolesale price index of commercial crops ( Base Year : 2011-12=100)
Commodity latest Apr, 2018
month Mar, 2019
year Apr, 2019
% Variation over the Month Year
Oilseeds 147.8 145.5 138.4 1.6 6.8
Groundnut Seed 129.5 126.8 109.6 2.1 18.2
Rape & Mustard Seed 138.2 139.4 136.8 -0.9 1.0
Cotton Seed 146.5 142.8 134.4 2.6 9.0
Copra (Coconut) 198.6 204.2 215.3 -2.7 -7.8
Gingelly Seed (Sesamum) 167.3 170.3 128.1 -1.8 30.6
Niger Seed 174.7 165.3 169.5 5.7 3.1
Safflower (Kardi Seed) 167.6 154.5 137.8 8.5 21.6
Sunflower 120.8 122.9 107.2 -1.7 12.7
Soyabean 162.3 157.5 157.5 3.0 3.0
Manufacture of vegetable and animal oils and fats 113.2 114.2 119.2 -0.9 -5.0
Mustard Oil 120.2 122.6 120.3 -2.0 -0.1
Soyabean Oil 111.8 112.5 114.4 -0.6 -2.3
Sunflower Oil 109.4 109.7 107.4 -0.3 1.9
Groundnut Oil 114.2 125.4 103.3 -8.9 10.6
Rapeseed Oil 114.4 112.7 109.8 1.5 4.2
Copra Oil 172.9 178.7 180.0 -3.2 -3.9
Cotton Seed Oil 108.6 108.3 110.4 0.3 -1.6
Fruits & Vegetables 164.7 144.4 142.9 14.1 15.3
Potato 141.5 132.2 170.8 7.0 -17.2
Onion 118.4 108.0 122.6 9.6 -3.4
Condiments & Spices 127.4 125.5 127.2 1.5 0.2
Black Pepper 131.7 130.8 136.3 0.7 -3.4
Chillies (Dry) 113.9 115.1 125.1 -1.0 -9.0
Turmeric 111.5 110.5 122.4 0.9 -8.9
Raw Cotton 125.0 117.1 102.9 6.7 21.5
Raw Jute 197.3 202.6 166.1 -2.6 18.8

48 │ Agricultural Situation in India │ June, 2019
Commodity Reviews
Statistical Tables Wages
1. daily agriculTural wages in some sTaTes (caTegory-wise)(In Rs.)
State District Centre
Mot
h &
Yea
r
Dai
ly N
orm
al W
orki
ng
Hou
rs
Fiel
d La
bour
Oth
er A
gri.
Labo
ur
Her
dsm
an
Skilled Labour
Car
pent
er
Blac
k Sm
ith
Cob
bler
M W M W M W M M M
Andhra PradeshKrishna Ghantasala Dec, 2018 8 388 275 500 NA 300 NA 400 NA NA
Guntur Tadikonda Nov, 2018 8 365 308 350 NA 325 NA NA NA NA
Telangana Ranga Reddy Arutala May, 18 8 650 266 500 NA NA NA 600 550 NA
KarnatakaBangalore Harisandra Sep, 17 8 360 340 400 350 400 300 600 450 NA
Tumkur Gidlahali Sep, 17 8 250 200 250 200 250 NA 300 280 NA
MaharashtraBhandara Adyal Oct, 17 8 200 150 250 150 200 150 350 250 200
Chandrapur Ballarpur July, 18 8 300 150 300 150 200 NA 250 250 150
Jharkhand Ranchi Gaitalsood Nov, 17 8 230 230 230 230 230 230 317 317 NA
1.1. daily agriculTural wages in some sTaTes (operaTion-wise)(In Rs.)
State District Centre Month & Year
Type
of L
abou
r
Nor
mal
Dai
ly
Wor
king
Hou
rs
Plou
ghin
g
Sow
ing
Wee
ding
Har
vest
ing
Oth
er A
gri L
abou
r
Her
dsm
an
Skilled Labours
Car
pent
er
Blac
k Sm
ith
Cob
bler
Assam Barpeta Laharapara April, 18M 8 250 250 250 250 250 NA NA NA NA
W 8 NA NA 200 200 200 NA NA NA NA
Bihar Muzaffarpur Bhalui Rasul Dec, 17M 8 NA NA NA NA NA NA NA NA NA
W 8 NA NA NA NA NA NA NA NA NA
Shekhpura Kutaut Dec, 17M 8 350 NA 350 NA 300 NA 500 NA NA
W 8 NA NA NA NA NA NA NA NA NA
Chhattisgarh Dhamtari Sihava March, 18M 8 NA NA NA 150 180 175 300 200 200
W 8 NA NA NA 130 160 150 NA 150 NA
Gujarat* Rajkot Rajkot Jan, 19M 8 238 245 231 224 198 178 479 471 450
W 8 300 250 227 213 195 156 NA NA NA
Dahod Dahod Jan, 19M 8 293 293 164 164 164 NA 371 321 286
8 NA 250 157 157 157 NA NA NA NA

June, 2019 │ Agricultural Situation in India │ 49
Commodity Reviews
1.1. daily agriculTural wages in some sTaTes (operaTion-wise)-Contd.(In Rs.)
State District Centre Month & Year
Type
of L
abou
r
Nor
mal
Dai
ly
Wor
king
Hou
rs
Plou
ghin
g
Sow
ing
Wee
ding
Har
vest
ing
Oth
er A
gri L
abou
r
Her
dsm
an
Skilled Labours
Car
pent
er
Blac
k Sm
ith
Cob
bler
Haryana Panipat Ugarakheri May,18M 8 400 400 400 400 400 NA 550 400 NA
W 8 NA 300 300 350 300 NA NA NA NA
Himachal Pradesh Mandi Mandi June,16
M 8 NA 182 182 182 182 182 300 300 NA
W 8 NA 182 182 182 182 182 NA NA NA
Kerala Kozhikode Koduvally June, 18M 4-8 960 NA NA 800 970 NA 900 NA NA
W 4-8 NA NA 650 650 650 NA NA NA NA
Palakkad Elappally June, 18M 4-8 NA 550 NA 550 634 NA 650 NA NA
W 4-8 NA NA 300 300 300 NA NA NA NA
Madhya Pradesh Hoshangabad Sangarkhera June, 18
M 8 250 NA 250 250 250 150 400 400 NA
W 8 NA NA 250 250 200 150 NA NA NA
Satna Kotar June, 18M 8 200 200 200 200 200 200 350 350 350
W 8 NA 200 200 200 200 200 NA NA NA
Shyopurkala Vijaypur June, 18M 8 NA 300 NA NA NA 300 300 300 NA
W 8 NA 300 NA NA NA 300 NA NA NA
Odisha Bhadrak Chandbali June, 18M 8 250 250 250 300 300 250 450 400 350
W 8 NA 220 220 250 250 250 NA NA NA
Ganjam Aska June, 18M 8 350 250 250 350 300 250 500 400 350
W 8 NA 220 220 300 250 220 NA NA NA
Punjab Ludhiyana Pakhowal March, 18M 8 480 480 480 500 400 NA 480 480 NA
W 8 NA NA NA NA NA NA NA NA NA
Rajasthan Barmer Kuseep Dec, 18M 8 NA NA 400 NA NA 500 700 500 NA
W 8 NA NA 200 NA NA NA NA NA NA
Jalore Sarnau Dec, 18M 8 400 NA 300 NA NA NA 450 300 NA
W 8 NA NA 300 NA NA NA NA 300 NA
Tamil Nadu* Thanjavur Pulvarnatham June, 18M 8 NA 347 NA 333 375 NA 500 350 NA
W 8 NA NA 150 144 139 NA NA NA NA
Tirunelveli Malayakulam June, 18M 8 NA 187 181 500 380 NA NA NA NA
W 8 NA NA NA 175 NA NA NA NA NA

50 │ Agricultural Situation in India │ June, 2019
Commodity Reviews
1.1. daily agriculTural wages in some sTaTes (operaTion-wise)-concld.(In Rs.)
State District Centre Month & Year
Type
of L
abou
r
Nor
mal
Dai
ly
Wor
king
Hou
rs
Plou
ghin
g
Sow
ing
Wee
ding
Har
vest
ing
Oth
er A
gri L
abou
r
Her
dsm
an
Skilled Labours
Car
pent
er
Blac
k Sm
ith
Cob
bler
Tripura State Average Oct, 17M 8 361 323 311 317 304 306 359 324 275
W 8 NA 256 256 252 253 280 NA NA NA
Uttar Pradesh*
Meerut Ganeshpur Oct, 18M 8 300 300 300 300 300 NA 500 NA NA
W 8 NA 250 250 250 250 NA NA NA NA
Aurraiya Aurraiya Oct, 18M 8 NA 300 300 NA 300 NA 500 NA .NA
W 8 NA NA 300 NA 300 NA NA NA NA
Chandauli Chandauli Oct, 18M 8 NA NA NA NA 225 NA 400 NA NA
W 8 NA NA NA NA 225 NA NA NA NA
M - Man W - Woman NA - Not Available NR – Not Reported * States reported district average daily wages

June, 2019 │ Agricultural Situation in India │ 51
Commodity Reviews
prices2. wHolesale prices of cerTain agriculTural commodiTies and animal HusBandry producTs aT selecTed
cenTres in india
Commodity Variety Unit State Centre Apr-19 Mar-19 Apr-18
Wheat PBW 343 Quintal Punjab Amritsar 1840 2000 1675
Wheat Dara Quintal Uttar Pradesh Chandausi 1840 1980 1735
Wheat Lokvan Quintal Madhya Pradesh Bhopal 1860 1800 1758
Jowar - Quintal Maharashtra Mumbai 3000 3100 2400
Gram No III Quintal Madhya Pradesh Sehore 3980 3780 3102
Maize Yellow Quintal Uttar Pradesh Kanpur 1900 1865 1430
Gram Split - Quintal Bihar Patna 5800 5800 5400
Gram Split - Quintal Maharashtra Mumbai 5700 5700 4700
Arhar Split - Quintal Bihar Patna 7080 7025 5750
Arhar Split - Quintal Maharashtra Mumbai 6500 6400 5500
Arhar Split - Quintal NCT of Delhi Delhi 6600 6100 5900
Arhar Split Sort II Quintal Tamil Nadu Chennai 7400 6800 5500
Gur - Quintal Maharashtra Mumbai 4300 4400 4000
Gur Sort II Quintal Tamil Nadu Coimbatore 4200 4200 4800
Gur Balti Quintal Uttar Pradesh Hapur 2360 2400 2200
Mustard Seed Black (S) Quintal Uttar Pradesh Kanpur 3400 3500 3400
Mustard Seed Black Quintal West Bengal Raniganj 4200 4300 4300
Mustard Seed - Quintal West Bengal Kolkata 4100 4020 4100
Linseed Bada Dana Quintal Uttar Pradesh Kanpur 4250 4200 4025
Linseed Small Quintal Uttar Pradesh Varanasi 4300 4210 4250
Cotton Seed Mixed Quintal Tamil Nadu Virudhunagar 1850 1950 1450
Cotton Seed MCU 5 Quintal Tamil Nadu Coimbatore 2700 2700 2560
Castor Seed - Quintal Telangana Hyderabad 5100 5100 3900
Sesamum Seed White Quintal Uttar Pradesh Varanasi 10400 10885 7400
Copra FAQ Quintal Kerala Alleppey 9950 10150 13250
Groundnut Pods Quintal Tamil Nadu Coimbatore 5200 5200 5600
Groundnut - Quintal Maharashtra Mumbai 7300 6700 4800
Mustard Oil - 15 Kg. Uttar Pradesh Kanpur 1345 1350 1300
Mustard Oil Ordinary 15 Kg. West Bengal Kolkata 1275 1275 1400
Groundnut Oil - 15 Kg. Maharashtra Mumbai 1480 1500 1270
Groundnut Oil Ordinary 15 Kg. Tamil Nadu Chennai 1910 1710 1740

52 │ Agricultural Situation in India │ June, 2019
Commodity Reviews
Commodity Variety Unit State Centre Apr-19 Mar-19 Apr-18
Linseed Oil - 15 Kg. Uttar Pradesh Kanpur 1448 1445 1425
Castor Oil - 15 Kg. Telangana Hyderabad 1830 1680 1320
Sesamum Oil - 15 Kg. NCT of Delhi Delhi 1760 1760 1545
Sesamum Oil Ordinary 15 Kg. Tamil Nadu Chennai 3200 3100 2500
Coconut Oil - 15 Kg. Kerala Cochin 2175 2205 2790
Mustard Cake - Quintal Uttar Pradesh Kanpur 1800 1800 1715
Groundnut Cake - Quintal Telangana Hyderabad 3286 3214 2714
Cotton/Kapas NH 44 Quintal Andhra pradesh Nandyal 6050 5500 4350
Cotton/Kapas LRA Quintal Tamil Nadu Virudhunagar 5200 5200 NA
Jute Raw TD 5 Quintal West Bengal Kolkata 4375 4675 4075
Jute Raw W 5 Quintal West Bengal Kolkata 4425 4725 4075
Oranges - 100 No NCT of Delhi Delhi 667 583 750
Oranges Big 100 No Tamil Nadu Chennai 500 550 600
Banana - 100 No. NCT of Delhi Delhi 417 417 458
Banana Medium 100 No. Tamil Nadu Kodaikkanal 630 600 676
Cashewnuts Raw Quintal Maharashtra Mumbai 74000 76000 87000
Almonds - Quintal Maharashtra Mumbai 60000 58000 66000
Walnuts - Quintal Maharashtra Mumbai 64000 63000 72000
Kishmish - Quintal Maharashtra Mumbai 20000 23000 15200
Peas Green - Quintal Maharashtra Mumbai 5400 5300 3800
Tomato Ripe Quintal Uttar Pradesh Kanpur 1700 1175 600
Ladyfinger - Quintal Tamil Nadu Chennai 2100 1800 1500
Cauliflower - 100 No. Tamil Nadu Chennai 2550 2200 1500
Potato Red Quintal Bihar Patna 950 950 950
Potato Desi Quintal West Bengal Kolkata 800 750 1250
Potato Sort I Quintal Tamil Nadu Mettuppalayam 2173 1863 2590
Onion Pole Quintal Maharashtra Nashik 700 500 600
Turmeric Nadan Quintal Kerala Cochin 11000 11500 12000
Turmeric Salam Quintal Tamil Nadu Chennai 11000 10000 12000
Chillies - Quintal Bihar Patna 9980 9950 11000
2. wHolesale prices of cerTain agriculTural commodiTies and animal HusBandry producTs aT selecTed cenTres in india-Contd.
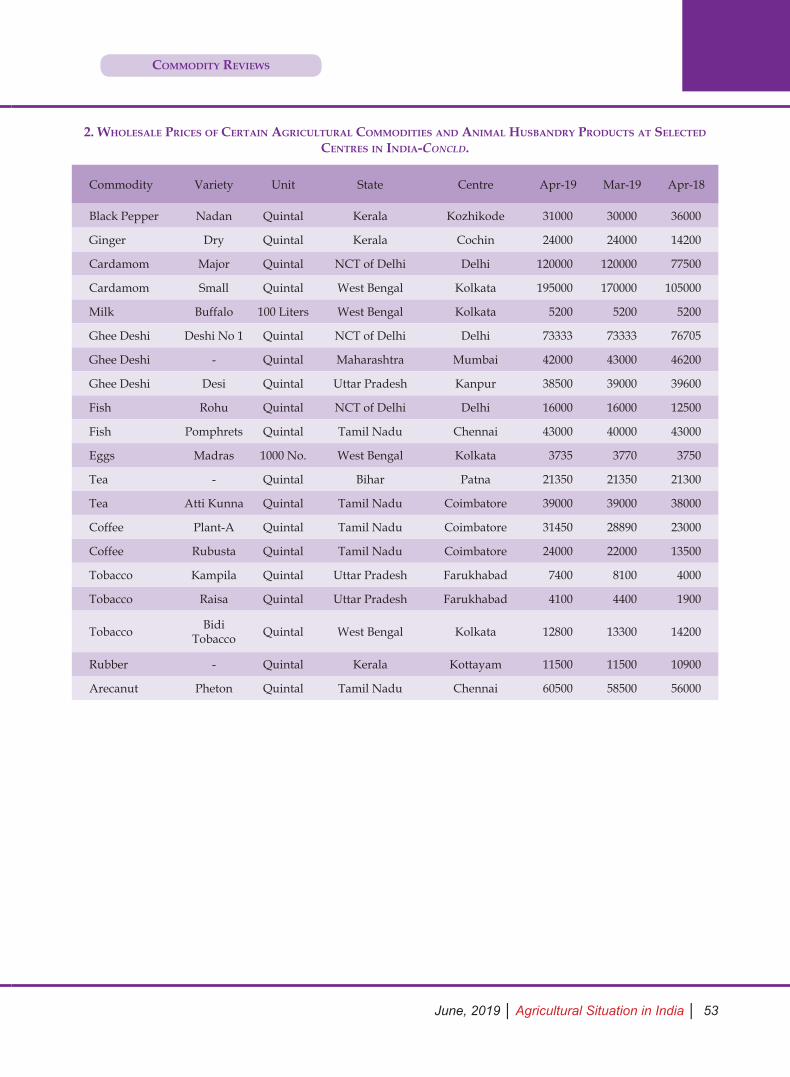
June, 2019 │ Agricultural Situation in India │ 53
Commodity Reviews
Commodity Variety Unit State Centre Apr-19 Mar-19 Apr-18
Black Pepper Nadan Quintal Kerala Kozhikode 31000 30000 36000
Ginger Dry Quintal Kerala Cochin 24000 24000 14200
Cardamom Major Quintal NCT of Delhi Delhi 120000 120000 77500
Cardamom Small Quintal West Bengal Kolkata 195000 170000 105000
Milk Buffalo 100 Liters West Bengal Kolkata 5200 5200 5200
Ghee Deshi Deshi No 1 Quintal NCT of Delhi Delhi 73333 73333 76705
Ghee Deshi - Quintal Maharashtra Mumbai 42000 43000 46200
Ghee Deshi Desi Quintal Uttar Pradesh Kanpur 38500 39000 39600
Fish Rohu Quintal NCT of Delhi Delhi 16000 16000 12500
Fish Pomphrets Quintal Tamil Nadu Chennai 43000 40000 43000
Eggs Madras 1000 No. West Bengal Kolkata 3735 3770 3750
Tea - Quintal Bihar Patna 21350 21350 21300
Tea Atti Kunna Quintal Tamil Nadu Coimbatore 39000 39000 38000
Coffee Plant-A Quintal Tamil Nadu Coimbatore 31450 28890 23000
Coffee Rubusta Quintal Tamil Nadu Coimbatore 24000 22000 13500
Tobacco Kampila Quintal Uttar Pradesh Farukhabad 7400 8100 4000
Tobacco Raisa Quintal Uttar Pradesh Farukhabad 4100 4400 1900
Tobacco Bidi Tobacco Quintal West Bengal Kolkata 12800 13300 14200
Rubber - Quintal Kerala Kottayam 11500 11500 10900
Arecanut Pheton Quintal Tamil Nadu Chennai 60500 58500 56000
2. wHolesale prices of cerTain agriculTural commodiTies and animal HusBandry producTs aT selecTed cenTres in india-ConCld.
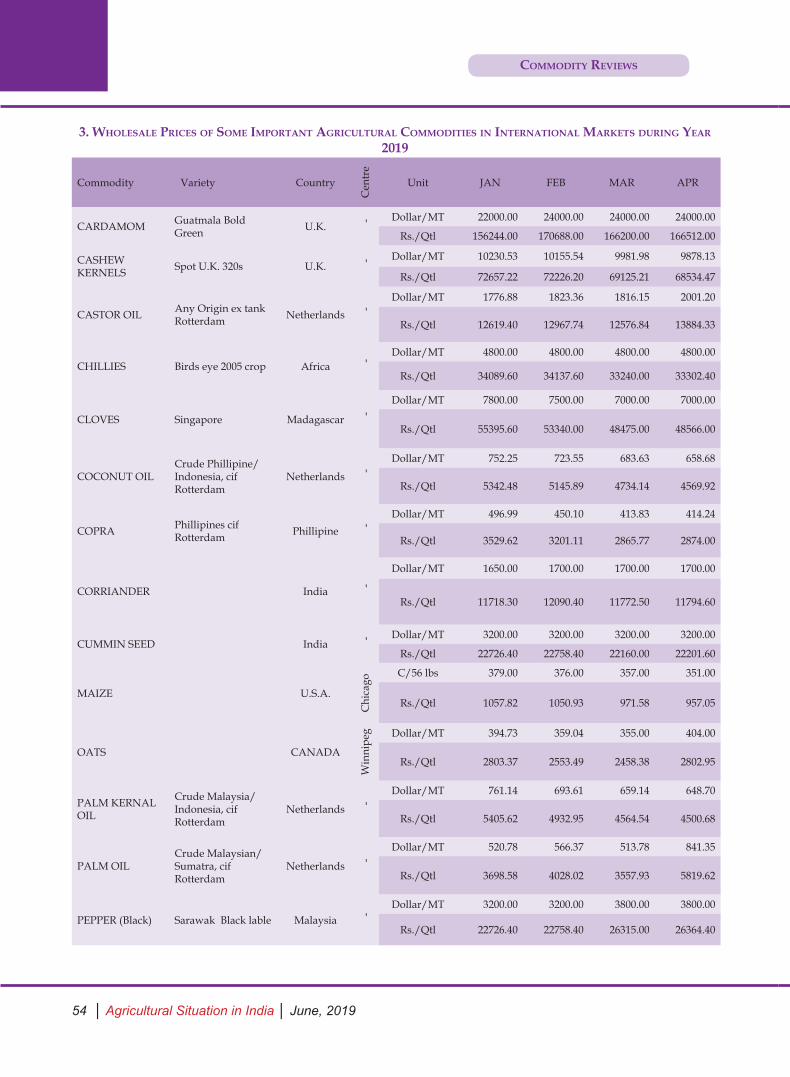
54 │ Agricultural Situation in India │ June, 2019
Commodity Reviews
3. wHolesale prices of some imporTanT agriculTural commodiTies in inTernaTional marKeTs during year 2019
Commodity Variety Country
Cen
tre
Unit JAN FEB MAR APR
CARDAMOM Guatmala Bold Green U.K.
- Dollar/MT 22000.00 24000.00 24000.00 24000.00
Rs./Qtl 156244.00 170688.00 166200.00 166512.00
CASHEW KERNELS Spot U.K. 320s U.K.
- Dollar/MT 10230.53 10155.54 9981.98 9878.13
Rs./Qtl 72657.22 72226.20 69125.21 68534.47
CASTOR OIL Any Origin ex tank Rotterdam Netherlands
-
Dollar/MT 1776.88 1823.36 1816.15 2001.20
Rs./Qtl 12619.40 12967.74 12576.84 13884.33
CHILLIES Birds eye 2005 crop Africa -
Dollar/MT 4800.00 4800.00 4800.00 4800.00
Rs./Qtl 34089.60 34137.60 33240.00 33302.40
CLOVES Singapore Madagascar -
Dollar/MT 7800.00 7500.00 7000.00 7000.00
Rs./Qtl 55395.60 53340.00 48475.00 48566.00
COCONUT OILCrude Phillipine/Indonesia, cif Rotterdam
Netherlands -
Dollar/MT 752.25 723.55 683.63 658.68
Rs./Qtl 5342.48 5145.89 4734.14 4569.92
COPRA Phillipines cif Rotterdam Phillipine
-
Dollar/MT 496.99 450.10 413.83 414.24
Rs./Qtl 3529.62 3201.11 2865.77 2874.00
CORRIANDER India -
Dollar/MT 1650.00 1700.00 1700.00 1700.00
Rs./Qtl 11718.30 12090.40 11772.50 11794.60
CUMMIN SEED India - Dollar/MT 3200.00 3200.00 3200.00 3200.00
Rs./Qtl 22726.40 22758.40 22160.00 22201.60
MAIZE U.S.A.
Chi
cago
C/56 lbs 379.00 376.00 357.00 351.00
Rs./Qtl 1057.82 1050.93 971.58 957.05
OATS CANADA
Win
nipe
g Dollar/MT 394.73 359.04 355.00 404.00
Rs./Qtl 2803.37 2553.49 2458.38 2802.95
PALM KERNAL OIL
Crude Malaysia/Indonesia, cif Rotterdam
Netherlands -
Dollar/MT 761.14 693.61 659.14 648.70
Rs./Qtl 5405.62 4932.95 4564.54 4500.68
PALM OILCrude Malaysian/Sumatra, cif Rotterdam
Netherlands -
Dollar/MT 520.78 566.37 513.78 841.35
Rs./Qtl 3698.58 4028.02 3557.93 5819.62
PEPPER (Black) Sarawak Black lable Malaysia -
Dollar/MT 3200.00 3200.00 3800.00 3800.00
Rs./Qtl 22726.40 22758.40 26315.00 26364.40

June, 2019 │ Agricultural Situation in India │ 55
Commodity Reviews
Commodity Variety Country
Cen
tre
Unit JAN FEB MAR APR
RAPESEED
Canola CANADA
Win
nipe
g Can Dollar/MT 482.20 474.80 462.90 439.50
Rs./Qtl 2576.88 2558.22 2392.73 2279.25
UK delivered rapeseed, delivered Erith(buyer)
U.K. -
Pound/MT 304.00 304.00 304.00 304.00
Rs./Qtl 2835.41 2818.69 2746.94 2741.47
RAPESEED OILRefined bleached and deodorised ex-tanks,broker price
U.K. -
Pound/MT 695.00 695.00 767.00 767.00
Rs./Qtl 6482.27 6357.17 6930.61 6916.81
SOYABEAN MEAL
UK produced 49% oil & protein ('hi-pro') ex-mill seaforth UK bulk
U.K. -
Pound/MT 299.00 286.00 274.00 272.00
Rs./Qtl 2788.77 2651.79 2475.86 2452.90
SOYABEAN OIL U.S.A. - C/lbs 28.00 30.00 30.00 28.00
Rs./Qtl 4382.79 4702.45 4578.81 4281.58
Refined bleached and deodorised ex-tanks,broker price
U.K. -
Pound/MT 635.00 635.00 646.61 650.98
Rs./Qtl 5922.65 5808.35 5842.77 5870.54
SOYABEANS
U.S.A. -
C/60 lbs 899.00 911.00 898.00 854.00
Rs./Qtl 2343.18 2377.80 2282.24 2174.49
US NO.2 yellow Netherlands
Chi
cago
Dollar/MT 383.54 379.56 372.67 -
Rs./Qtl 2723.90 2699.43 2580.74 -
SUNFLOWER SEED OIL
Refined bleached and deodorised ex-tanks,broker price
U.K. -
Pound/MT 724.00 724.00 560.00 702.00
Rs./Qtl 6752.75 6622.43 5060.16 6330.64
Wheat U.S.A.
Chi
cago C/60 lbs 526.00 487.00 440.00 435.00
Rs./Qtl 1370.98 1271.12 1118.25 1107.62
Source: - Public Ledger
foreign excHange raTes
Currency JAN FEB MAR APRCanDollar 53.44 53.88 51.69 51.86UKPound 93.27 92.72 90.36 90.18USDollar 71.02 71.12 69.25 69.38
3. wHolesale prices of some imporTanT agriculTural commodiTies in inTernaTional marKeTs during year 2019-Contd.

56 │ Agricultural Situation in India │ June, 2019
Commodity Reviews
Crop Production
sowing and haRvesting opeRations noRmally in pRogRess duRing the month of July, 2019State Sowing Harvesting
(1) (2) (3)
Andhra Pradesh Winter Rice, Jowar (K), Bajra, Maize (K), Ragi(K), Small Millets (K), Tur (K), Urad (K), Mung (K), Other Kharif Pulses, Ginger, Chillies (Dry), Groundnut, Castorseed, Sesamum, Cotton, Mesta, Sweet Potato, Turmeric, Sannhemp, Nigerseed, Onion, Tapioca.
Autumn rice.
Assam Winter Rice, Castorseed. Autumn Rice, Jute.Bihar Autumn Rice, Winter Rice, Jowar (K) Bajra,
Maize,Ragi, Small Millets (K) Tur (K), Groundnut, Castorseed, Sesamum, Cotton, Jute, Mesta.
Jute.
Gujarat Winter Rice, Jowar (K), Bajra, Maize, Ragi, Small Millets (K), Tur (K), Urad (K), Mung (K), Other Kharif Pulses, Chillies (Dry), Tobacco, Groundnut,Castorseed, Sesamum, Cotton, Sannhemp.
—
Himachal Pradesh
Summer Rice, Jowar (K), Bajra, Ragi, Small Millets (K) Urad (K), Mung (K), Other Kharif Pulses, Chillies (Dry), Sesamum, Sennhemp, Sumer Potato (Plains).
Winter Potato (Hills).
Jammu & Kashmir
Autumn Rice, Jowar (K) Bajra, Small Millets (K), Urad (K), Mung (K), Winter Potato, Ginger, Tobacco, sesamum, Jute, Onion.
Tobacco, Sesamum, Onion.
Karnataka Autumn Rice, Winter Rice, Jowar (K), Bajra, Maize, Ragi, Small Millets (K), Tur (K), Urad (K), Mung (K), Other Kharif Pulses, Winter Potato (Plains), Summer Potato (Plains) Black Pepper, Chillies (Dry), Tobacco, Groundnut, Castorseed, Sesamum, Cotton, Mesta, Sweet Potato, Turmeric, Sannhemp, Nigerseed, Onion, Tapioca.
—
Kerala Ragi, Sweet Potato, Tapicoa. Sesamum, Tapioca.Madhya Pradesh Autumn Rice, Jowar (K), Bajra, Maize, Ragi, Small
Millets (K), Tur (K), Mung (K), Other Kharif Pulses, Summer Potato, Ginger, Chillies (Dry), Tobacco, Groundnut, Castorseed, Sesamum, Cotton, Jute, Mesta, Sweet Potato, Turmeric, Sannhemp,Nigerseed.
—
Maharashtra Winter Rice, Jowar (K), Bajra, Maize, Ragi Small Millets (K), Tur (K), Urad (K), Mung (K), Other Kharif Pulses, Summer Potato (Plains), Chillies (Dry) Tobacco, Groundnut, Castorseed, Sesamum, Cotton, Jute, Mesta, Sannhemp, Nigerseed.
—
Manipur Winter Rice, Tur (K), Sesamum (K), Sweet Potato, Maize.
—

June, 2019 │ Agricultural Situation in India │ 57
Commodity Reviews
State Sowing Harvesting
(1) (2) (3)
Orissa Winter Rice, Jowar (K), Bajra, Maize, Ragi, Small Millets (K), Summer Potato (Plains), Chillies (Dry), Groundnut, Castorseed, Cotton, Mesta
Chillies (Dry.)
Punjab andHaryana
Autumn Rice, Summer Rice, Jowar (K), Bajra, Maize, Ragi, Small Millets (K), Tur (K), Urad (K), Mung (K), Other Kharif Pulses, Groundnut, Castorseed, Sweet Potato, Turmeric, Sannhemp.
Small Millets, (K), Potato.
Rajsthan Autumn Rice, Jowar (K), Bajra, Maize, Small Millets (K), Tur (K), Urad (K), Mung (K), Other Kharif Pulses, Chillies (Dry), Groundnut, Castorseed, Cotton Sannhemp.
—
Tamil Nadu Autumn Rice, Jowar (K), Bajra, Ragi, Small Millets(K), Tur (K), Urad (K), Summer Potato (Hills), Chillies (Dry), Groundnut, Castorseed, Seasamum,Cotton, Sannhemp, Onion, Tapioca.
Jowar (R), Summer Potato (Hills), Chillies (Dry), Sesamum, Cotton, Sannhemp.
Tripura Winter Rice, Urad (K), Mung (K), Sesamum. Onion, Autumn Rice.
Uttar Pradesh Autumn Rice, Winter Rice, Jowar (K), Bajra Maize, Small Millets (K), Tur (K), Urad (K), Mung (K), Other Kharif Pulses Ginger, Groundnut, Castorseed, Sannhemp, Nigerseed, Tapicoca.
Small Millets (R), Chillies(Dry).
West Bengal Autumn Rice, Winter (Rice), Tur (K), Ginger,Chillies (Dry).
Chillies (Dry), Sesamum.
Delhi Summer Rice, Jowar (K), Bajra, Maize, Tur (K), Urad (K), Mung (K), Other Kharif Pulses, Summer Potato (Plains), Chillies (Dry), Cotton, Sweet Potato.
Winter Potato (Plains), Onion.
Andaman &Nicobar
Autumn Rice, Winter Rice. —
(K)--Kharif (R)--- Rabi
sowing and haRvesting opeRations noRmally in pRogRess duRing July, 2019-Contd.
The Journal is brought out by the Directorate of Economics and Statistics, Ministry of Agriculture & Farmers Welfare, it aims at presenting an integrated picture of the food and agricultural situation in india on month to month basis. The views expressed are not necessarily those of the Government of India.
Note to ContributorsArticles on the State of Indian Agriculture and allied sectors are accepted for publication in the Directorate of Economics & Statistics, Department of Agriculture, Cooperation & Farmers Welfare’s monthly Journal “Agricultural Situation in India”. The Journal intends to provide a forum for scholarly work and also to promote technical competence for research in agricultural and allied subjects. Good articles in Hard Copy as well as Soft Copy ([email protected]) in MS Word, not exceeding five thounsand words, may be sent in duplicate, typed in double space on one side of foolscap paper in Times New Roman font size 12, addressed to the Editor, Publication Division, Directorate of Economics and Statistics, M/o Agriculture & Farmers Welfare, C-1, Hutments Dara Shukoh Road, New Delhi-110 011 along with a declaration by the author(s) that the article has neither been published nor submitted for publication elsewhere. The author (s) should furnish their e-mail address, Phone No. and their permanent address only on the forwarding letter so as to maintain anonymity of the author while seeking comments of the referees on the suitability of the article for publication. Although authors are solely responsible for the factual accuracy and the opinion expressed in their articles, the Editorial Board of the Journal, reserves the right to edit, amend and delete any portion of the article with a view to making it more presentable or to reject any article, if not found suitable. Articles which are not found suitable will not be returned unless accompanied by a self-addressed and stamped envelope. No correspondence will be entertained on the articles rejected by the Editorial Board.
An honorarium of Rs. 2000/- per article of atleast 2000 words for the regular issue and Rs. 2500/- per article of at least 2500 words for the Special/Annual issue is paid by the Directorate of Economics & Statistics to the authors of the articles accepted for the Journal.
Disclaimer: Views expressed in the articles and studies are of the authors only and may not necessarily represent those of Government of India.
Abbreviations used
N.A.—Not Available.
N.Q.—Not Quoted.
N.T.—No Transactions.
N.S.—No Supply/No Stock.
R.—Revised.
M.C.—Market Closed.
N.R.—Not Reported.
Neg.—Negligible.
Kg.—Kilogram.
Q.—Quintal.
(P)—Provisional.
Plus (+) indicates surplus or increase.
Minus (–) indicates deficit or decrease.
We are pleased to inform that our monthly journal Agricultural Situation in India has been accredited by the National Academy of Agricultural Sciences (NAAS) and it has been given a score of 3.15 out of 6. The score is effective from January, 2019 onwards. The score may be seen in the following website: www.naasindia.org
Soft copy of the journal may be seen in PDF at the following URL :eands.dacnet.nic.in/publication.htm
