ashok kumar*, deepam maurya, yuan zhou, jonathan …rheflin/ehs14-tco.pdfashok kumar*, deepam...
TRANSCRIPT

Ashok Kumar*, Deepam Maurya, Yuan Zhou, Jonathan Metzman, James R. Heflin,Robert Bodnar and Shashank Priya*
Opto-electrical Behavior of Pb(Zn1/3Nb2/3)O3–Pb0.97La0.03(Zr,Ti)O3 Transparent Ceramics withVarying Defect Structure
Abstract: We report correlation between the electro-mechanical, ferroelectric, optical and opto-electric beha-vior in Pb(Zn1/3Nb2/3)O3–Pb0.97La0.03(Zr,Ti)O3 transparentceramics. Optical interaction during current–voltage(I–V) measurements enhanced the current output andrevealed its strong dependence on wavelength andpower of the impinging radiation. Piezoresponse forcemicroscopy revealed that the improved characteristics atlow stoichiometric excess of various elements wererelated to nano-sized stripe domains. Raman analysisindicated the presence of short-range clusters with rhom-bohedral–tetragonal phase distributed at much above theCurie temperature. The results reveal the potential ofthese ceramics in wireless opto-electric devices operatingover a wide-range of wavelengths and temperatures.These classes of ceramics have successfully demonstratedin literature for use in pyroelectric generators and UVlight energy harvesting, piezoelectric transformers.
Keywords: piezoelectrics, transparent ceramics, ferroelec-tric, opto-electric, electromechanical
DOI 10.1515/ehs-2014-0018
Introduction
Lead zirconate titanate (Pb(Zr,Ti)O3) (PZT), a non-centrosymmetric material obtained via solid-solution offerroelectric PbTiO3 (Tc ¼ 490°C) and antiferroelectricPbZrO3 (Tc ¼ 230°C) compounds, has been widely usedin piezoelectric and ferroelectric devices such as transdu-cers, sensors and ferroelectric random access memory.In modified form, this material is revolutionizingapplications ranging from medical ultrasound andsonar to energy harvesting (Cohen 2006; Ahart et al.2008; Cowley et al. 2011). Recent investigations havefocused on the development of PZT-based high-performance relaxor modified compositions as exempli-fied by the pseudo-ternary composition Pb(Zr,Ti)O3–Pb(Zn1/3 Nb2/3)O3 (PZT–PZN) system (Uchino 1997; Yin,Zhu, and Zeng 2009). Both PZN and PZT exhibit perovs-kite (ABO3) lattice structure in which the A-site is occu-pied by Pb2þ ions and the B-site by Zn2þ , Zr4þ , Ti4þ andNb5þ ions (Nonnenmann, Gallo, and Spanier 2010; Ryuet al. 2011). The solid solution of PZN–PZT has a rhombo-hedral/tetragonal morphotropic phase boundary (MPB) ator above ≥ 70 mol% PbZrxTi1−xO3 (0.52 ≤ x ≤ 0.54) (Heet al. 2009; Fan and Kim 2002; Wang et al. 2012).Monoclinic phases such as Pm and Cm have been reportedto exist around the MPB, acting as an intermediate brid-ging phase that allows polarization to rotate from [111] to[001] (Ahart et al. 2008; La-Orauttapong et al. 2002;Rahman, Metselaar, and Karmaker 2014; Pandey andSingh 2014; Li and Chou 2003, 2006).
PZN ceramics exhibit good dielectric and electrostric-tive properties; however, it is difficult to synthesize singlephase polycrystalline perovskite PZN ceramic becausesteric and electrostatic interaction between high polariza-tion of the Pb2þ and the Zn2þ cations makes it thermo-dynamically unstable over a wide range of temperatures(600–1,400°C). This leads to the formation of a pyro-chlore phase and PbO given by the decomposition reac-tion [3Pb(Zn1/3Nb2/3)O3 → Pb2Nb2O7 þ ZnO þ PbO] (Fanand Kim 2002). The columbite method has been found tobe effective in eliminating the formation of a pyrochlore
*Corresponding authors: Ashok Kumar: E-mail: [email protected],Shashank Priya: E-mail: [email protected], Center for EnergyHarvesting Materials and Systems (CEHMS), Bio-inspired Materialsand Devices Laboratory (BMDL), Virginia Tech, Blacksburg, VA24061, USADeepam Maurya: E-mail: [email protected], Yuan Zhou:E-mail: [email protected], Center for Energy Harvesting Materials andSystems (CEHMS), Bio-inspired Materials and Devices Laboratory(BMDL), Virginia Tech, Blacksburg, VA 24061, USAJonathan Metzman: E-mail: [email protected], James R. Heflin:E-mail: [email protected], Department of Physics, Virginia Tech,Blacksburg, VA 24061, USARobert Bodnar, Department of Geosciences, Virginia Tech,Blacksburg, VA 24061, USA, E-mail: [email protected]
Energy Harvesting and Systems 2014; 1(3-4): 223–231
Brought to you by | Virginia Tech (Virginia Polytechnical Institute)Authenticated
Download Date | 12/3/14 11:14 PM
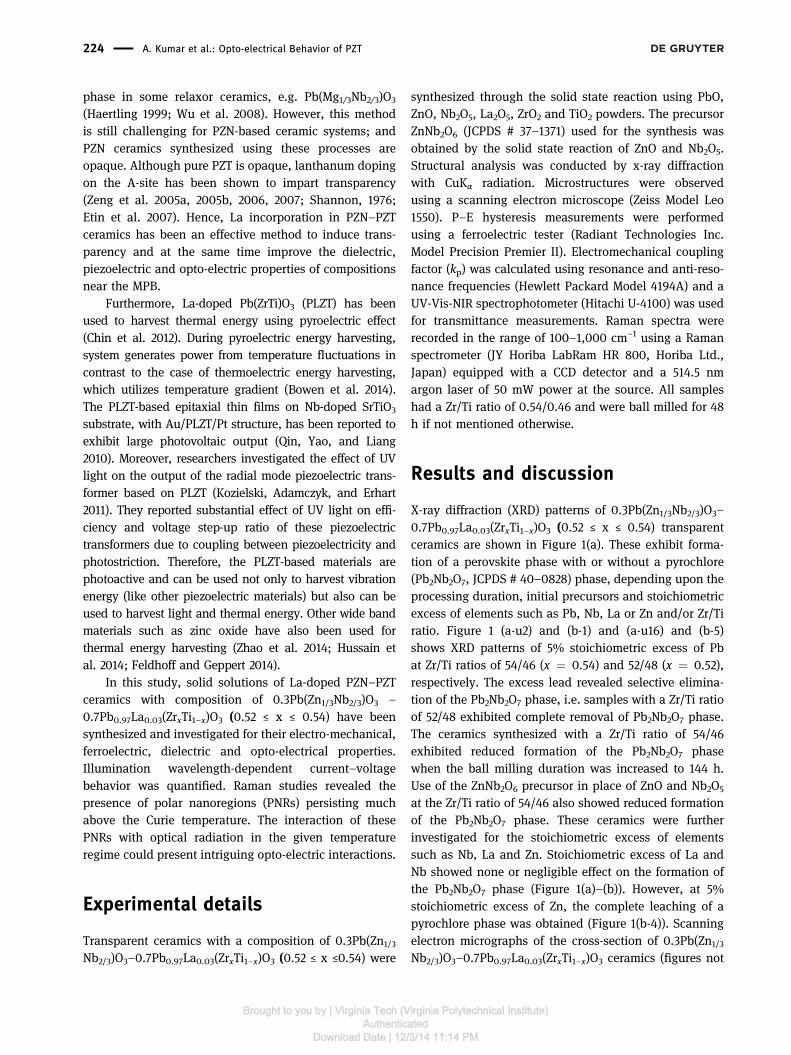
phase in some relaxor ceramics, e.g. Pb(Mg1/3Nb2/3)O3
(Haertling 1999; Wu et al. 2008). However, this methodis still challenging for PZN-based ceramic systems; andPZN ceramics synthesized using these processes areopaque. Although pure PZT is opaque, lanthanum dopingon the A-site has been shown to impart transparency(Zeng et al. 2005a, 2005b, 2006, 2007; Shannon, 1976;Etin et al. 2007). Hence, La incorporation in PZN–PZTceramics has been an effective method to induce trans-parency and at the same time improve the dielectric,piezoelectric and opto-electric properties of compositionsnear the MPB.
Furthermore, La-doped Pb(ZrTi)O3 (PLZT) has beenused to harvest thermal energy using pyroelectric effect(Chin et al. 2012). During pyroelectric energy harvesting,system generates power from temperature fluctuations incontrast to the case of thermoelectric energy harvesting,which utilizes temperature gradient (Bowen et al. 2014).The PLZT-based epitaxial thin films on Nb-doped SrTiO3
substrate, with Au/PLZT/Pt structure, has been reported toexhibit large photovoltaic output (Qin, Yao, and Liang2010). Moreover, researchers investigated the effect of UVlight on the output of the radial mode piezoelectric trans-former based on PLZT (Kozielski, Adamczyk, and Erhart2011). They reported substantial effect of UV light on effi-ciency and voltage step-up ratio of these piezoelectrictransformers due to coupling between piezoelectricity andphotostriction. Therefore, the PLZT-based materials arephotoactive and can be used not only to harvest vibrationenergy (like other piezoelectric materials) but also can beused to harvest light and thermal energy. Other wide bandmaterials such as zinc oxide have also been used forthermal energy harvesting (Zhao et al. 2014; Hussain etal. 2014; Feldhoff and Geppert 2014).
In this study, solid solutions of La-doped PZN–PZTceramics with composition of 0.3Pb(Zn1/3Nb2/3)O3 –0.7Pb0.97La0.03(ZrxTi1−x)O3 (0.52 ≤ x ≤ 0.54) have beensynthesized and investigated for their electro-mechanical,ferroelectric, dielectric and opto-electrical properties.Illumination wavelength-dependent current–voltagebehavior was quantified. Raman studies revealed thepresence of polar nanoregions (PNRs) persisting muchabove the Curie temperature. The interaction of thesePNRs with optical radiation in the given temperatureregime could present intriguing opto-electric interactions.
Experimental details
Transparent ceramics with a composition of 0.3Pb(Zn1/3Nb2/3)O3–0.7Pb0.97La0.03(ZrxTi1−x)O3 (0.52 ≤ x ≤0.54) were
synthesized through the solid state reaction using PbO,ZnO, Nb2O5, La2O5, ZrO2 and TiO2 powders. The precursorZnNb2O6 (JCPDS # 37–1371) used for the synthesis wasobtained by the solid state reaction of ZnO and Nb2O5.Structural analysis was conducted by x-ray diffractionwith CuKα radiation. Microstructures were observedusing a scanning electron microscope (Zeiss Model Leo1550). P–E hysteresis measurements were performedusing a ferroelectric tester (Radiant Technologies Inc.Model Precision Premier II). Electromechanical couplingfactor (kp) was calculated using resonance and anti-reso-nance frequencies (Hewlett Packard Model 4194A) and aUV-Vis-NIR spectrophotometer (Hitachi U-4100) was usedfor transmittance measurements. Raman spectra wererecorded in the range of 100–1,000 cm−1 using a Ramanspectrometer (JY Horiba LabRam HR 800, Horiba Ltd.,Japan) equipped with a CCD detector and a 514.5 nmargon laser of 50 mW power at the source. All sampleshad a Zr/Ti ratio of 0.54/0.46 and were ball milled for 48h if not mentioned otherwise.
Results and discussion
X-ray diffraction (XRD) patterns of 0.3Pb(Zn1/3Nb2/3)O3–0.7Pb0.97La0.03(ZrxTi1−x)O3 (0.52 ≤ x ≤ 0.54) transparentceramics are shown in Figure 1(a). These exhibit forma-tion of a perovskite phase with or without a pyrochlore(Pb2Nb2O7, JCPDS # 40–0828) phase, depending upon theprocessing duration, initial precursors and stoichiometricexcess of elements such as Pb, Nb, La or Zn and/or Zr/Tiratio. Figure 1 (a-u2) and (b-1) and (a-u16) and (b-5)shows XRD patterns of 5% stoichiometric excess of Pbat Zr/Ti ratios of 54/46 (x ¼ 0.54) and 52/48 (x ¼ 0.52),respectively. The excess lead revealed selective elimina-tion of the Pb2Nb2O7 phase, i.e. samples with a Zr/Ti ratioof 52/48 exhibited complete removal of Pb2Nb2O7 phase.The ceramics synthesized with a Zr/Ti ratio of 54/46exhibited reduced formation of the Pb2Nb2O7 phasewhen the ball milling duration was increased to 144 h.Use of the ZnNb2O6 precursor in place of ZnO and Nb2O5
at the Zr/Ti ratio of 54/46 also showed reduced formationof the Pb2Nb2O7 phase. These ceramics were furtherinvestigated for the stoichiometric excess of elementssuch as Nb, La and Zn. Stoichiometric excess of La andNb showed none or negligible effect on the formation ofthe Pb2Nb2O7 phase (Figure 1(a)–(b)). However, at 5%stoichiometric excess of Zn, the complete leaching of apyrochlore phase was obtained (Figure 1(b-4)). Scanningelectron micrographs of the cross-section of 0.3Pb(Zn1/3Nb2/3)O3–0.7Pb0.97La0.03(ZrxTi1−x)O3 ceramics (figures not
224 A. Kumar et al.: Opto-electrical Behavior of PZT
Brought to you by | Virginia Tech (Virginia Polytechnical Institute)Authenticated
Download Date | 12/3/14 11:14 PM

shown due to space limitations) showed high uniformityand density.
The formation of secondary phase has been attribu-ted to the Pb deficiency, and therefore, excess Pb couldlead to crystallization of pure perovskite phase. However,the complete extinction of the Pb2Nb2O7 phase (at 5%excess stoichiometric Pb) was observed only at a Zr/Tiratio of 52/48 (but not at Zr/Ti ratio of 54/46) and can beinterpreted as follows. Zirconium (Zr) is a tetravalent ion,while titanium (Ti) can occur in the þ 4, þ 3, and þ 2valence states. However, in this study samples weresynthesized in oxygen ambient and, therefore, Ti will bemainly in Ti4þ state. The ionic radii of Zr4þ and Ti4þ insixfold coordination are 0.72 and 0.605 Å, respectively
(Miller, Vandome, and McBrewster 2010). Replacing Zrwith Ti results in lattice contraction because of the smal-ler radius of Ti4þ compared to Zr4þ ions. This, in turn,may reduce the B–O bond length of ABO3 type structureand provide stability to the perovskite structure (Zhanget al. 2006). Further, using the columbite method andincreasing ball milling duration both results in reducedformation of Pb2Nb2O7. Addition of excess ZnO has beenfound to stabilize the perovskite phase. Also, 5% stoichio-metric excess of zinc resulted in the complete removal ofthe Pb2Nb2O7 phase (Zeng et al. 2005a). Figure 1(c) showsthe variation in the electro-mechanical coupling factor(kp) as a function of stoichiometric excess of variouselements and processing conditions. Increasing Pb
Figure 1 (Color online) (a) X-ray diffraction (XRD) patterns of 0.3Pb(Zn1/3Nb2/3)O3–0.7Pb0.97La0.03(ZrxTi1−x)O3 (x ¼ 0.54) ceramics withstoichiometric excess of (u1–u3) 0, 5, 10% Pb, (u4–u6) 1.5, 2.5, 5% Nb, (u7–u9) 1.5, 2.5, 5% La, (u10–u12) 1.5, 2.5, 5% Zn, (u13) 0% Pb ballmilling for 144 h, (u14) columbite method, (u15) 0% Pb with Zr/Ti ratio of 52/48 and (u16) 5% Pb with Zr/Ti ratio of 52/48 and (b) showingformation/extinction of Pb2Nb2O6 phase, (c) variation of electromechanical coupling factor (kp) [with excess (p) Pb, (q) Zn, (r) Nb, (s) La, (t)Pb (columbite method), (u) Pb ball milling for 144 h and (v) 5% excess Pb, Zr/Ti ratio 52/48], (d) Variation of dielectric permittivity withtemperature and (e) P-E hysteresis curves for (1) 0% Pb, (2) 0% Pb-columbite method, (3) 0% Pb, ball milling for 144 h, (4) 5% Zn and (5) 5%Pb, Zr/Ti ratio 52/48
A. Kumar et al.: Opto-electrical Behavior of PZT 225
Brought to you by | Virginia Tech (Virginia Polytechnical Institute)Authenticated
Download Date | 12/3/14 11:14 PM

content reduces kp in all samples. Samples synthesizedusing individual oxide powders as precursors and usingthe columbite method both show similar behavior of kpwith Pb excess. However, the columbite method resultedin a lower value of kp ~53%. In lead-based piezoelectricmaterials, Pb vacancies are inevitable during processingat higher temperature. However, these Pb vacanciescould generate oxygen vacancies according to Schottkyequilibrium (null → VPb þ V˚˚
O) to maintain local chargeneutrality (Huang, Chen, and Wu 2004; Wu and Cao1999). Niobium and lanthanum act as soft doping ionson B- and A-sites, respectively. The substitutions of Nb5þ
on B4þ sites and La3þ on A2þ sites, results in extrapositive charges. This extra charge could reduce the for-mation of oxygen vacancies due to Schottky equilibriumleaving only Pb vacancies in the system (Kubinski andHolloway 1995). These Pb vacancies have been consid-ered to facilitate the domain wall motion resulting in highelectro-mechanical response in soft piezoelectric materi-als (Flygare and Gierke 1974). Therefore, the increasedvalue of kp, in the case of excess niobium and lanthanumcontent could be attributed to these Pb vacancies.Moreover, excess zinc addition resulted in a continuousincrease in kp, due to reduced pyrochlore phase (Zenget al. 2005a). The specimen processed with extended ballmilling duration (144 h) resulted in higher kp values,independent of the processing method or excess stoichio-metric content of various elements. The highest values ofkp ~62.3% were observed in samples with 5% stoichio-metric excess of Zn and 5% Pb (Zr/Ti ratio of 0.52/0.48).
Figure 1(d) shows the variation in dielectric permit-tivity with temperature in the frequency range 100 Hz–15MHz for each sample. The dielectric permittivity variationwith frequency is not significant, and, therefore, the var-ious curves taken at different frequencies seem to overlap(Figure 1 (d)). The Curie temperature (Tc) for the stoichio-metric sample synthesized at a Zr/Ti ratio of 54/46 isabout 222°C. However, the sample containing 5% excessPb exhibited Tc of 245°C at a Zr/Ti ratio of 52/48. As notedabove, the ionic radii of Zr4þ and Ti4þ in sixfold coordi-nation are 0.72 and 0.605 Å, respectively (Miller,Vandome, and McBrewster 2010). The smaller size ofthe Ti4þ ion in the octahedral site increases the rattlingtendency, which, in turn, elevates the Curie temperature(Flygare and Gierke 1974). The substitution of La3þ andNb5þ upto certain extent of concentration results in simi-lar effect on lattice relaxation and could lead to therelaxation of oxygen framework to the tilted structure(Seinfeld and Pandis 2006). Also, there is none or negli-gible formation of the Pb2Nb2O7 phase, indicating thatmost of the Nb5þ ions occupy the “B” lattice sites. The
Curie temperature of 0.3Pb(Zn1/3Nb2/3)O3–0.7Pb0.97La0.03(ZrxTi1−x)O3 (x ¼ 0.54) at 0% stoichiometric excess leadcontent and synthesized using single oxides or ZnNb2O6
precursor processed for 48 h, is 222°C. The Curie tempera-ture is marginally decreased (~220°C) at increased ballmilling time (144 h). The sample with 5% excess stoichio-metric Zn exhibited the lowest Curie temperature (217°C).Excess Zn content restricted the formation of thePb2Nb2O7 phase completely and, therefore, retained allthe Nb5þ in the ABO3 type lattice. Inserting zinc as þ 2and Nb as þ 5 into “B” sites in an ABO3 type structurerequires charge compensation and, in turn, may reducethe formation of oxygen vacancies. Also, the larger ionicradius of Zn2þ (0.74 Å) in sixfold coordination in com-parison to Nb5þ (0.64 Å) and Ti4þ (0.605 Å) reduces thesize of rattling space and, in turn, will reduce the ten-dency of Zn2þ ions to rattle, leading to a reduced Curietemperature.
Figure 1(e) shows the polarization versus electric field(P–E) hysteresis curves for the 0.3Pb(Zn1/3Nb2/3)O3–0.7Pb0.97La0.03(ZrxTi1−x)O3 samples. Samples with a stoi-chiometric composition and Zr/Ti ratio of 54/46 exhibit asaturation polarization (Ps) value of ~39.4 µC/cm2. Thisvalue is slightly increased (~40.0 µC/cm2) if the sampleswere synthesized using ZnNb2O6 precursor. Increased ballmilling duration of precursors (~144 h) resulted in afurther increase in the Ps value (~41.6 µC/cm2) due toreduced formation of secondary phase. An excess stoi-chiometric content of 5% Zn increased Ps values furtherto 42.5 µC/cm2. The samples with 5% excess stoichio-metric lead content at x ¼ 0.52 exhibited the highest Psvalues of 43.6 µC/cm2. Furthermore, the stoichiometric0.3Pb(Zn1/3Nb2/3)O3–0.7Pb0.97La0.03(ZrxTi1−x)O3 samplewas found to exhibit coercive field (Ec) ~9.49 kV/cm.This value is slightly decreased in the samples preparedusing the columbite method (9.1 kV/cm). Ball milling ofthe samples for longer durations, i.e. up to 144 h, furtherreduced the coercive field to 8.76 kV/cm. The values of Ecfor 5% excess Pb (Zr/Ti ratio 52/48) and 5% Zn werefound to be 9.7 and 9.9 kV/cm, respectively.
Figure 2(a) shows the optical transmittance of the0.3Pb(Zn1/3Nb2/3)O3–0.7Pb0.97La0.03(ZrxTi1−x)O3 samples.The samples with 5% excess stoichiometric zinc contentat x ¼ 0.54 exhibited the highest transmittance in thevisible region followed by the transmittance of the sam-ples containing 5% excess lead at x ¼ 0.52 (the transmit-tance values of the samples with 5% excess lead at x ¼0.52 were highest above a wavelength of 800 nm). Thetransmittance (T) values for other samples increasedaccording to the relation: samples synthesized using indi-vidual oxides < samples synthesized using the columbite
226 A. Kumar et al.: Opto-electrical Behavior of PZT
Brought to you by | Virginia Tech (Virginia Polytechnical Institute)Authenticated
Download Date | 12/3/14 11:14 PM

method < samples synthesized with extended ball millingtime of 144 h. The T values for these samples weresmaller than those of the samples synthesized using 5%excess Zn content and/or 5% excess Pb (at Zr/Ti ratio of52/48). Insets in Figure 2(a) show the transmittance image
and a photomicrograph of a typical sample.Microstructural variables such as density, grains size,microscopic pores, point defects and secondary phasemodify the transmittance behavior (Hu et al. 2010). Thepoor transmittance value in pyrochlore containing sam-ple can be attributed to the increased scattering throughits segregation at grain boundaries. Also, the progressiveincrease in transmittance value with increase in wave-lengths results due to grain size and wavelength-depen-dent scattering effects (Wang 2010).
The variation of optical absorbance as a function ofwavelength, where h denotes Planck constant and ν is thefrequency of radiation, is shown in Figure 2(b). The absor-bance data were obtained in transmission mode for thesample thickness of 0.35 mm (for each sample). The varia-tion of (αhν)2 as a function of energy (hν), where α is theabsorption coefficient, is displayed in the inset ofFigure 3(b). The band gap energy Eg is obtained by extra-polating the linear portion of the graph to energy axis atα ¼ 0. The optical band gap (Eg) estimated using therelation, (αhυ) ¼ C(hυ−Eg)n, where C is the constant andn ¼ ½ for a direct allowed transition, were 2.88, 2.90, 2.90,2.92, and 2.92 eV for the samples with excess (1) 0% Pb,(2) 0% Pb-columbite method, (3) 0% Pb ball milling for144 h, (4) 5% Zn and (5) 5% Pb, Zr/Ti ratio 52/48, respec-tively. Chemistry at A- and B- sites, more specifically, theionic sizes modify the band gap (Wang 2010). However, theB–O bonding characteristics predominates the opticalband-gap over A-site chemistry. In the present study, thehigher band gap values in the case of 5% excess Zn (Zr/Tiratio 54/46) and 5% excess Pb (Zr/Ti ratio of 52/48) can beattributed to the increased content of larger size ions, i.e.Zn2þ (0.74 Å) and Zr4þ (0.72 Å) at B sites. Since, 0.3Pb(Zn1/3Nb2/3)O3–0.7Pb0.97La0.03(ZrxTi1−x)O3 (x ¼ 0.54) ceramics atthe stoichiometric excess of 5% Zn exhibit the highestoptical band gap and transmittance (in the visible range),these ceramics were further investigated to examine theircurrent–voltage behavior to identify their possible applica-tions in electro-optical-devices.
The low stoichiometric excess of all elements, e.g.Nb, La and Zn in 0.3Pb(Zn1/3Nb2/3)O3–0.7Pb0.97La0.03(ZrxTi1−x)O3 (x ¼ 0.54), revealed the improved character-istics. To understand its relation with domain shape, sizeand orientation, we investigated two samples; one ofstoichiometric composition (sample code S1) and otherwith 1.5% stoichiometric excess of Nb (sample code S2)using Piezoresponse force microscopy (PFM, DimensionIcon, Bruker). Figure 3 (a)–(d) shows the PFM phase andamplitude mapping of samples S1 and S2 respectively (ofapproximately 100 μm thickness). It was noticed that allthe piezoreponse images exhibited a strong domain
Figure 2 (Color online) (a) Transmittance in the wavelength range300–2,000 nm; insets show transmittance image of a line through atypical sample of thickness 0.35 mm, and its photomicrograph, and(b) UV-Vis-NIR absorbance spectra for the 0.3Pb(Zn1/3Nb2/3)O3–0.7Pb0.97La0.03(ZrxTi1−x)O3 (x ¼ 0.54) samples with excess (1) 0%Pb, (2) 0% Pb-columbite method, (3) 0% Pb ball milling for 144 h, (4)5% Zn and (5) 5% Pb, Zr/Ti ratio 52/48, respectively
A. Kumar et al.: Opto-electrical Behavior of PZT 227
Brought to you by | Virginia Tech (Virginia Polytechnical Institute)Authenticated
Download Date | 12/3/14 11:14 PM
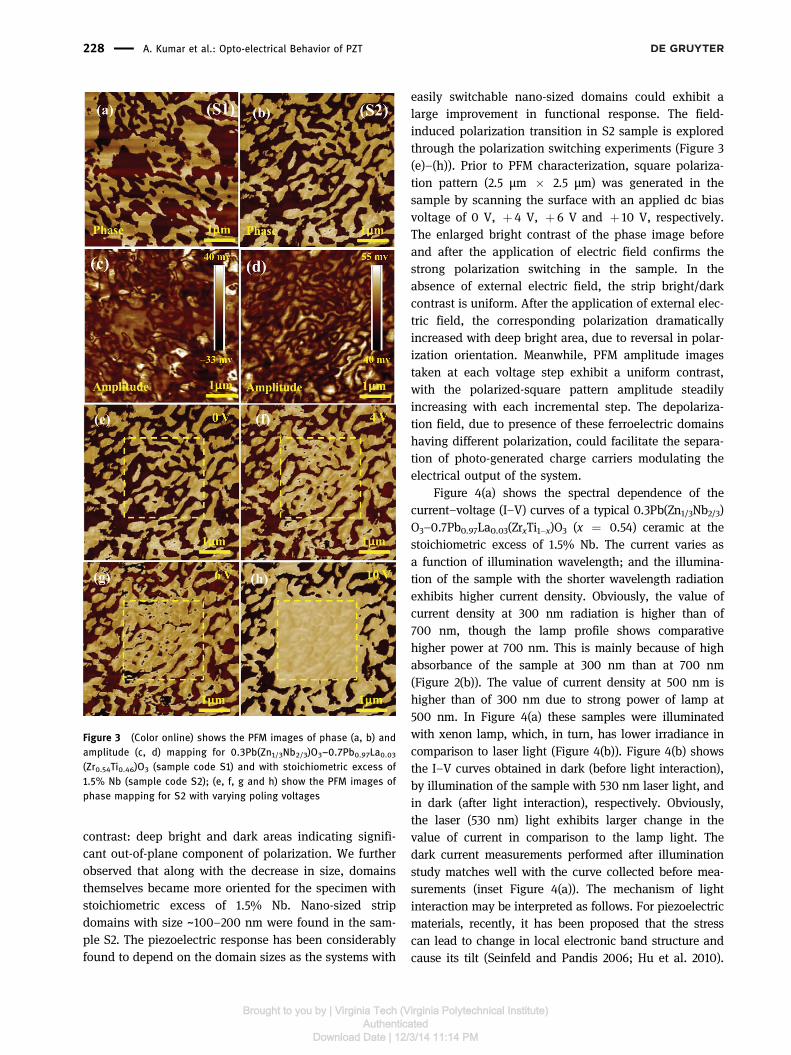
contrast: deep bright and dark areas indicating signifi-cant out-of-plane component of polarization. We furtherobserved that along with the decrease in size, domainsthemselves became more oriented for the specimen withstoichiometric excess of 1.5% Nb. Nano-sized stripdomains with size ~100–200 nm were found in the sam-ple S2. The piezoelectric response has been considerablyfound to depend on the domain sizes as the systems with
easily switchable nano-sized domains could exhibit alarge improvement in functional response. The field-induced polarization transition in S2 sample is exploredthrough the polarization switching experiments (Figure 3(e)–(h)). Prior to PFM characterization, square polariza-tion pattern (2.5 μm � 2.5 μm) was generated in thesample by scanning the surface with an applied dc biasvoltage of 0 V, þ 4 V, þ 6 V and þ 10 V, respectively.The enlarged bright contrast of the phase image beforeand after the application of electric field confirms thestrong polarization switching in the sample. In theabsence of external electric field, the strip bright/darkcontrast is uniform. After the application of external elec-tric field, the corresponding polarization dramaticallyincreased with deep bright area, due to reversal in polar-ization orientation. Meanwhile, PFM amplitude imagestaken at each voltage step exhibit a uniform contrast,with the polarized-square pattern amplitude steadilyincreasing with each incremental step. The depolariza-tion field, due to presence of these ferroelectric domainshaving different polarization, could facilitate the separa-tion of photo-generated charge carriers modulating theelectrical output of the system.
Figure 4(a) shows the spectral dependence of thecurrent–voltage (I–V) curves of a typical 0.3Pb(Zn1/3Nb2/3)O3–0.7Pb0.97La0.03(ZrxTi1−x)O3 (x ¼ 0.54) ceramic at thestoichiometric excess of 1.5% Nb. The current varies asa function of illumination wavelength; and the illumina-tion of the sample with the shorter wavelength radiationexhibits higher current density. Obviously, the value ofcurrent density at 300 nm radiation is higher than of700 nm, though the lamp profile shows comparativehigher power at 700 nm. This is mainly because of highabsorbance of the sample at 300 nm than at 700 nm(Figure 2(b)). The value of current density at 500 nm ishigher than of 300 nm due to strong power of lamp at500 nm. In Figure 4(a) these samples were illuminatedwith xenon lamp, which, in turn, has lower irradiance incomparison to laser light (Figure 4(b)). Figure 4(b) showsthe I–V curves obtained in dark (before light interaction),by illumination of the sample with 530 nm laser light, andin dark (after light interaction), respectively. Obviously,the laser (530 nm) light exhibits larger change in thevalue of current in comparison to the lamp light. Thedark current measurements performed after illuminationstudy matches well with the curve collected before mea-surements (inset Figure 4(a)). The mechanism of lightinteraction may be interpreted as follows. For piezoelectricmaterials, recently, it has been proposed that the stresscan lead to change in local electronic band structure andcause its tilt (Seinfeld and Pandis 2006; Hu et al. 2010).
Figure 3 (Color online) shows the PFM images of phase (a, b) andamplitude (c, d) mapping for 0.3Pb(Zn1/3Nb2/3)O3–0.7Pb0.97La0.03(Zr0.54Ti0.46)O3 (sample code S1) and with stoichiometric excess of1.5% Nb (sample code S2); (e, f, g and h) show the PFM images ofphase mapping for S2 with varying poling voltages
228 A. Kumar et al.: Opto-electrical Behavior of PZT
Brought to you by | Virginia Tech (Virginia Polytechnical Institute)Authenticated
Download Date | 12/3/14 11:14 PM

The 10% tensile stress in zigzag boron nitride nano-ribbons was found to reduce the band gap energy valuefrom 3.5 eV to 1.0 eV (Qi et al. 2012). Thus, the appliedvoltage during the I–V measurement may lower the band-gap energy slightly at the þ ve potential (tensile stress)and increased at –ve (compressive stress), which, subse-quently, will lead to light interacting charge recombinationdevice similar to P–N junction (Qi et al. 2012). The otherpossible contributions of current may be due to heatingthrough absorbed light, and the interaction of radiationwith crystal lattice and generation of electric dipoles(though transmitted light).
To examine the effect of temperature and suitability ofsuch devices, if operated in extreme conditions, we collectedlaser Raman spectra of the sample 0.3Pb(Zn1/3Nb2/3)O3–
0.7Pb0.97La0.03(ZrxTi1−x)O3 (x ¼ 0.54) having stoichiometricexcess of 5% Zn. In Figure 5, the Raman modes Rh, R1 and E(2TO2) correspond to the R3m structure (rhombohedral),modes A1(1TO), A1(3LO), E(4LO), A1(3TO), E(4TO) and E(2TO1) appear due to P4mm (tetragonal) structure, andmodes E(2LO), A1(2TO) and Silent (E þ B1) are caused byboth R3mand P4mm structures. Clearly, the sample consistsof a MPB phase with rhombohedral and tetragonal structureand a total of 12 Raman modes (He et al. 2009; Fan and Kim2002; Wang et al. 2012; La-Orauttapong et al. 2002; Rahman,Metselaar, and Karmaker 2014; Pandey and Singh 2014).These samples were further investigated as a function oftemperature. Interestingly, the soft transverse modes A1
(1TO) were present at higher temperature than the macro-scopic transition temperature and exhibited a redshift infrequency with increase in temperature. Appearance ofthese phonon modes at higher temperature than the macro-scopic transition temperature indicates order–disorder typetransition due to the presence of PNRs with rhombohedral–tetragonal phases (similar features can also be observed in Ephonon modes) (Zhang et al. 2011). The localized PNRsobserved at higher temperatures may have different natureof interaction with optical radiation (than observed at roomtemperature Figure 3) and, in turn, could lead to intriguingopto-electric-interactions.
Conclusions
In conclusion, stoichiometric excess Pb, Nb, La and Znrevealed variable effects on properties. Improved properties
Figure 5 (Color online) Temperature-dependent Raman spectra of0.3Pb(Zn1/3Nb2/3)O3–0.7Pb0.97La0.03(ZrxTi1−x)O3 (x ¼ 0.54) ceramicat the stoichiometric excess of 5% Zn
Figure 4 (Color online) Current–voltage (I–V) curve of 0.3Pb(Zn1/3Nb2/3)O3–0.7Pb0.97La0.03(ZrxTi1−x)O3 (x ¼ 0.54) ceramic at 1.5% stoi-chiometric excess Nb, using various wavelengths obtained from thelamp (a), and laser light of wavelength 530 nm (b); both (a) and (b)include a dark current curve for comparison
A. Kumar et al.: Opto-electrical Behavior of PZT 229
Brought to you by | Virginia Tech (Virginia Polytechnical Institute)Authenticated
Download Date | 12/3/14 11:14 PM

were noticed in stoichiometric excess of (i) 5% Zn at Zr/Tiratio of 54/46 and (ii) 5% Pb at Zr/Ti ratio of 52/48. At lowerexcess stoichiometric content of various elements, thereduced domain size and their ordering contributed towardimproved properties. The results of this study will lead tosynthesis of materials with superior electro-mechanical,ferroelectric, dielectric, optical, opto-electrical propertiesfor applications in wireless opto-electric-devices workingover a wide range of temperatures.
Research funding: This work was supported by the Officeof Basic Energy Sciences, Department of Energy throughthe grant number DE-FG02-06ER 46290.
References
Ahart, M., M. Somayazulu, R. E. Cohen, P. Ganesh, P. Dera,H. -K. Mao, R. J. Hemley, Y. Ren, P. Liermann, and Z. Wu. 2008.“Origin of morphotropic phase boundaries in ferroelectrics.”Nature 451:545.
Bowen, C. R., J. Taylor, E. LeBoulbar, D. Zabek, A. Chauhan, and R. Vaish.2014. “Pyroelectric materials and devices for energy harvestingapplications.” Energy & Environmental Science 7: 3836
Chin, T. K., F. Y. Lee, I. M. McKinley, S. Goljahi, C. Lynch, andL. Pilon. 2012. “Pyroelectric waste heat energy harvesting using9.5/65/35 PLZT ceramics.” IEEE Transactions on UltrasonicsFerroelectrics 59:2373.
Cohen, R. E. 2006. “Materials science: Relaxors go critical.” Nature441:941.
Cowley, R. A., S. N. Gvasaliya, S. G. Lushnikov, B. Roesslic, andG. M. Rotaru. 2011. “Relaxing with relaxors: a review of relaxorferroelectrics.” Advanced Physics 60:229.
Etin, A., G. E. Shter, R. Brener, S. Baltianski, and G. S. Grader. 2007.“Surface Composition and Imprint in CSD-Based PZT Films.”Journal of the American Ceramic Society 90:3800.
Fan, H., and H. E. Kim. 2002. “Perovskite stabilization and electro-mechanical properties of polycrystalline lead zinc niobate –lead zirconate titanate.” Journal of Applied Physics 91:317.
Feldhoff, A., and B. Geppert. 2014. “A High-temperature thermo-electric generator based on oxides.” Energy Harvesting andSystems 1:69–78.
Flygare, W. H., and T. D. Gierke. 1974. “Light Scattering inNoncrystalline Solids and Liquid Crystals.” Annual Review ofMaterials Research 4:255.
Haertling, G. H. 1999. “Ferroelectric Ceramics: History andTechnology.” Journal of the American Ceramic Society 82:797.
He, X., X. Zeng, X. Zheng, P. Qiu, W. Cheng, and A. Ding. 2009.“Fabrication and characteristics of relaxor ferroelectricPZN–PZT (53/47) thin films by a MOD process.” Journal ofPhysics: Conference Series 152:012068.
Hu, Y., Y. Chang, P. Fei, R. L. Snyder, and Z. L. Wang. 2010. “TransportCharacteristics of ZnO Micro/Nanowire Devices by CouplingPiezoelectric and Photoexcitation Effects.” ACS Nano 4:1234.
Huang, C. -L., B. -H. Chen, and L. Wu. 2004. “Variability of impuritydoping in the modified Pb(Zr,Ti)O3 ceramics of type ABO3.”Solid State Communications 130:19.
Hussain, M., M. A. Abbasi, A. Khan, O. Nur, and M. Willander. 2014.“Comparative Study of Energy Harvesting from ZnO NanorodsUsing Different Flexible Substrates.” Energy Harvesting andSystems 1:19–26.
Kozielski, L., M. Adamczyk, and J. Erhart. 2011. “PLZT-based photo-voltaic Piezoelectric Transformer with light feedback.” IOPConference Series 18:092001.
Kubinski, D. J., and H. Holloway. 1995. “Dependence of giant mag-netoresistance on the number of valence-electrons in theferromagnetic constituent of granular alloys – precipitatesofface-centered-cubic Fe-Co, Co-Ni, and Ni-Cu alloys in Agmatrices.” Journal of Applied Physics 77:2508.
La-Orauttapong, D., B. Noheda, Z. -G. Ye, P. M. Gehring, J. Toulouse,D. E. Cox, and G. Shirane. 2002. “Phase diagram of the relaxorferroelectric (1-x)Pb(Zn1/3Nb2/3)O3–xPbTiO3.” Physical ReviewB 65:144101.
Li, C. -L., and C. -C. Chou. 2003. “Preparation of PZN-Based CeramicsUsing a Sequential Mixing Columbite Method.” IntegratedFerroelectrics 55:955.
Li, C. -L., and C. -C. Chou. 2006. “Microstructures and electricalproperties of lead zinc niobate – lead titanate – lead zirconateceramics using microwave sintering.” Journal of the EuropeanCeramic Society 26:1237.
Miller, F. P., A. F. Vandome, and J. McBrewster. 2010.Kroger-Vink Notation. Germany: VDM Verlag Dr. Mueller GmbH& Co. KG.
Nonnenmann, S. S., E. M. Gallo, and J. E. Spanier. 2010. “Redox-based resistive switching in ferroelectric perovskite nanotubes.”Applied Physics Letters 97:102904.
Pandey, R., and A. K. Singh. 2014. “Presence of a monoclinic (Pm)phase in the morphotropic phase boundary region of multi-ferroic (1–x)Bi(Ni1/2Ti1/2)O3-xPbTiO3 solid solution: A Rietveldstudy.” Applied Physics 116:044102.
Qi, J., X. Qian, L. Qi, J. Feng, D. Shi, and J. Li. 2012. Nano Letters12:1224.
Qin, M., K. Yao, and Y. C. Liang. 2010. “Development of low-costferroelectric PLZT devices for photovoltaic power generation.”IEEE Sustainable Energy Technology 1:1.
Rahman, M. M., H. S. C. Metselaar, and P. C. Karmaker. 2014.“Nanoscale domain structures in 0.91Pb(Zn1/3Nb2/3)O3-0.09PbTiO3 (91PZN-9PT) single crystals studied by piezore-sponse forcemicroscopy.” Phase Transformation 87:419.
Ryu, J., W. -H. Yoon, J. -J. Choi, B. -D. Hahn, J. -W. Kim, D. -S. Park,C. -W. Ahn, S. Priya, and D. -Y. Jeong. 2011. “Stress-controlledPb(Zr0.52Ti0.48)O3 thick films by thermal expansion mismatchbetween substrate and Pb(Zr0.52Ti0.48)O3 film.” Journal ofApplied Physics 110:124101.
Seinfeld, J. H., and S. N. Pandis. 2006. Atmospheric Chemistry andPhysics. Hoboken, NJ: John Wiley and Sons.
Shannon, R. D. 1976. “Revised effective ionic radii and systematicstudies of interatomic distances in halides and chalcogenides.”Acta Crystallography A 32:751.
Uchino, K. 1997. Piezoelectric Actuators and Ultrasonic Motors.Norwell, MA: Kluwer Academic.
Wang, Z. L. 2010. “Piezopotential gated nanowire devices:Piezotronics and piezo-phototronics.” Nano Today 5:540.
Wang, N., Q. Sun, W. Ma, Y. Zhang, and H. Liu. 2012. “Investigationof La-doped 0.25Pb(Zn1/3Nb2/3)O3-0.75Pb(ZrxTi1-x)O3ceramics near morphotropic phase boundary.” Journal ofElectroceramics 28:15.
230 A. Kumar et al.: Opto-electrical Behavior of PZT
Brought to you by | Virginia Tech (Virginia Polytechnical Institute)Authenticated
Download Date | 12/3/14 11:14 PM

Wu, Y., and G. Cao. 1999. “Enhanced ferroelectric properties andlowered processing temperatures of strontium bismuth nio-bates with vanadium doping.” Applied Physics Letters75:2650.
Wu, Y. J., J. Li, X. M. Chen, R. Kimura, and K. Kakegawa. 2008.“Transparent PbZrO3-PbTiO3-Pb(Zn1/3Nb2/3)O3 ceramicsmodified with La2O3 and PbO.” Journal of the AmericanCeramic Society 91:13.
Yin, Q., B. Zhu, and H. Zeng. 2009. Microstructure, Property andProcessing of Functional Ceramics. New York:Springer.
Zeng, X., A. L. Ding, G. C. Deng, T. Liu, and X. S. Zheng. 2005a.“Effects of lanthanum doping on the dielectric, piezoelectricproperties and defect mechanism of PZN–PZT ceramics pre-pared by hot pressing.” Physica Status Solidi A 202:1854.
Zeng, X., A. L. Ding, T. Liu, G. C. Deng, and X. S. Zheng. 2005b.“Excess ZnO addition in PZN–PLZT ceramics.” Physica StatusSolidi A 202:1842.
Zeng, X., A. L. Ding, T. Liu, G. C. Deng, X. S. Zheng, and W. X. Cheng.2006. “Excess ZnO Addition in Pure and La-Doped PZN–PZTCeramics.” Journal of the American Ceramic Society 89:728.
Zeng, X., A. L. Ding, X. S. Zheng, and T. Liu. 2007. “Effects of excessZnO addition on La-doped PZN–PZT ceramics prepared by hotpressing.” Ceramics International 33:883.
Zhang, Z., L. Lu, C. Shu, and P. Wu. 2006. “Computational investi-gation of B-site donor doping effect on fatigue behavior of leadzirconate titanate.” Applied Physics Letters 89:152909.
Zhang, N., H. Yokota, A. M. Glazer, and P. A. Thomas. 2011. “The notso simple cubic structure of PbZr(1-x)Ti(x)O3 (PZT): complexlocal structural effects in perovskites.” Acta CrystallographicaB 67:461.
Zhao, Y., A. Kumar, G. A. Khodaparast, A. Eltahir, H. Wang, andS. Priya. 2014. “Sintering temperature-dependent chemicaldefects and the effect on the electrical resistivity of thermo-electric ZnO.” Energy Harvesting and Systems 1:113–19.
A. Kumar et al.: Opto-electrical Behavior of PZT 231
Brought to you by | Virginia Tech (Virginia Polytechnical Institute)Authenticated
Download Date | 12/3/14 11:14 PM