arup-ec7-180314v2
DESCRIPTION
arupTRANSCRIPT

www.fugro.com
Optimisation of
Geotechnical
Design by Eurocode 7
Adriaan van Seters
Fugro GeoServices BV
March 18th 2014

www.fugro.com Date
Contents Menu
Optimisation of design using Eurocodes
Evaluation of existing structures
Determination of characteristic values
Conclusions

www.fugro.com
Optimisation of design using EC7
Many options:
• Take into account the design life period adjust
• Extensive soils investigation
• Pile foundations – more CPT’s reduction of -values
• Pile/Anchor Load testing
• Observational method
• etc
Two (Dutch) possibilities are discussed:
• Evaluation of existing structures ( - value)
• Determination of characteristic values

www.fugro.com
Existing structures in the Netherlands
Existing structures reduced probability of failure because:
– Cost for increasing the safety level for existing structures much
higher than for new structures
– Remaining design life for existing structures often less than 50 –
100 years
– The behaviour of the structure is known (proven strength)
Codes NEN 8700 – equivalent EN 1990
NEN 8707 – equivalent EN 1997

www.fugro.com
Safety Levels
For CC2-structures 3 safety levels are distinguished
– New buildings = 3.8 (Probability of failure 0,7 * 10-4)
– Rejection level, building must be restored = 2.5 (Probability of failure 0,6 * 10-2)
– Safety level after restoration = 3.3 (Probability of failure 0,5 * 10-3)
– Reference period of 15 years iso 50 years for variable Q-loads
– Material and resistance factors unchanged to new buildings
In engineering terms – loadfactors
Loadfactors
CC2-building
Permanent loading
G
Variable loading
Q
Probability Index
New structures 1.35 1.5 3.8
Safety after
restoration
1.3 1.3 3.3
Minimum safety
level
1.2 1.15 2.5
www.fugro.com
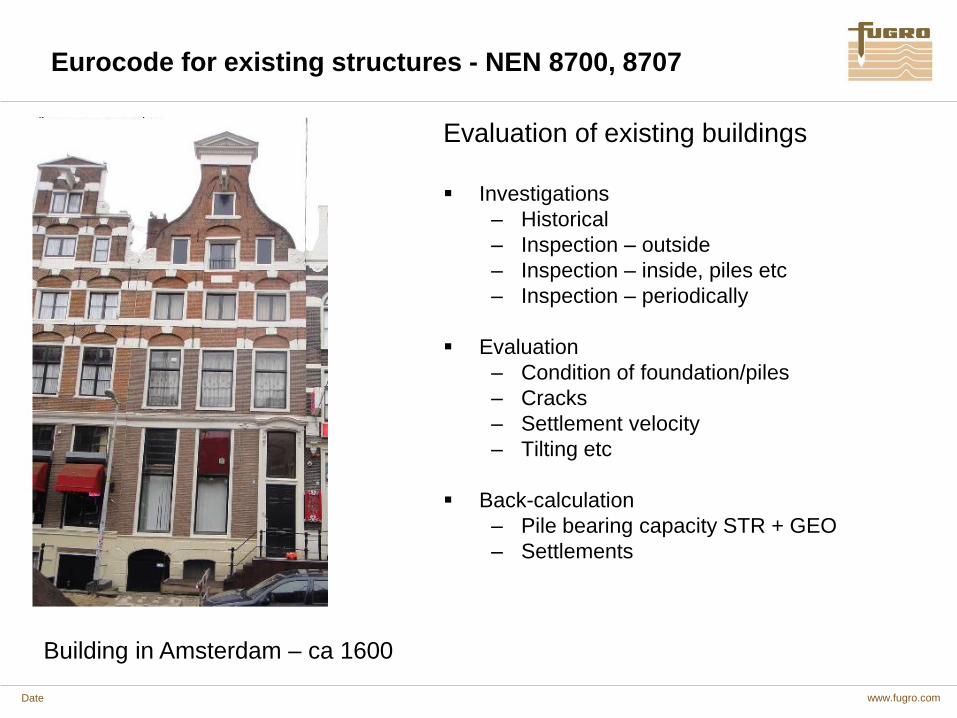
Eurocode for existing structures - NEN 8700, 8707
Evaluation of existing buildings
Investigations
– Historical
– Inspection – outside
– Inspection – inside, piles etc
– Inspection – periodically
Evaluation
– Condition of foundation/piles
– Cracks
– Settlement velocity
– Tilting etc
Back-calculation
– Pile bearing capacity STR + GEO
– Settlements
Date
Building in Amsterdam – ca 1600

www.fugro.com
Evaluation of piled foundations
Checking piles
- Penetration in wood
(Woodpecker – 15 – 40 mm) -
- Back calculation bearing capacity

www.fugro.com
Back-calculation Geotechnical bearing capacity
Pile tip – 13 m
Pile head 236 mm
Pile tip 140 mm
Design bearing capacity 160 kN
Design load reduced loadfactors 89 kN
Calculation procedure conform new
buildings
Foundation is OK
www.fugro.com
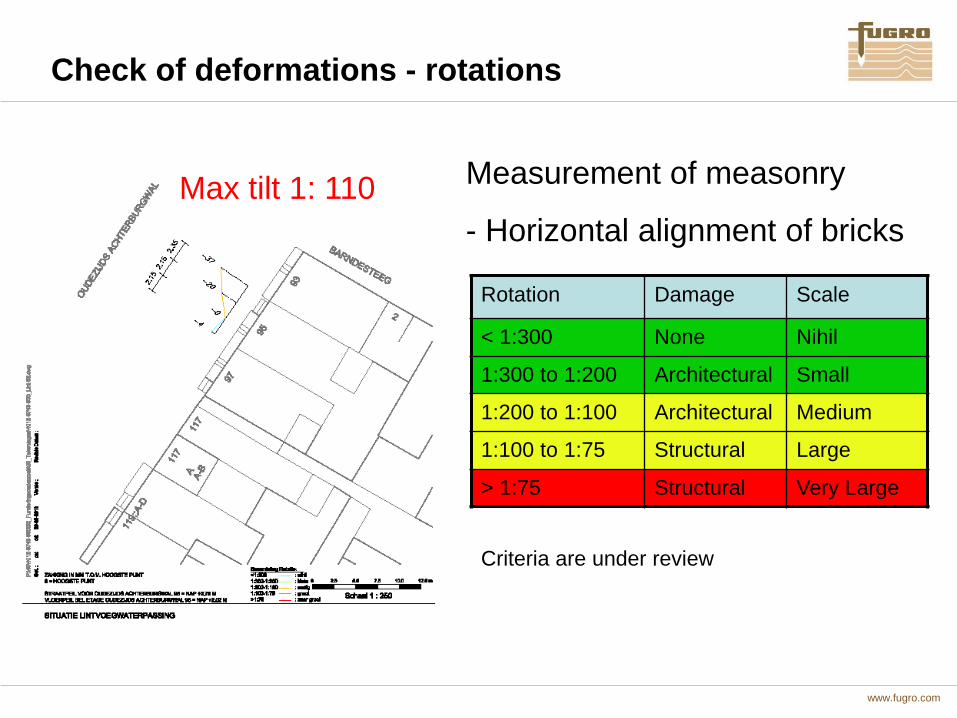
Check of deformations - rotations
Rotation Damage Scale
< 1:300 None Nihil
1:300 to 1:200 Architectural Small
1:200 to 1:100 Architectural Medium
1:100 to 1:75 Structural Large
> 1:75 Structural Very Large
Measurement of measonry
- Horizontal alignment of bricks
Criteria are under review
Max tilt 1: 110

www.fugro.com
New method determining state of foundation
Excitator in the street
Accelerator measurements on the houses
Good/bad foundation difference in response
Calibration with excavated foundation
Courtesy City of Rotterdam
www.fugro.com
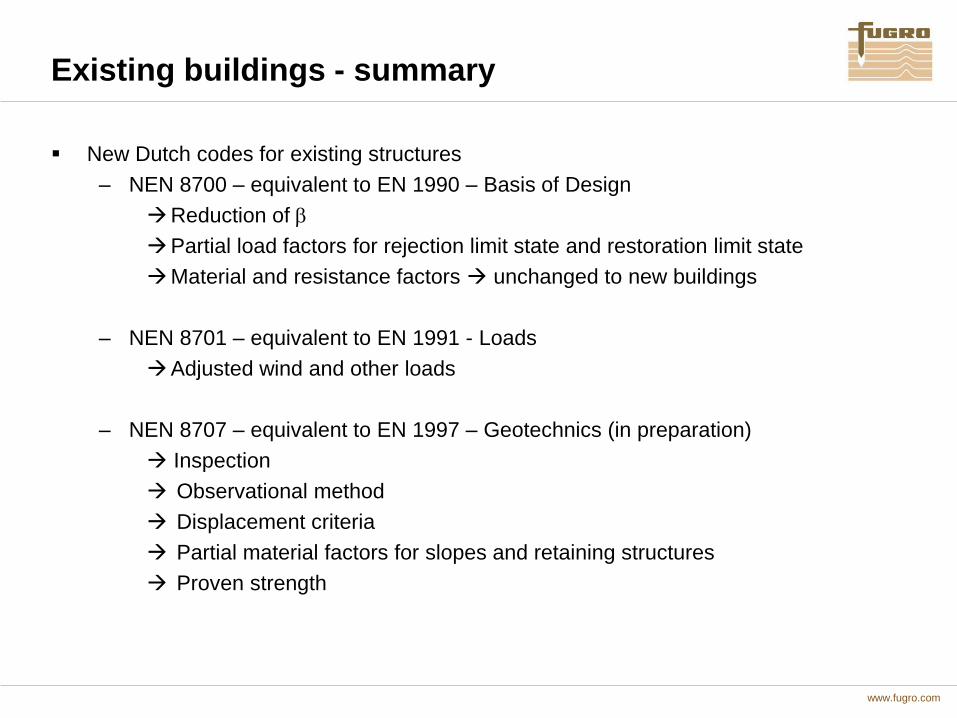
Existing buildings - summary
New Dutch codes for existing structures
– NEN 8700 – equivalent to EN 1990 – Basis of Design
Reduction of
Partial load factors for rejection limit state and restoration limit state
Material and resistance factors unchanged to new buildings
– NEN 8701 – equivalent to EN 1991 - Loads
Adjusted wind and other loads
– NEN 8707 – equivalent to EN 1997 – Geotechnics (in preparation)
Inspection
Observational method
Displacement criteria
Partial material factors for slopes and retaining structures
Proven strength

www.fugro.com
Determination of characteristic value in NL
Various methods:
Only: CPT or volume weight
Eurocode 7.1/Dutch N.A. - Table 2b
Results Field and laboratory testing
Regional Database combined with local data

www.fugro.com
1 TABLE 2b: Characteristic Value of a Soil Property
SOIL PROPERTY – CHARACTERISTIC VALUE
SOIL TYPE
VOLUME WEIGHT
CONE RESISTANCE
DEFORMATION PARAMETERS
STRENGTH PARAMETERS
GRAVEL
SAND
SILT
CLAY
PEAT
..
..
..
..
..
SAT
..
..
..
..
..
qc Cs CC C E
.. .. .. .. ..
.. .. .. .. ..
'
..
..
c '
..
..
cU
..
..
COEFFICIENT OF VARIATION
0,05 0,25 0,10 0,20
ENTRANCE
qC (’v = 100 kPa)
EC7 – Dutch N.A.

www.fugro.com
0 0
0,5 1,0 1,5 2,0 2,5
100
200
MPa 10,8 6 * 1,8 q
MPa 6 q
kPa 40 ̀
co
c
v
1 Cone resistance is stress dependent – convert to ’v = 100 kPa
1,8 V
ert
eff s
tress
’ v [kP
a]
Sand only

www.fugro.com
1 Characteristic Values – soil parameters
EC7 – Dutch NA – Table 2b
c sat qc
d
g C′p
C′s Cc/(1 + e0) Cα
f Csw /(1 + e0)
e E100
f ′ f c′ cu Hoofd-
naam
Bijmengsel Consis-
tentie b
kN/m3
kN/m3
MPa [-] [-] [-] MPa Graden kPa kPa
grind zwak siltig los
matig
vast
17
18
19
20
19
20
21
22
15
25
30
500
1000
1200
1400
0,0046
0,0023
0,0019
0,0016
0
0
0
0,0015
0,0008
0,0006
0,0005
45
75
90
105
32,5
35,0
37,5
40,0
0
0
0
n.v.t.
sterk siltig los
matig
vast
18
19
20
21
20
21
22
22,5
10
15
25
400
600
1000
1500
0,0058
0,0038
0,0023
0,0015
0
0
0
0,0019
0,0013
0,0008
0,0005
30
45
75
110
30,0
32,5
35,0
40,0
0
0
0
n.v.t.
zand schoon los
matig
vast
17
18
19
20
19
20
21
22
5
15
25
200
600
1000
1500
0,0115
0,0038
0,0023
0,0015
0
0
0
0,0038
0,0013
0,0008
0,0005
15
45
75
110
30,0
32,5
35,0
40,0
0
0
0
n.v.t.
zwak siltig, kleiig 18 19 20 21 12 450 650 0,0051 0,0035 0 0,0017 0,0012 35 50 27,0 32,5 0 n.v.t.
sterk siltig, kleiig 18 19 20 21 8 200 400 0,0115 0,0058 0 0,0038 0,0019 15 30 25,0 30,0 0 n.v.t.
leem e
zwak zandig slap
matig
vast
19
20
21
22
19
20
21
22
1
2
3
25
45
70
100
650
1300
1900
2500
0,0920
0,0511
0,0329
0,0230
0,0037
0,0020
0,0013
0,0009
0,0307
0,0170
0,0110
0,0077
2
3
5
7
27,5
27,5
27,5
30,0
32,5
35,0
0
1
2,5
3,8
50
100
200
300
sterk zandig 19 20 19 20 2 45 70 1300 2000 0.0511 0,0329 0,0020 0,0013 0,0170 0,0110 3 5 27,5 35,0 0 1 50 100
klei schoon slap
matig
vast
14
17
19
20
14
17
19
20
0,5
1,0
2,0
7
15
25
30
80
160
320
500
0,3286
0,1533
0,0920
0,0767
0,0131
0,0061
0,0037
0,0031
0,1095
0,0511
0,0307
0,0256
1
2
4
10
17,5
17,5
17,5
25,0
0
5
13
15
25
50
100
200
zwak zandig slap
matig
vast
15
18
20
21
15
18
20
21
0,7
1,5
2,5
10
20
30
50
110
240
400
600
0,2300
0,1150
0,0767
0,0460
0,0092
0,0046
0,0031
0,0018
0,0767
0,0383
0,0256
0,0153
1,5
3
5
10
22,5
22,5
22,5
27,5
0
5
13
15
40
80
120
170
sterk zandig - 18 20 18 20 1,0 25 140 320 1680 0,0920 0,0164 0,0037 0,0007 0,0307 0,0055 2 5 27,5 32,5 0 1 0 10
organisch slap
matig
13
15
16
13
15
16
0,2
0,5
7,5
10
15
30
40
60
0,3067
0,2300
0,1533
0,0153
0,0115
0,0077
0,1022
0,0767
0,0511
0,5
1,0
2,0
15,0
15,0
0
0
1
1
10
25
30
veen niet voorbelast slap 10 12 10 12 0,1 5 7,5 20 30 0,4600 0,3067 0,0230 0,0153 0,1533 0,1022 0,2 0,5 15,0 1 2,5 10 20
matig voorbelast matig 12 13 12 13 0,2 7,5 10 30 40 0,3067 0,2300 0,0153 0,0115 0,1022 0,0767 0,5 1,0 15,0 2,5 5 20 30
variatiecoëfficiënt 0,05 – 0,25 0,10 0,20

www.fugro.com
2 Dutch NA Characteristic value from tests
Characteristic value for the average
Xaverage;char = Zn;v * Xaverage, where Zn;v = (1 – t*v*(1/n))
Student t - distribution
n Zn;v
v = 0,05 v = 0,10 v = 0,15 v = 0,20 v = 0,25
1 0,84 0,72 0,64 0,50 0,42
2 0,88 0,77 0,67 0,58 0,50
3 0,92 0,83 0,75 0,66 0,58
4 0,94 0,88 0,82 0,76 0,71
6 0,96 0,92 0,88 0,84 0,79
10 0,97 0,94 0,91 0,88 0,86
cu, c’ E, Cc, C

www.fugro.com
2 Characteristic value from testdata
Xaverage;char = Zn;v * Xaverage
Number of
tests
Xaverage Variation coefficient
1 = X1 From table 2b
2 = (X1 + X2)/2 From testdata,
≥ value of Table 2b
≥ 3
=
From testdata,
If less than Table 2b,
Otherwise Table 2b n
X
n
i
i1

www.fugro.com
3 Data bases – CUR-report 2008-2
Use of databases:
Regional database is available
Useful in case of very limited local testdata and a
large variability
Be careful with spacial variation
Table 2b EC7 Dutch N.A.can be considered as
general and area independent database.
[Schneider, H. 1999]

www.fugro.com
3 Determination of soil parameters: Bayesian approach
a-priori
knowledge
Bayesian analysis
a-posteriori
knowledge
Local testdata
Combination of regional
database and local testdata Regional
Database, e.g.
Dutch NA
- Table 2b

www.fugro.com
3 Example - combining local testdat and Table 2b, Dutch N.A.
See: CUR 2008-2
Standard analysis of characteristic value according to EC7 Dutch NA
8 vane field tests with determination of undrained shearstrength
Average cu;ave;2 = 26 kPa
Variationcoëfficiënt V2 = 0,34 characteristic value cu;char;2 = 20 kPa
Table 2b variation coëfficiënt V2 = 0,2 characteristic value cu;char;2 = 22,5 kPa
Table 2b directly clay, clean, soft cu;char = 25 kPa

www.fugro.com
Characteristic Values – soil parameters
EC7 – Dutch NA – Table 2b
c sat qc
d
g C′p
C′s Cc/(1 + e0) Cα
f Csw /(1 + e0)
e E100
f ′ f c′ cu Hoofd-
naam
Bijmengsel Consis-
tentie b
kN/m3
kN/m3
MPa [-] [-] [-] MPa Graden kPa kPa
grind zwak siltig los
matig
vast
17
18
19
20
19
20
21
22
15
25
30
500
1000
1200
1400
0,0046
0,0023
0,0019
0,0016
0
0
0
0,0015
0,0008
0,0006
0,0005
45
75
90
105
32,5
35,0
37,5
40,0
0
0
0
n.v.t.
sterk siltig los
matig
vast
18
19
20
21
20
21
22
22,5
10
15
25
400
600
1000
1500
0,0058
0,0038
0,0023
0,0015
0
0
0
0,0019
0,0013
0,0008
0,0005
30
45
75
110
30,0
32,5
35,0
40,0
0
0
0
n.v.t.
zand schoon los
matig
vast
17
18
19
20
19
20
21
22
5
15
25
200
600
1000
1500
0,0115
0,0038
0,0023
0,0015
0
0
0
0,0038
0,0013
0,0008
0,0005
15
45
75
110
30,0
32,5
35,0
40,0
0
0
0
n.v.t.
zwak siltig, kleiig 18 19 20 21 12 450 650 0,0051 0,0035 0 0,0017 0,0012 35 50 27,0 32,5 0 n.v.t.
sterk siltig, kleiig 18 19 20 21 8 200 400 0,0115 0,0058 0 0,0038 0,0019 15 30 25,0 30,0 0 n.v.t.
leem e
zwak zandig slap
matig
vast
19
20
21
22
19
20
21
22
1
2
3
25
45
70
100
650
1300
1900
2500
0,0920
0,0511
0,0329
0,0230
0,0037
0,0020
0,0013
0,0009
0,0307
0,0170
0,0110
0,0077
2
3
5
7
27,5
27,5
27,5
30,0
32,5
35,0
0
1
2,5
3,8
50
100
200
300
sterk zandig 19 20 19 20 2 45 70 1300 2000 0.0511 0,0329 0,0020 0,0013 0,0170 0,0110 3 5 27,5 35,0 0 1 50 100
klei schoon slap
matig
vast
14
17
19
20
14
17
19
20
0,5
1,0
2,0
7
15
25
30
80
160
320
500
0,3286
0,1533
0,0920
0,0767
0,0131
0,0061
0,0037
0,0031
0,1095
0,0511
0,0307
0,0256
1
2
4
10
17,5
17,5
17,5
25,0
0
5
13
15
25
50
100
200
zwak zandig slap
matig
vast
15
18
20
21
15
18
20
21
0,7
1,5
2,5
10
20
30
50
110
240
400
600
0,2300
0,1150
0,0767
0,0460
0,0092
0,0046
0,0031
0,0018
0,0767
0,0383
0,0256
0,0153
1,5
3
5
10
22,5
22,5
22,5
27,5
0
5
13
15
40
80
120
170
sterk zandig - 18 20 18 20 1,0 25 140 320 1680 0,0920 0,0164 0,0037 0,0007 0,0307 0,0055 2 5 27,5 32,5 0 1 0 10
organisch slap
matig
13
15
16
13
15
16
0,2
0,5
7,5
10
15
30
40
60
0,3067
0,2300
0,1533
0,0153
0,0115
0,0077
0,1022
0,0767
0,0511
0,5
1,0
2,0
15,0
15,0
0
0
1
1
10
25
30
veen niet voorbelast slap 10 12 10 12 0,1 5 7,5 20 30 0,4600 0,3067 0,0230 0,0153 0,1533 0,1022 0,2 0,5 15,0 1 2,5 10 20
matig voorbelast matig 12 13 12 13 0,2 7,5 10 30 40 0,3067 0,2300 0,0153 0,0115 0,1022 0,0767 0,5 1,0 15,0 2,5 5 20 30
variatiecoëfficiënt 0,05 – 0,25 0,10 0,20

www.fugro.com
Example - combining local S.I. with NL-database/ Table 2b
Alternative
Tabel 2b is a priori information:
cu;char;1 = 25 kPa, V1 = 0,2 cu;average;1 = 37,2 kPa, st deviation s1 = 7,4 kPa
From tests:
cu;average;2 = 26 kPa, V2 = 0,34, st deviation s2 = 8,8 kPa, n = 8
From this: cu;ave;1+2 = 28 kPa, sgem;1+2 = 3 kPa, cu;repr;1+2 = 23 kPa > 20 kPa!
n
ss
scn
sc
c averageu 2
22
1
2
12
2
21
21;;
n
ss
n
ss
saverage 2
22
1
2
22
12
21;
Conclusion of example:
Combination testdata and Table 2b gives here values (cu = 23 kPa)
higher than from tests only (20 kPa) , but lower than Table 2b (25 kPa)

www.fugro.com
Conclusions databases
• Soils investigation always gives a limited view of reality
• Therefore cautious estimate of characteristic value or 5 %
lower or upper limit
• In NL – table with conservative characteristic values
• Better option local soils investigation
• Combination with regional databases may reduce the
variation, but caution is required (spacial extend).