article ulk complex organization in autophagy by a c
TRANSCRIPT
ARTICLE
ULK complex organization in autophagy by aC-shaped FIP200 N-terminal domain dimerXiaoshan Shi1*, Adam L. Yokom1*, Chunxin Wang2, Lindsey N. Young1, Richard J. Youle2, and James H. Hurley1,3
The autophagy-initiating human ULK complex consists of the kinase ULK1/2, FIP200, ATG13, and ATG101. Hydrogen-deuteriumexchange mass spectrometry was used to map their mutual interactions. The N-terminal 640 residues (NTD) of FIP200 interactwith the C-terminal IDR of ATG13. Mutations in these regions abolish their interaction. Negative stain EM and multianglelight scattering showed that FIP200 is a dimer, while a single molecule each of the other subunits is present. The FIP200NTDis flexible in the absence of ATG13, but in its presence adopts the shape of the letter C ∼20 nm across. The ULK1 EAT domaininteracts loosely with the NTD dimer, while the ATG13:ATG101 HORMA dimer does not contact the NTD. Cryo-EM of the NTDdimer revealed a structural similarity to the scaffold domain of TBK1, suggesting an evolutionary similarity between theautophagy-initiating TBK1 kinase and the ULK1 kinase complex.
IntroductionMacroautophagy (henceforward, autophagy) is the conservedeukaryotic cellular process responsible for replenishment ofbiosynthetic precursors during starvation (Wen and Klionsky,2016) and engulfment and degradation of molecular aggregates,organelles, intracellular pathogens, and many other cellularsubstrates (Anding and Baehrecke, 2017; Gomes and Dikic, 2014;Zaffagnini and Martens, 2016). Autophagy proceeds by the denovo formation of a cup-shaped double membrane known as thephagophore or isolation membrane. The phagophore doublemembrane grows such that it engulfs and isolates its substrates.Upon sealing of the double membrane, the mature structure isreferred to as an autophagosome. The autophagosome then fuseswith the lysosome, leading to the degradation of the materialwithin the autophagosome. The proteins and protein complexesresponsible for these steps have been identified (Mizushimaet al., 2011). In mammals (Bento et al., 2016), these include theunc-51–like autophagy activating kinase 1 (ULK1) protein kinasecomplex, the class III phosphatidylinositol 3-kinase complexes,the phosphatidylinositol 3-phosphate–sensing WIPI proteins,the lipid transporter ATG2 (autophagy related 2), the integralmembrane protein ATG9, the ubiquitin-like ATG8 proteins,machinery for conjugating ATG8 protein to lipid membranes,the autophagy adaptors that connect substrates to the ULK1complex and to ATG8 proteins, and TANK-binding kinase1 (TBK1), which phosphoregulates autophagy adaptors. Themechanisms by which these protein complexes orchestrate
autophagosome initiation, growth, closure, and delivery to thelysosome are being actively sought (Hurley and Young, 2017;Mercer et al., 2018).
The mammalian ULK1 complex is the most upstream of thecore protein complexes that make autophagosomes (Itakura andMizushima, 2010; Karanasios et al., 2013; Karanasios et al., 2016;Koyama-Honda et al., 2013). It is the mammalian counterpart ofthe yeast Atg1 complex, whose assembly is the main trigger forstarvation-induced autophagy in yeast (Kamada et al., 2000). Instarvation and TORC1 inhibition, the yeast Atg1 complex as-sembles from protein kinase Atg1, the bridging subunit Atg13,and the constitutively assembled scaffold Atg17-Atg29-Atg31 toinitiate the phagophore (Kamada et al., 2010). The structure ofAtg17 has the form of an S-shaped dimer (Ragusa et al., 2012)whose dimensions and curvature are suited to promoting cup-shaped membrane structures (Bahrami et al., 2017). In yeast,there are starvation and TORC1-independent forms of selectiveautophagy that use Atg1 and Atg13, but with the Atg11 scaffoldreplacing the Atg17 subcomplex (Yorimitsu and Klionsky, 2005).
The ULK1 complex consists of ULK1 itself, the scaffoldingsubunit FAK family kinase-interacting protein of 200 kD(FIP200; also known as RB1-inducible coiled-coil protein1 [RB1CC1]), ATG13, and ATG101 (Ganley et al., 2009; Hosokawaet al., 2009; Jung et al., 2009; Mercer et al., 2009). ULK1 can inmost cases be replaced by its paralog ULK2, a closely relatedserine/threonine kinase that is partially interchangeable within
.............................................................................................................................................................................1Department of Molecular and Cell Biology and California Institute for Quantitative Biosciences, University of California, Berkeley, Berkeley, CA; 2Biochemistry Section,Surgical Neurology Branch, National Institute of Neurological Disorders and Stroke, National Institutes of Health, Bethesda, MD; 3Molecular Biophysics and IntegratedBioimaging Division, Lawrence Berkeley National Laboratory, Berkeley, CA.
*X. Shi and A.L. Yokom contributed equally to this paper; Correspondence to James H. Hurley: [email protected]; L.N. Young’s present address is University ofCalifornia, San Diego, La Jolla, CA.
© 2020 Shi et al. This article is available under a Creative Commons License (Attribution 4.0 International, as described at https://creativecommons.org/licenses/by/4.0/).
Rockefeller University Press https://doi.org/10.1083/jcb.201911047 1 of 14
J. Cell Biol. 2020 Vol. 219 No. 7 e201911047
Dow
nloaded from http://rupress.org/jcb/article-pdf/219/7/e201911047/1385058/jcb_201911047.pdf by guest on 04 April 2022

the ULK complex (Mizushima, 2010). ULK1 and ULK2 are themammalian paralogs of Atg1. ULK1 contains the only knowncatalytic activity within the complex. The crystal structure of itsN-terminal kinase domain is known (Lazarus et al., 2015). TheULK1 kinase targets downstream autophagic machinery includ-ing ATG14, VPS34, ATG9, and ATG4 (Papinski and Kraft, 2016;Zachari and Ganley, 2017). ULK1 contains a C-terminal earlyautophagy targeting/tethering (EAT) domain, which is con-nected to the kinase domain by an ∼550-residue-long intrinsi-cally disordered region (IDR) and targets ULK1 by binding to amotif in the C terminus of ATG13 (Chan et al., 2009; Hieke et al.,2015).
ATG13 consists of an N-terminal Hop/Rev7/Mad2 (HORMA)domain that dimerizes with the HORMA domain of ATG101 (Qiet al., 2015; Suzuki et al., 2015) and a long C-terminal IDR thatbinds to FIP200 (Jung et al., 2009; Wallot-Hieke et al., 2018) andULK1 (Hieke et al., 2015; Wallot-Hieke et al., 2018). The ATG101HORMA contains an exposed Trp-Phe (WF) finger motif that isimportant for autophagy (Suzuki et al., 2015). It is not clear whatthe interaction partner of the WF finger is or how the HORMAdimer fits into the larger organization of the complex.
FIP200 is composed of 1,594 residues, is essential for autoph-agy, and is considered the functional counterpart of the yeast Atg11and Atg17 scaffold subunits (Hara et al., 2008; Fig. 1 A). FIP200,however, has no sequence homology to Atg11 and Atg17 apart
from the C-terminal 100-residue CLAW domain of FIP200 andAtg11. This is the only portion of FIP200 whose structure isknown (Turco et al., 2019). The remainder of FIP200 consistsof an ∼640-residue N-terminal domain, followed by an IDRlinker and a coiled-coil domain comprising ∼750 residues.Targeting of FIP200 by the autophagy adaptors NDP52 or p62to mitochondria (Vargas et al., 2019), Salmonella typhimurium(Ravenhill et al., 2019), or ubiquitinated cargo (Turco et al.,2019) condensates triggers phagophore initiation, leading totheir engulfment. Thus, FIP200 is absolutely central to au-tophagy initiation. Yet, as one of the largest proteins in theautophagic machinery, FIP200 has been among the most dif-ficult to study in vitro. The lack of reported motifs or sequencehomology in the N-terminal 1,500 residues has also slowedprogress in understanding this critical part of the autophagymachinery.
In this study, we expressed and purified the human ULK1complex in order to understand its structural organization. Itbecame clear early in these studies that the full ULK1 complex,with its extensive IDR content and 750-residue FIP200 coiled-coil and dissociable interactions between most of the subunits, isnot a typical well-ordered, coassembled constitutive complex. Itsdynamic character makes it exceptionally challenging forstructural studies. Nevertheless, we were able to use hydrogen-deuterium exchange coupled to mass spectrometry (HDX-MS),
Figure 1. The FIP200NTD scaffolds the ULK complex as a homodimer. (A) Domain diagram of the ULK complex proteins. (B) Pulldown assay of ULK1,ATG13, and ATG101 with FIP200NTD (N-640) and FIP200CTD (636-C). Strep-Tactin resin was loaded with MBP-ULK1:Strep-ATG13:Strep-ATG101 complex topull down FIP200(N-640)–MBP and FIP200(636-C)–MBP. The pulldown results were visualized by SDS-PAGE and Coomassie blue staining. (C) NSEM 2D classaverages for FIP200NTD (top), N-terminal MBP–tagged FIP200NTD (middle), and C-terminal MBP-tagged FIP200NTD (bottom). Densities corresponding toMBP tags are labeled with yellow arrows. Scale bar is 20 nm. (D)MALS and SEC trace of FIP200NTD shows the predicted and measured molecular weight ofthe dimeric FIP200NTD. MW, molecular weight.
Shi et al. Journal of Cell Biology 2 of 14
Structural organization of the ULK complex https://doi.org/10.1083/jcb.201911047
Dow
nloaded from http://rupress.org/jcb/article-pdf/219/7/e201911047/1385058/jcb_201911047.pdf by guest on 04 April 2022

EM, and multiangle light scattering (MALS) to map the organi-zation of the complex. These data show that the N-terminaldomain (NTD) of FIP200 serves a C-shaped dimeric hub forassembly of the ULK1 complex.
ResultsFIP200NTD assembles with ULK1, ATG13, and ATG101Given that FIP200 is essential for autophagy and is the largestprotein in the ULK1 complex, we began with the hypothesis thatsome part of FIP200 was likely to be the main hub organizingthe complex. We sought to identify the minimal domain neededfor the assembly of the core ULK1 complex. Both the NTD(1–640) and the C-terminal domain (CTD; 636–1594; Fig. 1 A) ofFIP200were expressed inHEK 293T cells as N-terminal GST andC-terminal MBP fusions. The remaining three subunits, ULK1,ATG13, and ATG101, were separately coexpressed with eachother and purified. Purified FIP200NTD–MBP and FIP200 CTD–MBPwere used in a pulldown assay with the ternary ULK1:ATG13:ATG101 complex. These experiments showed there was an inter-action between ULK1:ATG13:ATG101 and the FIP200NTD, but notthe CTD (Fig. 1 B).
The FIP200NTD is a C-shaped dimerWe characterized the overall size and shape of FIP200NTD usingnegative stain EM (NSEM) and multiangle light scattering(MALS). NSEM 2D classification of FIP200NTD showed a varietyof shapes (Fig. 1 C; Fig. S1, A–C; and Table S1), with maximumdimensions ranging from 10 to 24 nm. Many of the 2D averageswere in the shape of the letter C. Others resembled singly bentrods or S shapes (Fig. 1 C).MBP tags were fused to either the N orC terminus in order to mark the location of each end by thepresence of additional density compared with untaggedFIP200NTD. 2D class averages of the MBP N-terminal–taggedconstruct displayed a similar variety of shapes, with two addi-tional densities corresponding to two MBP tags at the tips of thedensity (Fig. 1 C, see arrows). This observation suggested thatFIP200NTD is a dimer and that the N termini are distal to thedimer interface. The C-terminal MBP tags were localized nearthe center of the C shape. The C-terminal tags displayed moredispersed positions, with either one or two tags visualized. To-gether, the MBP tags suggest the FIP200NTD forms a dimericstructure with the C termini close to the dimer interface and theN termini at the tips.
To assess the oligomeric state of FIP200 by an independenttechnique, we used size exclusion chromatography (SEC) cou-pled to MALS to analyze the molecular weight of FIP200NTD insolution. The SEC-MALS resulted in a single peak with a mo-lecular weight of 153 kD (Fig. 1 D). This value correspondsclosely to the predicted molecular weight of 149 kD of theFIP200NTD dimer.
Mapping FIP200NTD interactions with the rest of theULK1 complexWe sought to determine the minimal region(s) of ULK1:ATG13:ATG101 interacting with FIP200NTD. Strep-ATG13:Strep-ATG101 was efficiently pulled down by FIP200NTD alone, but
MBP-ULK1 was not (Fig. 2 A). Pulldown of ULK1 was recoveredin the presence of ATG13:ATG101 (Fig. 2 A). This shows thatATG13:ATG101 interacts directly with FIP200NTD, while ULK1recruitment to FIP200NTD depends on the presence of ATG13:ATG101. We characterized the minimal FIP200NTD:ATG13:ATG101 subcomplex by NSEM. 2D classification showed dis-tinct C shapes, as seen for FIP200NTD alone (Fig. 2 B; Fig. S1,D–F; and Table S1). However, we did not observe any of thebent rods and S shapes seen in the absence of ATG13:ATG101.Thus, ATG13:ATG101 stabilizes the C-shaped conformation ofFIP200NTD. No extra density corresponding to HORMA dimerswas seen in the 2D averages, suggesting that the position of theHORMA dimer is not ordered with respect to the FIP200NTD.
We used HDX-MS to systematically compare FIP200NTD:ATG13:ATG101 with FIP200NTD alone to identify regions inFIP200NTD interacting with ATG13:ATG101 (Fig. 2 C; Fig. S2,A–I; and Data S1). In general, FIP200NTD had lower HDXwhen bound to ATG13:ATG101, as the global HDX differencewith FIP200NTD alone was negative (−3.6% for all peptidescombined), consistent with the overall stabilization seen inNSEM 2D class averages. Significant protection (between −10%and −100%) was seen in nine regions of the FIP200NTD. Wemutated side chains within each region and tested the effects onATG13:ATG101 binding. Each region was converted a poly Gly-Ser sequence of equal length to the WT region being replaced.GST and Strep pulldown assays showed that mutation of regions1 (73–80), 3 (319–326), 5 (435–442), and 8 (482–489) impaired thestability of FIP200NTD (Fig. 2 D, red, see bottom gel; and Fig.S2 J), and no conclusion could be drawn as to whether theirinteraction with ATG13-:ATG101 was direct or not. Mutants M2(158–165), M4 (350–357), M7 (464–471), and M9 (537–544) hadno evident loss of FIP200NTD stability or any effect on ATG13:ATG101 pulldown (Fig. 2 D, black, top gel; and Fig. S2, J and K).Thus, ATG13:ATG101 binding leads to a large overall decrease inFIP200NTD dynamics extending across regions beyond thoseessential for ATG13:ATG101 binding. Mutation of region M6(443–450) had no loss of protein expression while eliminatingthe interaction with ATG13:ATG101 (Fig. 2 D, bold; and Fig. S2, Jand K). Region 6 is therefore a major locus of ATG13:ATG101binding.
The 582–585 region that was previously proposed to be theinteraction site for ATG13 (Chen et al., 2016) had a slight de-crease in protection, inconsistent with the expectation that thedirect interacting regions should show substantial increases inprotection. We replicated the 582–585 4A mutant from thatstudy (Chen et al., 2016). ATG13:ATG101 pulled down lessFIP200NTD (4A) than WT (Fig. 2 E), but we attribute this toFIP200NTD (4A) being expressed at a much lower level thanWT FIP200NTD. Taking the observation that the 4A mutantreduces FIP200NTD stability together with the lack of an in-crease in HDX protection in this region upon ATG13 binding, weascribe the decrease in binding and the phenotype observed byChen et al. (2016) to decreased stability of the FIP200NTD dimer,rather than to a direct interaction.
Having mapped the interaction sites for ATG13:ATG101 onFIP200, we sought to investigate the function of these sites in anautophagic process. We assessedmitophagy in HeLa cells using a
Shi et al. Journal of Cell Biology 3 of 14
Structural organization of the ULK complex https://doi.org/10.1083/jcb.201911047
Dow
nloaded from http://rupress.org/jcb/article-pdf/219/7/e201911047/1385058/jcb_201911047.pdf by guest on 04 April 2022

Figure 2. Mapping the FIP200NTD interaction sites with ATG13 and ATG101. (A) Pulldown assay of FIP200NTDwith ULK1, ATG13:ATG101, and both. GSHresin was loaded with GST-FIP200NTD to pull downMBP-ULK1, Strep-ATG13:Strep-ATG101, and both. The pulldown results were visualized by SDS-PAGE andCoomassie blue staining. (B) NSEM 2D class averages of FIP200NTD:ATG13:ATG101, MBP-FIP200NTD:ATG13:ATG101, and FIP200NTD–MBP:ATG13:ATG101.Densities corresponding to MBP tags are labeled with yellow arrows. Scale bar is 20 nm. (C) Difference of HDX percentages of the FIP200NTD alone versusFIP200NTD:ATG13:ATG101 (black) or FIP200NTD:ATG13MR (orange) at 6-s time point. Brown represents the overlay of black and orange. Sites of mutation arelabeled above matching residues. All values are mean ± SD. (D) Pulldown assays of mutant FIP200NTD constructs (M1–M9) and WT with ATG13:ATG101. BothGSH and Strep-Tactin resin were used to pull down GST-FIP200NTD:Strep-ATG13:ATG101 complex from lysate of overexpressing HEK cells. The pulldownresults were visualized by SDS-PAGE and Coomassie blue staining. Mutants marked red are the mutants that had a loss of FIP200NTD stability; mutantsmarked black are the mutants that had no evident loss of FIP200NTD stability or any effect on ATG13:ATG101 pulldown; Mutant marked bold are the mutantthat had no evident loss of FIP200NTD stability but eliminated the interaction with ATG13:ATG101. (E) Pulldown assay of mutant FIP200NTD constructs (4A)and WT with ATG13:ATG101. (F) Expression level of FIP200 in samples used for mitophagy analysis. (G) Quantification of mito-mKeima ratiometric FACSanalysis of WT or FIP200 KO cells reexpressingWT or mutant FIP200 after 5 h of OAQ treatment. n = 3 biological replicates. All values are mean ± SD. P values:**, < 0.01; ****, < 0.0001. n.s., not significant; OAQ, Oligomycin, Antimycin A, and Quinoline-Val-Asp-Difluorophenoxymethyl Ketone (QVD). a.a., amino acid.
Shi et al. Journal of Cell Biology 4 of 14
Structural organization of the ULK complex https://doi.org/10.1083/jcb.201911047
Dow
nloaded from http://rupress.org/jcb/article-pdf/219/7/e201911047/1385058/jcb_201911047.pdf by guest on 04 April 2022
mito-mKeima assay (Vargas et al., 2019). The M6 mutant con-struct that disrupted the FIP200-binding site for ATG13 inter-face was transfected in HeLa cells to determine its effects (Fig. 2,F and G). FIP200 knockout (KO) HeLa cells showed a severedefect in mitophagy relative to the WT HeLa cells (Fig. 2 G).Transient transfection of WT FIP200 and FIP200 M6 corre-sponding to region 6 (443–450 mutated to GSSGGSSG) wasperformed as described earlier (Vargas et al., 2019), and mi-tophagy was assayed. After 5-h Oligomycin, Antimycin A, andQVD treatment to induce mitophagy, cells were analyzed usingFACS (Fig. S3 A). The FIP200 M6 mutant exhibited a fivefoldreduction in mitophagy compared with WT FIP200 in the KOrescue experiment, confirming that FIP200 binding to ATG13 isimportant for its function.
Mapping the FIP200-binding site on ATG13We used HDX-MS to compare FIP200NTD:ATG13:ATG101 withATG13:ATG101 and to identify the regions of ATG13:ATG101 in-volved in assembly with FIP200NTD. In general, the ATG13middle region (ATG13MR; 363–460) showed reduced HDX(−6.5% for all peptides combined) when bound to theFIP200NTD dimer (Fig. 3 A and Data S1). Both the HORMAdomain of ATG13 and of ATG101 only showed slight differences,below the 10% threshold of significance (Fig. 3 A and Fig. 3 B).These data suggest that the ATG13 MR, not the HORMA dimer,is the FIP200NTD binding site. This is consistent with thefinding that deletion of ATG13 isoform2 348–373 blocks FIP200interaction (Wallot-Hieke et al., 2018). This is also consistentwith the NSEM result that in the FIP200NTD:ATG13:ATG101,the HORMA domain dimer density was averaged out in 2Dclassifications (Fig. 2 B).
To compare the properties of the isolated ATG13MR with thefull ATG13:ATG101 subcomplex, we compared the HDX ofFIP200NTD:ATG13 MR with FIP200NTD alone (Fig. 2 C; Fig. S2,A–I; and Data S1). The presence of the ATG13MR led to a patternof differences identical to those induced by full-length ATG13:ATG101 (Fig. 2 C). Furthermore, NSEM analysis of theFIP200NTD:ATG13MR sample showed stable C shapes like thoseof the FIP200NTD:ATG13:ATG101 (Fig. 2 B, Fig. 3 C, Fig. S1 G, andTable S1). Thus, the 98-residue ATG13MR fully recapitulates theproperties of the full ATG13:ATG101 subcomplex with respect toits ability to bind and rigidify FIP200. Three regions in theATG13MR (371–378, 390–397, and 446–453) were selected andmutated to poly Gly-Ser sequences of equal length to the WTregion being replaced. GST-tagged ATG13MR constructs andFIP200NTD–MBP were purified and used in MBP pulldown as-says (Fig. 3 D and Fig. S2 L). Mutation of region 2 (390–397)largely impaired the interaction between ATG13MR andFIP200NTD, while mutation of region 1 (371–378) moderatelyimpaired the interaction. A slight effect was observed whenusing mutation of region 3 (446–453).
It was previously found that in atg13 KO mouse embryonicfibroblasts rescued by ATG13 construct expression, loss of theN-terminal part of the ATG13MR had no effect on starvation-induced autophagy and only a slight effect on torin-inducedautophagy (Wallot-Hieke et al., 2018). We assessed mitophagyin HeLa cells using a mito-mKeima assay (Vargas et al., 2019). To
completely disrupt the FIP200 binding, all three regions inATG13MR (371–378, 390–397, and 446–453) weremutated to polyGly-Ser sequences of equal length to the WT region being re-placed to generate the M123 mutant. The WT and M123 mutantwere then stably expressed at a similar level in HeLa cells, andmitophagy was assayed using a previously described chemical-induced dimerization (CID) system (Vargas et al., 2019; Fig. 3 E;and Fig. S3, B and C). Compared with ATG13 WT, ATG13 M123mutant triggered a significantly reduced mitophagy response(threefold reduction). This contrasts with a report that mutatinga subset of the FIP200-binding region of ATG13, residues348–373, does not impact starvation-induced autophagy inMEFs(Wallot-Hieke et al., 2018). These data show that the threeFIP200-binding regions of ATG13 analyzed here are functionallyimportant in mitophagy.
ULK1-EAT interactions with FIP200NTD:ATG13:ATG101The FIP200NTD:ATG13:ATG101:ULK1 complex was purifiedfrom HEK 293 cells and subjected to HDX-MS analysis to mapthe ULK1 binding sites on the rest of the complex. FIP200NTDpeptide 319–326 and ATG13 peptide 482–517 showed signifi-cantly decreased HDX in the presence of ULK1 (Fig. 4, A and B).In contrast, ATG101 had no significant HDX changes upon theaddition of ULK1 (Fig. 4 C). The HDX changes in FIP200 andATG13 peptides suggested that these two regions could serve asthe ULK1 binding site. FIP200 region 319–326 is also importantfor FIP200NTD stability (M3; Fig. 2 D and Fig. S2 J). It was re-ported that the EAT domain of ULK1 interacts with the C ter-minus of ATG13 (Wallot-Hieke et al., 2018), as anticipated fromthe homology between the corresponding regions of yeast Atg1and Atg13 (Fujioka et al., 2014; Stjepanovic et al., 2014). Con-sistent with this, ULK1 EAT alone induced essentially identicalHDX changes in both FIP200NTD and ATG13 compared withfull-length ULK1 (Fig. 4, A and B). To investigate whether ULK1,FIP200NTD, and ATG13 form a three-way interface, ULK1(N-830/ΔEAT) and ATG13(N-486/ΔC) were assayed by pulldownin the presence of all fourULK1 complex subunits. GST–FIP200NTDcan still pull down some MBP-ULK1 or vice versa even in thepresence of ATG13-ΔC (Fig. S4). This demonstrates that once ATG13brings FIP200 and ULK1 together, a direct interaction exists be-tween FIP200NTD and ULK1 EAT.
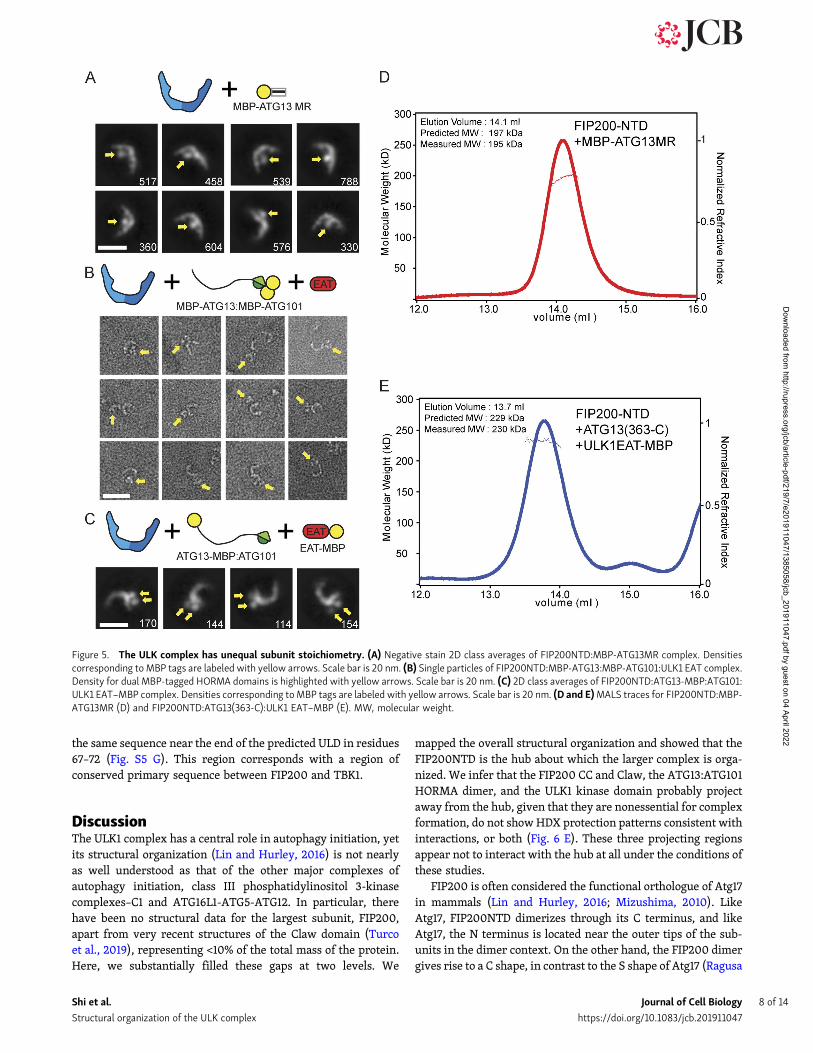
An asymmetric ULK1 complex with 1:2:1:1 ULK1:FIP200:ATG13:ATG101 stoichiometryHaving defined the minimal interacting regions responsible forassembly of the ULK1 complex, we sought to localize them inspace relative to the FIP200NTD scaffold and to understandtheir stoichiometry. First, FIP200NTD:MBP–ATG13MR was an-alyzed by NSEM. 2D class averages showed that only one MBPdensity could be seen near the center of “C,” suggesting that onlyone molecule of ATG13 binds per FIP200NTD dimer (Fig. 5 A,Fig. S1 H, and Table S1). This suggests that the ATG13 bindingsite spans both FIP200NTD monomers in the C-shaped dimer.
To determine if the ATG13:ATG101 HORMA dimer wasstructurally ordered with respect to the FIP200NTD scaffold, wefused MBP tags to each protein. This more than doubled theeffective mass of these domains, making them visible by NSEM.
Shi et al. Journal of Cell Biology 5 of 14
Structural organization of the ULK complex https://doi.org/10.1083/jcb.201911047
Dow
nloaded from http://rupress.org/jcb/article-pdf/219/7/e201911047/1385058/jcb_201911047.pdf by guest on 04 April 2022

In single particles of FIP200NTD:MBP-ATG13:MBP-ATG101:ULK1 EAT, a trimer density can be seen in the vicinity of theFIP200NTD dimer, corresponding to density for the HORMAdimer and the twoMBP tags present (Fig. 5 B, Fig. S1 I, and TableS1). 2D classification of the complex showed a stable FIP200NTDdimer, but most averages had no additional densities for theMBP tags (Fig. S1 I). We interpret this to mean that the HORMAdimer does not directly interact with, and is not ordered withrespect to, FIP200NTD.
We next performed NSEM with ATG13-MBP and ULK1EAT–MBP. MBP tags placed at the ATG13 C terminus and on theULK1 EAT domain were colocalized as seen by the presence oftwo extra density lobes present at the tip of one arm of theFIP200NTD dimer (Fig. 5 C, Fig. S1 J, and Table S1). 2D classi-fication showed that the ULK1 EAT and the C terminus of ATG13are located near one of the tips of the FIP200NTD C shape.
The results of the MBP tagging experiments implied that theULK1 complex is asymmetric and has nonequal subunit stoi-chiometry. To test this, we used MALS to determine the stoi-chiometry of the ULK1 complex by direct determination of themolecular mass. FIP200NTD:MBP–ATG13MR and FIP200NTD:
ATG13(363-C):ULK1 EAT–MBP both showed molecular weightsconsistent with a stoichiometry of two molecules of FIP200NTDfor each one molecule of all other components (Fig. 5, D and E).The measured molecular weights of 195 kD and 230 kD corre-spond to the expectedmass of complexes with 2:1 ratios betweenthe FIP200NTD and the other subunits (197 kD, and 229 kD,respectively). Taken together, the NSEM and MALS data showthat the FIP200NTD dimer assembles asymmetrically with onecopy each of ATG13, ATG101, and ULK1.
Cryo-EM structure of ATG13MR–bound FIP200NTDWe used cryo-EM to investigate the architecture of theFIP200NTD dimer:ATG13 MR complex at higher resolution. Thenarrow extended C shape and flexible nature of FIP200made it achallenging sample for both sample preparation and data col-lection. Nevertheless, the use of several technical improvementsmade it possible to obtain an intermediate resolution structure.Graphene oxide was used to protect the FIP200NTD dimer fromthe air–water interface and allowed collection of high-contrastmicrographs (Fig. S5 A). Accurate particle picking was criticalfor the centering of the FIP200NTD C shape. The neural
Figure 3. Mapping the FIP200NTD binding sites on ATG13. (A) Difference of HDX percentages of the ATG13 in ATG13:ATG101 versus ATG13:ATG101:FIP200 at 6-s time point. Sites of mutation are labeled above matching residues. The MR region is highlighted with the unfilled rectangular green box, aslabeled. All values are mean ± SD. (B) Difference of HDX percentages of the ATG101 in ATG13:ATG101 versus ATG13:ATG101:FIP200. All values are mean ± SD.(C) NSEM 2D class averages of FIP200NTD:ATG13 MR complex. The two color shades in the cartoon C-shape denote the two FIP200NTD monomers in thedimer. Scale bar is 20 nm. (D) Pulldown assays of mutant ATG13MR constructs (M1–M3) and WT with FIP200NTD. Amylose resin was used to pull downpurified GST-ATG13MR:FIP200NTD-MBP complex. The pulldown results were visualized by SDS-PAGE and Coomassie blue staining. (E)Quantification of mito-mKeima ratiometric FACS analysis of HeLa cells stably expressing mito-mKeima–P2A-FRB-Fis1 and FKBP-GFP-ATG13 or mutant after 24 h of Rapalogtreatment. n = 3 biological replicates. All values are mean ± SD. P values: *, = < 0.05; ****, < 0.0001. n.s., not significant. a.a., amino acid.
Shi et al. Journal of Cell Biology 6 of 14
Structural organization of the ULK complex https://doi.org/10.1083/jcb.201911047
Dow
nloaded from http://rupress.org/jcb/article-pdf/219/7/e201911047/1385058/jcb_201911047.pdf by guest on 04 April 2022

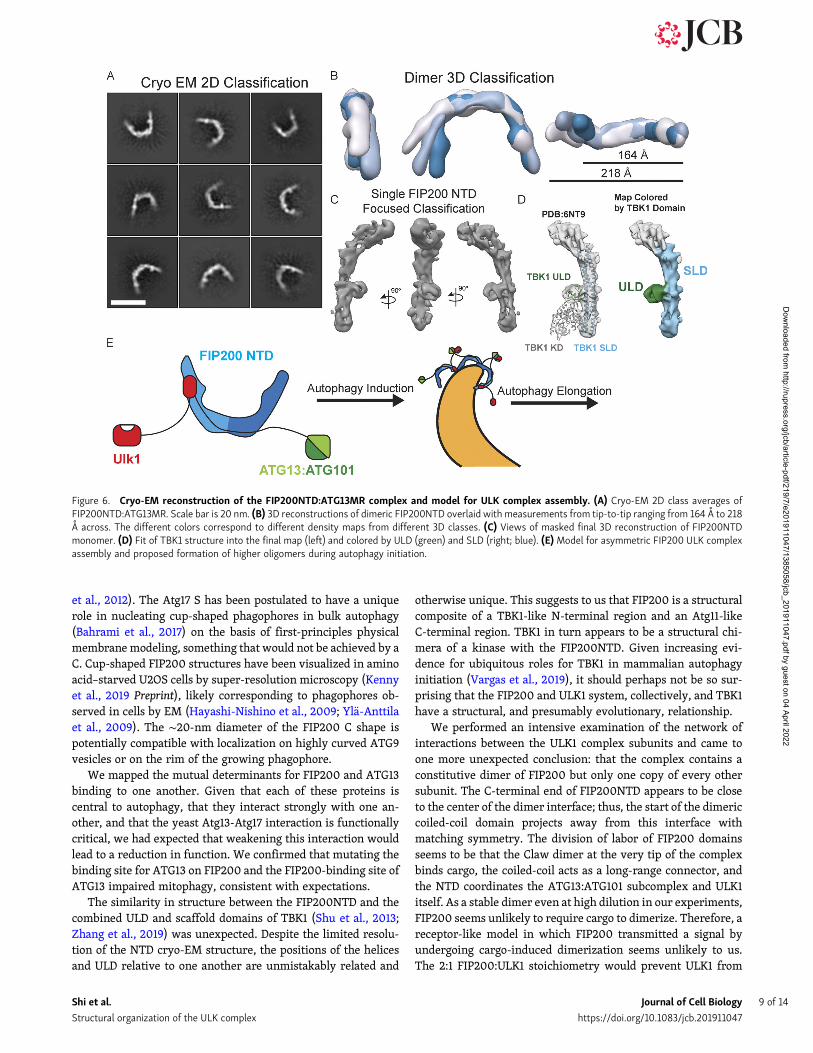
network–based crYOLO picker (Wagner et al., 2019) was trainedby manual picking and used to autopick micrographs from threedatasets (Fig. S5 B and Table S2). 2D classification showed theFIP200NTD dimer in an array of more or less open conforma-tional states similar to that seen in the NSEM data (Fig. 6 A). Adistinct bumpwas observed on the inner rim of the dimer. After 3Dclassification, full dimer maps were resolved between 12 A and 15 Aresolution (Fig. 6 B and Fig. S5 B). When overlaid, these maps showa large range of tip-to-tip distances, spanning 160 A to 220 A across.
Focused refinement with a mask around a single FIP200NTDwas performed and yielded a final resolution of 9 A (Fig. 6 C; andFig. S5, B–E). At this resolution, helical densities can be seen thatrun along the length of the C shape. Additionally, more featuresare seen at density within the dimer C shape.
To interpret this moderate resolution map, given the lack ofpreexisting atomic structures for FIP200 outside of the CLAW
domain, we relied on structure prediction servers. Robettaanalysis (Song et al., 2013) suggested the TBK1 scaffold-like do-main (SLD) and ubiquitin-like domain (ULD; Shu et al., 2013) asthe basis for a structural model. Docking of TBK1 ULD and SLD(Shu et al., 2013; Zhang et al., 2019) showed a good fit into ourdensity (Fig. 6 D, left), while another candidate, the yeast Atg17structure, did not (Fig. S5 F). These domains from TBK1 arecomposed of 429 residues that would not account for theFIP200NTD construct (1–640; Fig. 6 D, right). The dimer inter-face of the FIP200NTD dimer remains unmodeled at our currentresolution. The bump seen in 2D averages corresponds to theULD, and the backbone of the arm forms a helical bundle that issimilar in spacing and structure to the SLD of TBK1 (Fig. 6 D).TBK1 has a conserved interface positioned between the ULDdomain and the scaffolding domain containing residues NPIF(376–380; Shu et al., 2013; Zhang et al., 2019). FIP200 contains
Figure 4. Interactions between ULK1 and the FIP200:ATG13:ATG101 subcomplex. (A–C) Difference of HDX percentages of the FIP200NTD (A), ATG13 (B),and ATG101 (C) in ATG13:ATG101:FIP200NTD versus in ATG13:ATG101:FIP200NTD:ULK1(blue) or ATG13:ATG101:FIP200NTD:ULK1 EAT(orange) at the 60-stime point. In B, the ATG13MR is highlighted by the unfilled green rectangle. Brown represents the overlay of blue and orange. All values are mean ± SD. a.a.,amino acid.
Shi et al. Journal of Cell Biology 7 of 14
Structural organization of the ULK complex https://doi.org/10.1083/jcb.201911047
Dow
nloaded from http://rupress.org/jcb/article-pdf/219/7/e201911047/1385058/jcb_201911047.pdf by guest on 04 April 2022
the same sequence near the end of the predicted ULD in residues67–72 (Fig. S5 G). This region corresponds with a region ofconserved primary sequence between FIP200 and TBK1.
DiscussionThe ULK1 complex has a central role in autophagy initiation, yetits structural organization (Lin and Hurley, 2016) is not nearlyas well understood as that of the other major complexes ofautophagy initiation, class III phosphatidylinositol 3-kinasecomplexes–C1 and ATG16L1-ATG5-ATG12. In particular, therehave been no structural data for the largest subunit, FIP200,apart from very recent structures of the Claw domain (Turcoet al., 2019), representing <10% of the total mass of the protein.Here, we substantially filled these gaps at two levels. We
mapped the overall structural organization and showed that theFIP200NTD is the hub about which the larger complex is orga-nized. We infer that the FIP200 CC and Claw, the ATG13:ATG101HORMA dimer, and the ULK1 kinase domain probably projectaway from the hub, given that they are nonessential for complexformation, do not showHDX protection patterns consistent withinteractions, or both (Fig. 6 E). These three projecting regionsappear not to interact with the hub at all under the conditions ofthese studies.
FIP200 is often considered the functional orthologue of Atg17in mammals (Lin and Hurley, 2016; Mizushima, 2010). LikeAtg17, FIP200NTD dimerizes through its C terminus, and likeAtg17, the N terminus is located near the outer tips of the sub-units in the dimer context. On the other hand, the FIP200 dimergives rise to a C shape, in contrast to the S shape of Atg17 (Ragusa
Figure 5. The ULK complex has unequal subunit stoichiometry. (A) Negative stain 2D class averages of FIP200NTD:MBP-ATG13MR complex. Densitiescorresponding toMBP tags are labeled with yellow arrows. Scale bar is 20 nm. (B) Single particles of FIP200NTD:MBP-ATG13:MBP-ATG101:ULK1 EAT complex.Density for dual MBP-tagged HORMA domains is highlighted with yellow arrows. Scale bar is 20 nm. (C) 2D class averages of FIP200NTD:ATG13-MBP:ATG101:ULK1 EAT–MBP complex. Densities corresponding toMBP tags are labeled with yellow arrows. Scale bar is 20 nm. (D and E)MALS traces for FIP200NTD:MBP-ATG13MR (D) and FIP200NTD:ATG13(363-C):ULK1 EAT–MBP (E). MW, molecular weight.
Shi et al. Journal of Cell Biology 8 of 14
Structural organization of the ULK complex https://doi.org/10.1083/jcb.201911047
Dow
nloaded from http://rupress.org/jcb/article-pdf/219/7/e201911047/1385058/jcb_201911047.pdf by guest on 04 April 2022
et al., 2012). The Atg17 S has been postulated to have a uniquerole in nucleating cup-shaped phagophores in bulk autophagy(Bahrami et al., 2017) on the basis of first-principles physicalmembranemodeling, something that would not be achieved by aC. Cup-shaped FIP200 structures have been visualized in aminoacid–starved U2OS cells by super-resolution microscopy (Kennyet al., 2019 Preprint), likely corresponding to phagophores ob-served in cells by EM (Hayashi-Nishino et al., 2009; Yla-Anttilaet al., 2009). The ∼20-nm diameter of the FIP200 C shape ispotentially compatible with localization on highly curved ATG9vesicles or on the rim of the growing phagophore.
We mapped the mutual determinants for FIP200 and ATG13binding to one another. Given that each of these proteins iscentral to autophagy, that they interact strongly with one an-other, and that the yeast Atg13-Atg17 interaction is functionallycritical, we had expected that weakening this interaction wouldlead to a reduction in function. We confirmed that mutating thebinding site for ATG13 on FIP200 and the FIP200-binding site ofATG13 impaired mitophagy, consistent with expectations.
The similarity in structure between the FIP200NTD and thecombined ULD and scaffold domains of TBK1 (Shu et al., 2013;Zhang et al., 2019) was unexpected. Despite the limited resolu-tion of the NTD cryo-EM structure, the positions of the helicesand ULD relative to one another are unmistakably related and
otherwise unique. This suggests to us that FIP200 is a structuralcomposite of a TBK1-like N-terminal region and an Atg11-likeC-terminal region. TBK1 in turn appears to be a structural chi-mera of a kinase with the FIP200NTD. Given increasing evi-dence for ubiquitous roles for TBK1 in mammalian autophagyinitiation (Vargas et al., 2019), it should perhaps not be so sur-prising that the FIP200 and ULK1 system, collectively, and TBK1have a structural, and presumably evolutionary, relationship.
We performed an intensive examination of the network ofinteractions between the ULK1 complex subunits and came toone more unexpected conclusion: that the complex contains aconstitutive dimer of FIP200 but only one copy of every othersubunit. The C-terminal end of FIP200NTD appears to be closeto the center of the dimer interface; thus, the start of the dimericcoiled-coil domain projects away from this interface withmatching symmetry. The division of labor of FIP200 domainsseems to be that the Claw dimer at the very tip of the complexbinds cargo, the coiled-coil acts as a long-range connector, andthe NTD coordinates the ATG13:ATG101 subcomplex and ULK1itself. As a stable dimer even at high dilution in our experiments,FIP200 seems unlikely to require cargo to dimerize. Therefore, areceptor-like model in which FIP200 transmitted a signal byundergoing cargo-induced dimerization seems unlikely to us.The 2:1 FIP200:ULK1 stoichiometry would prevent ULK1 from
Figure 6. Cryo-EM reconstruction of the FIP200NTD:ATG13MR complex and model for ULK complex assembly. (A) Cryo-EM 2D class averages ofFIP200NTD:ATG13MR. Scale bar is 20 nm. (B) 3D reconstructions of dimeric FIP200NTD overlaid with measurements from tip-to-tip ranging from 164 A to 218A across. The different colors correspond to different density maps from different 3D classes. (C) Views of masked final 3D reconstruction of FIP200NTDmonomer. (D) Fit of TBK1 structure into the final map (left) and colored by ULD (green) and SLD (right; blue). (E) Model for asymmetric FIP200 ULK complexassembly and proposed formation of higher oligomers during autophagy initiation.
Shi et al. Journal of Cell Biology 9 of 14
Structural organization of the ULK complex https://doi.org/10.1083/jcb.201911047
Dow
nloaded from http://rupress.org/jcb/article-pdf/219/7/e201911047/1385058/jcb_201911047.pdf by guest on 04 April 2022
dimerization and auto-activating in the absence of higher-orderclustering. This suggests an appealing mechanism for cargo-induced ULK1 activation in which multiple FIP200 dimerscluster on the autophagic substrate/cargo, bringing ULK1 mon-omers into proximity for autoactivation.
Materials and methodsPlasmid constructionThe sequence of all DNAs encoding components of the ULK1complex was codon optimized, synthesized, and then subclonedinto the pCAG vector. All components were tagged with GST,MBP, or TwinStrep-Flag for affinity purification or pulldownassays. N-terminal GST, MBP, or TwinStrep-Flag tags may befollowed by a tobacco etch virus cleavage site. All constructswere verified by DNA sequencing. Details are shown in Table S3.
Protein expression and purificationAll proteins used for NSEM, HDX-MS, and MALS analyses wereexpressed in HEK 293-GnT1 suspension cells by using the pol-yethylenimine (Polysciences) transfection system. Cells weretransfected at a concentration of 2–2.5 × 10⁶/ml and harvestedafter 48 h. The harvested cells were pelleted at 500 g for 5 min at4°C and then washed with PBS once. The pellets were then lysedwith lysis buffer containing 50 mM Tris-HCl, pH 7.4, 200 mMNaCl, 2 mM MgCl2, 1 mM tris(2-carboxyethyl)phosphine(TCEP), 1% Triton X-100, 10% Glycerol, and protease inhibitors(Roche) before being cleared at 16,000 g for 30 min at 4°C. Thesupernatant was then incubated with Glutathione Sepharose 4B(GE Healthcare), Amylose resin (New England Biolabs), orStrep-Tactin Sepharose (IBA Lifesciences) as appropriate, withgentle shaking for 12 h at 4°C. The mixture was then loadedonto a gravity flow column, and the resin was washed exten-sively with wash buffer (50 mM Hepes, pH 8.0, 200 mM NaCl,1 mM MgCl2, and 1 mM TCEP). The proteins were eluted withwash buffer containing 50 mM glutathione, 50 mMmaltose, or10 mM desthiobiotin as appropriate. In some cases, two affinitysteps were used. Constructs containing Tobacco Etch VirusProtease (TEV) cleavage sites were treated with TEV at 4°Covernight. For HDX-MS and NSEM analyses, the protein wasapplied to a final SEC step before use. For the Strep-ATG13:Strep-ATG101 complex, a Superdex 200 column (GE Health-care) was used, and for all other samples, a Superose 6 column(GE Healthcare) was used.
Pulldown assays10 ml of HEK 293-GnT1 suspension cells were transfected at theconcentration of 2–2.5 × 10⁶/ml and harvested after 48 h. Theharvested cells were pelleted at 500 g for 5 min at 4°C and thenwashed with 5 ml PBS once. The pellets were then lysed with1 ml lysis buffer containing 50 mM Tris-HCl, pH 7.4, 200 mMNaCl, 2 mM MgCl2, 1 mM TCEP, 1% Triton X-100, 10% Glycerol,and protease inhibitors before being cleared at 12,000 rpm for10 min at 4°C. The supernatant was then incubated with 20 µlGlutathione Sepharose 4B, Amylose resin, or Strep-Tactin Se-pharose with gentle shaking for 8 h at 4°C. The protein-boundresin was washed with 1 ml lysis buffer three times and then
eluted with 60 µl elution buffer containing 50 mM glutathione,50 mM maltose, or 10 mM desthiobiotin, respectively. Theeluted proteins were applied to SDS-PAGE for analysis. For Fig. 1B, FIP200(N-640)–MBP and FIP200(636-C)–MBP were firstpurified by GST affinity purification, followed by TEV cleavageand then MBP affinity purification. The MBP-ULK1:Strep-ATG13:Strep-ATG101 subcomplex was purified by Strep affinitypurification and then left on the resin. The resin was thenmixed with FIP200 protein (final concentration: 200 nM) at4°C with gentle shaking.
For Fig. 2 A, purified GST-FIP200, MBP-Strep-ULK1, andStrep-ATG13:Strep-ATG101 were used. The final buffer was20 mM Hepes, pH 8.0, 200 mM NaCl, 1 mM TCEP, 5 mM des-thiobiotin, and 1% Triton-X-100. The protein concentration was200 nM. For Fig. 3 D, purified FIP200-MBP and GST-ATG13MRwere used. The final buffer was 20 mMHepes, pH 8.0, 200 mMNaCl, 1 mM TCEP, and 1% Triton-X-100. The protein concen-tration was 500 nM.
For quantification of the pulldown assay in Fig. 2 D and 3 D,ImageJ was invited to measure the intensity of bands in SDS-PAGE gel. The expression of GST-FIP200NTD was calculated asIntensity(GST-FIP200NTD in GST pulldown gel)/Intensity(Strep-ATG13 in Strep pulldown gel). Relative expression efficiencyof GST-FIP200NTD was calculated as Expression(GST-FIP200WT or Mutants)/Expression(GST-FIP200 WT). The pulldown ofGST-FIP200NTD by Strep-ATG13:ATG101 was calculated as In-tensity(GST-FIP200NTD in Strep pulldown gel)/Intensity(GST-FIP200NTD in GST pulldown gel)/Intensity(Strep-ATG13 in Streppulldown gel). Relative pulldown efficiency of GST-FIP200NTDwas calculated as Pulldown(GST-FIP200 WT or Mutants)/Pull-down(GST-FIP200 WT). The pulldown of GST-ATG13MR byFIP200NTD-MBP was calculated as Intensity(GST-ATG13MR inMBP pulldown gel)/Intensity(FIP200NTD-MBP in MBP pulldowngel)/Intensity(GST-ATG13MR in Input gel). Relative pulldown ef-ficiency of GST-ATG13MR was calculated as Pulldown(GST-ATG13MR WT or Mutants)/Pulldown(GST-ATG13MR).
HDX-MSProtein samples for HDX were concentrated to a 10-µM stockbefore HDX. HDX was initiated by adding 95 µl of deuteratedbuffer containing 20 mM Hepes, pH 8.0, 200 mM NaCl, and1 mM TCEP into 5 µl of protein stock at 30°C. Exchange wasperformed for 6 s, 60 s, 600 s, or 60,000 s and quenched at 0°Cby the addition of 100 µl of ice-cold quench buffer (400 mMKH2PO4/H3PO4, pH 2.2). The 60,000-s sample served as themaximally labeled control. All HDX reactions were repeatedthree times. Quenched samples were injected into a chilledHPLC (Agilent) setup with in-line peptic digestion and desaltingsteps. The analytical column used was a Biobasic 8.5-µm KAPPAcolumn (Thermo Fisher Scientific). The peptides were elutedwith an acetonitrile gradient and electrosprayed into an Orbi-trap Discoverymass spectrometer (Thermo Fisher Scientific) foranalysis. To generate the gradient, solvent A was 0.05% TFA,while solvent B was 0.05% TFA in 90% acetonitrile. The elutionmethod was as follows: 0–6 min: 10% B; 6–18 min: from 10% B to55% B; 18–19 min: from 55% B to 90% B; 19–25 min: 90% B; 25–26min: from 90% B to 10% B; and 26–30 min: 10% B. The spray
Shi et al. Journal of Cell Biology 10 of 14
Structural organization of the ULK complex https://doi.org/10.1083/jcb.201911047
Dow
nloaded from http://rupress.org/jcb/article-pdf/219/7/e201911047/1385058/jcb_201911047.pdf by guest on 04 April 2022

voltage was set at 3.4 kV, capillary temperature was set at 275°C,capillary voltage was set at 37 V, and tube-lens was set at 120 V.As a control, unexchanged samples went through the sameprocess, except that deuterated buffer was replaced by un-deuterated buffer.
To identify peptides, unexchanged samples were analyzed bytandem mass spectrometry (MS/MS) analysis with the sameHPLC method. Tandem MS/MS was performed using data-dependent analysis, in which a cycle of one full-scan MS spec-trum (m/z 300–2,000) was acquired followed by MS/MS events(CID fragmentation). MS/MS was sequentially generated on thefirst to the 10 most intense ions selected from the full MSspectrum at a 35% normalized collision energy. The ion trapanalyzer was used for MS2, activation time was 30 ms, and the dy-namic exclusion was set at 30 s. For HDX mass analysis, only a full-scan MS spectrum was acquired, and the resolution was 30,000.
Database searches were performed with the Proteome Dis-coverer 2.1 (Thermo Fisher Scientific) using the Sequest HTsearch engine to identify peptides. Raw data were searchedagainst the small database containing all four components of theULK1 complex. The following search parameters were used:unspecific cleavage was used; precursor mass tolerance was setto ±10 ppm, and fragment mass tolerance was set to ±0.6 D.Target falase discovery rate was set to 1% as the filter cutoff forthe identified peptides. For HDX analysis, mass analysis of thepeptide centroids was performed using HDExaminer (SierraAnalytics), followed by manual verification for every peptide.
NSEM collection and processingPurified protein samples were diluted to ∼50–200 nM finalconcentration in running buffer immediately before applicationto glow discharged continuous carbon grids. Protein sampleswere stained twice with 2%–4% uranyl acetate and allowed todry at room temperature. Samples were imaged using a T12 orF20 transmission electron microscope operating at 120 keV(Thermo Fisher Scientific) as indicated in Table S1. Data weremanually collected and assessed for stain quality throughoutdata collection. F20 datasets used a recorded magnification of89,000×, collected with an ultrascan camera at a pixel size of 1.5A/pixel (Gatan). T12 datasets were captured using a magnifica-tion of 49,000× with a 4k × 4k CCD camera (Gatan), whichcorresponds to 2.2 A/pixel.
All datasets spanned a range of 1–4 µm defocus and a totaldose of 30–50 e−/A2. Single particles were selected using theRelion Autopicker (Zivanov et al., 2018) and extracted with theindicated box size (Table S1). Data were cleaned by 2D classifi-cation within Cryosparc2, removing classes that had no featuresor contained background picks. Final 2D classification into 80 or50 classes was performed with the “uncertainty parameter” setto 8. This setting yielded the best distribution of class averagesacross all datasets.
Size exclusion and MALS analysisAll light scattering experiments were performed with a runningbuffer of 50 mM Tris, 150 mM NaCl, and 1 mM TCEP, pH 7.8.Purified ULK complex sample was concentrated to ∼6–10 µM,and 100 µl was injected over a 24-ml Superose 6 Increase 10/300
GL column (GE Healthcare) in tandem with light scatteringanalysis using both an Optilab rEX differential refractive indexand DAWN HELEOS II MALS detectors. Data were analyzedusing ASTRA VI software (Wyatt Technology) with peak align-ments, normalization, and band broadening effects determinedfrom a standard of 2 mg/ml bovine serum albumin. The mo-lecular weight of the sample was reported by selecting the peakwith the largest UV intensity and averaging the molar massvalues across the width of the peak. The radius of hydration wasinconsistent across different runs and was not included in theanalysis.
Mitophagy assayFor CID assay, HeLa cells stably expressing mKeima-P2A-FRB-Fis1 and FKBP-GFP-ATG13 and mutants were treated with A/Cheterodimerizer (for simplicity, it is called “rapalog” in the fig-ure; Clontech; #635056) for 24 h and then subjected to FACSanalysis as previously described (Vargas et al., 2019). For FIP200KO rescue experiments, HeLa or FIP200 KO cells stably ex-pressing mito-mKeima were cotransfected with 0.25 µg pEYFP-Parkin, 1 µg pHAGE-HA-FIP200-IRES-puro, and mutants withFuGENE HD (Promega) for 18 h and then treated with 10 µMOligomycin (Calbiochem), 10 µM Antimycin A (Sigma), and20 µM QVD (ApexBio) for 5 h before FACS analysis. All theconstructs (including site mutagenesis) were made with Gibsonassembly (NEB; #E2611S) and confirmed by Sanger sequencing.The complete sequence map of each construct is available uponrequest.
Cryo-EM sample preparation and data collectionUltrAUfoil 2/2 300 mesh gold grids (Quantifoil) were used foropen hole data collection (Data S1). Samples were concentratedafter gel filtration to ∼5 μM and applied to glow dischargedgrids. Blotting was performed at 100% humidity in a VitrobotMark IV (Thermo Fisher Scientific) for 2–6 s. Graphene oxide–coated grid datasets were prepared as follows. UltrAUfoil 1.2/1.3300 mesh gold grids (Quantifoil) were glow discharged undermild conditions (i.e., 10 mAmp for 15 s). Grids were incubatedwith a layer of polyethylenimine at 1 mg/ml for 2 min, afterwhich the solution was blotted off using Whatman 1 filter paperfollowed by two rounds of washing with water. Grids were al-lowed to dry for 15min and then incubated with 4 µl of grapheneoxide flakes (Sigma) at∼0.2 mg/ml for 1–2min. Excess grapheneoxide solution was wicked away andwashedwith two 4-µl dropsof water. Coated grids were screened in a T12 microscope toassess coverage and quality of graphene oxide before plungefreezing. FIP200:ATG13MR samples were checked via NSEMdirectly before freezing to assess quality of protein and proteinconcentration. Protein samples for the graphene oxide datasetswere diluted immediately before freezing in gel filtration buffer(50 mM Hepes, pH 8.0, 200 mM NaCl, 1 mM MgCl2, and 1 mMTCEP) to a final concentration between 200 and 500 nM. 3.0 µlof sample was loaded onto graphene oxide–coated gold grids.Sample was plunge-frozen using a Vitrobot Mark IV (ThermoFisher Scientific) with blot force 10–20 for 3–7 s.
Data were collected by the same procedure for all datasets.Samples were clipped and loaded into a Talos Arctica (Thermo
Shi et al. Journal of Cell Biology 11 of 14
Structural organization of the ULK complex https://doi.org/10.1083/jcb.201911047
Dow
nloaded from http://rupress.org/jcb/article-pdf/219/7/e201911047/1385058/jcb_201911047.pdf by guest on 04 April 2022

Fisher Scientific) operating at 200 kV. Frames were collected at36,000× nominal magnification on a K3 direct electron detector(Gatan) in super-resolution counted mode at 0.5685 A/pixel.Serial EMwas used for automated image shift data collection of afive-target cross pattern. Movies were taken in 100-ms framesat ∼1 e−/frame, totaling an electron dose of 60 electronsper movie.
Cryo-EM processingThe data processing scheme for the final maps is shown in Fig.S5. Micrographs were drift corrected using MotionCor2 (Zhenget al., 2017) and Fourier binned to 1.137A/pixel. CTFFIND4(Rohou and Grigorieff, 2015) was used to estimate the contrasttransfer function parameters of the integrated micrographs.Micrographs were cleaned by inspection and fast Fouriertransform quality.
The three datasets were collected and combined duringprocessing as follows. For Datasets 1 and 2, particles were pickedusing the Relion Autopicker and extracted at a box size of 200 ×200 pixels with 2.274 A/pixel. Dataset 1 was taken in open holeson a MBP-FIP200NTD:ATG13 (363–460) sample. Nearly half ofthe micrographs were removed due to poor drift correction,imaging of empty holes, or distorted CTF information. RelionAutopicker yielded ∼293k initial particle picks for this dataset.Single particles were pruned by 2D classification within Cry-osparc2 (Punjani et al., 2017). Although extensive processingschemes were attempted, no high-quality 3D initial models werefound. This we suspect is due to the shape of FIP200 and the lowcontrast of the protein in vitreous ice.
Dataset 2 was taken on graphene oxide with FIP200NTD:ATG13 (363–460) as the protein sample. Micrographs sufferingfrom large graphene oxide creases were removed during earlyprocessing steps. Similar particle picking and pruning wereperformed on this dataset, and ∼200k initial particle picks werefound. Combination of these datasets led to our final recon-struction via a soft mask around the highest density arm of theFIP200 dimer, as shown in Fig. S5 B. The final 29,198 particleswere masked and processed using nonuniform refinement inCryosparc2. Preferred orientationwas seen throughout the stepsof processing and was present in both orientation plot and3DFSC (28671674) of the final single-arm map. The final recon-struction was locally filtered and sharpened with a b factor of−661 within Cryosparc2. Of note, multibody refinement, localmotion correction, symmetry expansion, and additionally 3Dclassification did not improve the resolution of the final map.Processing within other software packages yielded maps ofworse quality and higher degrees of anisotropic density.
Dataset 3 was taken to increase the initial particle count forthe graphene oxide data. A similar number of micrographscontaining graphene oxide creases was present and removedcompared with Dataset 2. Dataset 3 was picked using a trainedmodel within crYOLO (Wagner et al., 2019), which proved tocenter on the FIP200 dimer better than other particle pickers inour hands. 2D classification was used to prune Dataset 3 down to∼80k final particles from an initial ∼159k particles (Fig. 6 A).Upon the realization that crYOLO was performing better forpicking, Datasets 1 and 2 were reprocessed, leading to final
particle counts of ∼65k and ∼69k particles, respectively. Thefinal map was deposited into the Electron Microscopy Data Bankunder accession code 21325.
Combination of the three datasets did not yield a better finalresolution model, but it did reveal a large conformational land-scape of the FIP200 dimer (Fig. 6 B). Conformations spanned a60-A range from ∼160 A to 220 A. This information helped toexplain our unsuccessful attempts at multibody refinement andlocal symmetry expansion, as motion at this scale has not beenresolved that we are aware of. Data were processed together inCryosparc2 and pruned to a final heterogeneous classificationof 213,156 particles. 3D classification into six classes yieldedthe final three maps, which show strong density for each armof the FIP200 dimer. Similar to processing of the two datasetfinal maps, further processing did not yield higher resolutionfeatures.
For docking of the TBK1 and ATG17 structures into our finalmonomeric density map, we used the “Fit_in_Map” functionwithin Chimera. For the TBK1 ULD/SLD structure, we removedthe atomic coordinates of the Kinase domain before docking. Thestructure was first docked manually near the FIP200NTDmonomer, and then 1,000 fits were sampledwith a search radiusof 2. The docking position with the highest cross correlation isshown in Fig. 6 D. Similarly, the ATG17 monomer was docked inthe same manner, and the highest docked position is shown inFig. S5 F.
Online supplemental materialFig. S1 shows raw micrographs and 2D class average galleries ofall NSEM datasets. Fig. S2 contains deuterium uptake plots ofsignificant peptides in the FIP200NTD and a quantitation of thepulldown assays in Fig. 2 and Fig. 3. Fig. S3 contains the rawFACS plots, which are quantitated in Fig. 2 G and Fig. 3 E. Fig. S4shows the SDS-PAGE pulldown assay of the ULK1 complex in thepresence of ATG13-ΔC. Fig. S5 contains a workflow of the cryo-EM data along with a sequence alignment between FIP200 andTBK1. Table S1 contains metrics for each NSEM dataset. Table S2shows processing and data collectionmetrics for the FIP200NTDcryo-EM datasets. Table S3 lists all constructs used in this study.Data S1 contains summary information on the HDX-MS datasets.
AcknowledgmentsWe thank P. Grob and D. Toso for cryo-EM facility support.
This work was supported by National Institutes of Health(NIH) grants R01 GM111730 to J.H. Hurley and F99 CA223029 toL.N. Young, Human Frontier Science Program (RGP0026/2017to J.H. Hurley), the Jane Coffin Childs Memorial Fund forMedical Research (A.L. Yokom), and the Intramural ResearchProgram of the NIH, National Institute of Neurological Disordersand Stroke.
J.H. Hurley is a scientific founder of and receives researchfunding from Casma Therapeutics.
Author contributions: Investigation, Data Curation, andFormal analysis: X. Shi, A.L. Yokom, C. Wang, and L.N. Young.Visualization: X. Shi and A.L. Yokom. Writing–Original Draft:X. Shi, A.L. Yokom, and J.H. Hurley.Writing–review and editing:
Shi et al. Journal of Cell Biology 12 of 14
Structural organization of the ULK complex https://doi.org/10.1083/jcb.201911047
Dow
nloaded from http://rupress.org/jcb/article-pdf/219/7/e201911047/1385058/jcb_201911047.pdf by guest on 04 April 2022

X. Shi, A.L. Yokom, C. Wang, R.J. Youle, and J.H. Hurley. Su-pervision and Project Administration: R.J. Youle and J.H. Hurley.
Submitted: 11 November 2019Revised: 28 February 2020Accepted: 6 April 2020
ReferencesAnding, A.L., and E.H. Baehrecke. 2017. Cleaning House: Selective Autophagy
of Organelles. Dev. Cell. 41:10–22. https://doi.org/10.1016/j.devcel.2017.02.016
Bahrami, A.H., M.G. Lin, X. Ren, J.H. Hurley, and G. Hummer. 2017. Scaf-folding the cup-shaped double membrane in autophagy. PLOS Comput.Biol. 13. e1005817. https://doi.org/10.1371/journal.pcbi.1005817
Bento, C.F., M. Renna, G. Ghislat, C. Puri, A. Ashkenazi, M. Vicinanza, F.M.Menzies, and D.C. Rubinsztein. 2016. Mammalian Autophagy: HowDoes It Work? Annu. Rev. Biochem. 85:685–713. https://doi.org/10.1146/annurev-biochem-060815-014556
Chan, E.Y., A. Longatti, N.C. McKnight, and S.A. Tooze. 2009. Kinase-inactivated ULK proteins inhibit autophagy via their conservedC-terminal domains using an Atg13-independent mechanism. Mol. Cell.Biol. 29:157–171. https://doi.org/10.1128/MCB.01082-08
Chen, S., C. Wang, S. Yeo, C.C. Liang, T. Okamoto, S. Sun, J. Wen, and J.L.Guan. 2016. Distinct roles of autophagy-dependent and -independentfunctions of FIP200 revealed by generation and analysis of a mutantknock-in mouse model. Genes Dev. 30:856–869. https://doi.org/10.1101/gad.276428.115
Fujioka, Y., S.W. Suzuki, H. Yamamoto, C. Kondo-Kakuta, Y. Kimura, H.Hirano, R. Akada, F. Inagaki, Y. Ohsumi, and N.N. Noda. 2014. Struc-tural basis of starvation-induced assembly of the autophagy initiationcomplex.Nat. Struct. Mol. Biol. 21:513–521. https://doi.org/10.1038/nsmb.2822
Ganley, I.G., H. Lam, J. Wang, X. Ding, S. Chen, and X. Jiang. 2009. UL-K1.ATG13.FIP200 complex mediates mTOR signaling and is essential forautophagy. J. Biol. Chem. 284:12297–12305. https://doi.org/10.1074/jbc.M900573200
Gomes, L.C., and I. Dikic. 2014. Autophagy in antimicrobial immunity. Mol.Cell. 54:224–233. https://doi.org/10.1016/j.molcel.2014.03.009
Hara, T., A. Takamura, C. Kishi, S. Iemura, T. Natsume, J.L. Guan, and N.Mizushima. 2008. FIP200, a ULK-interacting protein, is required forautophagosome formation in mammalian cells. J. Cell Biol. 181:497–510.https://doi.org/10.1083/jcb.200712064
Hayashi-Nishino, M., N. Fujita, T. Noda, A. Yamaguchi, T. Yoshimori, and A.Yamamoto. 2009. A subdomain of the endoplasmic reticulum forms acradle for autophagosome formation.Nat. Cell Biol. 11:1433–1437. https://doi.org/10.1038/ncb1991
Hieke, N., A.S. Loffler, T. Kaizuka, N. Berleth, P. Bohler, S. Drießen, F.Stuhldreier, O. Friesen, K. Assani, K. Schmitz, et al. 2015. Expression ofa ULK1/2 binding-deficient ATG13 variant can partially restore auto-phagic activity in ATG13-deficient cells. Autophagy. 11:1471–1483.https://doi.org/10.1080/15548627.2015.1068488
Hosokawa, N., T. Hara, T. Kaizuka, C. Kishi, A. Takamura, Y. Miura, S. Ie-mura, T. Natsume, K. Takehana, N. Yamada, et al. 2009. Nutrient-dependent mTORC1 association with the ULK1-Atg13-FIP200 complexrequired for autophagy. Mol. Biol. Cell. 20:1981–1991. https://doi.org/10.1091/mbc.e08-12-1248
Hurley, J.H., and L.N. Young. 2017. Mechanisms of Autophagy Initiation.Annu. Rev. Biochem. 86:225–244. https://doi.org/10.1146/annurev-biochem-061516-044820
Itakura, E., and N. Mizushima. 2010. Characterization of autophagosomeformation site by a hierarchical analysis of mammalian Atg proteins.Autophagy. 6:764–776. https://doi.org/10.4161/auto.6.6.12709
Jung, C.H., C.B. Jun, S.H. Ro, Y.M. Kim, N.M. Otto, J. Cao, M. Kundu, and D.H.Kim. 2009. ULK-Atg13-FIP200 complexes mediate mTOR signaling tothe autophagy machinery.Mol. Biol. Cell. 20:1992–2003. https://doi.org/10.1091/mbc.e08-12-1249
Kamada, Y., T. Funakoshi, T. Shintani, K. Nagano, M. Ohsumi, and Y. Ohsumi.2000. Tor-mediated induction of autophagy via an Apg1 protein kinasecomplex. J. Cell Biol. 150:1507–1513. https://doi.org/10.1083/jcb.150.6.1507
Kamada, Y., K. Yoshino, C. Kondo, T. Kawamata, N. Oshiro, K. Yonezawa, andY. Ohsumi. 2010. Tor directly controls the Atg1 kinase complex to
regulate autophagy. Mol. Cell. Biol. 30:1049–1058. https://doi.org/10.1128/MCB.01344-09
Karanasios, E., E. Stapleton, M. Manifava, T. Kaizuka, N. Mizushima, S.A.Walker, and N.T. Ktistakis. 2013. Dynamic association of the ULK1complex with omegasomes during autophagy induction. J. Cell Sci. 126:5224–5238. https://doi.org/10.1242/jcs.132415
Karanasios, E., S.A. Walker, H. Okkenhaug, M. Manifava, E. Hummel, H.Zimmermann, Q. Ahmed, M.C. Domart, L. Collinson, and N.T. Ktistakis.2016. Autophagy initiation by ULK complex assembly on ER tubulo-vesicular regions marked by ATG9 vesicles. Nat. Commun. 7:12420.https://doi.org/10.1038/ncomms12420
Kenny, S.J., X. Chen, L. Ge, and K. Xu. 2019. Super-resolution microscopyunveils FIP200-scaffolded, cup-shaped organization of mammalianautophagic initiation machinery. bioRxiv. https://doi.org/10.1101/712828
Koyama-Honda, I., E. Itakura, T.K. Fujiwara, and N. Mizushima. 2013.Temporal analysis of recruitment of mammalian ATG proteins to theautophagosome formation site. Autophagy. 9:1491–1499. https://doi.org/10.4161/auto.25529
Lazarus, M.B., C.J. Novotny, and K.M. Shokat. 2015. Structure of the humanautophagy initiating kinase ULK1 in complex with potent inhibitors.ACS Chem. Biol. 10:257–261. https://doi.org/10.1021/cb500835z
Lin, M.G., and J.H. Hurley. 2016. Structure and function of the ULK1 complexin autophagy. Curr. Opin. Cell Biol. 39:61–68. https://doi.org/10.1016/j.ceb.2016.02.010
Mercer, C.A., A. Kaliappan, and P.B. Dennis. 2009. A novel, human Atg13binding protein, Atg101, interacts with ULK1 and is essential for mac-roautophagy. Autophagy. 5:649–662. https://doi.org/10.4161/auto.5.5.8249
Mercer, T.J., A. Gubas, and S.A. Tooze. 2018. A molecular perspective ofmammalian autophagosome biogenesis. J. Biol. Chem. 293:5386–5395.https://doi.org/10.1074/jbc.R117.810366
Mizushima, N.. 2010. The role of the Atg1/ULK1 complex in autophagy reg-ulation. Curr. Opin. Cell Biol. 22:132–139. https://doi.org/10.1016/j.ceb.2009.12.004
Mizushima, N., T. Yoshimori, and Y. Ohsumi. 2011. The role of Atg proteins inautophagosome formation. Annu. Rev. Cell Dev. Biol. 27:107–132. https://doi.org/10.1146/annurev-cellbio-092910-154005
Papinski, D., and C. Kraft. 2016. Regulation of autophagy by signaling throughthe Atg1/ULK1 complex. J. Mol. Biol. 428:1725–1741. https://doi.org/10.1016/j.jmb.2016.03.030
Punjani, A., J.L. Rubinstein, D.J. Fleet, and M.A. Brubaker. 2017. cryoSPARC:algorithms for rapid unsupervised cryo-EM structure determination.Nat. Methods. 14:290–296. https://doi.org/10.1038/nmeth.4169
Qi, S., D.J. Kim, G. Stjepanovic, and J.H. Hurley. 2015. Structure of the HumanAtg13-Atg101 HORMA Heterodimer: an Interaction Hub within theULK1 Complex. Structure. 23:1848–1857. https://doi.org/10.1016/j.str.2015.07.011
Ragusa, M.J., R.E. Stanley, and J.H. Hurley. 2012. Architecture of the Atg17complex as a scaffold for autophagosome biogenesis. Cell. 151:1501–1512.https://doi.org/10.1016/j.cell.2012.11.028
Ravenhill, B.J., K.B. Boyle, N. von Muhlinen, C.J. Ellison, G.R. Masson, E.G.Otten, A. Foeglein, R. Williams, and F. Randow. 2019. The Cargo Re-ceptor NDP52 Initiates Selective Autophagy by Recruiting the ULKComplex to Cytosol-Invading Bacteria. Mol. Cell. 74:320–329.e6.
Rohou, A., and N. Grigorieff. 2015. CTFFIND4: Fast and accurate defocusestimation from electron micrographs. J. Struct. Biol. 192:216–221.https://doi.org/10.1016/j.jsb.2015.08.008
Shu, C., B. Sankaran, C.T. Chaton, A.B. Herr, A. Mishra, J. Peng, and P. Li.2013. Structural insights into the functions of TBK1 in innate antimi-crobial immunity. Structure. 21:1137–1148. https://doi.org/10.1016/j.str.2013.04.025
Song, Y., F. DiMaio, R.Y.Wang, D. Kim, C.Miles, T. Brunette, J. Thompson, andD. Baker. 2013. High-resolution comparative modeling with RosettaCM.Structure. 21:1735–1742. https://doi.org/10.1016/j.str.2013.08.005
Stjepanovic, G., C.W. Davies, R.E. Stanley, M.J. Ragusa, D.J. Kim, and J.H.Hurley. 2014. Assembly and dynamics of the autophagy-initiating Atg1complex. Proc. Natl. Acad. Sci. USA. 111:12793–12798. https://doi.org/10.1073/pnas.1407214111
Suzuki, H., T. Kaizuka, N. Mizushima, and N.N. Noda. 2015. Structure of theAtg101-Atg13 complex reveals essential roles of Atg101 in autophagyinitiation. Nat. Struct. Mol. Biol. 22:572–580. https://doi.org/10.1038/nsmb.3036
Turco, E., M. Witt, C. Abert, T. Bock-Bierbaum, M.Y. Su, R. Trapannone, M.Sztacho, A. Danieli, X. Shi, G. Zaffagnini, et al. 2019. FIP200 Claw
Shi et al. Journal of Cell Biology 13 of 14
Structural organization of the ULK complex https://doi.org/10.1083/jcb.201911047
Dow
nloaded from http://rupress.org/jcb/article-pdf/219/7/e201911047/1385058/jcb_201911047.pdf by guest on 04 April 2022

Domain Binding to p62 Promotes Autophagosome Formation at Ubiq-uitin Condensates. Mol. Cell. 74:330–346.e11.
Vargas, J.N.S., C. Wang, E. Bunker, L. Hao, D. Maric, G. Schiavo, F. Randow,and R.J. Youle. 2019. Spatiotemporal Control of ULK1 Activation byNDP52 and TBK1 during Selective Autophagy. Mol. Cell. 74:347–362.e6.
Wagner, T., F. Merino, M. Stabrin, T. Moriya, C. Antoni, A. Apelbaum, P.Hagel, O. Sitsel, T. Raisch, D. Prumbaum, et al. 2019. SPHIRE-crYOLO isa fast and accurate fully automated particle picker for cryo-EM. Com-mun. Biol. 2:218. https://doi.org/10.1038/s42003-019-0437-z
Wallot-Hieke, N., N. Verma, D. Schlütermann, N. Berleth, J. Deitersen, P. Bohler,F. Stuhldreier, W. Wu, S. Seggewiß, C. Peter, et al. 2018. Systematicanalysis of ATG13 domain requirements for autophagy induction. Au-tophagy. 14:743–763. https://doi.org/10.1080/15548627.2017.1387342
Wen, X., and D.J. Klionsky. 2016. An overview of macroautophagy in yeast.J. Mol. Biol. 428:1681–1699. https://doi.org/10.1016/j.jmb.2016.02.021
Yla-Anttila, P., H. Vihinen, E. Jokitalo, and E.-L. Eskelinen. 2009. 3D to-mography reveals connections between the phagophore and endo-plasmic reticulum. Autophagy. 5:1180–1185. https://doi.org/10.4161/auto.5.8.10274
Yorimitsu, T., and D.J. Klionsky. 2005. Atg11 links cargo to the vesicle-forming machinery in the cytoplasm to vacuole targeting pathway.Mol. Biol. Cell. 16:1593–1605. https://doi.org/10.1091/mbc.e04-11-1035
Zachari, M., and I.G. Ganley. 2017. The mammalian ULK1 complex and au-tophagy initiation. Essays Biochem. 61:585–596. https://doi.org/10.1042/EBC20170021
Zaffagnini, G., and S. Martens. 2016. Mechanisms of selective autophagy.J. Mol. Biol. 428:1714–1724. https://doi.org/10.1016/j.jmb.2016.02.004
Zhang, C., G. Shang, X. Gui, X. Zhang, X.C. Bai, and Z.J. Chen. 2019. Structuralbasis of STING binding with and phosphorylation by TBK1. Nature. 567:394–398. https://doi.org/10.1038/s41586-019-1000-2
Zheng, S.Q., E. Palovcak, J.P. Armache, K.A. Verba, Y. Cheng, and D.A. Agard.2017. MotionCor2: anisotropic correction of beam-induced motion forimproved cryo-electron microscopy. Nat. Methods. 14:331–332. https://doi.org/10.1038/nmeth.4193
Zivanov, J., T. Nakane, B.O. Forsberg, D. Kimanius, W.J. Hagen, E. Lindahl,and S.H. Scheres. 2018. New tools for automated high-resolution cryo-EM structure determination in RELION-3. eLife. 7. e42166. https://doi.org/10.7554/eLife.42166
Shi et al. Journal of Cell Biology 14 of 14
Structural organization of the ULK complex https://doi.org/10.1083/jcb.201911047
Dow
nloaded from http://rupress.org/jcb/article-pdf/219/7/e201911047/1385058/jcb_201911047.pdf by guest on 04 April 2022

Supplemental material
Shi et al. Journal of Cell Biology S1
Structural organization of the ULK complex https://doi.org/10.1083/jcb.201911047
Dow
nloaded from http://rupress.org/jcb/article-pdf/219/7/e201911047/1385058/jcb_201911047.pdf by guest on 04 April 2022

Figure S1. NSEM of FIP200NTD complexes. (A–J) Representative micrograph, schematic, and gallery of 2D class averages for each negative stain dataset.Scale bar on each micrograph is 80 nm.
Shi et al. Journal of Cell Biology S2
Structural organization of the ULK complex https://doi.org/10.1083/jcb.201911047
Dow
nloaded from http://rupress.org/jcb/article-pdf/219/7/e201911047/1385058/jcb_201911047.pdf by guest on 04 April 2022

Figure S2. Deuterium uptake plot for peptides in FIP200NTDwith significant differences and quantification of pulldown assay. (A)Deuterium uptakeplot for peptide (74–80). (B) Deuterium uptake plot for peptide (158–169). (C) Deuterium uptake plot for peptide (188–199). (D) Deuterium uptake plot forpeptide (314–324). (E) Deuterium uptake plot for peptide (347–361). (F) Deuterium uptake plot for peptide (433–448). (G) Deuterium uptake plot for peptide(458–472). (H) Deuterium uptake plot for peptide (480–489). (I) Deuterium uptake plot for peptide (528–541). (J) Quantification of relative expression ef-ficiency for GST-FIP200NTD in Fig. 2 D. (K)Quantification of relative pulldown efficiency for GST-FIP200NTD in Fig. 2 D. (L)Quantification of relative pulldownefficiency for GST-ATG13MR in Fig. 3 D. All values are mean ± SD.
Shi et al. Journal of Cell Biology S3
Structural organization of the ULK complex https://doi.org/10.1083/jcb.201911047
Dow
nloaded from http://rupress.org/jcb/article-pdf/219/7/e201911047/1385058/jcb_201911047.pdf by guest on 04 April 2022

Figure S3. FACS analysis of the FIP200-ATG13 interaction inmitophagy. (A) FACS plots showing mito-mKeima ratio (561/488 nm) for Fig. 2 G. (B) TheWTATG13 and ATG13 M123 are expressed at similar levels in cells used in Fig. 3 E. (C) FACS plots showing mito-mKeima ratio (561/488 nm) for Fig. 3 E. OAQ,Oligomycin, Antimycin A, and QVD.
Shi et al. Journal of Cell Biology S4
Structural organization of the ULK complex https://doi.org/10.1083/jcb.201911047
Dow
nloaded from http://rupress.org/jcb/article-pdf/219/7/e201911047/1385058/jcb_201911047.pdf by guest on 04 April 2022

Figure S4. Pulldown assays of the ULK1 complex with FIP200NTD, ATG13, and ULK1 constructs. GSH, Strep-Tactin, and Amylose resin were used to pulldown GST-FIP200NTD:Strep-ATG13:Strep-ATG101:MBP-ULK1 complex from lysate of overexpressing HEK cells. The pulldown results were visualized by SDS-PAGE and Coomassie blue staining.
Shi et al. Journal of Cell Biology S5
Structural organization of the ULK complex https://doi.org/10.1083/jcb.201911047
Dow
nloaded from http://rupress.org/jcb/article-pdf/219/7/e201911047/1385058/jcb_201911047.pdf by guest on 04 April 2022

Figure S5. Cryo EM workflow. (A) Representative micrograph from Dataset 2. Scale bar is 40 nm. (B) Data processing scheme for final cryo-EM re-constructions. (C) FSC curves of final cryo-EM reconstruction of FIP200NTD. (D)Orientation parameters of final particle alignments. (E) 3DFSC plot of the finalmap. (F) Fit of Atg17 structure (PDB accession no. 4HPQ, blue) into our cryo-EM density. (G) Sequence alignment of FIP200 (RB1CC1) and human TBK1. The redbox indicates the region with the highest conservation and that contains the NPIF motif.
Shi et al. Journal of Cell Biology S6
Structural organization of the ULK complex https://doi.org/10.1083/jcb.201911047
Dow
nloaded from http://rupress.org/jcb/article-pdf/219/7/e201911047/1385058/jcb_201911047.pdf by guest on 04 April 2022

Provided online are three tables. Table S1 contains metrics for each NSEM dataset, Table S2 shows processing and data collectionmetrics for the FIP200NTD cryo EM datasets, and Table S3 lists all constructs used in this study.
A supplemental dataset is also available online that provides summary information on the HDX-MS datasets.
Shi et al. Journal of Cell Biology S7
Structural organization of the ULK complex https://doi.org/10.1083/jcb.201911047
Dow
nloaded from http://rupress.org/jcb/article-pdf/219/7/e201911047/1385058/jcb_201911047.pdf by guest on 04 April 2022