article characteristic of silicon doped diamond like...
TRANSCRIPT

Article
Characteristic of silicon doped diamond like carbon thin films on surface properties and human serum albumin adsorption
Ahmed, Mukhtar, Byrne, John and Ahmed, Waqar
Available at http://clok.uclan.ac.uk/11933/
Ahmed, Mukhtar, Byrne, John and Ahmed, Waqar (2015) Characteristic of silicon doped diamond like carbon thin films on surface properties and human serum albumin adsorption. Diamond and Related Materials, 55 . pp. 108116.
It is advisable to refer to the publisher’s version if you intend to cite from the work.http://dx.doi.org/10.1016/j.diamond.2015.03.016
For more information about UCLan’s research in this area go to http://www.uclan.ac.uk/researchgroups/ and search for <name of research Group>.
For information about Research generally at UCLan please go to http://www.uclan.ac.uk/research/
All outputs in CLoK are protected by Intellectual Property Rights law, includingCopyright law. Copyright, IPR and Moral Rights for the works on this site are retained by the individual authors and/or other copyright owners. Terms and conditions for use of this material are defined in the http://clok.uclan.ac.uk/policies/
CLoKCentral Lancashire online Knowledgewww.clok.uclan.ac.uk
1
Characteristic of Silicon Doped Diamond Like Carbon thin films on
surface properties and Human Serum Albumin Adsorption
Mukhtar H. Ahmed1* John A. Byrne1 and Waqar Ahmed2 1- Nanotechnology Integrated Bio-Engineering Centre, University of Ulster,
Shore Road, BT37 0QB, Belfast, UK 2- Institute of Nanotechnology & Bioengineering, School of Medicine and
Dentistry, University of Central Lancashire, Preston, PR1 2HE, UK
*Corresponding author email: [email protected]
Keywords: Human Serum Albumin, Diamond Like Carbon, Si-DLC, Raman
spectroscopy, Atomic force microscopy
Abstract
Diamond-like carbon (DLC) coatings are useful for creating biocompatible surfaces for
medical implants. DLC and silicon doped DLC have been synthesised using plasma
enhanced chemical vapour deposition (PECVD). The effects of surface morphology on
the interaction of human serum albumin (HSA) with doped and undoped DLC films have
been investigated using a range of surface analysis techniques using Raman spectroscopy
and atomic force microscopy (AFM). Raman spectra of doped DLC show silicon doped
DLC reduces the growth range of ID/IG ratio, with significant red-shift of G peak position.
Following exposure to protein, for undoped DLC the peaks at 1664cm-1 and around 1241
cm-1 can be attributed to amide I and III, respectively, with an increase in the surface
morphology of the surfaces giving some indication of the protein structure on the
surfaces. Results indicate that HSA exhibit the majority of β-sheet during the adsorption
on the surfaces. The results showed that the silicon incorporation DLC tends to increase
of surface roughness and the adsorbed level of HSA is higher with higher levels of silicon
doping of the DLC. Therefore, doping DLC may provide a method of controlling the
adsorption of protein.
Citation Information: Ahmed, Mukhtar, Byrne, John and Ahmed, Waqar (2015) Characteristic of silicon doped diamond like carbon thin films on surface properties and human serum albumin adsorption. Diamond and Related Materials, 55 . pp. 108-116.

2
1. Introduction
Interest in the field of biomaterials has increased over the last three decades due to their
importance in repair and replacement of diseased or damaged tissues in the body. The
implantation of biomaterials into the human body allows it restructure function and hence
to enhance the quality of life.
Protein interaction is central to many biological processes including the interaction of
cells with the surfaces of biomaterials. The adsorption of proteins to the surface of
biomaterial is of great importance because of its governing role in determining cellular
responses to implanted materials and substrates for tissue engineering and regenerative
medicine [1]. The understandings of the fundamental factors that determine protein
adsorption are imperative to improve our ability to design biocompatible materials and
biotechnological devices.
Due to its unique combination of desirable properties including chemical inertness,
high density, heamocompatibility and poor coefficient of friction [2], diamond like
carbon (DLC) is an attractive biomaterial for coating human implantable devices [3,4],
such as rotary blood pumps [5] mechanical heart valves [6], coronary artery stents [7],
hip and knee replacements [ ]8 . DLC films have shown excellent hemocompatibility,
resulting in a reduction of thrombosis formation and cytotoxic reactions in vitro and in
vivo as observed by the normal cell growth on DLC surfaces [9], which has been regarded
as important advances in the field of biomedical devices and implants [2].
The chemical and physical properties of the surface such as the elemental composition,
functional groups and surface energy are very important and play a role in enhancing or
decreasing the adsorption of proteins or biological compounds of the implant. Thus, to
enhance the biocompatibility of DLC, doping has been investigated involving the
incorporation of third element such as nitrogen [10], fluorine [11], silicon [12] and
titanium [13].
It has been reported that silicon incorporation into DLC tended to improve the chemical
stability and wear resistance of the DLC films [14]. Si-DLC overcomes some of the
drawbacks mentioned, including low intrinsic compressive stress, good adhesion, and
mechanical resistance [15], which are beneficial for biomedical applications.
Improvements in blood compatibility with silicon doped DLC film where a decrease of
inflammatory reactions was observed compared to undoped DLC [16].

3
To improve understanding and predict protein-surface interaction behaviour, DLC and
Si-DLC have been studied using human serum albumin (HSA). This study aims to
illustrate the conformational changes in proteins upon attachment to surfaces, and
adsorption on the surfaces for lengthy periods, in order to obtain a better understanding
of the dynamic phenomena in protein adsorption.
In this contribution, we explore the coating of silicon wafer substrates with DLC and
silicon doped DLC thin films using plasma enhanced chemical vapour deposition
(PECVD). The adsorption process of Human serum albumin (HSA) is investigated, since
its adsorption onto surgical instruments and medical devices is likely to dominate in vivo
due to its abundance in the human serum.
2. Experimental
2.1 Film Preparation and modification
DLC and Si-DLC were deposited on silicon wafer by the radio frequency (RF) 13.56
MHz PECVD using a Diavac model 320PA (ACM Ltd.), with negative electrode self-
bias voltages set at 400 Volt. Before deposition of the films, substrates of silicon wafers
(1.0×1.0) cm2 were cleaned using an ultrasonic bath in acetone and isopropanol (1:1) for
5 minute followed by washing with distilled water and then dried using nitrogen gas.
The experimental equipment had been described in detail previously [17]. The cleaned
substrates were placed in the deposition chamber on top of a water-cooled electrode
driven by an RF power supply. When the chamber pressure reached ~5×10⁻⁶ Torr, the
glow discharge argon plasma (60 cm3/min) was used to clean substrate and make the
surface rough and to deposit evaporated coating material. The films were prepared under
the following conditions: Argon was used as a carrier gas, and C2H2 with
tetramethylsilane (TMS) (Si(CH3)4 [99.8% Sigma-Aldrich] were used as reactant gas.
The (Ar:C2H2) flow ratio was fixed at (10:20) standard cubic centimetre per minute
(sccm), and the deposition time was fixed for 5 minute. In the case of silicon doped DLC,
the various doping concentrations of silicon were achieved using TMS. Detailed
parameters are given in Table 1.

4
Table 1: Conditions of the DLC and Si-DLC films deposition process Parameters Samples
DLC S-1 S-2 S-3 rf. Power (Watt) 102 107 119 128
Ar:C2H2 ratio (sccm) 10:20 10:20 10:20 10:20 Pressure in Process x10-
2 ( Torr) 0.69 0.83 1.17 1.68
TMS flow rate (sccm) 0 2 5 10 Film thickness (nm) 168±12 182 ±15 202 ±13 239±16
(ID/IG) ratio 0.60 0.52 0.45 0.39
Water contact angle (θ) 79.3°±1.4 80.1°±1.8 82.7°±1.3 86.4°±1.7
(rf): radio frequency, (W): watt, Bias voltage: 400 volt, deposition time: 5 minute, (TMS): Tetramethylsilane, (sccm): standard centimetre cube per minute, nm: nanometre, Initial chamber pressure: ~ 5 x10⁻⁶ Torr, (±) is SD for n = (5-7) samples. (ID/IG): is the intensity ratio between disorder induced (D) and graphite (G) band.
2.2 Adsorption studies
0.1mg/ml of HSA (from Sigma-Aldrich) solution was prepared in physiologic buffer
solution using 0.01M pH 7.4 of Phosphate Buffer Saline (PBS tablets from Sigma-
Aldrich). The clean and dry coated samples were immersed in 10 ml of above solution in
separate jar. The component was incubated for 30 minute with the adjusted temperature
of (37±1) ºC. At the end of the adsorption period, the samples were rinsed and washed
using distilled water and then dried.
2.3 Surface characterisation
Stylus profilometry was used to determine the film thickness (Dektak 8 Advanced Stylus
Profiler Veeco Instruments Inc., USA).
XPS measurements were taken using a KRATOS XSAM 800 equipped with an energy
analyser (15 keV and 5 mA.) with a monochromatic Aluminium K-alpha X-ray source at
hv =1486 eV. The operating pressure in the analysis chamber was kept around ~8.6 ×
10−10 bar. All spectra were referenced by setting the C1s peak to 285.0 eV to compensate
for residual charging effects.
Raman Spectroscopy was carried out on all samples before and after adhesion of HSA,
by ISA lab-ram model system using an Argon laser beam ~50 mW 633 nm laser diode
for excitation. The following parameters were used: confocal aperture 200 μm, spectral

5
resolution 5 cm-1. A 100× objective was employed with typical acquisition times of 7
seconds and repeated 10 times. This process was repeated at five different spots across
the samples prepared before and after the adhesion process. Prior to data acquisition the
spectrometer was calibrated using the zero order diffraction peak and first order peak
from a silicon phonon mode (at 520 cm-1) from a silicon wafer sample.
The surface morphology of the synthesised films before and after adsorbed of HSA was
obtained and analysed by atomic force microscopy (AFM), using a Dimension TM 3100
(Veeco Metrology group). Imaging was performed under ambient conditions at room
temperature using a sharp silicon probes (R=20nm), attached to a low stress soft silicon
nitride cantilever with no reflecting coating on its back side [spring constant ~0.033 N/m
and resonant frequency around 15 kHz with the applied force of 500 mV]. The AFM
exhibited a maximum scan area of 10μm×10μm and a vertical range of 3μm and was
calibrated using calibration gratings purchased from Micro Masch. A root mean square
surface roughness (rms) was derived directly from the AFM height images.
The contact angle of water was measured in atmospheric conditions at room temperature
with a contact angle meter (CAM 200 optical contact angle system, KSV instruments
LTD, Finland). A drop of 5 µL of double distilled water was generated with a micrometric
syringe and was deposited on the substrate surfaces. The contact angle was read at five
different places on each sample surface. The average contact angle for each film was
determined along with the standard error.
3. Results and Discussion
The film thickness of DLC was 168 nm, with the addition of silicon to the films causing
an increase in the film thickness, i.e. 182, 202 and 239 nm for TMS flow rates of 2, 5 and
10 sccm respectively (Table 1). Thus the contents of silicon increased with film thickness
possible due to the fact that silicon atom has a larger radius than carbon [18]. In contrast,
the Si–C bond length (1.89 Å) is more than 20% longer than that in C-C bond length
(1.54 Å). These results are similar to those observed in our previous study [17].
3.1 surface contact angle
The contact angle is essential to understand the wetting properties of the surfaces. The
contact angle value of the DLC and Si- DLC films are shown in Table 1. DLC film tends

6
to be a mild hydrophobic surface with a water contact angle of approximately 79.3°. This
result is consistent with those obtained in our earlier studies [10]. The silicon incorporated
DLC films tends to be hydrophobic surfaces with a water contact angle of 80.1°, 82.7°
and 86.4° for S-1, S-2 and S-3, respectively. This indicates that a hydrophobic DLC can
be obtained by silicon treatment.
3.2 The XPS Spectrum of Samples
Chemical composition of the film surface was estimated by XPS analysis. The
measurement within the range of 0 eV to 1100 eV was performed (figure not shown).
Peaks of C 1s and O 1s were confirmed at ~285 eV and ~531 eV, respectively. As well,
in case of Si-DLC, the additional peak was observed at ~100 eV which attributed to Si2p
spectrum. This result, has clarified that the DLC film is consisted mainly of Carbon and
contaminated Oxygen at a ratio of C:O =7:1, (Table 2).
Table 2: Chemical composition of undoped and silicon doped DLC films obtained by
XPS measurement Samples Atom % sp3/sp2
C O Si DLC 86.7 13.3 0 0.55 S-1 81.9 13.7 4.5 0.63 S-2 76.3 14.1 9.6 0.67 S-3 68.5 14.6 16.7 0.76
C 1s peak of DLC film was measured within the range of 282 eV to 290 eV, is reported
in figure 1. This spectrum can be resolved into three components. The peak at 284.6 eV
is due to C=C (sp2). A second one observed at 285.3 eV attributable to C-C (sp3). The
last spectrum at 287.2 eV seems to be due to CO configuration. It suggests that silicon
doped DLC films contained relatively high concentration of Si atoms, which caused a
slight shift of the C1s spectrum toward a lower binding energy, accompanied by a
broadening of the C1s peaks with FWHM of 2.5 eV, figure 1.
Si 2p spectrum was measured within the range of 97 eV to 107 eV, is shown in figure 1.
This spectrum can be deconvoluted into three Gaussian peaks corresponding to the Si
bonded to Si (99.6eV), Si bonded C (100.6eV) and the last one located at 102.1 due to
SiO bonding.

7
283284285286287288289290
Inten
sity (
a.u)
Binding Energy (eV) DLC S-1 S-2 S-3
C=C
C-C
CO
98100102104106
Si-Si
Inten
sity (
a.u)
Binding energy (eV) S-1 S-2 S-3
Si-O
Si-C
98100102104106
Si-Si
Inten
sity (
a.u)
Binding energy (eV) S-1 S-2 S-3
Si-O
Si-C
Figure 1: XPS C1s and Si 2p spectra of DLC films.
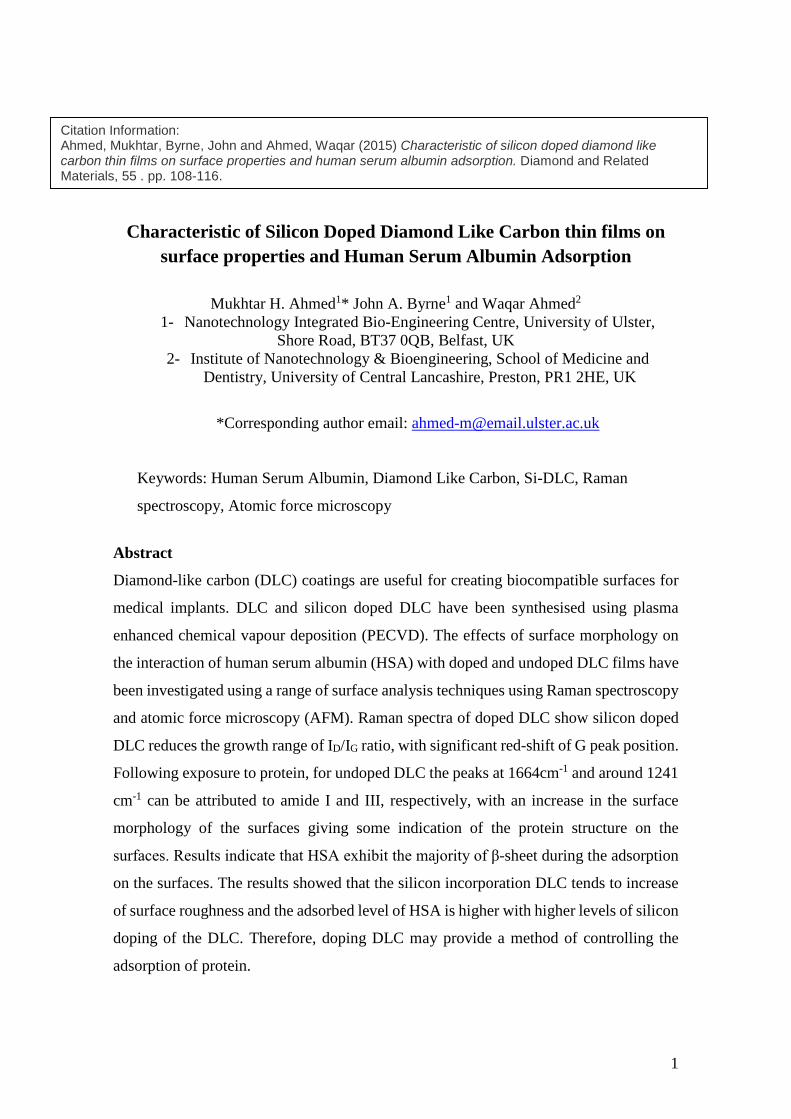
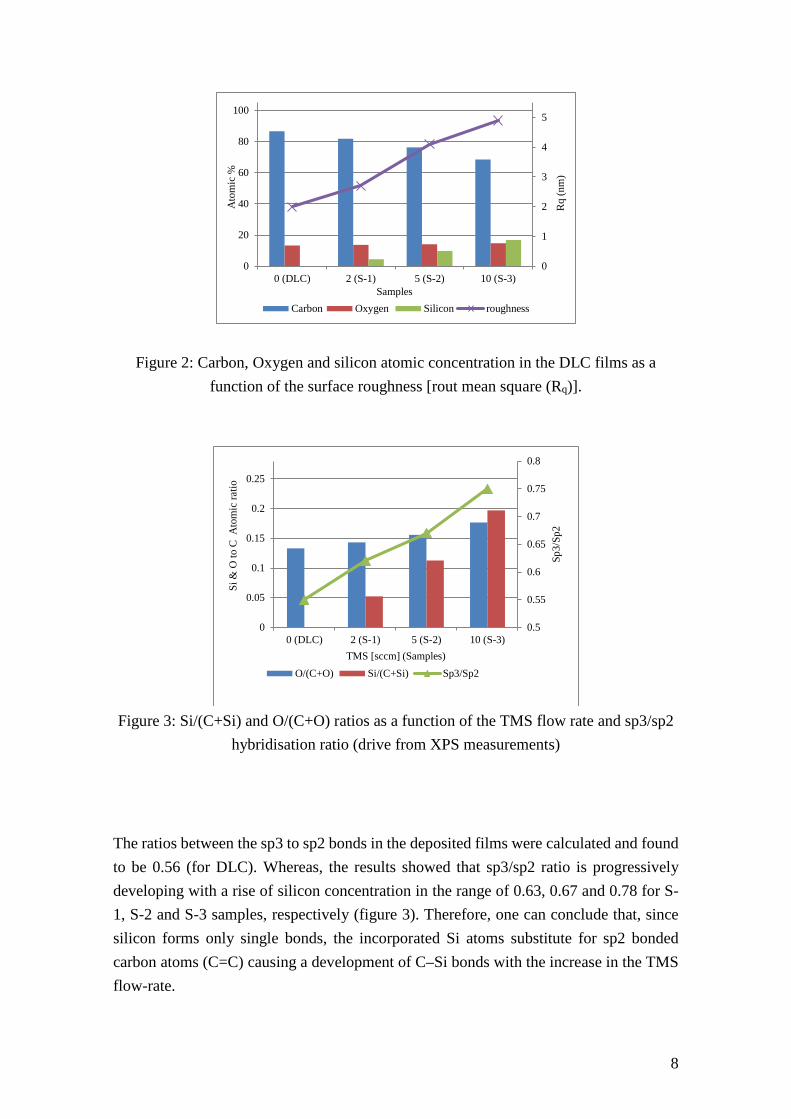
The silicon concentration in the doped films was increased from 4.5 at. % to 16.7 at. % with increasing of TMS flow rate during the film deposition from 2 sccm to 10 sccm, whereas, carbon atoms always decrease with the increasing silicon content, (table 1 and figure 2). On the other hand, the results obtained from figure 3 show that both the (O/C+O) and (Si/C+Si) atomic ratios are increased with increasing of TMS flow-rate during the film deposition.
8
Figure 2: Carbon, Oxygen and silicon atomic concentration in the DLC films as a function of the surface roughness [rout mean square (Rq)].
Figure 3: Si/(C+Si) and O/(C+O) ratios as a function of the TMS flow rate and sp3/sp2
hybridisation ratio (drive from XPS measurements)
The ratios between the sp3 to sp2 bonds in the deposited films were calculated and found to be 0.56 (for DLC). Whereas, the results showed that sp3/sp2 ratio is progressively developing with a rise of silicon concentration in the range of 0.63, 0.67 and 0.78 for S-1, S-2 and S-3 samples, respectively (figure 3). Therefore, one can conclude that, since silicon forms only single bonds, the incorporated Si atoms substitute for sp2 bonded carbon atoms (C=C) causing a development of C–Si bonds with the increase in the TMS flow-rate.
0
1
2
3
4
5
0
20
40
60
80
100
0 (DLC) 2 (S-1) 5 (S-2) 10 (S-3)
Rq
(nm
)
Ato
mic
%
SamplesCarbon Oxygen Silicon roughness
0.5
0.55
0.6
0.65
0.7
0.75
0.8
0
0.05
0.1
0.15
0.2
0.25
0 (DLC) 2 (S-1) 5 (S-2) 10 (S-3)
Sp3/
Sp2
Si &
O to
C A
tom
ic ra
tio
TMS [sccm] (Samples)O/(C+O) Si/(C+Si) Sp3/Sp2

9
3.3 Raman Spectroscopy
Raman spectroscopy is widely used for the investigation of sp carbon systems, as well as
for a number of carbon-based systems. In addition, it can be exploited to achieve a high
sensitivity in detecting small amounts of sp carbon. [19]
Raman spectra of DLC and related compounds showed a wide broad peak of carbon bands
in the range of 1000-1750 cm-1. The measured spectra employed two Gaussian peaks at
1349 cm-1 and 1538 cm-1. These bands are characteristic of disordered graphite (D band)
and pure graphite sp2 (G band), respectively (figure 4-A). The G-peak is due to bond
stretching of all pairs of sp2 configuration atoms in both rings and chains whilst the D-
peak is the shoulder of the G-peak at lower wave numbers due to the presence of the sp2
aromatic rings [20].
1000 1200 1400 1600 18000
500
1000
Inten
sity (
a.u)
Wavenumber (cm-1)
(A)
D-Ba
nd
G-Ba
nd
1000 1200 1400 1600 1800
0
900
1800
Inten
sity (
a.u)
Wavenumber (cm-1)
G-Ba
nd
D-Ba
nd
S-1 S-2 S-3
(B)
Figure 4: The Raman spectra of DLC (A) and Si-DLC (B) film samples
Whilst in the case of S-1, the typical G-band and D-band are located at 1527cm-1 and
1344 cm-1 respectively. Furthermore, increasing the silicon concentration resulted in a red
shift in the G-peak of about 12 cm-1 and 15 cm-1 in the D-peak positions (figure 4-B).
This is due to the sp2 domains in Si-DLC films decreasing [12].
10
In addition, silicon has a higher atomic mass than carbon and the downshift can be
attributed to the presence of Si-C bridging bonds which weaken the adjacent C-C bonds
[21].
The G band position is a function of the sp3 hybridisation. Following incorporation silicon
into the DLC film enhance the formation of the sp3-hybridized configuration (σ) bonding.
This is equivalent to breaking the π bonds in the sp2 hybridized aromatic ring structures
causing a decrease in the intensity of D-band [22]. On the other hand when the sp3
configuration increases the sp2 cluster size will decrease and the bond order increases
with a resultant Raman frequency increase [23].
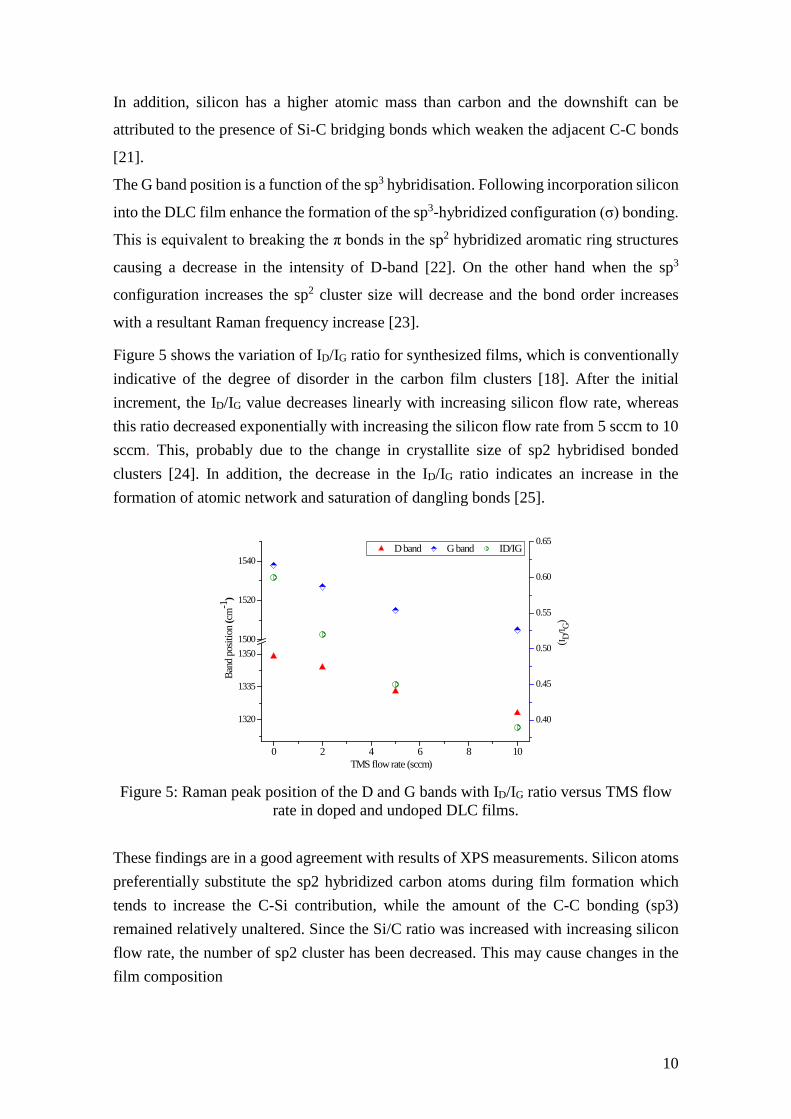
Figure 5 shows the variation of ID/IG ratio for synthesized films, which is conventionally indicative of the degree of disorder in the carbon film clusters [18]. After the initial increment, the ID/IG value decreases linearly with increasing silicon flow rate, whereas this ratio decreased exponentially with increasing the silicon flow rate from 5 sccm to 10 sccm. This, probably due to the change in crystallite size of sp2 hybridised bonded clusters [24]. In addition, the decrease in the ID/IG ratio indicates an increase in the formation of atomic network and saturation of dangling bonds [25].
Figure 5: Raman peak position of the D and G bands with ID/IG ratio versus TMS flow
rate in doped and undoped DLC films. These findings are in a good agreement with results of XPS measurements. Silicon atoms preferentially substitute the sp2 hybridized carbon atoms during film formation which tends to increase the C-Si contribution, while the amount of the C-C bonding (sp3) remained relatively unaltered. Since the Si/C ratio was increased with increasing silicon flow rate, the number of sp2 cluster has been decreased. This may cause changes in the film composition
0 2 4 6 8 10
1320
1335
13501500
1520
1540 D band G band ID/IG
TMS flow rate (sccm)
Band
pos
ition
(cm
-1)
0.40
0.45
0.50
0.55
0.60
0.65
(I D/I G)

11
Raman spectroscopy provides an effective method to ascertain the secondary and tertiary structural characteristics of protein. The secondary structure of protein is determined by the set of dihedral angles (ϕ, φ), which define the spatial orientation of the peptide backbone, and the presence of specific hydrogen bonds. [26] A wide range of secondary structural markers, including α-helix backbone (930cm-1 - 950cm- 1), amide I (1600cm-1 - 1700cm-1), and amide III (1200cm-1- 1350cm-1) can be monitored. The principal geometry for the α-helix is ϕ ~60° and φ ~45° with hydrogen bonds from the N-H of the fifth residue in the chain to the C=O group on the first residue. The dihedral angles of the β-sheet are ϕ ~130° and φ ~120°, forming an extended structure. The peptide backbone in a β-turn forms a rough plane that contains the intramolecular hydrogen bond. [27,28]. Raman spectra of free and adhered HSA onto DLC and Si-DLC samples can be observed
on figure 6. Significant bands assigned for the free HSA spectrum includes; the amide I
band, which is sensitive to the secondary structure in protein, located at 1656 cm-1 with
full width at half maximum (47 cm-1). The amide I modes, which involves mainly C=O
stretching, C-N stretching, C𝛼𝛼-C-N bending, and N-H in-plane bending of α-helical
peptide groups. In contrast, the band at ~1257 cm-1 is correlated to the amide III mode.
The amide III band includes N-H and C=O in-plane bending as well as C-N stretching
and contributions from Cα-C stretching modes. A band at around 849 cm-1 and 1003 cm-
1 are attributed to the Symmetric ring breathing mode of tyrosine (tyr) and phenylalanine
(phe) modes in HSA conformation, respectively. The protein backbone modes are
observed in the range of 900 cm-1 to 1100 cm-1. The moderately bands observed at 1327
cm-1 and 1448 cm-1, correspond to bending vibrations of both CH2 and CH3 deformation
mode [29]. The peak at 1405 cm-1 can be attributed to the symmetric stretching C=O of
ionized carboxyl groups (COO¯) of aspartic and glutamic acid, and side chain vibrations
of the imidazole ring of histidine [30]. As well, a band is located at ~1612 cm-1 is due to
the aromatic ring mode.

12
400 600 800 1000 1200 1400 1600 1800 2000
(A)
(B)
(D)
(E)
(C)
Wavenumber (cm-1)
Int
ensit
y (a/u
)
849 c
m-1
942c
m-1 1003
cm-1
1109
cm-1
1170
cm-1 1241
cm-1
1327
cm-1
1448
cm-1
1611
cm-1
1662
cm-1
658c
m-1
Figure 6: The Raman spectra for free (A) and adsorbed HSA on DLC (B), S-1 (C), S-2
(D) and S-3 (E).
Followed the adhesion of HSA on to DLC, the amide I band slightly shifted from 1656
cm-1 to 1664 cm-1, with FWHM wider (56 cm-1), and this shift well increased with
addition of silicon content DLC (table 3). In contrast the band at 1612 cm-1 well shifted
to near 1606 cm-1 this might be related to deprotonated of tyrosine ring during the
adsorption. Whereas, the amide III envelope reflects peptide amide bonds and is observed
as abroad band in the Raman spectra of adsorbed HSA. The wave-number maximum at a
lower Raman shift at around (1241-1248) cm-1 is an indicative of a lower α- helix content
in the protein’s secondary structure upon adsorption onto surfaces [31].
Table 3: Characteristic Raman vibrational bands (cm-1) of free and adsorbed HSA on DLC and Si-DLC samples
Free HSA
HSA adsorbed on Modes [28-34] DLC S-1 S-2 S-3
658 655 654 653 654 Tyr 849 853 852 853 853 Tyr 924 936 934 937 932 C-C
1003 1005 1004 1004 1006 phe 1109 1105 1102 1103 1101 C-C, C-N, C-O 1170 1177 1175 1179 1176 Tyr, phe 1257 1247 1248 1244 1241 Amide III 1327 1322 1326 1324 1328 CH2 sym, def 1405 1417 1415 1416 1417 COOsym 1448 1453 1451 1452 1453 CH3 def. 1611 1606 1605 1605 1602 Ar C=C 1662 1668 1670 1670 1672 Amide I Tyr: tyrosine, phe: phenylalanine, def: deformation, sym: symmetric, Ar
aromatic,

13
Raman spectra of [O=CO¯] stretching mode appeared at ~1417 cm-1, these blue shift
might be related to the chemical reaction of side chain carboxylic group with the surface
[32]. The results agree with our previous experiments, suggested that the adsorption of
glycine on to Si-DLC accrued through carboxylic acid group [12].
Curve fitting of the amide I band was performed to indicate the secondary structural
compositions of HSA using Gaussian model, (figure 7). The bands of free HSA were
located at 1614, 1634, 1654 cm-1 and 1669 cm-1 which is related to aromatic ring
vibration, random coil, α-helix and β-sheet components, respectively, whilst the bands
between 1680 –1690 cm-1 region reflects the contribution of β-turn [33].
1600162016401660168017001720
Inte
nsity
(a.u
)
Wavenumber (cm-1)
(A)
α-he
lices
β-sh
eet
β-Tu
rn
Ran
dom
coi
l
Aro
mat
ic
ring
3000
2000
1000
0
1600162016401660168017001720
0
600
1200
Wavenumber (cm-1)
(B)
Arom
atic
Rand
om co
il
α-He
lices
β-She
et
β-Turn
Inten
sity (
a.u)

14
1600162016401660168017001720
Wavenumber (cm-1)
(C)
α-heli
cesβ-shee
t
β-Turn
Rand
om co
il
aroma
tic rin
g
Inten
sity (a
.u)500
1000
1500
0
Figure 7: Curve fitting of the Amide I band vibration mode of free HSA (A) and
adsorbed on DLC (B) and on S-3 (C) surfaces.
Based on the analysis data, the free HSA protein consisted of 53.3% α-helix (1653 cm-1),
11.3% random coil (1635 cm-1), 23.1% β-sheet (1669 cm-1) and 12.2% β-tum (1687 cm-
1), this finding is consistent with our previous research that HSA contained major 55% of
α-helix and 45% β-structure in pH 7.4 buffer solution [34,35].
For the HSA adhered onto the samples, the amide I band fit of HSA showed a decrease
in the α-helix band intensity to (46%) with a slight increase in both β-sheet and random
coil conformations (table 4). This indicated the presence of conformational changes of
HSA during the adsorption. In case of adsorbed HSA on Si-DLC surfaces, the de-
convoluted band at ~1634 cm-1 can be assigned to the random conformation which
increases relative to the band at ~1653 cm-1 (α-helix region) with increasing silicon
doping of DLC. As well, an increase from 26% to 32% β-sheet is observed with increasing
of silicon concentration in a film to 16.7 at. %. This finding corroborates the ideas of
Wang et al, who suggested that, the proteins will tend to adsorb on the hydrophobic
surface by hydrophobic patches of residues present in the protein’s amphiphilic structure.
Protein would unfold and spread its hydrophobic core over the surface owing to the
thermodynamic driving force to reduce the net hydrophobic surface area of the system
exposed to the solvent [36]. While the hydrophilic amino acid moieties, which are not in
a close proximity to the adsorbing hydrophobic domains, are allowed to dangle to the
exterior and interact with the aqueous environment. [37].

15
Table 4: Assignment of amide I band positions to secondary structures of HSA before and after adsorption on DLC and Si-DLC
Structure Free HSA HSA adsorbed on
DLC S-1 S-2 S-3 ν cm-1
Band %
ν cm-1
Band %
ν cm-1
Band %
ν cm-1
Band %
ν cm-1
Band %
random coil 1633 11.3 1634 13.7 1634 14.8 1633 15.9 1634 17.6
α-helix 1653 53.3 1652 46.2 1652 42.4 1654 41.1 1653 39.3 β-sheet 1670 23.1 1669 26.9 1670 28.6 1670 30.2 1668 31.8 β-turn 1687 11.7 1685 12.8 1686 13.5 1687 13.4 1688 13.7
(ν): Raman shift band (cm-1).
The results inferred that silicon doping of DLC tends to increase of the β-sheet peak area
with reducing α-helix content. Comparing these results with native protein indicates that
the secondary structure of protein has been partially disordered due to the binding of HSA
to the surfaces.
These results are consistent with our previous analysis, which was obtained from
ellipsometry spectroscopy [38], suggested that the surface of samples undergo a
significant reduction in cosΔ , following the adhesion of HSA and this gap increases with
increasing the silicon content in the surface of the samples. This result is in agreement
with Benesch et al who reported that reduction in the (Δ) value corresponds with the
increasing surface coverage of HSA layers [39].
The finding is correlated with Naksnishi et al, who found that the proteins adsorb on
hydrophobic surfaces, which leads to a structural change upon adsorption onto the surface
[40]. This is compelling evidence that the presence of silicon enhances the adsorption of
HSA onto the surface of DLC; this might tend to reduce the adsorption of fibrinogen.
This indicates that the adsorption onto the coated DLC results in a change in the protein
conformation from α-helix to β-sheet.
3.4 Atomic force microscopy (AFM) analysis:
The roughness of the film surface is generally characterized by the rms (root mean square,
Rq) value. The three-dimensional topography of both doped and undoped films is
displayed in figure 8. The undoped DLC thin film showed a smooth and flat surface with
the root mean square value (Rq) roughness around 1.97nm. This finding is similar to those
obtained in our previous investigation [41].

16
Figure 8: Topographical AFM images of DLC and Si-DLC surfaces before (A) and after (B) protein adhesion.
In the case of Si-DLC samples the morphological peaks of films are quite sharp compared
to the peaks in DLC film. The root-mean-squared roughness (rms or Rq) of the samples
versus the Si concentration is summarized in table 5. The Rq value of samples was 2.7
nm, 4.1nm and 4.9 nm for S-1, S-2 and S-3, respectively.

17
Table 5: The various morphological parameters of DLC and Si-DLC thin films before and after adsorption of HSA
Parameters
(nm) scale
Samples DLC S-1 S-2 S-3
Before After Before After Before After Before After Root mean square [rms] (Rq)
1.97±0.13 6.16±0.54 2.74±0.15 6.24±0.62 4.14±0.18 6.92±0.51 4.93±0.2 7.20±0.64
Average height 3.48±1.3 18.46±1.9 4.25±1.5 19.17±2.0 5.9±1.5 22.32±2.2 7.6±0.9 25.42±2.1
Maximum height
10.25±0.76
27.53±1.82
11.63±0.58
28.41±1.64
14.12±1.13
30.72±2.34
18.32±1.87
34.68±3.21
Roughness (Ra) 0.72±0.08 1.8±0.11 1.18±0.17 1.88±0.2 1.63±0.15 1.96±0.21 2.18±0.18 2.50±0.16
(nm): is nanometre, rms or (Rq): roughness is based on a least square calculated with the best fit of the height points. (Ra): is obtained by a logarithm which measures the average deviation between the peaks and values from the mean line of the surfaces. (±): represent the values calculated standard deviation (n=3 samples).
Figure 2 shows the surface roughness of the films as a function of the atomic concentration in the film composition. As one can see, the surface roughness increases with increasing the silicon atomic concentration in the Si-DLC films. This may return to the bonding configuration. When DLC is doped with Si there is an increase in the hydrogen concentration and these phenomena tend to enhance the proportion of sigma bonds which increase the Rq values [42]. These results are consistent with other research suggesting that silicon content DLC tends to increase the Rq value [43,44].
In order to determine the change in the surface topography, AFM was used to investigate
and visualize conformation and morphologic characteristics resulting from adsorption of
HSA onto doped and undoped DLC films (Figure 8). The results show that HSA adsorbed
on both doped and undoped surfaces as a grain shape with an average height of 18-25 nm.
As seen from figure 8 and table 5, a significant change in the Rq values was observed
following HSA adsorption, i.e. for DLC, the Rq changed to 6.1 nm, and in case of the
doped samples, the Rq value increased to 6.2, 6.9 and 7.2 nm for S-1, S-2 and S-3,
respectively. The results showed good agreement with those obtained by Buijs et al, who
concluded that hydrophobic surface significantly contribute to strong protein/substrate
interactions, and suggested that proteins undergo structural rearrangements and spread
upon adsorption [45].
One can observe that the surface roughness of adsorbed HSA increased with increasing
of surface roughness of samples. This might return to existence of silicon and hydrogen
in the DLC films that are more electropositive than carbon will result in the formation a

18
surface dipole with an external positively charged side on the silicon doped DLC film.
This phenomenon is believed to be the responsible for anchoring the negatively charged
of the HSA molecules.
As mentioned above, silicon incorporated DLC tended to increase the water contact angle
(more hydrophobic). This could play a role in the increase of HSA adsorption on the Si-
DLC film surface; because a more hydrophobic surface reduces its interaction with water
molecules allowing more direct contact with the protein, rather than an interaction
mediated by a water layer and this will increase the adsorption layer. These results are in
correlation with Ogwu et al, who suggested that increasing the surface hydrophobicity
tends to promote human endothelial cell growth and adhesion on the films [46].
On the other hand, adsorption from solutions of protein takes place in two different
processes. The first process is fast and results in the direct adsorption of the protein
molecules that attach to the surface without changing their conformation and then move
laterally into a hexagonal close-packed (HCP) configuration. The second step which is
slower than the first step; the proteins adsorb randomly and irreversibly at a site on the
surface and the thickness of the layer gradually increases with the adsorbed amount due
to the conformational change taking place in the direction normal to the surface [40,47].
4. Conclusions
DLC and Si doped DLC have been synthesised and showed that silicon content in the
DLC tends to decrease the ID/IG with an increase in the surface roughness behaviour of
samples. It is found that the silicon doping may improve the surface morphology and film
thicknesses of DLC sample.
The interactions between adsorbed HSA molecules and the surface of samples played an
essential role in influencing these results. Followed the adhesion of HSA onto the
samples, the secondary structure of the adsorbed protein has changed from α-helices to
the β-sheet mode with slight increase of the random coil feature.
The results from the AFM, found that the (Rq) values increase with increasing silicon
content in the DLC samples. Since the Protein adsorption behaviour on the surfaces of
biomedical materials depends on the surface properties, such as material chemistry and
morphology, the AFM analysis showed that the surface roughness of samples
significantly increased following exposure to protein. The results suggested that a
multilayer of HSA covered the doped and undoped DLC samples, and this was improved

19
by the addition of silicon content. When the adsorption of HSA increases it tends to
reduce fibrinogen adsorption and lowers platelet adhesion. This might improve the
biocompatibility of the implant; however, further studies are required to obtain a better
understanding of protein adsorption in vivo.
References
1- R. A. Latour, Molecular simulation of protein-surface interactions: Benefits, problems, solutions, and future directions (Review) Biointerphases. 3:3 (2008), FC2–FC12.
2- S. Lousinian, S. Logothetidis, A. Laskarakis, M. Gioti, Haemo-compatibility of amorphous carbon thin films, optical properties and adsorption mechanisms of blood plasma proteins, Biomolecular Engineering 24 (2007) 107–112.
3- S. Kumar Jaganathan, E. Supriyanto, S. Murugesan, A. Balaji, and M. K. Asokan, Biomaterials in Cardiovascular Research: Applications and Clinical Implications, BioMed Research International, (2014), Article ID 459465, 11 pages. doi:10.1155/2014/459465.
4- H. W. Choi, R. H. Dauskardt, S.C. Lee, K. R. Lee, K. H. Oh, Characteristic of silver doped DLC films on surface properties and protein adsorption, Diamond & Related Materials 17 (2008) 252–257.
5- A. Alanazi, C. Nojiri, T. Kido, T. Noguchi, Y. Ohgoe, T. Matsuda, K. Hirakuri, A. Funakubo, K. Sakai, Y. Fukui, Engineering Analysis of Diamond-Like Carbon Coated Polymeric Materials for Biomedical Applications Artificial Organs 24:8 (2000) 624–627.
6- D. Grimanelis, S. Yang, O. Bohme, E. Roman, A. Alberdi, D.G. Teer, J.M. Albella, Carbon based coatings for high temperature cutting tool applications, Diamond and Related Materials 11 (2002) 176–184.
7- H.W. Choi, R.H. Dauskardt, S.C. Lee, K.R. Lee, K.H. Oh, Characteristic of silver doped DLC films on surface properties and protein adsorption, Diamond & Related Materials 17 (2008) 252–257.
8- J. I. Onate, M. Comin, I. Braceras, A. Garcia, J.L. Viviente, M. Brizucla, N. Garagorri, J.L. Peris, J.I. Alava, Wear reduction effect on ultra-high-molecular-weight polyethylene by application of hard coatings and ion implantation on cobalt chromium alloy, as measured in a knee wear simulation machine, Surface Coatings Technology 142–144 (2001)1056–1062.
9- S. Jahanmir, A.Z. Hunsberger, H. Heshmat, Load capacity and durability of H-DLC coated hydrodynamic thrust bearings, Load Capacity and Durability of H-DLC Coated Hydrodynamic Thrust Bearings, Journal of Tribology 133 (2011) 031301–31311.
10- M. H. Ahmed, J. A. Byrne, Effect of surface structure and wettability of DLC and N-DLC thin films on adsorption of glycine, Applied Surface Science, 258 (2012) 5166– 5174.

20
11- M. H. Ahmed, J. A. Byrne, J. McLaughlin, Evaluation of glycine adsorption on diamond like carbon (DLC) and fluorinated DLC deposited by plasma-enhanced chemical vapour deposition (PECVD), Surface & Coatings Technology 209 (2012) 8–14.
12- M. H. Ahmed, J. A. Byrne, J.A.D. McLaughlin, A. Elhissi, W. Ahmed, Comparison between FTIR and XPS characterization of amino acid glycine adsorption onto diamond-like carbon (DLC) and silicon doped DLC, Applied Surface Science 273 (2013) 507– 514.
13- W-C. Feng, C-H. Wang, H-C. Cheng, S-Y. Chiou, C-S. Chen and K-L. Ou, Enhancement of hemocompatibility on titanium implant with titanium-doped diamond-like carbon film evaluated by cellular reactions using bone marrow cell cultures in vitro , J. Vac. Sci. Technol. B, 27:32 (2009) 1559-1565.
14- S-F. Ou, C-S Chen, H. Hosseinkhani, C-H. Yu, Y-D. Shen, K-L. Ou, Surface properties of nanostructural silicon-doped carbon films for biomedical applications, Int. J. of Nanotechnology 10: (10-11) (2013) 945 – 958.
15- N. Moolsradoo, S. Abe and S. Watanabe, Thermal Stability and Tribological Performance of DLC-Si–O Films, Advances in Materials Science and Engineering, Article ID 483437 (2011) 7 pages, 2011.doi:10.1155/2011/483437.
16- R. K. Roy, H. W. Choi, J. W. Yi, M. W. Moon, K. R. Lee, D. K. Han, J. H. Shin, A. Kamijo, T. Hasebe, Hemocompatibility of surface-modified, silicon-incorporated, diamond-like carbon films Acta Biomater. 5 (2009) 249-256.
17- M. H. Ahmed, J. A. Byrne, J. McLaughlin, W. Ahmed, Study of Human Serum Albumin Adsorption and Conformational Change on DLC and Silicon Doped DLC Using XPS and FTIR Spectroscopy, Journal of Biomaterials and Nanobiotechnology, 4 (2013) 194-203.
18- B. Zhang, J. Li, J. Sun, Solid solution of Al and N in nano-sized α-SiC powder by carbothermal reduction of the xerogels of SiO2–Al2O3, Materials Letters 51 (2001) 219–224.
19- A Lucotti, C. S Casari, M Tommasini, A Li Bassi, D Fazzi, V Russo sp Carbon chain interaction with silver nanoparticles probed by Surface Enhanced Raman Scattering Chemical Physics Letters 478:1 (2009), 45-50
20- F. Klauser, D. S-Nethl, R. Kaindl, E. Bertel, N. Memme, Raman Studies of Nano- and Ultra-nanocrystalline Diamond Films Grown by Hot-Filament CVD, Chemical Vapour Deposition 16:4-6 (2010) 127–135.
21- A. Bendavid, P. J. Martin, C. Comte, E.W. Preston, A. J. Haq, F. S. M. Ismail, R. K. Singh, The Mechanical And Biocompatibility Properties of DLC-Si Films Prepared by Pulsed DC Plasma Activated Chemical Vapor Deposition, Diamond & Related Materials 16 (2007) 1616-1622.
22- S. E. Ong, S. Zhang, H. Du, H. C. Too, K. N. Aung, Influence of silicon concentration on the haemocompatibility of amorphous carbon, Biomaterials 28 (2007) 4033–4038.
23- F-X. Liu, Z-L. Wang, Thickness dependence of the structure of diamond-like carbon Films by Raman spectroscopy, Surface & Coatings Technology 203 (2009) 1829–1832.

21
24- R. Hatada, S. Flege, K. Baba, W. Ensinger, H.-J. Kleebe, I. Sethmann, and S. Lauterbach, Temperature dependent properties of silicon containing diamond like carbon films prepared by plasma source ion implantation, Journal of Applied Physics 107: 083307 (2010) doi:10.1063/1.3394002.
25- N. Woehrl, O. Ochedowski, S. Gottlieb, K. Shibasaki, and S. Schulz, Plasma-enhanced chemical vapour deposition of graphene on copper substrates, AIP Advances 4, 047128 (2014); doi: 10.1063/1.4873157
26- J. T. Pelton and L. R. McLean, Spectroscopic Methods for Analysis of Protein Secondary Structure, Analytical Biochemistry 277 (2000) 167–176
27- S. Wang and W-M Zheng, Fast Multiple Alignment of Protein Structures Using Conformational Letter Blocks, The Open Bioinformatics Journal, 3 (2009) 69-83.
28- M. A.H. Capelle, R. Gurny, T. Arvinte, High throughput screening of protein formulation stability: Practical considerations. European Journal of Pharmaceutics and Biopharmaceutics 65 (2007) 131–148.
29- E. C. Y. Li-Chan, The applications of Raman spectroscopy in food science, Trends in Food Science & Technology 7:11 (1996) 361–370.
30- C. C. Orfanidou, S. J. Hamudrakas, G. D. E. Chryssikos, I. Kamitsos, S. E. Wellman, S. T. Case, Spectroscopic studies of Manduca sexta and Sesamia nonagrioides chorion protein structure, International Journal of Biological Macromolecules 17:2 (1995) 93–98.
31- Z. Chi, X.G. Chen, J.S. Holtz, S.A. Asher, UV resonance Raman-selective amide vibrational enhancement: quantitative methodology for determining protein secondary structure. Biochemistry, 37:9 (1998) 2854-64.
32- H. I. Lee, M. S. Kim and S. W. Suh, Raman spectroscopy of L-phenylalanine, L-tyrosine, and their peptides adsorbed on silver surface, Bull. Korean Chem. Soc. 9:4 (1988) 218-223.
33- A. Synytsya, P. Alexa, J. de Boer, M. Loewe, M. Moosburger, M. Wurkner, K. Volka, Raman spectroscopic study of serum albumins: an effect of proton- and γ-irradiation , Journal of Raman Spectroscopy 38 (2007) 1646–1655.
34- M. H. Ahmed, T. E. Keyes, J. A. Byrne, C. W. Blackledge, J. W. Hamilton, Adsorption and photocatalytic degradation of human serum albumin on TiO2 and Ag-TiO2 films, Journal of Photochemistry and Photobiology A: Chemistry 222 (2011) 123– 131.
35- C. Tiede, A. A. S.Tang, S. E.Deacon, U.Mandal, J. E.Nettleship, R. L.Owen, S. E.George, D. J.Harrison, R. J.Owens, D. C.Tomlinson and M. J. McPherson, Adhiron: a stable and versatile peptide display scaffold for molecular recognition applications, Protein Eng Des Sel. 27:5 (2014) 145-55
36- K. Wang, C. Zhou, Y. Hong and X. Zhang, A review of protein adsorption on bioceramics , interface focus doi:10.1098/rsfs.2012.0012.
37- K. K. Goli, O. J. Rojas, A. E. Ozcam and J. Genzer,Generation of Functional Coatings on Hydrophobic Surfaces through Deposition of Denatured Proteins Followed by Grafting from Polymerization Biomacromolecules, 13:5 (2012) 1371–1382.

22
38- M. H. Ahmed, J. A. Byrne, J. McLaughlin, Kinetics and Thermodynamics of Human Serum Albumin Adsorption on Silicon Doped Diamond Like Carbon, Materials Chemistry and Physics,154 (2015) 84–93.
39- J. Benesch, A. Askendal, and P. Tengvall, The Determination of Thickness and Surface Mass Density of Mesothick Immunoprecipitate Layers by Null Ellipsometry and Protein 125Iodine Labeling, Journal of Colloid and Interface Science 249 (2002) 84–90
40- K. Naksnishi, T. Sakiyama and K. Imamura, Review on the Adsorption of Proteins on Solid Surfaces, a Common but Very Complicated Phenomenon, Journal of Bioscience and Bioengineering, 91:3 (2001) 233-244.
41- M. Ahmed, A. J. Byrne, J. McLaughlin, A. Elhissi, D. A. Phoenix and W. Ahmed, Vibrational and AFM studies of adsorption of glycine on DLC and silicon-doped DLC, J Mater Sci 47 (2012) 1729–1736.
42- X-M. He,K. C. Walter and M. Nastasi, Plasma-immersion ion-processed boron-doped diamond-like carbon films, J. Phys.: Condens. Matter 12 (2000) L183–L189
43- J. Wang, J. Pu, G. Zhang, L. Wang, Tailoring the structure and property of silicon-doped diamond-like carbon films by controlling the silicon content, Surface & Coatings Technology 235 (2013) 326–332.
44- K-H. Era and M-Gi. So, Thermal stability of reactive sputtered silicon-doped diamond-like carbon films, Journal of Ceramic Processing Research. 14:1 (2013) 134-138.
45- J. Buijs and V. Hlady, Adsorption kinetics, conformation, and mobility of growth hormone and lysozyme on solid surfaces, studied with TIRF. Journal of colloid and interface science, 190 (1997) 171-181.
46- A. Ogwu, T. I. T. Okpalugo, N. Ali, P. D. Maguire, J. A. D. McLaughlin, Endothelial Cell Growth on Silicon Modified Hydrogenated Amorphous Carbon Thin Films, J Biomed Mater Res Part B: Appl Biomater 85B (2008) 105-113.
47- C. Mathe, S. Devineau, J-C. Aude, G. Lagniel, S. Chedin, V. Legros, M-H. Mathon, J-P. Renault, S. Pin, Y. Boulard, J. Labarre, Structural Determinants for Protein adsorption/nonadsorption to Silica Surface, PLoS ONE 8:11 (2014) e81346. doi:10.1371/journal.pone.0081346