boron doped diamond films as electron donors in photovoltaics: an
TRANSCRIPT
Boron Doped diamond films as electron donors in photovoltaics: An X-ray absorptionand hard X-ray photoemission studyM. Kapilashrami, G. Conti, I. Zegkinoglou, S. Nemšák, C. S. Conlon, T. Törndahl, V. Fjällström, J. Lischner,
Steven G. Louie, R. J. Hamers, L. Zhang, J.-H. Guo, C. S. Fadley, and F. J. Himpsel
Citation: Journal of Applied Physics 116, 143702 (2014); doi: 10.1063/1.4897166 View online: http://dx.doi.org/10.1063/1.4897166 View Table of Contents: http://scitation.aip.org/content/aip/journal/jap/116/14?ver=pdfcov Published by the AIP Publishing Articles you may be interested in Insights on the influence of surface roughness on photovoltaic properties of state of the art copper indium galliumdiselenide thin films solar cells J. Appl. Phys. 111, 114509 (2012); 10.1063/1.4721648 Hard x-ray photoelectron spectroscopy of chalcopyrite solar cell components Appl. Phys. Lett. 100, 092108 (2012); 10.1063/1.3687197 Deposition of In 2 S 3 on Cu ( In , Ga ) ( S , Se ) 2 thin film solar cell absorbers by spray ion layer gas reaction:Evidence of strong interfacial diffusion Appl. Phys. Lett. 90, 132118 (2007); 10.1063/1.2717534 Thin-film photovoltaics J. Vac. Sci. Technol. A 23, 1208 (2005); 10.1116/1.1897697 X-ray photoemission studies and energy-band diagrams of ( In,Se)–CuInSe 2 /SnO 2 heterostructures J. Appl. Phys. 82, 825 (1997); 10.1063/1.365779
[This article is copyrighted as indicated in the article. Reuse of AIP content is subject to the terms at: http://scitation.aip.org/termsconditions. Downloaded to ] IP:
72.33.42.248 On: Wed, 08 Oct 2014 16:28:06

Boron Doped diamond films as electron donors in photovoltaics: An X-rayabsorption and hard X-ray photoemission study
M. Kapilashrami,1,2 G. Conti,3,4 I. Zegkinoglou,1,2 S. Nem�s�ak,3,4 C. S. Conlon,3,4
T. T€orndahl,5 V. Fj€allstr€om,5 J. Lischner,6 Steven G. Louie,4,6 R. J. Hamers,7 L. Zhang,7
J.-H. Guo,1 C. S. Fadley,3,4 and F. J. Himpsel2,a)
1Advanced Light Source, Lawrence Berkeley National Laboratory, Berkeley, California 94720, USA2Department of Physics, University of Wisconsin Madison, Madison, Wisconsin 53706, USA3Department of Physics, University of California, Davis, California 95616, USA4Materials Sciences Division, Lawrence Berkeley National Laboratory, Berkeley, California 94720, USA5Angstr€om Solar Center, Uppsala University, Box 534, SE-751 21 Uppsala, Sweden6Department of Physics, University of California, Berkeley, California 94720, USA7Department of Chemistry, University of Wisconsin Madison, Madison, Wisconsin 53706, USA
(Received 14 July 2014; accepted 22 September 2014; published online 8 October 2014)
Highly boron-doped diamond films are investigated for their potential as transparent electron
donors in solar cells. Specifically, the valence band offset between a diamond film (as electron
donor) and Cu(In,Ga)Se2 (CIGS) as light absorber is determined by a combination of soft X-ray
absorption spectroscopy and hard X-ray photoelectron spectroscopy, which is more depth-
penetrating than standard soft X-ray photoelectron spectroscopy. In addition, a theoretical analysis
of the valence band is performed, based on GW quasiparticle band calculations. The valence
band offset is found to be small: VBO¼VBMCIGS – VBMdiamond¼ 0.3 eV 6 0.1 eV at the CIGS/
Diamond interface and 0.0 eV 6 0.1 eV from CIGS to bulk diamond. These results provide a prom-
ising starting point for optimizing the band offset by choosing absorber materials with a slightly
lower valence band maximum. VC 2014 AIP Publishing LLC. [http://dx.doi.org/10.1063/1.4897166]
I. INTRODUCTION
Many solar cell materials and configurations have been
developed, and these are continually being optimized.1 Here,
we start from the most general design of a solar cell, which
consists of an absorber, an electron transport layer, and a
hole transport layer. In the widely used Si solar cells, these
three functions are combined in a single material in different
doping configurations. Choosing three separate materials
opens up many possibilities for new designs with enhanced
performance and lower cost (see Ref. 2 for a brief overview).
In the following, we will consider a generic design that takes
advantage of choosing three semiconductors for the three ba-
sic functions, as shown in Fig. 1. Using transparent wide-gap
semiconductors, such as TiO2 and diamond, for the electron
and hole transport layers allows both front and back illumi-
nation. At high doping, these semiconductors become metal-
lic (and even superconducting in the case of p-doped
diamond), with the Fermi level moving slightly into the band
edges.
The highly doped materials for electron and hole trans-
port can also be viewed as electron acceptors and donors,
although in a context different from bulk doping. For exam-
ple, the widely used n-type TiO2 electron transport material
accepts photo-excited electrons from the conduction band
minimum (CBM) of the absorber, even though it contains a
high density of donors in the bulk. Likewise, p-type diamond
donates electrons to the absorber to fill the photo-generated
holes in the absorber. These electrons do not originate from
the acceptor level of diamond, but from its valence band
maximum (VBM).
As absorber one needs a semiconductor with a gap near
the optimum for a single junction, which lies in the
1.0–1.5 eV range. There are many semiconductors to choose
from, most notably Si and GaAs. Here, we focus on CIGS
(typically Cuy(In1�xGax)Se2), whose gap is tunable within
the optimal energy range, with x � 0.7 for optimum perform-
ance.3–11 A suitable donor has been difficult to find, particu-
larly for dye-sensitized cells. Based on the success with TiO2
as acceptor, we choose p-doped diamond as a symmetric
counterpart. It is chemically inert, has a wide band gap mak-
ing it transparent to solar radiation, and can be highly doped
with boron.12 Synthetic highly doped diamond thin films can
be prepared inexpensively and are available commercially.
Their structures range from microcrystalline to nanocrystal-
line.13 Such films have been functionalized with dye mole-
cules for potential applications in dye-sensitized solar
cells.14,15
Here, we characterize the energy levels of the donor and
absorber part of the proposed three-layer structure, i.e., p-
type diamond and CIGS. Of particular significance for pho-
tovoltaics are the band offset and the band bending at the
interface. These determine how efficiently the hole is
refilled. Results from X-Ray Absorption Spectroscopy
(XAS), X-ray Photoelectron Spectroscopy (XPS), and quan-
tum efficiency measurements are combined with bulk optical
and electrical properties and theoretical calculations of the
quasiparticle density of states to obtain the band diagram at
the interface and in the bulk. The use of multiple techniques
a)Author to whom correspondence should be addressed. Electronic mail:
0021-8979/2014/116(14)/143702/8/$30.00 VC 2014 AIP Publishing LLC116, 143702-1
JOURNAL OF APPLIED PHYSICS 116, 143702 (2014)
[This article is copyrighted as indicated in the article. Reuse of AIP content is subject to the terms at: http://scitation.aip.org/termsconditions. Downloaded to ] IP:
72.33.42.248 On: Wed, 08 Oct 2014 16:28:06
provides redundancy and allows for cross-checks of the ac-
curacy. We find the VBM of CIGS to be 0.3 6 0.1 eV higher
than the VBM of p-doped diamond at the interface, and
0.0 6 0.1 eV higher than the bulk VBM of diamond. These
represent small barriers for hole transport. To eliminate them
completely, it is proposed to substitute Se by S in CIGS or to
choose an absorber material with a somewhat lower VBM.
The width of the interface barrier can be reduced by higher
B doping.
The paper is organized as follows: After a discussion of
the experimental details in Sec. II, we proceed to the deter-
mination of the unoccupied states by XAS in Sec. III and to
measurements of occupied states by XPS in Sec. IV. Since
the valence band offset is between occupied states, it can be
determined by XPS alone, as done in Table I. But the inclu-
sion of more accurate literature data for bulk diamond allows
a refinement of the results, particularly for the VBM relative
to the Fermi level and to the C1s core level. This refinement
is performed in Sec. V, and the complete band diagram is
given in Fig. 5. It combines the most accurate available
results and includes both occupied and unoccupied states.
The key findings and their consequences for using diamond
as electron donor material are presented in Sec. VI.
II. EXPERIMENTS
A 7 nm thin film of Cu0.78(In0.32Ga0.68)Se2 with
Cu/[Gaþ In]¼ 78% and Ga/[Gaþ In]¼ 68% was deposited
by co-evaporation of Cu, In, Ga, and Se at a substrate tem-
perature of 540 �C, in a base-pressure <3 � 10�6 mbar) on a
polycrystalline diamond substrate at. The composition was
obtained from a 2.3 lm thick reference sample by X-ray fluo-
rescence, using an XRF Panalytical Epsilon 5. The polished
surface of a p-doped polycrystalline diamond substrate (bo-
ron concentration about 1020 cm�3) from Element Six Ltd.
(Ascot. Berkshire, SL5 8BP, UK) was H-passivated in a
50 Torr hydrogen plasma, as described previously.16 In addi-
tion to the 7 nm CIGS/Diamond heterojunction sample, two
reference samples were analyzed, a 2.3 lm thick CIGS
(Cu0.78(In0.32Ga0.68)Se2) film deposited on a Mo coated
soda-lime glass substrate and a H-terminated, p-doped
polycrystalline diamond substrate.
The 2.3 lm CIGS film on Mo-coated soda-lime glass
was processed into a complete PV device, shown in Fig.
2(a), following the Angstr€om baseline procedure (as
described in Ref. 17). The I-V characteristics of this device
were measured at a cell temperature of 25 �C and under light
illumination from an ELH light source (1000 W/m2).
Representative values for all 32 cells on the 5 � 5 cm CIGS/
Mo sample are an open circuit voltage of 0.8 V, a short cir-
cuit current of 22.3 mA/cm2, a fill factor of 78.5%, and a
conversion efficiency of 13.7%.
The external quantum efficiency was determined from
300 nm to 1050 nm in 2 nm intervals, using chopped mono-
chromatic light from a Xe-arc light source (calibrated by Si
and InGaAs photodiodes). The optical band gap (Eg) of our
CIGS film was estimated by linear extrapolation of the
absorption edge of the quantum efficiency spectra (Fig.
2(b)). The resulting value Eg¼ 1.4 eV is consistent with the
relation between Eg and x obtained in Ref. 18 using x¼Ga/
[Gaþ In]¼ 0.68:
Eg ¼ 1:01þ 0:626 � x� 0:167 � ð1� xÞ: (1)
For our analysis, we have assumed that Eg of the 7 nm CIGS
layer on diamond is the same as for the 2.3 lm thick film
used to acquire the optical data. Possible differences in Eg
could be caused by different growth modes or different stoi-
chiometry. Grazing incidence X-ray diffraction data for the
thin sample were shifted 0.1–0.2� towards lower diffracting
angles, indicating that the 7 nm sample is slightly more In-
rich than the 2.3 lm sample, resulting in x � 0.5. That would
reduce the band gap by � 0.1 eV for the 7 nm sample, which
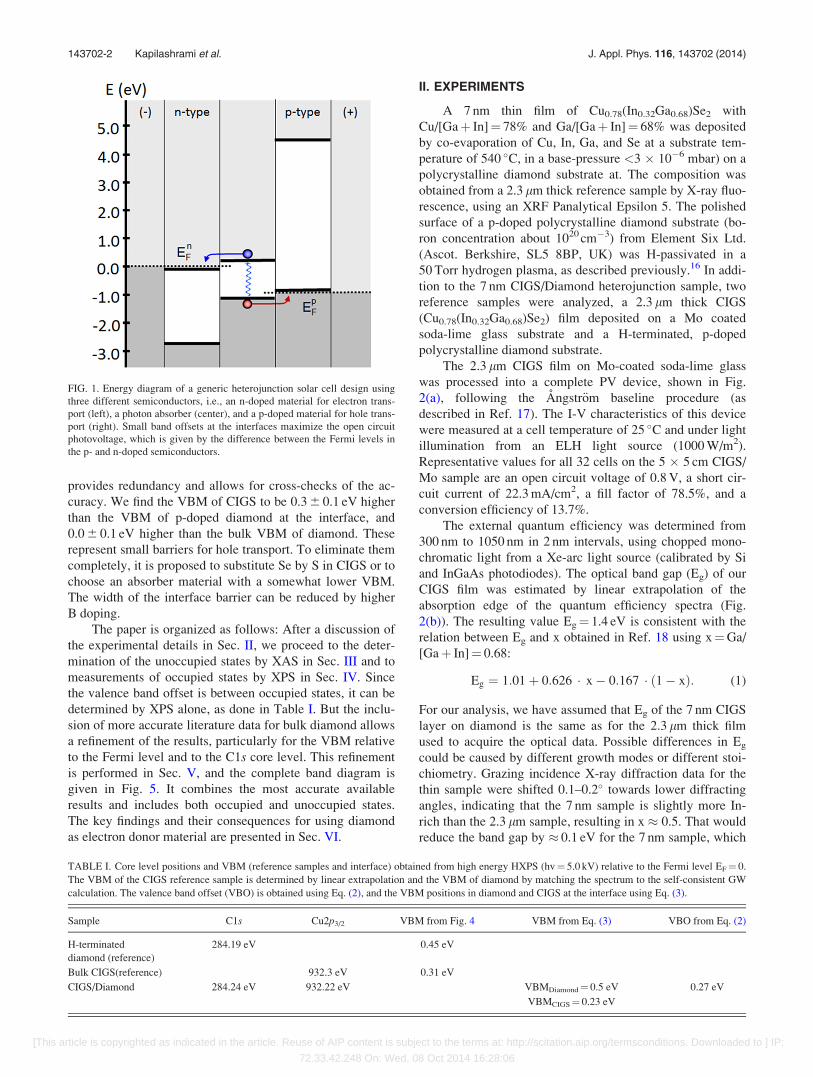
TABLE I. Core level positions and VBM (reference samples and interface) obtained from high energy HXPS (hv¼ 5.0 kV) relative to the Fermi level EF¼ 0.
The VBM of the CIGS reference sample is determined by linear extrapolation and the VBM of diamond by matching the spectrum to the self-consistent GW
calculation. The valence band offset (VBO) is obtained using Eq. (2), and the VBM positions in diamond and CIGS at the interface using Eq. (3).
Sample C1s Cu2p3/2 VBM from Fig. 4 VBM from Eq. (3) VBO from Eq. (2)
H-terminated
diamond (reference)
284.19 eV 0.45 eV
Bulk CIGS(reference) 932.3 eV 0.31 eV
CIGS/Diamond 284.24 eV 932.22 eV VBMDiamond¼ 0.5 eV 0.27 eV
VBMCIGS¼ 0.23 eV
FIG. 1. Energy diagram of a generic heterojunction solar cell design using
three different semiconductors, i.e., an n-doped material for electron trans-
port (left), a photon absorber (center), and a p-doped material for hole trans-
port (right). Small band offsets at the interfaces maximize the open circuit
photovoltage, which is given by the difference between the Fermi levels in
the p- and n-doped semiconductors.
143702-2 Kapilashrami et al. J. Appl. Phys. 116, 143702 (2014)
[This article is copyrighted as indicated in the article. Reuse of AIP content is subject to the terms at: http://scitation.aip.org/termsconditions. Downloaded to ] IP:
72.33.42.248 On: Wed, 08 Oct 2014 16:28:06

is comparable to the uncertainty of the extrapolation towards
the CBM (red line in Fig. 2). It would mainly affect the
CBM of CIGS. XAS showed no significant differences in the
spectra between the 2.3 lm and 7 nm films, and XPS gave a
difference of 0.08 eV between the Cu2p3/2 levels (Table I),
which is comparable to the error bar.
Synchrotron based X-ray absorption spectroscopy stud-
ies were performed at the Advanced Light Source (ALS) at
Lawrence Berkeley National Laboratory. Spectra of the
CIGS/Diamond heterojunction were acquired at BL 8.0.1 to
determine the unoccupied states in CIGS and diamond by
probing the Cu2p and C1s edges with an energy resolution
of 0.2 eV and 0.1 eV, respectively. Cu2p XAS spectra were
recorded in the total electron yield mode by measuring the
photocurrent, with a probing depth of 5–10 nm, while C1sspectra were recorded in the total fluorescence yield detec-
tion mode using a channel plate detector plus an Al filter,
with a probing depth of ca. 100 nm. The photon energy was
calibrated using CuO (2p1/2 peak of CuO at 931.3 eV for
Cu2p, compare Ref. 19) and graphite (p*-peak of graphite at
285.35 eV for C1s, from Ref. 20).
Hard X-ray photoemission (HXPS, HAXPES) measure-
ments (h�¼ 5.0 keV) were performed at BL 9.3.1 (ALS)
using a hemispherical analyzer (Scienta SES 2002), with a
total resolution of 0.6 eV on the following three samples:
(i) CIGS/Diamond heterojunction sample, (ii) CIGS/Mo ref-
erence sample, and (iii) H-terminated boron-doped diamond
reference sample. HXPS provides information on the occupied
states by probing the core levels and the valence band with
respect to the Fermi level (EF).21 The binding energy scales
were calibrated by measuring the Fermi edge of a Au reference
sample. The inelastic mean free paths (IMFPs) for CIGS and
diamond have been calculated for using the TPP formula22 to
be ca. 8 nm and 6 nm, respectively. These numbers can be
compared to the much lower values of ca. 3 nm and 2 nm,
FIG. 2. (a) A completed array of CIGS/Mo PV cells (cell area 0.5 cm2) on
soda-lime glass, with the composition Cu/[Gaþ In]¼ 78% and Ga/
[Gaþ In]¼ 68%. These exhibited an average conversion factor of 13.7%.
(b) The corresponding quantum efficiency spectrum, which provides the
band gap Eg of CIGS.
FIG. 3. XAS spectra for 7 nm CIGS deposited on a highly boron doped dia-
mond film. (a) Bulk-sensitive C1s absorption spectra in the fluorescence
yield detection mode. Peaks A and B are assigned to transitions into acceptor
states arising from C atoms adjacent to a boron (peak A) and C atoms com-
pletely surrounded by C, but within the range of an acceptor wave function
(peak B). (b) Surface-sensitive Cu2p3/2 absorption spectra recorded in the
electron yield detection mode.
143702-3 Kapilashrami et al. J. Appl. Phys. 116, 143702 (2014)
[This article is copyrighted as indicated in the article. Reuse of AIP content is subject to the terms at: http://scitation.aip.org/termsconditions. Downloaded to ] IP:
72.33.42.248 On: Wed, 08 Oct 2014 16:28:06

again, respectively, for conventional XPS with h�¼ 1.5 keV.
Thus, HXPS with excitation energy of h�¼ 5 keV permitted
penetrating the 7 nm CIGS overlayer and probing the valence
band offset at the CIGS/Diamond interface. This information
depth is comparable to that with total electron yield detection
in XAS. We have also measured the energy levels of
H-terminated diamond as a reference, including its work func-
tion. The latter was obtained from the low energy cutoff of the
photoelectron spectrum using a �10 V sample bias. The result-
ing work function of 4.97 eV is smaller than the band gap of
5.47 eV (Ref. 23) which is consistent with the negative
electron affinity of H-terminated diamond.24,25
III. RESULTS FROM XAS
X-ray absorption spectroscopy provides information
about the unoccupied states, i.e., the conduction bands of di-
amond and CIGS. These complement the HXPS results for
the occupied states. Figure 3(a) presents the C K-edge
absorption spectrum of diamond in the CIGS/Diamond sam-
ple, which reflects the onset of the C1s! 2p transitions. The
excitonic peak (Eexciton) at 289.0–289.1 eV (Refs. 15, 26, 27)
is shifted down from the CBM by the binding energy of the
C1s core exciton in diamond, which is 0.19 eV.26 That places
the conduction band minimum of diamond (CBMdiamond) at
289.2–289.3 eV. Additional features in Fig. 3(a), labeled A
and B (at 282.31 eV and 283.85 eV), originate from unoccu-
pied states in the band gap that arise as a result of boron dop-
ing. They represent transitions from the C1s core level to the
B acceptor level, which lies 0.37 eV above the VBM of dia-
mond.28 The upper peak matches the position of the B
FIG. 4. XPS spectra of the CIGS/Diamond heterojunction (blue), together with bulk CIGS (black) and H-terminated diamond (red) reference samples. (a)
Valence bands of reference samples. (b) C 1s (red: H-terminated diamond, blue: CIGS/diamond). (c) Cu 2p3/2 (black: CIGS, blue: CIGS/Diamond). (d)
Valence band maximum of the bulk CIGS reference sample with linear extrapolation (gray). (e) Valence band maximum of the H-terminated diamond refer-
ence sample matched to the spectral function from a GW calculation (gray). All energies have been referenced to the Fermi level EF via an Au sample.
FIG. 5. Energy band diagram representing the interface between CIGS and
p-doped diamond. It lists the data obtained from our HXPS, XAS, and
quantum efficiency measurements, together with literature values for bulk
semiconductor properties (in red). The construction of this diagram from
the energy differences (1)–(8) is explained in the text. It proceeds from
right to left, starting with the energy levels of bulk diamond (1)–(3) and
proceeding through the interface (4) to the CIGS levels (5) –(8). All ener-
gies are referenced to the Fermi level, which remains constant throughout
the interface in thermal equilibrium.
143702-4 Kapilashrami et al. J. Appl. Phys. 116, 143702 (2014)
[This article is copyrighted as indicated in the article. Reuse of AIP content is subject to the terms at: http://scitation.aip.org/termsconditions. Downloaded to ] IP:
72.33.42.248 On: Wed, 08 Oct 2014 16:28:06
acceptor level quite well. The lower energy peak has been
assigned to transitions from C atoms adjacent to a B dop-
ant.15,29,30 Their C1s level is shifted to lower binding energy
by electron transfer from the more electropositive B. The in-
tensity ratio between peaks A and B can be rationalized by
comparing the number of C atoms inside the Bohr radius of
the acceptor wave function (the final state of the optical tran-
sition) with the number of C atoms adjacent to a B impurity.
Additional contributions might come from interstitial B sites
at high doping. These have been discussed in the literature,
but have not been observed in core level spectroscopy
(see Ref. 31 and references therein).
Figure 3(b) presents the Cu L3-edge absorption spectrum
of the CIGS overlayer on diamond. It is used to obtain the
conduction band minimum of CIGS via linear extrapolation
of the L3 edge, following previous work.9–11 For our CIGS
film, the CBM is reached at 933.17 eV. To obtain the posi-
tion of the CBM relative to the Fermi level (CBM–EF), we
subtract the Cu2p3/2 core level binding energy obtained by
HXPS. By subtracting the optical band gap from (CBM–EF),
one obtains the position of the VBM relative to EF
(VBM–EF). The details of this procedure, together with the
influence of the electron-hole interaction, are discussed with
Figure 5 (Step 7).
IV. RESULTS FROM HXPS
HXPS offers a direct route to determine the valence
band discontinuity or band offset at the CIGS/Diamond het-
erojunction, through the measurement of core level binding
energies and valence-band maxima in the heterojunction
and the two pure reference materials in each layer, origi-
nally developed with excitation in the conventional XPS
energy regime of 1.5 keV that is less depth penetrating.32
This method assumes a constant position of the VBM rela-
tive to a given core level in both the heterojunction and the
reference materials. More specifically, the valence band
maxima relative to EF of the H-terminated diamond, and
CIGS reference samples have been determined by HXPS,
see Fig. 4 and Table I. In addition, core-levels representa-
tive of elements belonging exclusively to CIGS-Cu2p3/2
and diamond-C1s have been measured with respect to
EF for the reference CIGS and H-terminated diamond sam-
ples and for the CIGS/Diamond heterojunction sample
(Figs. 4(b) and 4(c)).
Once the valence band maxima of the two reference
samples CIGS and H-terminated diamond (Figs. 4(d) and
4(e)), respectively, and the core-levels of the reference sam-
ples and of the heterojunction have been measured (Table I),
Eq. (2) provides a direct path for the determination of the
VBO in the CIGS/Diamond sample32
DEVBOðCIGS=DiamondÞ ¼ ½ðECu2p3=2 � EVBMÞCIGS
� ðEC1s � EVBMÞDiamond�� ðECu2p3=2 � EC1sÞCIGS=Diamond: (2)
DEVBO(CIGS/Diamond) is the valence band offset of the
H-terminated diamond relative to the top CIGS layer.
The valence band offset at the CIGS/Diamond hetero-
junction is an important parameter to characterize the
energy levels of the proposed three-layer structure as
discussed above. It is worthwhile to consider the terms of
Eq. (2) and how accurately they can be measured. The core-
levels can be accurately determined by fitting them with the
Voigt function to obtain the peak positions, after subtract-
ing the much-used Shirley background (Table I). More
challenging is the accurate determination of the VBM. In
the past decades, a few methods have been proposed. For
example, Kraut et al. proposed to fit the XPS spectrum in
the vicinity of the valence-band edge and determining
EVBM using a theoretical model, where the photoemission
spectrum is assumed to be proportional to a broadened
valence-band density of states (VB DOS) obtained from
band structure calculations.33 On the other hand, Chambers
et al.34 observed that the method of Grant et al. in Ref. 33
results in significant inaccuracies for VBM of complex ox-
ide materials. They proposed fitting both the onset of the
experimental spectrum near the valence band edge and the
background noise (dark counts) to straight lines and then
determining EVBM from the intersection of these two lines.
While this method is very simple to use and does not
require the calculation of a theoretical VB DOS, its validity
depends on the assumption of a linear VB DOS in the
vicinity of EVBM.
The method of Chambers et al. has been used to
determine the VBM of the bulk CIGS reference
(VBMCIGS¼ 0.31 6 0.1 eV), Fig. 4(d).34 However, neither
this method nor that of Kraus et al. was able to provide an
accurate VBM value of the H-terminated diamond, which
has a decidedly non-linear variation near maximum and an
electronic structure whose band structure is not adequately
described by simple local-density calculations. We have thus
gone beyond this model to determine the valence band
maximum of H-terminated diamond using the ab-initioGW-method35 based on quantum-mechanical many-body
perturbation theory as implemented in the BerkeleyGW
package,36 which has been shown to provide a highly accu-
rate description of the diamond band structure and
bandgap.35,37 A detailed discussion of the VBM determina-
tion in a system such as diamond with mixed valence band
states (C2s and C2p) and showing a strong dependence of
their orbital cross-section as a function of the excitation
energy is reported elsewhere.37 The fit of the GW-method
curve to the measured H-terminated diamond valence band
edge gives a VBM¼ 0.45 6 0.2 eV, as shown in Fig. 4(e).
The VBO at the interface between diamond (bottom
layer) and CIGS (top layer) is determined from the HXPS
data in Table I via Eq. (2): VBOCIGS/Diamond¼ (VBMCIGS –
VBMdiamond)¼ 0.27 6 0.2 eV. The VBM of CIGS lies some-
what higher than the VBM of diamond at the interface and
thus creates a shallow barrier for electron donation from dia-
mond. The VBMs at the interface can be determined from
those of the reference samples by taking the difference of the
core level energies into account, using the following equa-
tions. These reflect the fact that the energy difference
between the VBM and a core level is not affected by band
bending or surface termination
143702-5 Kapilashrami et al. J. Appl. Phys. 116, 143702 (2014)
[This article is copyrighted as indicated in the article. Reuse of AIP content is subject to the terms at: http://scitation.aip.org/termsconditions. Downloaded to ] IP:
72.33.42.248 On: Wed, 08 Oct 2014 16:28:06

VBMInterfaceDiamond¼ðC1sÞCIGS=Diamond�ðC1s�VBMÞDiamond
VBMInterfaceCIGS ¼ðCu2p3=2ÞCIGS=Diamond�ðCu2p3=2�VBMÞCIGS:
(3)
The upper equation will also be used in Sec. V to increase
the accuracy of the VBM of diamond by using an accurate
literature value for (C1s � VBM)Diamond.
V. COMBINATION OF XAS, HXPS, AND OTHERAVAILABLE DATA
In order to obtain the most complete and accurate results
possible, we have combined our own data from XAS, HXPS,
and quantum efficiency measurements with literature values
and our computed GW values for bulk energy levels of
diamond, such as the band gap Eg, (EF – VBM), and
(VBM�C1s). The resulting band diagram in Fig. 5 is con-
structed from the right side (bulk diamond) to the left (bulk
CIGS) in 8 steps, which are explained in detail below the fig-
ure. We begin with two accurately known properties of bulk
diamond, the band gap of 5.47 eV and the position of the
VBM relative to the Fermi level EF (which can be calculated
accurately from bulk electrical properties versus temperature
and B doping). Since EF remains constant throughout the
interface in thermal equilibrium, it becomes the natural refer-
ence level. Relative to EF, the band edges and core levels ex-
hibit band bending near the interface due to the electrostatic
potential in the space charge region. To track the movement
of the broad VBM through the band bending region, we use
the sharp C1s core level, as quantified in Eq. (3). This can be
done, since the energy difference (VBM–C1s) is a basic elec-
tronic structure property of bulk diamond that is not affected
by band bending or surface termination. The most accurate
determination of (VBM–C1s) from the literature is combined
with the energy of the C1s level at the interface, as measured
by HXPS. Next, we move further to the left in Fig. 5 across the
interface into the CIGS film. HXPS and XAS probe both the
bulk and the two surfaces of the thin CIGS film, such that the
resulting energies represent an average across the film. The
VBM in CIGS is well-pronounced in HXPS and can be
obtained relative to EF from the data in Fig. 4(a). Adding the
band gap obtained from the quantum efficiency spectrum in
Fig. 2 gives the CBM in CIGS. The result for the CBM of
CIGS can be cross-checked by using the onset of the conduc-
tion band transitions in the Cu2p3/2 XAS spectrum of Fig. 3
and subtracting the HXPS binding energy of the Cu2p3/2 core
level in Fig. 4(c). The CBM value is extracted from the onset
of the Cu2p3/2 XAS by linear extrapolation, using a previously
established method.9–11 Finally, one can take the electron affin-
ity of CIGS from the literature36 to assign a vacuum level Evac
to the CIGS film.
The energy level diagram in Fig. 5 originates from a va-
riety of measurements in order to obtain the highest possible
accuracy and to estimate the error bars by cross-checks
between several methods. Energies are given with two deci-
mals (where available) in order to avoid rounding errors
when adding or subtracting multiple energies. The following
sequence of steps establishes the diagram:
(1) The band gap of diamond (5.47 eV) is obtained from
Clark et al.,23 see also Bandis and Pate.39 Notice that
there are two opposing effects shifting the onset of the
optical absorption. The valence exciton binding energy
of 70–80 meV lowers the threshold, and the excitation of
a phonon required by the indirect band gap increases the
threshold by 83 meV and 160 meV (for TA and TO pho-
nons, respectively). At room temperature, one has also
phonon absorption, which lowers the threshold.
(2) The bulk Fermi level in highly doped diamond lies
slightly below the B acceptor level, which is 0.37 eV
above the VBM.28 For our doping level of about
1020 cm�3, the calculation by Diederich et al.25 gives
(EF � VBM)¼ 0.25 eV.
(3) The energy difference (VBM–C1s) is a key quantity
characteristic of bulk diamond. It is independent of the
surface termination, Fermi level pinning, and band bend-
ing, since it is determined by the C-C interaction. Here,
we discuss three methods to obtain this quantity. Their
comparison allows an estimate of the accuracy.
The most accurate method starts with the sharp negative
electron affinity peak (0.5 eV FWHM) which is observed in
the secondary electron spectrum of H-terminated dia-
mond.24,25 It represents electrons piled up at the CBM. The
energy of this peak was combined with the C1s level
measured for the same sample by Morar et al.26 to give
(CBM–C1s)¼ 289.20 eV. Subtracting the band gap of 5.47
eV (Ref. 23) from step (1) gives (VBM–C1s)¼ (CBM–C1s)
� Eg¼ 283.73 eV.
A second method uses the difference between the onset
of the valence band and the C1s peak obtained from HXPS.
This method suffers from the low intensity and slow onset of
the valence band maximum (several eV wide), particularly at
high photon energies (Fig. 4(e)). The combination of HXPS
with GW calculations in Fig. 4 minimizes these uncertainties
and gives (VBM–C1s)¼ 284.19 eV–0.45 eV¼ 283.74 eV for
H-terminated diamond (Table I). An earlier XPS result by Shi
et al.40 gave (VBM–C1s)¼ 284.90 eV � 1.32 eV¼ 283.58 eV,
but this work employed a lower excitation energy of �1.5 keV
and a less accurate method to obtain the VBM (linear extrapo-
lation of the leading edge spectra to the baseline).
A third method starts with the C1s exciton peak
observed in XAS at 289.0 eV by Morar et al.26 This value is
consistent with our result of 289.0 eV and the recent value of
289.1 eV obtained by Zegkinoglou et al.15 within the error
bar of 60.1 eV for the absolute energy calibration in XAS.
After adding the exciton binding energy of 0.19 eV (Ref. 26)
to obtain the CBM and subtracting the band gap of 5.47 eV
(Ref. 23), we obtain (VBM–C1s)¼ 283.7 eV 6 0.1 eV.
Overall, the values obtained for (VBM–C1s) in diamond
from the three methods range from 283.58 eV to 283.8 eV,
with 283.73 6 0.1 eV as the most accurate value.
(4) The energy difference (EF – C1s)¼ 284.24 eV at the
CIGS/Diamond interface is obtained from our HXPS
results in Fig. 4 and Table I. Subtracting the best value
of (VBM–C1s)¼ 283.73 eV obtained in step (3) gives
(EF–VBM)¼ 0.51 eV at the interface. Comparing this
with the bulk value of (EF–VBM)¼ 0.25 eV from step
143702-6 Kapilashrami et al. J. Appl. Phys. 116, 143702 (2014)
[This article is copyrighted as indicated in the article. Reuse of AIP content is subject to the terms at: http://scitation.aip.org/termsconditions. Downloaded to ] IP:
72.33.42.248 On: Wed, 08 Oct 2014 16:28:06

(2) gives a band bending of 0.26 eV. Notice that this
value is a lower limit, obtained with the assumption that
the HXPS escape depth is small compared to the width
of the band bending region.
(5) The energy differences (EF–Cu2p3/2)¼ 932.22 eV and
(EF–VBM)¼ 0.23 eV for CIGS/Diamond are obtained
from our HXPS results in Fig. 4 and Table I. These are
averaged over the thickness of the CIGS film by HXPS.
Comparing the values of (EF–VBM) at both sides of the
CIGS/Diamond interface from steps (4) and (5), one obtains
a valence band offset (VBMCIGS – VBMdiamond)¼ (0.51 eV
� 0.23 eV)¼ 0.28 eV, with the VBM of CIGS lying higher.
The offset to the bulk valence band of diamond is (0.25 eV
� 0.23 eV)¼ 0.02 eV using (2).
(6) The CIGS band gap Eg¼ 1.4 eV is obtained from the
quantum efficiency measurement in Fig. 2(a). By adding
it to the VBM from step (5) (0.23 eV below EF for CIGS/
Diamond), one obtains the CBM in CIGS/Diamond at
1.17 eV above EF.
(7) The CBM in CIGS/Diamond can be obtained independ-
ently by combining HXPS with XAS at the Cu2p3/2
edge. This yields a lower limit of the energy difference
(CBM–Cu2p3/2) 933.17 eV for CIGS/Diamond is
obtained from our XAS in Fig. 3, using linear extrapola-
tion towards the onset and assuming that the electron-
hole interaction is negligible. Compare similar results
and extrapolation methods in B€ar et al.,9 Johnson
et al.,10 and B€ar et al.11 Combining this result with (EF
–Cu2p3/2)¼ 932.22 eV for CIGS/Diamond from step (5)
gives (CBM–EF) 0.95 eV. With Eg from step (7), we
obtain (EF–VBM) 0.45 eV in CIGS. This value is less
accurate that the result of 0.23 eV obtained directly from
HXPS in step (3). It involves several measurements
(XAS, HXPS, and quantum efficiency), and the XAS
result for the CBM of CIGS may be affected by electron-
hole-interaction. In that case, the actual CBM would lie
higher above EF, and the VBM would be closer to EF.
An electron-hole interaction of 0.22 eV would bring the
two measurements into agreement.
(8) The vacuum level of CIGS is obtained by adding the
electron affinity of CIGS (4.5 eV) from Hossain et al.38
to the CBM from step (6).
VI. CONCLUSIONS
In summary, we have determined the energy level dia-
gram for a CIGS absorber combined with a diamond donor
using a variety of techniques that are cross-checked against
each other to obtain the most reliable results. The valence
band maximum of CIGS lies very close to that of bulk dia-
mond (within our error bar of 60.1 eV), as required for refill-
ing the photogenerated holes in the CIGS absorber via the
diamond film. That provides a good starting point for opti-
mizing the band offset. However, the band bending at the
interface still creates a barrier of 0.3 eV at the interface,
which would need to be overcome by sufficiently high dop-
ing. This seems possible, as boron-doped diamond can
actually be doped high enough to become metallic and even
superconducting.41 One could also push the valence band
maximum of the absorber film a few tens of an eV lower to
ensure that the photo-generated holes are refilled quickly
enough to prevent recombination with photogenerated elec-
trons. For example, substitution of Se with S lowers the
VBM in CIGS. Overall, our findings are of generic interest
for new solar cell designs involving transparent electron do-
nor and acceptor materials.
ACKNOWLEDGMENTS
This work was supported by the Department of Energy,
Basic Energy Sciences, under Contract Nos. DE-
SC0006931, DE-AC02-05CH11231 (ALS), and DE-FG02-
01ER45917 (end station). The authors thank Dr. Lyuba
Belova and Dr. Anastasia Riazanova at Royal Institute of
Technology for their timely help with high-resolution
electron microscopy studies on the morphology of the CIGS
samples. G.C, S.N., C.S.C., and C.F. also acknowledge the
support of the Department of Energy, Basic Energy
Sciences, under Contract DE-AC02-05CH11231, via the
Lawrence Berkeley National Laboratory Materials Sciences
Division. R.J.H. and L.Z. acknowledge the National Science
Foundation DMR-1207281 (diamond sample preparation).
Theoretical studies were supported by the SciDAC Program
on Excited State Phenomena in Energy Materials funded by
the U. S. Department of Energy, Basic Energy Sciences and
Advanced Scientific Computing Research, under Contract
No. DE-AC02-05CH11231 at the Lawrence Berkeley
National Laboratory (GW quasiparticle computations and
algorithm and code development), and by the National
Science Foundation under grant DMR10-1006184 (basic
theory and analysis). C.S.F. is also grateful for support from
the APTCOM Project of the Triangle de Physique, Paris.
1A chart of solar cell efficiencies is given by NREL at http://www.nrel.gov/
ncpv/images/efficiency_chart.jpg.2F. J. Himpsel, P. L. Cook, G. de la Torre, J. M. Garcia-Lastra, R.
Gonzalez-Moreno, J.-H. Guo, R. J. Hamers, C. X. Kronawitter, P. S.
Johnson, J. E. Ortega, D. Pickup, M.-E. Ragoussi, C. Rogero, A. Rubio, R.
E. Ruther, L. Vayssieres, W. Yang, and I. Zegkinoglou, J. Electron
Spectrosc. Relat. Phenom. 190, 2 (2013).3P. Jackson, D. Hariskos, E. Lotter, S. Paetel, R. Wuerz, R. Menner, W.
Wischmann, and M. Powalla, Prog. Photovoltaics 19, 894 (2011).4I. Repins, M. A. Contreras, B. Egaas, C. DeHart, J. Scharf, C. L. Perkins,
B. To, and R. Noufi, Prog. Photovoltaics 16, 235 (2008).5M. Kapilashrami, C. X. Kronawitter, T. T€orndahl, J. Lindahl, A. Hultqvist,
W.-C. Wang, C.-L. Chang, S. S. Mao, and J.-H. Guo, Phys. Chem. Chem.
Phys. 14, 10154 (2012).6K. Orgassa, H. W. Schock, and J. H. Werner, Thin Solid Films 387, 431
(2003).7L. Weinhardt, O. Fuchs, A. Peter, E. Umbach, C. Heske, J. Reichardt, M.
B€ar, I. Lauermann, I. K€otschau, A. Grimm, S. Sokoll, M. Ch. Lux-Steiner,
T. P. Niesen, S. Visbeck, and F. Karg, J. Chem. Phys. 124, 074705 (2006).8M. B€ar, S. Nishiwaki, L. Weinhardt, S. Pookpanratana, W. N. Shafarman,
and C. Heske, Appl. Phys. Lett. 93, 042110 (2008).9M. B€ar, L. Weinhardt, S. Pookpanratana, C. Heske, S. Nishiwaki, W.
Shafarman, O. Fuchs, M. Blum, W. Yang, and J. D. Denlinger, Appl.
Phys. Lett. 93, 244103 (2008).10B. Johnson, J. Klaer, S. Merdes, M. Gorgoi, B. H€opfner, A. Vollmer, and
I. Lauermann, J. Electron. Spectrosc. Relat. Phenom. 190, 42 (2013).11M. B€ar, S. Pookpanratana, L. Weinhardt, R. G. Wilks, B. A. Schubert,
B. Marsen, T. Unold, M. Blum, S. Krause, Y. Zhang, A. Ranasinghe, K.
Ramanathan, I. Repins, M. A. Contreras, S. Nishiwaki, X. Liu, N. R.
Paudel, O. Fuchs, T. P. Niesen, W. Yang, F. Karg, A. D. Compaan, W. N.
Shafarman, R. Noufi, H.-W. Schock, and C. Heske, J. Electron. Spectrosc.
Relat. Phenom. 190, 47 (2013).
143702-7 Kapilashrami et al. J. Appl. Phys. 116, 143702 (2014)
[This article is copyrighted as indicated in the article. Reuse of AIP content is subject to the terms at: http://scitation.aip.org/termsconditions. Downloaded to ] IP:
72.33.42.248 On: Wed, 08 Oct 2014 16:28:06
12A. Kraft, Int. J. Electrochem. Sci. 2, 355 (2007).13D. M. Gruen, A. R. Krauss, C. D. Zuiker, R. Csencsits, L. J. Terminello, J.
A. Carlisle, I. Jimenez, D. G. J. Sutherland, D. K. Shuh, W. Tong, and F. J.
Himpsel, Appl. Phys. Lett. 68, 1640 (1996).14W. S. Yeap, X. Liu, D. Bevk, L. Lutsen, M. Fahlman, W. Maes, and K.
Haenen, ACS Appl. Mater. Interfaces 6, 10322 (2014).15I. Zegkinoglou, P. L. Cook, P. S. Johnson, W. Yang, J.-H. Guo, D.
Pickup, R. Gonzalez-Moreno, C. Rogero, R. E. Ruther, M. L. Rigsby, J.
E. Ortega, R. J. Hamers, and F. J. Himpsel, J. Phys. Chem. C 116, 13877
(2012).16T. Strother, T. Knickerbocker, J. N. Russell, Jr., J. E. Butler, L. M. Smith,
and R. J. Hamers, Langmuir 18, 968 (2002).17J. Lindahl, U. Zimmermann, P. Szaniawski, T. Torndahl, A. Hultqvist, P.
Salom, C. Platzer-Bjorkman, and M. Edoff, IEEE J. Photovoltaics 3(3),
1100 (2013).18M. I. Alonso, M. Garriga, C. A. Durante Rincon, E. Hern�andez, and M.
Leon, Appl. Phys. A 74, 659 (2002).19P. L. Cook, W. Yang, X. Liu, J. M. Garc�ıa-Lastra, A. Rubio, and F. J.
Himpsel, J. Chem. Phys. 134, 204707 (2011).20E. J. Mele and J. J. Ritsko, Phys. Rev. Lett. 43, 68 (1979).21E. A. Kraut, R. W. Grant, J. R. Waldrop, and S. P. Kowalczyk, Phys. Rev.
B 28, 1965 (1983).22S. Tanuma, C. J. Powell, and D. R. Penn, Surf. Int. Anal. 20, 77 (1993).23C. D. Clark, P. J. Dean, and P. V. Harris, Proc. R. Soc. London, Ser. A
277, 312 (1964).24F. J. Himpsel, J. A. Knapp, J. A. Van Vechten, and D. E. Eastman, Phys.
Rev. B 20, 624 (1979).25L. Diederich, O. M. Kuttel, P. Aebi, and L. Schlapbach, Surf. Sci. 418,
219 (1998).26J. F. Morar, F. J. Himpsel, G. Hollinger, G. Hughes, and J. L. Jordan,
Phys. Rev. Lett. 54, 1960 (1985).27P. E. Batson and J. Bruley, Phys. Rev. Lett. 67, 350 (1991).28A. T. Collins and A. W. S. J. Williams, Physica C 13, 1789 (1971); B.
Massarani and J. C. Bourgoin, Phys. Rev. B 17, 1758 (1978); J. C.
Bourgoin, J. Krynicki, and B. Blanchar, Phys. Status Solidi A 52, 293
(1979).29J. Nakamura, N. Yamada, K. Kuroki, T. Oguchi, K. Okada, Y. Takano, M.
Nagao, I. Sakaguchi, T. Takenouchi, H. Kawarada, R. C. C. Perera, and D.
L. Ederer, J. Phys. Soc. Jpn. 77, 054711 (2008).30P.-A. Glans, T. Learmonth, K. E. Smith, S. Ferro, A. De Battisti, M.
Mattesini, R. Ahuja, and J.-H. Guo, Appl. Phys. Lett. 102, 162103 (2013).31Y. Kato, F. Matsui, T. Shimizu, H. Daimon, T. Matsushita, and F. Z. Guo,
Appl. Phys. Lett. 91, 251914 (2007).32S. A. Chambers, Y. Liang, Z. Yu, R. Droopad, J. Ramdani, and K.
Eisenbeiseret, Appl. Phys. Lett. 77, 1662 (2000).33R. W. Grant, J. R. Waldrop, and E. A. Kraut, J. Vac. Sci. Tec. 15, 1451
(1978); E. A. Kraut, R. W. Grant, J. R. Waldrop, and S. P. Eowalczyk,
Phys. Rev. Lett. 44, 1620 (1980).34S. A. Chambers, T. Droubay, T. C. Kaspar, and M. Gutowski, J. Vac. Sci.
Technol. B 22, 2205 (2004).35M. S. Hybertsen and S. G. Louie, Phys. Rev. B 34, 5390 (1986).36J. Deslippe, G. Samsonidze, M. Jain, M. L. Cohen, and S. G. Louie,
Comput. Phys. Commun. 183, 1269 (2012).37J. Lischner, S. Nemsak, G. Conti, G. K. Palsson, A. Hloskovsky, W.
Drube, C. Fadley, and S. G. Louie, “Accurate determination of the valence
band edge in hard x-ray photoemission spectra by means of GW theory”
(unpublished).38M. I. Hossain, P. Chelvanathan, M. Zaman, M. R. Karim, M. A. Alghoul,
and N. Amin, Chalcogenide Lett. 8(5), 315 (2011).39C. Bandis and B. B. Pate, Phys. Rev. Lett. 74, 777 (1995); Phys. Rev. B
52, 12056 (1995).40K. Shi, X. L. Liu, D. B. Li, J. Wang, H. P. Song, X. Q. Xu, H. Y. Wei, C.
M. Jiao, S. Y. Yang, H. Song, Q. S. Zhu, and Z. G. Wang, Appl. Surf. Sci.
257, 8110 (2011).41K. Ishizaka, R. Eguchi, S. Tsuda, A. Chainani, T. Yokoya, T. Kiss, T.
Shimojima, T. Togashi, S. Watanabe, C.-T. Chen, Y. Takano, M. Nagao,
I. Sakaguchi, T. Takenouchi, H. Kawarada, and S. Shin, Phys. Rev. Lett.
100, 166402 (2008).
143702-8 Kapilashrami et al. J. Appl. Phys. 116, 143702 (2014)
[This article is copyrighted as indicated in the article. Reuse of AIP content is subject to the terms at: http://scitation.aip.org/termsconditions. Downloaded to ] IP:
72.33.42.248 On: Wed, 08 Oct 2014 16:28:06