arnold/soerjomataram chances – draft 1 - queen's ... · web view... neuhouser ml, nisar mi,...
TRANSCRIPT

Comparison of general obesity and measures of body fat distribution in older adults in relation to
cancer risk: meta-analysis of individual participant data of seven prospective cohorts in Europe
Running title: Obesity, body fat distribution, cancer risk
Heinz Freisling1, Melina Arnold2, Isabelle Soerjomataram2, Mark George O’Doherty3, José Manuel
Ordonez-Mena4,5,6, Christina Bamia7,8, Ellen Kampman9, Michael Leitzmann10, Isabelle Romieu1, Frank
Kee3, Konstantinos Tsilidis7,11,12, Anne Tjønneland13, Antonia Trichopoulou7,8, Paolo Boffetta7,14, Vassiliki
Benetou7,8, H.B(as). Bueno-de-Mesquita12,15,16, José María Huerta17,18, Hermann Brenner5,19,20, Tom
Wilsgaard21, Mazda Jenab1
1 Section of Nutrition and Metabolism, International Agency for Research on Cancer (IARC-WHO), 150
Cours Albert Thomas, 69008 Lyon, France
2 Section of Cancer Surveillance, International Agency for Research on Cancer (IARC-WHO), 150 Cours
Albert Thomas, 69008 Lyon, France
3 UKCRC Centre of Excellence for Public Health, School of Medicine, Dentistry and Biomedical
Sciences, Queen’s University Belfast, University Road, Belfast, BT7 1NN, Northern Ireland, UK
4 Network Aging Research (NAR), Heidelberg University, Bergheimer Straße 20, 69115 Heidelberg,
Germany
5 Division of Clinical Epidemiology and Aging Research, German Cancer Research Center (DKFZ), Im
Neuenheimer Feld 581, 69120 Heidelberg, Germany
6 Nuffield Department of Primary Care Health Sciences, University of Oxford, Woodstock Rd, Oxford
OX2 6GG, UK
7 Hellenic Health Foundation, 13 Kaisareias & Alexandroupoleos, Athens 115 27, Greece
8 WHO Collaborating Center for Nutrition and Health, Unit of Nutritional Epidemiology and Nutrition in
Public Health, Dept. of Hygiene, Epidemiology and Medical Statistics, Medical School, National and
Kapodistrian University of Athens, Mikras Asias 75, Athens 115 27, Greece
9 Department Agrotechnology and Food Sciences, Division of Human Nutrition, Wageningen University,
PO Box 17, 6700AA Wageningen, The Netherlands
10 Department of Epidemiology and Preventive Medicine, University of Regensburg, Franz-Josef-Strauß-
Allee 11, 93053 Regensburg, Germany
11 Department of Hygiene and Epidemiology, University of Ioannina School of Medicine, University
Campus, 45110 Ioannina, Greece
1
1
2
3
4
5
6
7
8
9
10
11
12
13
14
15
16
17
18
19
20
21
22
23
24
25
26
27
28
29
30
31
32
33

12 Department of Epidemiology and Biostatistics, The School of Public Health, Imperial College
London, South Kensington Campus, London SW7 2AZ, UK
13 Danish Cancer Society Research Center, Strandboulevarden 49, DK 2100 Copenhagen Ø Denmark
14 Icahn School of Medicine at Mount Sinai, 1 Gustave L. Levy Place, New York, NY 10029-5674,
USA
15 Department for Determinants of Chronic Diseases (DCD), National Institute for Public Health and the
Environment (RIVM), P.O. Box 1, 3720 BA Bilthoven, The Netherlands
16 Department of Social & Preventive Medicine, Faculty of Medicine, University of Malaya, 50603
Kuala Lumpur, Malaysia
17 Department of Epidemiology, Murcia Regional Health Council, IMIB-Arrixaca, Ronda de Levante,
11, 30008, Murcia, Spain
18 CIBER Epidemiología y Salud Pública (CIBERESP), Melchor Fernández Almagro, 3-5, Madrid
28029, Spain
19 Division of Preventive Oncology, German Cancer Research Center (DKFZ) and National Center for
Tumor Diseases (NCT), Im Neuenheimer Feld 581, 69120 Heidelberg, Germany
20 German Cancer Consortium (DKTK), German Cancer Research Center (DKFZ), Im Neuenheimer
Feld 581, 69120 Heidelberg, Germany
21 Department of Community Medicine, UiT The Arctic University of Norway, 9037 Tromsø, Norway
Correspondence to:
Heinz Freisling, PhD
Section of Nutrition and Metabolism
International Agency for Research on Cancer (IARC-WHO)
150 cours Albert Thomas
69008 Lyon
FRANCE
Phone: +33 (0)4 7273 8664
Mail: [email protected]
2
34
35
36
37
38
39
40
41
42
43
44
45
46
47
48
49
50
51
52
53
54
55
56
57
58
59
60
61
62
63
64
65
ABSTRACT
Background: We evaluated the associations of anthropometric indicators of general obesity (body mass
index, BMI), an established risk factor of various cancer, and body fat distribution (waist circumference,
WC; hip circumference, HC; and waist-to-hip ratio, WHR), which may better reflect metabolic
complications of obesity, with total obesity-related and site-specific (colorectal and postmenopausal
breast) cancer incidence.
Methods: This is a meta-analysis of seven prospective cohort studies participating in the CHANCES
consortium including 18,668 men and 24,751 women with a mean age of 62 and 63 years respectively.
Harmonized individual participant data from all seven cohorts were analysed separately and alternatively
for each anthropometric indicator using multivariable Cox proportional hazards models.
Results: After a median follow-up period of 12 years, 1,656 first incident obesity-related cancers [defined
as postmenopausal female breast, colorectum, lower oesophagus, cardia stomach, liver, gallbladder,
pancreas, endometrium, ovary, and kidney] had occurred in men and women. In the meta-analysis of all
studies, associations between indicators of adiposity, per standard deviation (SD) increment, and risk for
all obesity-related cancers combined yielded the following summary hazard ratios: 1.11 (95 % CI 1.02-
1.21) for BMI, 1.13 (95 % CI 1.04-1.23) for WC, 1.09 (95 % CI 0.98-1.21) for HC, and 1.15 (95 % CI
1.00-1.32) for WHR. Increases in risk for colorectal cancer were 16%, 21%, 15%, and 20%, respectively
per SD of BMI, WC, HC, and WHR. Effect modification by hormone therapy (HT) use was observed for
postmenopausal breast cancer (P-interaction<0.001), where never HT users showed an approximately 20%
increased risk per SD of BMI, WC, and HC compared to ever users.
Conclusions: BMI, WC, HC, and WHR show comparable positive associations with obesity-related
cancers combined and with colorectal cancer in older adults. For postmenopausal breast cancer we report
evidence for effect modification by HT use.
Keywords: CHANCES consortium; Ageing; Cohort; Obesity; Body fat distribution, Cancer; Prevention
3
66
67
68
69
70
71
72
73
74
75
76
77
78
79
80
81
82
83
84
85
86
87
88
89
90

INTRODUCTION
The proportion of overweight (body mass index, BMI>25 kg/m2) or obese (BMI>30 kg/m2) adults
worldwide increased substantially between 1980 and 2013 (NCD Risk Factor Collaboration, 2016), with
parallel increases in children and adolescents (Ng et al, 2014). Obesity prevalence reaches its peak
between age 55 and 60 years in men with ~25% being obese in high-income countries and about 5 years
later in women with ~30% being obese (Ng et al, 2014). This may have substantial implications for risk
of subsequent cancer development, particularly in older adults (60+ years) considering that they are the
fastest growing demographic group in most high-income countries.
It is well established that a high BMI is associated with an increased risk of a large number of
non-communicable diseases, including cancer. Excess body fatness, as defined by high BMI, has been
convincingly linked to an increased risk of eleven different cancer types, including cancer of the
oesophagus (adenocarcinoma), gastric cardia, colorectum (CRC, colorectal cancer), gallbladder, pancreas,
liver, breast (postmenopausal), ovary, endometrium, kidney and prostate (advanced stage) (World Cancer
Research Fund / American Institute for Cancer Research, 2007; Renehan et al, 2008; Bhaskaran et al,
2014). An up-dated IARC consensus review also judged the strength of evidence sufficient for thyroid,
meningioma, and multiple myeloma (Lauby-Secretan et al, 2016). These cancers alone comprise about
50% of the total global burden of cancer (based on GLOBOCAN 2012 data) (Arnold et al, 2016b).
However, there are uncertainties with regard to how well BMI captures the complex biology
underlying associations between adiposity and cancer risk (Renehan et al, 2015). This is relevant to the
development of cancer prevention strategies because it is increasingly recognized that a proportion of
overweight or obese individuals – as defined by a high BMI – might not be at an increased risk for
metabolic complications of obesity and its consequences such as cancer (Renehan et al, 2015). Waist
circumference (WC) and waist-to-hip ratio (WHR) are therefore often used in epidemiological and
clinical settings as a means of quantifying body fat distribution indicating central adiposity (National
Heart, Lung, 1998; Hu, 2008), and they are thought to be superior predictors of risk of cancer
development, at least for the colon and postmenopausal breast (Moore et al, 2004; Pischon et al, 2006;
4
91
92
93
94
95
96
97
98
99
100
101
102
103
104
105
106
107
108
109
110
111
112
113
114
115
116

White et al, 2015). Moreover, a greater hip circumference (HC), after controlling for WC and/or BMI,
may be associated with reduced risks of coronary heart disease, type 2 diabetes, and mortality (Heitmann
& Lissner, 2011; Cameron et al, 2013), but its relation to cancer risk has been fully explored in only a few
recent studies (Keimling et al, 2013; Steffen et al, 2015), where either no association was found for risk
of colon cancer with and without adjustment for BMI (Keimling et al, 2013) or inverse associations with
risk of oesophageal adenocarcinoma after adjustment for WC (Steffen et al, 2015). Strictly speaking, HC
is not a measure of central adiposity, but of fat accumulated in the lower part of the body (such as the hips
and thighs) (Hu, 2008). Together, the evidence that measures of body fat distribution or central adiposity
are better predictors of cancer risk than BMI is inconsistent. Also, only a few prospective studies
comparing different measures of adiposity were carried out in adults aged 60 years and above.
Our primary objective was to derive standardized risk estimates for anthropometric measures of
general adiposity (BMI) and body fat distribution (WC, HC, and WHR) and their association with
‘obesity-related’ cancers combined (i.e. cancer sites with convincing evidence of a positive association
with greater body fatness) as well as CRC and (postmenopausal) breast cancer in a large population of
older adults from Europe. Secondary objectives were to examine the shape of the dose–response
relationships and to evaluate potential effect modification by sex, smoking status, use of hormone therapy
(HT), and interaction between measures of body fat distribution and general adiposity.
METHODS
Study population. The Consortium on Health and Ageing: Network of Cohorts in Europe and the
United States (CHANCES) project (www.chancesfp7.eu) is a multi-country study which aims to
harmonize data from ongoing prospective cohort studies in Europe and North-America (Boffetta et al,
2014).
The following CHANCES cohorts provided data for the current analysis: the study centers in
Denmark, Greece, the Netherlands, and Spain of EPIC-Elderly, which is a subset of the European
Prospective Investigation into Cancer and Nutrition (EPIC) project that consists of participants aged 60
5
117
118
119
120
121
122
123
124
125
126
127
128
129
130
131
132
133
134
135
136
137
138
139
140
141
142

years or older at recruitment; the Epidemiological Study on Chances for Prevention, Early Detection, and
Optimized THERapy of Chronic Diseases at Old Age (ESTHER), a population-based cohort covering the
entire federal state of Saarland in Germany, aged 50 or older at recruitment; the PRIME Belfast study,
which is a cohort of male residents aged 50-60 years of Belfast and the surrounding area in the United
Kingdom; and the Tromsø study, which recruited men and women in Norway between 1994 and 1995 (4 th
wave) aged 50-84 years. Other CHANCES cohorts either decided not to participate in this analysis or
could not provide cancer incidence data. The participating cohorts’ key characteristics are summarized in
Table 1. Additional information on the individual cohorts has been given previously (Boffetta et al,
2014). We followed similar inclusion and exclusion criteria, which are displayed in Figure 1, as in a
companion paper on overweight duration and risk of cancer (Arnold et al, 2016a). Further to the
exclusions shown in Figure 1, we excluded participants with an implausible BMI below 15 or above 45
kg/m2 from the analysis.
All CHANCES cohort studies are conducted in accordance with the Declaration of Helsinki. For
each study, investigators satisfied the local requirements for ethical research, including obtaining
informed consent from participants.
Outcomes. Incident cancer cases were identified through linkage to cancer registries (EPIC
Netherlands, EPIC Denmark, Tromsø) or through self-reports that were confirmed by medical records
and/or pathology reports (ESTHER, PRIME Belfast) or both (EPIC Spain, EPIC Greece). All analyses
were conducted for cancer sites with convincing evidence of a positive association with greater body
fatness (World Cancer Research Fund / American Institute for Cancer Research, 2007; Renehan et al,
2008; Lauby-Secretan et al, 2016). We examined first invasive breast cancer (ICD-O-3 C50) at
postmenopausal ages, CRC (C18-21), and the combination of the two in conjunction with ‘other obesity-
related cancers’ that included cancer of the lower oesophagus (C15.5, as a proxy for oesophageal
adenocarcinoma in the absence of histological data), gastric cardia (C16.0), liver (C22), gallbladder
(C23), pancreas (C25), endometrium (C54), ovary (C56) and kidney (C64), together labeled as ‘obesity-
6
143
144
145
146
147
148
149
150
151
152
153
154
155
156
157
158
159
160
161
162
163
164
165
166
167
168

related cancers’. Advanced prostate cancer was not included because we lacked information on tumor
stage. Also, thyroid, meningioma, and multiple myeloma (Lauby-Secretan et al, 2016) were not included
due to very small numbers of incident cases and inconsistencies in the available data across cohorts.
Small numbers precluded the possibility of performing separate analyses of each obesity-related cancer
site.
Anthropometric assessment. In all cohorts except ESTHER, height and weight were measured by
trained personnel at baseline. In the ESTHER cohort, height and weight were self-reported by the study
participants.
Waist and hip circumference were measured by trained personnel in all cohorts except ESTHER,
where these measures were not assessed; the narrowest torso circumference (natural waist) or midway
between the lowest rib and iliac crest was used for the waist measurement, while the widest
circumference or maximum circumference over the buttocks was used for the hip measurement. The
majority of cohorts reported that participants were asked to remove any heavy outer garments (light
clothing or underwear only allowed) for the anthropometric measurements. In ESTHER, data on WC or
HC were not collected at baseline.
Covariate assessment. Age, sex, smoking status, physical activity, alcohol consumption, and HT
use in women were collected in all cohorts following standardized procedures and a posteriori
harmonized within the CHANCES project (Boffetta et al, 2014). All covariates except alcohol
consumption (continuous, g/day) were modelled categorically: (daily) smoking status (never daily
smoker; former daily smoker; current daily smoker; unknown), (vigorous) physical activity (yes; no;
unknown) defined according to the CHANCES harmonization rules as ‘performing intense exercise at
least once a week’, level of education attained (primary or less; more than primary but less than college or
university; college or university; unknown), current use (or history) of HT in women (ever; never;
unknown).
7
169
170
171
172
173
174
175
176
177
178
179
180
181
182
183
184
185
186
187
188
189
190
191
192
193
194

Statistical analysis. Cox proportional hazard models with age as the time metric were used to
estimate hazard ratios (HR) and 95% confidence intervals (CI) for the relation between four obesity
indicators and the risk of developing (1) ‘obesity-related cancers’, (2) CRC, (3) postmenopausal breast
cancer, and (4) ‘other obesity-related cancers’ in each of the included cohorts. All obesity indicators were
treated as continuous covariates; BMI was examined as a measure of overall adiposity, whereas WC, HC,
and WHR were examined as measures of body fat distribution. For comparability between the four
obesity indicators, we calculated the HR and their CI per 1-standard deviation (SD) increment of each
indicator (Keimling et al, 2013). The relationships between anthropometric measures were evaluated
using Pearson correlation coefficients (Supplementary Table S1).
Subjects were censored at age of study exit (death, lost to follow-up, any cancer diagnosis other
than cancers considered as outcomes in this study, and end of follow-up), whichever occurred first.
For all outcomes, three models with different sets of adjustments were fitted. Model 1 included
each of the anthropometric measures alternatively, stratified by age (1-y categories) and sex, and adjusted
for height (except the model for BMI). Model 2 (main model) extended Model 1 by further adjusting for
smoking status, alcohol consumption, level of educational attainment, physical activity, and recruitment
year. Missing values in any of the categorical covariates were included as a separate category. Model 3
was based as model 2, but with mutual adjustment for all anthropometric measures using residuals of
WC, HC, and WHR (Roswall et al, 2014).
All Cox models were fitted for each study separately (EPIC-Elderly was sub-divided into study-
centers/countries) giving a study-level risk per 1-SD increment and the results of models 2 and 3 were
then combined using DerSimonian and Laird random-effect meta-analysis (Harris et al, 2008). The
heterogeneity of associations across studies was expressed by I2 (Higgins & Thompson, 2002).
The proportional hazard assumptions in the study-specific analysis were assessed by visual
inspection of log-log plots and by statistical tests using Schoenfeld residuals. Because the proportional
hazards were unlikely for sex and age, we stratified Cox models by sex and age (in 1-y categories).
8
195
196
197
198
199
200
201
202
203
204
205
206
207
208
209
210
211
212
213
214
215
216
217
218
219
Exclusion of individuals with missing data on smoking, education or physical activity gave virtually the
same results.
To directly compare cancer risk discrimination between the four obesity indicators, we used
respective predictions from Cox models (model 2, pooling all cohorts) to assess discrimination by
Harrell’s C-index (Collaboration TFS, 2009).
For analyses addressing the impact of effect modification, we pooled all cohorts into one dataset,
and additionally stratified all Cox models by study. To investigate potential non-linear dose-response
associations between the four obesity indicators and cancer risks, we used three-knot restricted cubic
spline models at Harrell’s default percentiles (i.e. 10th, 50th, and 90th) in combination with a Wald-type test
to evaluate the linearity hypothesis (Orsini & Greenland, 2011).
We tested a priori for potential interactions between the four adiposity indicators and for effect
modification of the studied associations by smoking status and HT use using likelihood ratio tests. Since
Cox-models were stratified by sex and age, no formal tests for interaction by sex or age were performed.
All statistical tests were two-sided and P-values were considered statistically significant at the
0.05 level. All statistical analyses were performed using Stata 12.1 (College Station, Texas, USA).
RESULTS
In total, 43,419 participants were included in this study, with 1,656 obesity-related cancer cases
occurring during a median follow-up time of 12 years, which ranged between 10.4 years in Germany
(ESTHER) and 18.0 years in Northern Ireland (PRIME Belfast) (Table 1). Study participants were
recruited between 1991 and 2003, with a mean age at study entry ranging from 54 years in Northern
Ireland to 67 years in Greece (EPIC-Greece). The prevalence of obesity (BMI>30 kg/m 2) at recruitment
was lowest in Northern Ireland with 11% and highest in participants from Spain with 42%.
Meta-analysis of adiposity measures and risk of cancer. In the meta-analysis of all studies, BMI,
WC, and WHR were significantly associated with an increased risk of ‘obesity-related cancers’; the HRs
9
220
221
222
223
224
225
226
227
228
229
230
231
232
233
234
235
236
237
238
239
240
241
242
243
244
245

per 1-SD increment in BMI, WC, and WHR were 1.11 (95% CI: 1.02-1.21), 1.13 (95% CI: 1.04-1.23),
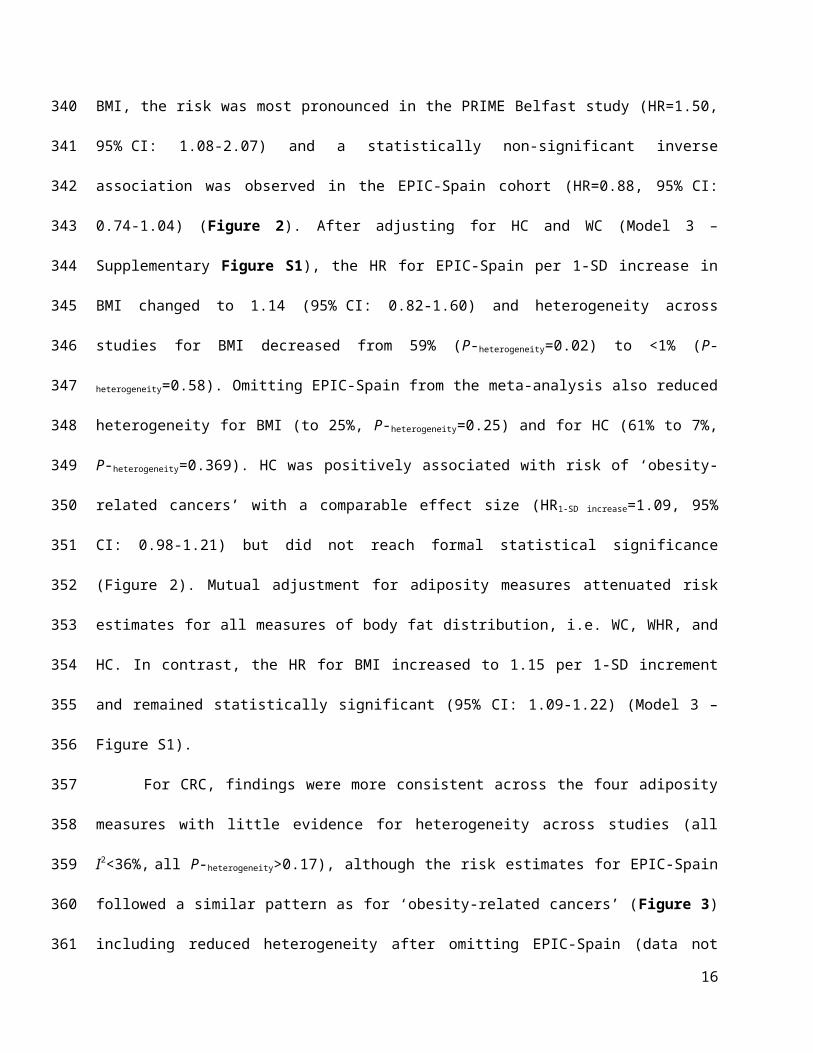
and 1.15 (95% CI: 1.00-1.32), respectively. For BMI, the risk was most pronounced in the PRIME Belfast
study (HR=1.50, 95% CI: 1.08-2.07) and a statistically non-significant inverse association was observed
in the EPIC-Spain cohort (HR=0.88, 95% CI: 0.74-1.04) (Figure 2). After adjusting for HC and WC
(Model 3 – Supplementary Figure S1), the HR for EPIC-Spain per 1-SD increase in BMI changed to 1.14
(95% CI: 0.82-1.60) and heterogeneity across studies for BMI decreased from 59% (P-heterogeneity=0.02) to
<1% (P-heterogeneity=0.58). Omitting EPIC-Spain from the meta-analysis also reduced heterogeneity for BMI
(to 25%, P-heterogeneity=0.25) and for HC (61% to 7%, P-heterogeneity=0.369). HC was positively associated with
risk of ‘obesity-related cancers’ with a comparable effect size (HR1-SD increase=1.09, 95% CI: 0.98-1.21) but
did not reach formal statistical significance (Figure 2). Mutual adjustment for adiposity measures
attenuated risk estimates for all measures of body fat distribution, i.e. WC, WHR, and HC. In contrast, the
HR for BMI increased to 1.15 per 1-SD increment and remained statistically significant (95% CI: 1.09-
1.22) (Model 3 – Figure S1).
For CRC, findings were more consistent across the four adiposity measures with little evidence
for heterogeneity across studies (all I2<36%, all P-heterogeneity>0.17), although the risk estimates for EPIC-
Spain followed a similar pattern as for ‘obesity-related cancers’ (Figure 3) including reduced
heterogeneity after omitting EPIC-Spain (data not shown). Effect sizes for CRC were in general higher
with strongest associations observed for WC (HR1-SD increase=1.21, 95% CI: 1.08-1.35) and the weakest for
HC (HR1-SD increase=1.15, 95% CI: 1.01-1.32). After mutual adjustment for adiposity measures, only BMI
remained a significant risk factor of CRC (HR1-SD increase=1.19, 95% CI: 1.08-1.31) (Figure S1).
For postmenopausal breast cancer, a significant positive association was observed with BMI but
only after additional adjustment for HC and WC (model 3) with a HR per 1-SD increase in BMI of 1.15
(95% CI: 1.03-1.27) (Figure S1). Associations with other measures of adiposity were non-significant
although effect sizes were comparable, except for WHR (Figure 4). In addition, heterogeneity across
studies was high for relative risks associated with WHR (I2 = 66%, P-heterogeneity=0.02) and did not change
after excluding EPIC-Spain.
10
246
247
248
249
250
251
252
253
254
255
256
257
258
259
260
261
262
263
264
265
266
267
268
269
270
271
WHR was strongest and most consistently associated with ‘other obesity-related cancers’ (i.e. lower
oesophagus, gastric cardia, liver, gallbladder, pancreas, endometrium, ovary, and kidney) with a HR per
1-SD increase of 1.20 (95% CI: 1.04-1.38) (Figure 5). All other obesity-measures were non-significant.
After mutual adjustment for adiposity measures, WC was also independently associated with ‘other
obesity-related cancers’ (HR1-SD increase=1.15, 95% CI: 1.03-1.28) (Figure S1), while the association with
WHR was marginally attenuated.
All estimates for the association between the four adiposity measures by cancer site and cohort,
and the pooled estimates for the different models are presented in Supplementary Table S2.
Dose-response associations. After pooling all cohorts into one dataset, clear linear dose-response
associations were found between all adiposity measures and ‘obesity-related cancers’, except for WHR
(P-non-linear=0.02), where an increased cancer risk became apparent only at values >0.96 of the WHR
(Supplementary Figure S2). For CRC, linear dose-response associations were observed for all four
adiposity measures (Figure S2). For postmenopausal breast and ‘other obesity-related cancers’, dose-
response relationships were inconsistent across the four obesity measures and linearity largely statistically
insignificant (Supplementary Figure S3). These findings were confirmed when analyzing BMI and WC
in pre-defined categories (Supplementary Table S6)
Direct comparisons between anthropometric indicators. C-indices for WC, HC, and WHR were
marginally and non-significantly lower than for BMI in predicting risk of ‘obesity-related cancers’, CRC,
postmenopausal breast cancer (range of C-index differences to BMI: -0.01 to -0.02) and vice versa for
‘other obesity-related cancers’(range of C-index differences to BMI: 0.02 to 0.03) (Table 2). Compared
to a null model including all confounding variables but none of the four anthropometric indicators, adding
BMI, WC, HC, and WHR separately or jointly resulted in virtually similar model fit as evaluated by AIC
(Table 2).
11
272
273
274
275
276
277
278
279
280
281
282
283
284
285
286
287
288
289
290
291
292
293
294
295
296
297

Effect modification by sex, smoking, HT use, and weight status. After stratification by sex, the
risks for ‘obesity-related cancers’ associated with BMI and WC were comparable between men and
women (Supplementary Table S3). However, HC yielded higher risk estimates in women for ‘obesity-
related cancers’ and CRC. On the other hand, WHR yielded higher risk estimates in men compared to
women for ‘obesity-related cancers’, CRC, and ‘other obesity-related cancers’. Some of these sex-specific
differences became more pronounced or only apparent after mutual adjustment for adiposity measures
(Model 3) (Table S3).
Some variability in risk estimates was observed across smoking categories (Supplementary Table
S4). However, formal tests for effect modification were only significant for associations between HC and
CRC (P-interaction=0.02) with a significantly increased risk observed in never smokers (HR1-SD increase=1.33,
95% CI: 1.16-1.54).
For postmenopausal breast cancer, significantly increased risks were observed in women who
never used HT, with similar effect sizes of ~20% increased risk per 1-SD increase of BMI, WC, and HC
(P-interaction<0.001) (Model 2, Supplementary Table S5).
No significant interactions between measures of body fat distribution (i.e. WC, HC, and WHR) and
World Health Organizations’ BMI categories (normal weight: BMI <25 kg/m2, overweight: BMI ≥25 to
<30 kg/m2, obesity: BMI ≥30 kg/m2) in relation to ‘obesity-related cancers’ and CRC or postmenopausal
breast cancer were observed (data not shown). A borderline significant interaction for associations
between WC and CRC across categories of BMI was observed (P-interaction=0.07) showing a significantly
increased risk of CRC (HR1-SD increase=1.52, 95% CI: 1.20-1.92) in the overweight category.
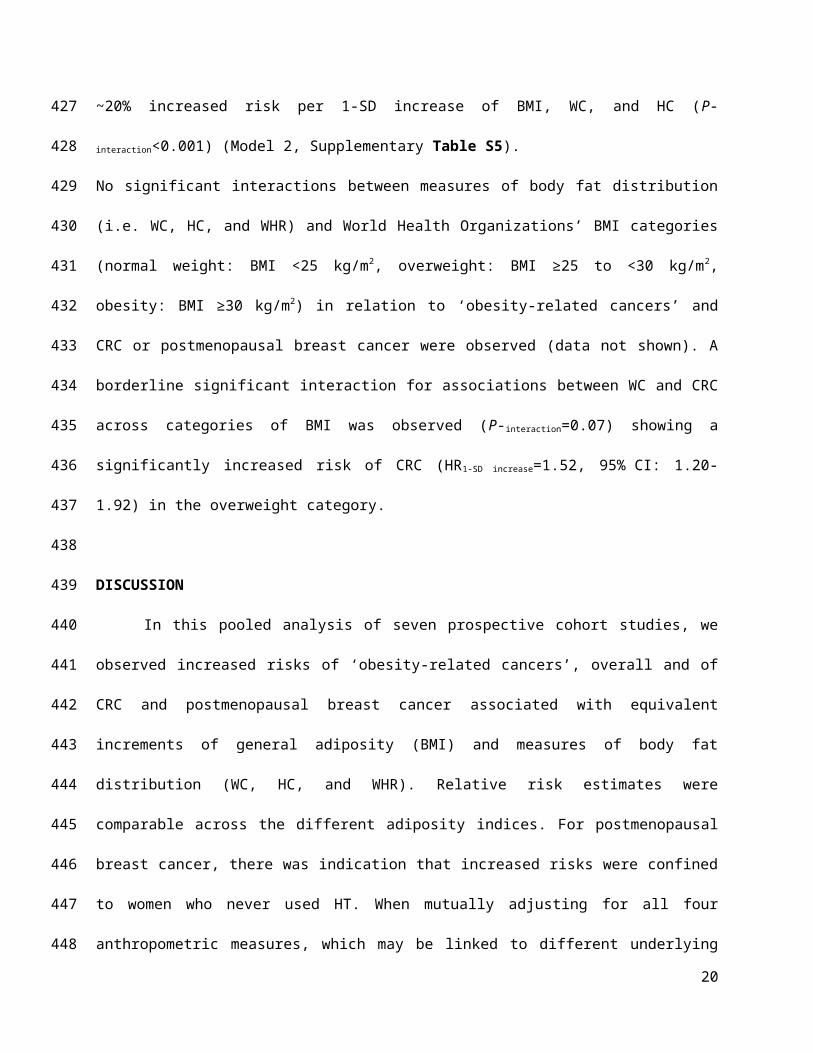
DISCUSSION
In this pooled analysis of seven prospective cohort studies, we observed increased risks of
‘obesity-related cancers’, overall and of CRC and postmenopausal breast cancer associated with
equivalent increments of general adiposity (BMI) and measures of body fat distribution (WC, HC, and
WHR). Relative risk estimates were comparable across the different adiposity indices. For
12
298
299
300
301
302
303
304
305
306
307
308
309
310
311
312
313
314
315
316
317
318
319
320
321
322
323

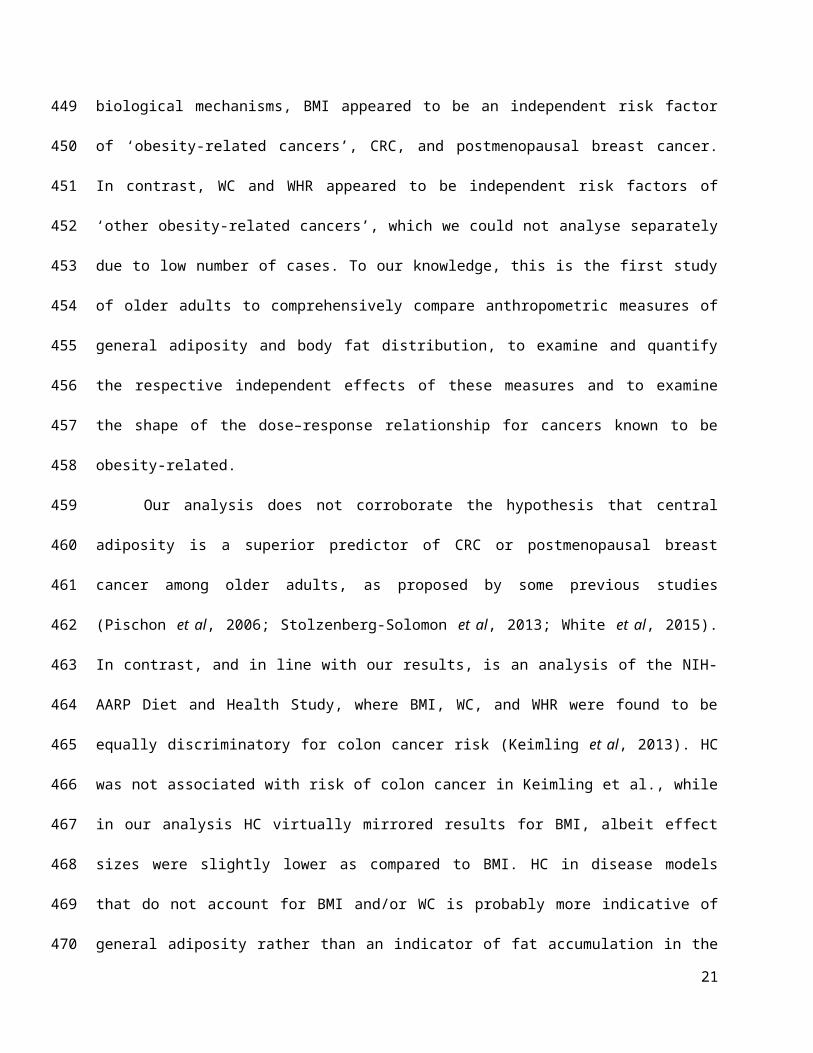
postmenopausal breast cancer, there was indication that increased risks were confined to women who
never used HT. When mutually adjusting for all four anthropometric measures, which may be linked to
different underlying biological mechanisms, BMI appeared to be an independent risk factor of ‘obesity-
related cancers’, CRC, and postmenopausal breast cancer. In contrast, WC and WHR appeared to be
independent risk factors of ‘other obesity-related cancers’, which we could not analyse separately due to
low number of cases. To our knowledge, this is the first study of older adults to comprehensively compare
anthropometric measures of general adiposity and body fat distribution, to examine and quantify the
respective independent effects of these measures and to examine the shape of the dose–response
relationship for cancers known to be obesity-related.
Our analysis does not corroborate the hypothesis that central adiposity is a superior predictor of
CRC or postmenopausal breast cancer among older adults, as proposed by some previous studies (Pischon
et al, 2006; Stolzenberg-Solomon et al, 2013; White et al, 2015). In contrast, and in line with our results,
is an analysis of the NIH-AARP Diet and Health Study, where BMI, WC, and WHR were found to be
equally discriminatory for colon cancer risk (Keimling et al, 2013). HC was not associated with risk of
colon cancer in Keimling et al., while in our analysis HC virtually mirrored results for BMI, albeit effect
sizes were slightly lower as compared to BMI. HC in disease models that do not account for BMI and/or
WC is probably more indicative of general adiposity rather than an indicator of fat accumulation in the
lower extremities reflected by a high correlation between HC and BMI (Pearson correlation ~0.8 in our
data). Mutual adjustment of obesity indicators may reduce heterogeneity across studies as observed in our
data. This could indicate that BMI does not capture general adiposity equally well in all White Caucasians
and that holding WC and HC constant, improves the interpretation of BMI as a measure of general
adiposity.
Furthermore, in the Cancer Prevention Study-II Nutrition Cohort, positive associations between
WC and BMI and postmenopausal breast cancer risk were reported, but only the association with BMI
remained significant after mutual adjustment (Gaudet et al, 2014).
13
324
325
326
327
328
329
330
331
332
333
334
335
336
337
338
339
340
341
342
343
344
345
346
347
348

For postmenopausal breast cancer, early results from the Iowa Women Health Study suggested a
statistically significant multiplicative interaction between BMI and WHR (Folsom et al, 2000). However,
in subsequent reports that specifically tested interactions between BMI and indicators of central adiposity
in relation to risk of CRC (Keimling et al, 2013) and breast cancer (Gaudet et al, 2015), no statistically
significant associations were found. Our findings are in line with these more recent reports in that we did
not find statistically significant multiplicative interactions between BMI and any of the three measures of
body fat distribution.
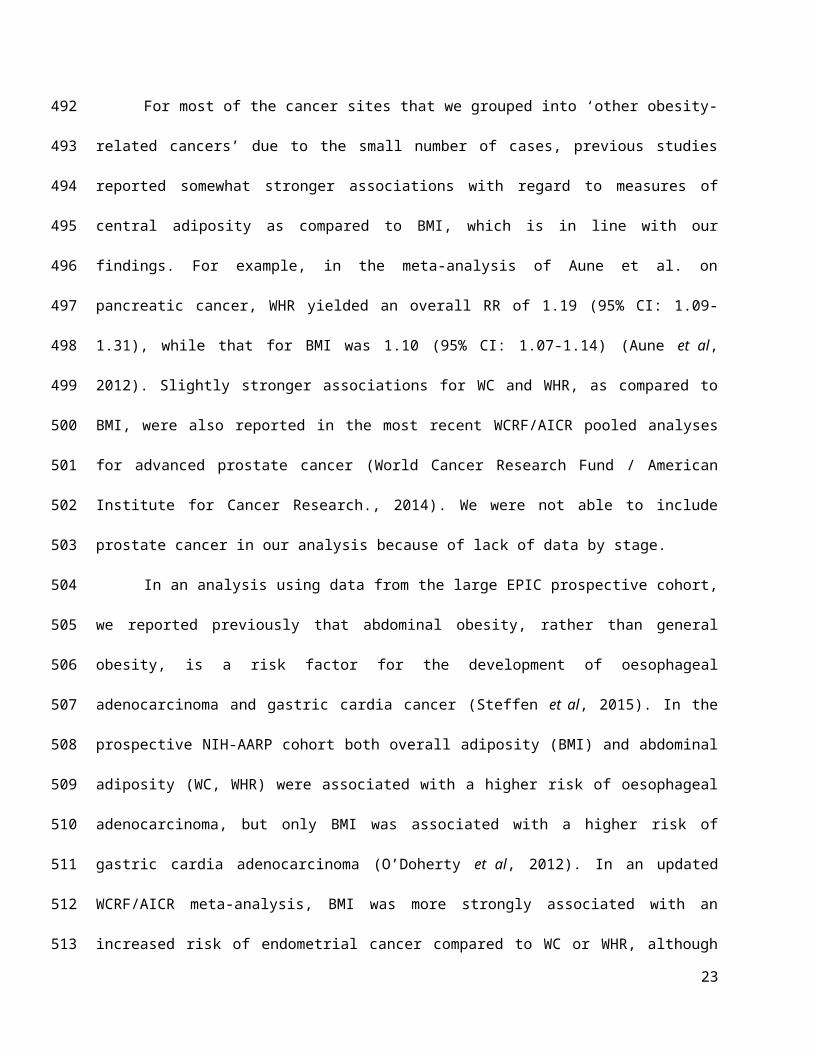
For most of the cancer sites that we grouped into ‘other obesity-related cancers’ due to the small
number of cases, previous studies reported somewhat stronger associations with regard to measures of
central adiposity as compared to BMI, which is in line with our findings. For example, in the meta-
analysis of Aune et al. on pancreatic cancer, WHR yielded an overall RR of 1.19 (95% CI: 1.09-1.31),
while that for BMI was 1.10 (95% CI: 1.07-1.14) (Aune et al, 2012). Slightly stronger associations for
WC and WHR, as compared to BMI, were also reported in the most recent WCRF/AICR pooled analyses
for advanced prostate cancer (World Cancer Research Fund / American Institute for Cancer Research.,
2014). We were not able to include prostate cancer in our analysis because of lack of data by stage.
In an analysis using data from the large EPIC prospective cohort, we reported previously that
abdominal obesity, rather than general obesity, is a risk factor for the development of oesophageal
adenocarcinoma and gastric cardia cancer (Steffen et al, 2015). In the prospective NIH-AARP cohort
both overall adiposity (BMI) and abdominal adiposity (WC, WHR) were associated with a higher risk of
oesophageal adenocarcinoma, but only BMI was associated with a higher risk of gastric cardia
adenocarcinoma (O’Doherty et al, 2012). In an updated WCRF/AICR meta-analysis, BMI was more
strongly associated with an increased risk of endometrial cancer compared to WC or WHR, although WC
was also associated with an increased risk (Aune et al, 2015b). Similarly, an increased risk of ovarian
cancer was reported with greater BMI and a marginally significant positive association with WC, but no
association was found for HC or WHR (Aune et al, 2015a). We are not aware of studies investigating the
role of body fat distribution and risk of cancers of the liver and gallbladder. The evidence with regard to
14
349
350
351
352
353
354
355
356
357
358
359
360
361
362
363
364
365
366
367
368
369
370
371
372
373
374
BMI was judged convincing for both of these cancer sites by the most recent WCRF/AICR pooled
analyses (World Cancer Research Fund / American Institute for Cancer Research., 2015a, 2015b). For
these last two cancer sites, further assessment of the impact of body fat distribution in future studies is
warranted.
Although WC and WHR (and HC as noted above) have been interpreted as measures of body fat
distribution, they may well also be markers of general adiposity (Anderson et al, 2014). In the current
study, we saw that these measures have associations with cancer that are similar to those for BMI, but
mostly when used in separate models. However, few studies have conducted mutual adjustments between
BMI and measures of body fat distribution to try to clarify their independent roles. This is a limitation,
which needs further assessment in future studies because it may provide insight into the biologic
mechanisms underlying observed associations between adiposity and cancer risk (Keimling et al, 2013).
Ideally, for mutual adjustment of BMI and measures of body fat distribution, residuals of measures of
WC and/or HC should be used in order to retain the interpretability of BMI as an indicator of general
adiposity and to avoid potential problems of multi-collinearity. Otherwise, BMI is not easily interpretable
or becomes an indicator of muscularity rather than adiposity (Hu, 2008). It is also of note that WC, HC,
and WHR have larger measurement errors compared with measurement of BMI, which may affect the
reliability of respective risk estimates and calls for additional caution when comparing results between
these indicators.
Links between greater adiposity and increased risk of many cancers are biologically plausible
considering that obesity is related to a vast array of metabolic and physiological dysfunctions (Park et al,
2014). A number of these altered processes have specifically been implicated in cancer development;
notably (1) abnormalities of insulin resistance and the IGF-I system; described as the insulin-IGF-I-
insulin pathway, which may promote tumor development at many anatomic sites (Park et al, 2014;
Renehan et al, 2015); 2) the impact of adiposity on the biosynthesis and bioavailability of endogenous sex
steroids (e.g., oestradiol) which applies predominantly, but not exclusively, to postmenopausal breast,
endometrial and ovarian cancers (Park et al, 2014; Renehan et al, 2015); our findings that obesity-
15
375
376
377
378
379
380
381
382
383
384
385
386
387
388
389
390
391
392
393
394
395
396
397
398
399
400
associated risk of postmenopausal breast cancer was strongest in women, who never used HT support that
hypothesis 3) obesity induced low-grade chronic systemic inflammation; and 4) alterations in the levels of
adipocyte-derived factors, known as adipokines (Lee et al, 2015). All of these proposed pathways have
been extensively investigated in mechanistic studies and tested in epidemiological settings. For example,
adiponectin, one of the most abundant adipokines, has been shown to be a key mediator in the
development of several types of obesity-related cancers including endometrial, breast, advanced prostate,
CRC, renal, and pancreatic (Dalamaga et al, 2012). Unlike most of the other adipose tissue derived
adipokines, serum adiponectin is reduced in obesity and correlates inversely with BMI, WC, HC, and
WHR, independently of age and menopausal status (Dalamaga et al, 2012). Migrating adipose progenitor
cells, which can be found in high concentration in white adipose tissue and may acquire a tumor-
promoting function, and the gut microbiome are two emerging mechanistic hypotheses linking obesity
with cancer risk (Renehan et al, 2015).
Our study has some limitations that may affect the interpretation of the results. Despite the
pooling of seven cohorts, we were not able to compare adiposity measures across all anatomical cancer
sites with strong evidence of an association with obesity because of low numbers of cases. These cancer
sites were therefore combined in ‘other obesity-related cancers’. For this reason, we could not investigate
whether one or several of these cancers may have driven the observed associations with WC and WHR.
Also related to the low number of cases, we were not able to sub-divide CRC in its anatomical sub-sites –
knowing that effects sizes are more pronounced for cancers of the colon as compared to the rectum
(World Cancer Research Fund / American Institute for Cancer Research., 2011) – or to sub-divide breast
cancer by receptor status. However, associations with BMI appear to be unrelated to receptor status in
postmenopausal women who have never used HT (Renehan et al, 2015).
Further limitations of our study are related to differences in study design between cohorts,
including differences in length of follow-up and assessment of several covariates. In order to harmonize
the data and variable definitions across cohorts, some covariates such as physical activity were only
available in binary form (yes/no). Despite adjustment for the main confounding factors, namely smoking
16
401
402
403
404
405
406
407
408
409
410
411
412
413
414
415
416
417
418
419
420
421
422
423
424
425
426

and physical activity, we cannot rule out confounding by other unmeasured factors, most importantly
reproductive factors and diet. As these were not consistently available from all cohorts, we were not able
to take these into account in our analyses. However, we don’t expect risk estimates being noticeably
confounded by diet as has been shown previously (Renehan et al, 2012). In the ESTHER study, BMI
based on self-reported height and weight was the only adiposity indicator available. Although self-
reported BMI may grossly under-estimate prevalence of adiposity at the population level, ranking of
individuals according to their BMI is less affected (Hu, 2008). Furthermore, study-specific risk estimates
for ESTHER were consistent with the other cohorts and the summary estimates; excluding ESTHER from
the meta-analysis had virtually no effect on the summary estimates (data not shown). Keeping ESTHER
in our analysis also facilitates comparison of results with our companion paper, where we investigated the
impact of overweight duration on obesity-related cancers (Arnold et al, 2016a). Finally, we did not a
priori stratify our analysis by sex, mainly due to sample size considerations. However, in secondary
analysis, largely similarly increased risks among men and women were observed for the investigated
adiposity indicators (Table S3).
Strengths of our study include the availability of harmonized individual-level data for the
estimation of cohort-specific risk estimates. This allowed us to use the same exposure definitions, disease
endpoints, and multivariate models in all included studies. Our investigation included only prospective
cohort studies, which reduces the potential of biases that are often reason for concern in retrospective
studies, e.g. recall and selection bias. Individuals within each of our cohorts were largely White
Caucasian, which adds further validity to our results because the effects of a given WC in a White
population may be very different to the same WC in an Asian or African-American population. However,
these potential ethic differences need to be evaluated in future studies. Further, we explored and
compared, to our knowledge for the first time in a pooled analysis of cohorts consisting of middle-aged
and older adults, non-linear associations between BMI, WC, HC, and WHR for cancer-sites known to be
adiposity-related.
17
427
428
429
430
431
432
433
434
435
436
437
438
439
440
441
442
443
444
445
446
447
448
449
450
451
452

Conclusions
General adiposity as measured by BMI and body fat distribution as measured by WC, HC or
WHR show comparable positive associations with obesity-related cancers combined, with CRC, and with
postmenopausal breast cancer. For postmenopausal breast cancer there was evidence for effect
modification by HT use which needs further exploration in other cohorts and populations. Avoiding
abdominal fatness may also be important for specific cancer sites, but requires further investigation.
Overall, our results underscore the importance of avoiding excess body fatness for cancer prevention
irrespective of age and gender.
18
453
454
455
456
457
458
459
460

Acknowledgements
Collaborators on behalf of the CHANCES consortium: Kari Kuulasmaa, Ben Schöttker, Ute Mons, Kai-Uwe
Saum, Bernd Holleczek, Alun Evans, John Yarnell.
Funding: Data used throughout the present study are derived from the CHANCES project. The project is
coordinated by the Hellenic Health Foundation, Greece. The project received funding by the FP7 framework
programme of DG-RESEARCH in the European Commission (grant agreement no. HEALTH-F3-2010-242244).
EPIC Greece: funded by the Hellenic Health Foundation. EPIC Netherlands: funded by European Commission (DG
SANCO); Dutch Ministry of Public Health, Welfare and Sports (VWS); The National Institute for Public Health and
the Environment; the Dutch Cancer Society, the Netherlands Organisation for Health Research and Development
(ZONMW); World Cancer Research Fund (WCRF). EPIC Spain: supported by Health Research Fund (FIS) of the
Spanish Ministry of Health RTICC ‘Red Temática de Investigación Cooperativa en Cáncer (grant numbers:
Rd06/0020/0091 and Rd12/0036/0018), Regional Governments of Andalucía, Asturias, Basque Country, Murcia
(project 6236), and Navarra, Instituto de Salud Carlos III, Redes de Investigacion Cooperativa (RD06/0020).
ESTHER: funded by the Baden-Württemberg state Ministry of Science, Research and Arts (Stuttgart, Germany), the
Federal Ministry of Education and Research (Berlin, Germany), and the Federal Ministry of Family Affairs, Senior
Citizens, Women and Youth (Berlin, Germany). PRIME Belfast: supported by grants from the Institut National de la
Santé et de la Recherche Médicale (INSERM), the Merck, Sharp & Dohme-Chibret Laboratory and the Northern
Ireland Health & Social Care Research and Development Office. Tromsø: funded by: UiT The Arctic University of
Norway, the National Screening Service, and the Research Council of Norway.
Conflict of Interest: The authors declare that they have no conflict of interest.
19
461462463464465466467468469470471472473474475476477478479480481482
483
REFERENCESAnderson AS, Key TJ, Norat T, Scoccianti C, Cecchini M, Berrino F, Boutron-Ruault MC, Espina C, Leitzmann M, Powers H, Wiseman M, Romieu I (2014) European code against cancer 4th edition: Obesity, body fatness and cancer. Cancer Epidemiol 39: S34–S45.
Arnold M, Freisling H, Stolzenberg-Solomon R, Kee F, O’Doherty MG, Ordóñez-Mena JM, Wilsgaard T, May AM, Bueno-de-Mesquita HB, Tjønneland A, Orfanos P, Trichopoulou A, Boffetta P, Bray F, Jenab M, Soerjomataram I, CHANCES consortium (2016a) Overweight duration in older adults and cancer risk: a study of cohorts in Europe and the United States. Eur J Epidemiol 31: 893–904.
Arnold M, Leitzmann M, Freisling H, Bray F, Romieu I, Renehan A, Soerjomataram I (2016b) Obesity and cancer: An update of the global impact. Cancer Epidemiol 41: 8–15.
Aune D, Greenwood DC, Chan DSM, Vieira R, Vieira AR, Navarro Rosenblatt DA, Cade JE, Burley VJ, Norat T (2012) Body mass index, abdominal fatness and pancreatic cancer risk: A systematic review and non-linear dose-response meta-analysis of prospective studies. Ann Oncol 23: 843–852.Aune D, Navarro Rosenblatt D a., Chan DSM, Abar L, Vingeliene S, Vieira AR, Greenwood DC, Norat T (2015a) Anthropometric factors and ovarian cancer risk: A systematic review and nonlinear dose-response meta-analysis of prospective studies. Int J Cancer 136: 1888–1898.
Aune D, Navarro Rosenblatt D a., Chan DSM, Vingeliene S, Abar L, Vieira a. R, Greenwood DC, Bandera E V., Norat T (2015b) Anthropometric factors and endometrial cancer risk: a systematic review and dose-response meta-analysis of prospective studies. Ann Oncol 26: 1635–1648.Bhaskaran K, Douglas I, Forbes H, Dos-Santos-Silva I, Leon D a., Smeeth L (2014) Body-mass index and risk of 22 specific cancers: a population-based cohort study of 5·24 million UK adults. Lancet 384: 755–765.
Boffetta P, Bobak M, Borsch-Supan A, Brenner H, Eriksson S, Grodstein F, Jansen E, Jenab M, Juerges H, Kampman E, Kee F, Kuulasmaa K, Park Y, Tjonneland A, van Duijn C, Wilsgaard T, Wolk A, Trichopoulos D, Bamia C, Trichopoulou A (2014) The Consortium on Health and Ageing: Network of Cohorts in Europe and the United States (CHANCES) project—design, population and data harmonization of a large-scale, international study. Eur J Epidemiol 29: 929–936.Cameron a. J, Magliano DJ, Söderberg S (2013) A systematic review of the impact of including both waist and hip circumference in risk models for cardiovascular diseases, diabetes and mortality. Obes Rev 14: 86–94.
Collaboration TFS (2009) Measures to assess the prognostic ability of the stratified Cox proportional hazardsmodel. Stat Med 28: 389–411.
Dalamaga M, Diakopoulos KN, Mantzoros CS (2012) The Role of Adiponectin in Cancer: A Review of Current Evidence. Endocr Rev 33: 547–594.
Folsom AR, Kushi LH, Anderson KE, Mink PJ, Olson JE, Hong C-P, Sellers TA, Lazovich D, Prineas RJ (2000) Associations of General and Abdominal Obesity With Multiple Health Outcomes in Older Women. Arch Intern Med 160: 2117–2128.Gaudet MM, Carter BD, Patel A V, Teras LR, Jacobs EJ, Gapstur SM (2014) Waist circumference, body mass index, and postmenopausal breast cancer incidence in the Cancer Prevention Study-II Nutrition Cohort. Cancer Causes Control 25: 737–745.
Gaudet MM, Kitahara CM, Newton CC, Bernstein L, Reynolds P, Weiderpass E, Kreimer a. R, Yang G, Adami H-O, Alavanja MC, Beane Freeman LE, Boeing H, Buring J, Chaturvedi a., Chen Y, D’Aloisio a. a., Freedman M, Gao Y-T, Gaziano JM, Giles GG, Hakansson N, Huang W-Y, Lee I-M, Linet MS, MacInnis RJ, Park Y, Prizment a., Purdue MP, Riboli E, Robien K, Sandler DP, Schairer C, Sesso HD, Ou Shu X, White E, Wolk a., Xiang Y-B, Zelenuich-Jacquotte a., Zheng W, Patel a. V., Hartge P,
20
484
485486487
488489490491
492493
494495496
497498499
500501502
503504505
506507508509510
511512513
514515
516517
518519520
521522523
524525526527528
Berrington de Gonzalez a., Gapstur SM (2015) Anthropometry and head and neck cancer:a pooled analysis of cohort data. Int J Epidemiol 673–681.
Harris RJ, Bradburn MJ, Deeks JJ, Altman DG, Harbord RM, Sterne J a C (2008) Metan: Fixed- and random-effects meta-analysis. Stata J 8: 3–28.
Heitmann BL, Lissner L (2011) Hip Hip Hurrah! Hip size inversely related to heart disease and total mortality. Obes Rev 12: 478–481.
Higgins JPT, Thompson SG (2002) Quantifying heterogeneity in a meta-analysis. Stat Med 1539–1558.Hu FB (2008) Obesity epidemiology (Oxford New York; Oxford University Press).
Keimling M, Renehan AG, Behrens G, Fischer B, Hollenbeck AR, Cross AJ, Leitzmann MF (2013) Comparison of Associations of Body Mass Index, Abdominal Adiposity, and Risk of Colorectal Cancer in a Large Prospective Cohort Study. Cancer Epidemiol Biomarkers Prev 22: 1383–1394.Lauby-Secretan B, Scoccianti C, Loomis D, Grosse Y, Bianchini F, Straif K (2016) Body Fatness and Cancer — Viewpoint of the IARC Working Group. N Engl J Med 375: 794–798.Lee CH, Woo YC, Wang Y, Yeung CY, Xu A, Lam KSL (2015) Obesity, adipokines and cancer: An update. Clin Endocrinol (Oxf) 83: 147–156.Moore LL, Bradlee ML, Singer MR, Splansky GL, Proctor MH, Ellison RC, Kreger BE (2004) BMI and waist circumference as predictors of lifetime colon cancer risk in Framingham Study adults. Int J Obes Relat Metab Disord 28: 559–567.
National Heart, Lung and BI (1998) Clinical Guidelines on the Identification, Evaluation, and Treatment of Overweight and Obesity in Adults: The Evidence Report. ii-228.
NCD Risk Factor Collaboration (2016) Trends in adult body-mass index in 200 countries from 1975 to 2014: a pooled analysis of 1698 population-based measurement studies with 19·2 million participants. Lancet 387: 1377–1396.Ng M, Fleming T, Robinson M, Thomson B, Graetz N, Margono C, Mullany EC, Biryukov S, Abbafati C, Abera SF, Abraham JP, Abu-Rmeileh NME, Achoki T, AlBuhairan FS, Alemu Z a, Alfonso R, Ali MK, Ali R, Guzman NA, Ammar W, Anwari P, Banerjee A, Barquera S, Basu S, Bennett D a, Bhutta Z, Blore J, Cabral N, Nonato IC, Chang J-C, Chowdhury R, Courville KJ, Criqui MH, Cundiff DK, Dabhadkar KC, Dandona L, Davis A, Dayama A, Dharmaratne SD, Ding EL, Durrani AM, Esteghamati A, Farzadfar F, Fay DFJ, Feigin VL, Flaxman A, Forouzanfar MH, Goto A, Green M a, Gupta R, Hafezi-Nejad N, Hankey GJ, Harewood HC, Havmoeller R, Hay S, Hernandez L, Husseini A, Idrisov BT, Ikeda N, Islami F, Jahangir E, Jassal SK, Jee SH, Jeffreys M, Jonas JB, Kabagambe EK, Khalifa SEAH, Kengne AP, Khader YS, Khang Y-H, Kim D, Kimokoti RW, Kinge JM, Kokubo Y, Kosen S, Kwan G, Lai T, Leinsalu M, Li Y, Liang X, Liu S, Logroscino G, Lotufo P a, Lu Y, Ma J, Mainoo NK, Mensah G a, Merriman TR, Mokdad AH, Moschandreas J, Naghavi M, Naheed A, Nand D, Narayan KMV, Nelson EL, Neuhouser ML, Nisar MI, Ohkubo T, Oti SO, Pedroza A, Prabhakaran D, Roy N, Sampson U, Seo H, Sepanlou SG, Shibuya K, Shiri R, Shiue I, Singh GM, Singh J a, Skirbekk V, Stapelberg NJC, Sturua L, Sykes BL, Tobias M, Tran BX, Trasande L, Toyoshima H, van de Vijver S, Vasankari TJ, Veerman JL, Velasquez-Melendez G, Vlassov VV, Vollset SE, Vos T, Wang C, Wang X, Weiderpass E, Werdecker A, Wright JL, Yang YC, Yatsuya H, Yoon J, Yoon S-J, Zhao Y, Zhou M, Zhu S, Lopez AD, Murray CJL, Gakidou E (2014) Global, regional, and national prevalence of overweight and obesity in children and adults during 1980–2013: a systematic analysis for the Global Burden of Disease Study 2013. Lancet 384: 766–781.
O’Doherty MG, Freedman ND, Hollenbeck AR, Schatzkin A, Abnet CC (2012) A prospective cohort study of obesity and risk of oesophageal and gastric adenocarcinoma in the NIH-AARP Diet and Health Study. Gut 61: 1261–1268.Orsini N, Greenland S (2011) A procedure to tabulate and plot results after flexible modeling of a
21
529530
531532
533534
535
536
537538539
540541
542543
544545546
547548
549550551
552553554555556557558559560561562563564565566567568569570
571572573
574

quantitative covariate. Stata J 11: 1–29.Park J, Morley TS, Kim M, Clegg DJ, Scherer PE (2014) Obesity and cancer--mechanisms underlying tumour progression and recurrence. Nat Rev Endocrinol 10: 455–465.Pischon T, Lahmann PH, Boeing H, Friedenreich C, Norat T, Tjønneland A, Halkjaer J, Overvad K, Clavel-Chapelon F, Boutron-Ruault MC, Guernec G, Bergmann MM, Linseisen J, Becker N, Trichopoulou A, Trichopoulos D, Sieri S, Palli D, Tumino R, Vineis P, Panico S, Peeters PHM, Bueno-de-Mesquita HB, Boshuizen HC, Van Guelpen B, Palmqvist R, Berglund G, Gonzalez CA, Dorronsoro M, Barricarte A, Navarro C, Martinez C, Quirós JR, Roddam A, Allen N, Bingham S, Khaw KT, Ferrari P, Kaaks R, Slimani N, Riboli E (2006) Body size and risk of colon and rectal cancer in the European Prospective Investigation into Cancer and Nutrition (EPIC). J Natl Cancer Inst 98: 920–931.
Renehan AG, Flood A, Adams KF, Olden M, Hollenbeck AR, Cross AJ, Leitzmann MF (2012) Body mass index at different adult ages, weight change, and colorectal cancer risk in the National Institutes of Health-AARP cohort. Am J Epidemiol 176: 1130–1140.Renehan AG, Tyson M, Egger M, Heller RF, Zwahlen M (2008) Body-mass index and incidence of cancer: a systematic review and meta-analysis of prospective observational studies. Lancet 371: 569–578.Renehan AG, Zwahlen M, Egger M (2015) Adiposity and cancer risk: new mechanistic insights from epidemiology. Nat Rev Cancer 15: 484–498.Roswall N, Freisling H, Bueno-de-Mesquita HBA, Ros M, Christensen J, Overvad K, Boutron-Ruault M-C, Severi G, Fagherazzi G, Chang-Claude J, Kaaks R, Steffen A, Boeing H, Argüelles M, Agudo A, Sánchez M-J, Chirlaque M-D, Barricarte Gurrea A, Amiano P, Wareham N, Khaw K-T, Bradbury KE, Trichopoulou A, Papatesta H-M, Trichopoulos D, Palli D, Pala V, Tumino R, Sacerdote C, Mattiello A, Peeters PH, Ehrnström R, Brennan P, Ferrari P, Ljungberg B, Norat T, Gunter M, Riboli E, Weiderpass E, Halkjaer J (2014) Anthropometric measures and bladder cancer risk: A prospective study in the EPIC cohort. Int J Cancer 135: 2918–2929.
Steffen A, Huerta J-M, Weiderpass E, Bueno-de-Mesquita HB, May AM, Siersema PD, Kaaks R, Neamat-Allah J, Pala V, Panico S, Saieva C, Tumino R, Naccarati A, Dorronsoro M, Sánchez-Cantalejo E, Ardanaz E, Quirós JR, Ohlsson B, Johansson M, Wallner B, Overvad K, Halkjaer J, Tjønneland A, Fagherazzi G, Racine A, Clavel-Chapelon F, Key TJ, Khaw K-T, Wareham N, Lagiou P, Bamia C, Trichopoulou A, Ferrari P, Freisling H, Lu Y, Riboli E, Cross AJ, Gonzalez C a., Boeing H (2015) General and abdominal obesity and risk of esophageal and gastric adenocarcinoma in the European Prospective Investigation into Cancer and Nutrition. Int J Cancer 137: 646–657.Stolzenberg-Solomon RZ, Schairer C, Moore S, Hollenbeck A, Silverman DT (2013) Lifetime adiposity and risk of pancreatic cancer in the NIH-AARP Diet and Health Study cohort. Am J Clin Nutr 98: 1057–1065.
White AJ, Nichols HB, Bradshaw PT, Sandler DP (2015) Overall and central adiposity and breast cancer risk in the sister study. Cancer 121: 3700–3708.
World Cancer Research Fund / American Institute for Cancer Research (2007) Food, Nutrition, Physical Activity, and the Prevention of Cancer: a Global Perspective. (Washington DC: AICR).
World Cancer Research Fund / American Institute for Cancer Research. (2011) Continuous Update Project Report. Food, Nutrition, Physical Activity, and the Prevention of Colorectal Cancer.
World Cancer Research Fund / American Institute for Cancer Research. (2014) Continuous Update Project Report: Diet, Nutrition, Physical Activity, and Prostate Cancer.
World Cancer Research Fund / American Institute for Cancer Research. (2015a) Continuous Update Project Report: Diet, Nutrition, Physical Activity and Gallbladder Cancer.
World Cancer Research Fund / American Institute for Cancer Research. (2015b) Continuous Update
22
575
576577
578579580581582583584
585586587
588589
590591
592593594595596597598
599600601602603604605
606607608
609610
611612
613614
615616
617618
619
Project Report: Diet, Nutrition, Physical Activity and Liver Cancer.
23
620
621