army energy and water reporting system assessment energy and water reporting system assessment ......
TRANSCRIPT
PNNL-20298
Prepared for the U.S. Department of Energy under Contract DE-AC05-76RL01830
Army Energy and Water Reporting System Assessment PC Deprez JS Burke MJ Giardinelli LM Connell September 2011
DISCLAIMER This report was prepared as an account of work sponsored by an agency of the United States Government. Neither the United States Government nor any agency thereof, nor Battelle Memorial Institute, nor any of their employees, makes any warranty, express or implied, or assumes any legal liability or responsibility for the accuracy, completeness, or usefulness of any information, apparatus, product, or process disclosed, or represents that its use would not infringe privately owned rights. Reference herein to any specific commercial product, process, or service by trade name, trademark, manufacturer, or otherwise does not necessarily constitute or imply its endorsement, recommendation, or favoring by the United States Government or any agency thereof, or Battelle Memorial Institute. The views and opinions of authors expressed herein do not necessarily state or reflect those of the United States Government or any agency thereof. PACIFIC NORTHWEST NATIONAL LABORATORY operated by BATTELLE for the UNITED STATES DEPARTMENT OF ENERGY under Contract DE-AC05-76RL01830 Printed in the United States of America Available to DOE and DOE contractors from the Office of Scientific and Technical Information,
P.O. Box 62, Oak Ridge, TN 37831-0062; ph: (865) 576-8401 fax: (865) 576-5728
email: [email protected] Available to the public from the National Technical Information Service, U.S. Department of Commerce, 5285 Port Royal Rd., Springfield, VA 22161
ph: (800) 553-6847 fax: (703) 605-6900
email: [email protected] online ordering: http://www.ntis.gov/ordering.htm
This document was printed on recycled paper.
(9/2003)

PNNL-20298
Army Energy and Water Reporting System Assessment
PC Deprez JS Burke
MJ Giardinelli LM Connell
September 2011
Prepared for the
Deputy Assistant Secretary of the Army for Energy and Sustainability
under Contract DE-AC05-76RL01830
Related Services
Pacific Northwest National Laboratory
Richland, Washington 99352
Page iv of x
Executive Summary
The U.S. Army has been using Army Energy and Water Reporting System (AEWRS) for many years to
collect and compile energy data from installations for facilitating compliance with Federal and
Department of Defense energy management program reporting requirements. In this analysis, staff from
Pacific Northwest National Laboratory found that substantial opportunities exist to expand AEWRS
functions to better assist the Army to effectively manage energy programs. Army leadership must decide
if it wants to invest in expanding AEWRS capabilities as a web-based, enterprise-wide tool for improving
the Army Energy and Water Management Program or simply maintaining a bottom-up reporting tool.
This report looks at both improving system functionality from an operational perspective and increasing
user-friendliness, but also as a tool for potential improvements to increase program effectiveness.
Organizations interviewed for this assessment included: Assistant Chief of Staff for Installation
Management (ACSIM), Deputy Assistant Secretary of the Army (DASA), U.S. Army Audit Agency
(USAAA), Aberdeen Proving Ground (APG), National Guard HQ, and Pacific Northwest National
Laboratory (PNNL). Individuals interviewed are listed in Appendix C.
Limitations on how data is entered into AEWRS results in data quality issues. The website is not modern
in appearance and is cumbersome for energy managers to enter data into. In many cases, utility
consumption data must be consolidated outside AEWRS and then manually entered. Different
installations use different methods to capture their data for entry, including Microsoft Access®1
databases, Microsoft Excel®1 spreadsheets, and a commercially purchased system called Utility Manager
ProTM
.2 The variation of processes and methods used by the installations leads to data inconsistencies and
audit deficiencies. Reports available on the website are limited and require extensive efforts to obtain
accurate data, validate existing data, and correct discrepancies to generate the annual energy report. Data
quality and reporting issues are discussed in section 3.4.
The authors of this report recommend focusing on making the system easier for energy managers to input
accurate data as the top priority for improving AEWRS. The next major focus of improvement would be
improved reporting.
The AEWRS user interface is dated and not user friendly, and a new system is recommended. While there
are relatively minor improvements that could be made to the existing system to make it easier to use,
significant improvements will be achieved with a user-friendly interface, new architecture, and a design
that permits scalability and reliability. An expanded data set would naturally have need of additional
requirements gathering and a focus on integrating with other existing data sources, thus minimizing
manually entered data.
The scope of a new system could be expanded to allow energy managers, commands, the Office of the
Assistant Chief of Staff for Installation Management, and the Office of the Deputy Assistant Secretary of
the Army (Energy & Sustainability) to proactively monitor and forecast energy consumption, energy
generation, and energy costs using a dashboard and analytic ad-hoc reports. The expanded scope would
help to address the requirements brought up by the U.S. Department of Defense assessment as outlined in
Appendix A and provide visibility to a broader audience. Information would be made available to all
levels from installations to HQ, providing for an enterprise-wide solution.
1 Microsoft Access and Microsoft Excel are registered trademarks of Microsoft Corp.
2 Utility Manager Pro is a registered trademark of LBP Energy Management.

Page v of x
Any modifications or new software application chosen must also include software development lifecycle
management, version control, and cyber security best practices. Prototypes, iterative development,
incremental releases, and following CIO/G6 security guidelines would be required for a new system.
A breakdown of each option with the cost and recommendation is presented in Table 1-1. All costs
provided in this assessment are estimates. Cost of software licenses will depend on existing Army/
Department of Defense contracts with vendors. Detailed requirements gathering must be completed and
client approval must be obtained for any of the options selected. Additionally, there will be ongoing
support and maintenance costs for any option selected that cannot be estimated in this statement of work.
At a minimum, replacing the existing system with a new user interface and database is recommended with
an estimated cost of $900K. Also recommended is expanding the system to include a flexible service-
oriented architecture for an additional $125K. Finally, the authors of this report recommend adding
dashboard functionality with an analytics database for an additional $900K. If all recommendations are
chosen, the estimated cost is $1.925M. Additionally if the National Guard negotiated rate of $1800 plus a
5% discount per state for Utility Manager Pro can be obtained for each installation, purchasing the system
should be considered as a quick way to standardize utility data inputs with an estimated annual cost of
$360K for 200 installations. On-going operational costs are not addressed in this report.
Page vi of x
Acronyms and Abbreviations
AEWRS Army Energy and Water Reporting System
DoD U.S. Department of Defense
ECIP Energy Conservation Investment Program
ECM Energy conservation measure
ESPC Energy Saving Performance Contract
FAC Facility
HQIIS Headquarters Installation Information System
O&M Operations and Maintenance
PNNL Pacific Northwest National Laboratory
REC Renewable Energy Certificate
RPUID Real Property Unique Identifier
SMS Strategic Management System
SOA Service-oriented architecture
UESC Utility Energy Services Contract

Page vii of x
Contents
Executive Summary ..................................................................................................................................... iv
Acronyms and Abbreviations ...................................................................................................................... vi
1 Introduction ........................................................................................................................................... 1
2 AEWRS................................................................................................................................................. 4
2.1 Current System .............................................................................................................................. 4
2.2 Current Architecture ..................................................................................................................... 4
3 Option 1: Minimal Changes to Existing System ................................................................................... 5
3.1 Software Development Processes ................................................................................................. 5
3.2 User Interface ................................................................................................................................ 6
3.3 Data Accessibility ......................................................................................................................... 7
3.4 Reports .......................................................................................................................................... 8
3.4.1 Report Data Discrepancies .................................................................................................... 9
3.4.2 Other Report Enhancements ............................................................................................... 10
3.5 Option 1 Assessment ................................................................................................................... 12
3.5.1 Pros ..................................................................................................................................... 12
3.5.2 Cons .................................................................................................................................... 12
3.5.3 Cost ..................................................................................................................................... 12
4 Option 2: Redesign Database and User Interface ............................................................................... 13
4.1 Database ...................................................................................................................................... 13
4.2 User Interface .............................................................................................................................. 13
4.3 Online Help ................................................................................................................................. 16
4.4 Workflow and Notifications........................................................................................................ 16
4.5 Enhanced Capability Areas ......................................................................................................... 17
4.5.1 Water ................................................................................................................................... 17
4.5.2 Energy Performance and Renewables ................................................................................. 17
4.5.3 Energy Savings Performance Contract ............................................................................... 18
4.6 Option 2 Assessment ................................................................................................................... 18
4.6.1 Pros ..................................................................................................................................... 18
4.6.2 Cons .................................................................................................................................... 19
4.6.3 Cost ..................................................................................................................................... 19
5 Option 3: Re-Engineer to Support a Service-Oriented Middle Tier ................................................... 20
5.1 AEWRS Integration with External Applications ........................................................................ 20
5.2 Data Imports ................................................................................................................................ 21
5.3 Data Exports ................................................................................................................................ 23

Page viii of x
5.4 Option 3 Assessment ................................................................................................................... 23
5.4.1 Pros ..................................................................................................................................... 23
5.4.2 Cons .................................................................................................................................... 23
5.4.3 Cost ..................................................................................................................................... 23
6 Option 4: Dashboard and Analytics Database .................................................................................... 24
6.1 Energy Dashboards ..................................................................................................................... 24
6.2 Ad-Hoc Reports with Analysis Database .................................................................................... 25
6.3 Forecasting .................................................................................................................................. 26
6.4 Option 4 Assessment ................................................................................................................... 27
6.4.1 Pros ..................................................................................................................................... 27
6.4.2 Cons .................................................................................................................................... 28
6.4.3 Cost ..................................................................................................................................... 28
7 Option 5: Utility Manager ................................................................................................................... 29
7.1 Templates and Forms .................................................................................................................. 29
7.2 Data Imports ................................................................................................................................ 30
7.3 Data Audits ................................................................................................................................. 30
7.4 Data Integration .......................................................................................................................... 31
7.5 Example System Architecture ..................................................................................................... 31
7.6 Option 5 Assessment ................................................................................................................... 31
7.6.1 Pros ..................................................................................................................................... 31
7.6.2 Cons .................................................................................................................................... 32
7.6.3 Cost ..................................................................................................................................... 33
8 New Capabilities ................................................................................................................................. 34
8.1 DoD Energy Reporting Requirements ........................................................................................ 34
9 Summary ............................................................................................................................................. 35
Appendix A. Energy Working Group Identified Capabilities and Objectives ............................................ 36
Appendix B. PNNL Example Web Applications ........................................................................................ 40
Appendix C. Interviewed Organizations’ Individuals ................................................................................ 42
Page ix of x
Figures and Tables
Figures
Figure 3-1. Utilities Data Entry Without Comma Separators ....................................................................... 6
Figure 3-2. Irrelevant Dropdown List Selections .......................................................................................... 7
Figure 3-3. Data Entry Display with Export Capability ............................................................................... 7
Figure 3-4. Current Utility Unit Costs Report .............................................................................................. 8
Figure 3-5. Alternative Utility Unit Costs Report ......................................................................................... 8
Figure 3-6. Water Consumption Report Groupings ...................................................................................... 9
Figure 3-7. Flattened Water Consumption Data ........................................................................................... 9
Figure 3-8. Annual Summary Analysis Discrepancy .................................................................................. 10
Figure 4-1. ESPC Minimal Entry ................................................................................................................ 15
Figure 4-2. Lengthy AERWS Hover Help .................................................................................................. 16
Figure 5-1. Common Pipeline into Data Storage ........................................................................................ 22
Figure 5-2. AEWRS Data to Other Systems ............................................................................................... 23
Figure 6-1. Oracle Dashboard ..................................................................................................................... 24
Figure 6-2. Oracle Business Intelligence Discoverer .................................................................................. 25
Figure 6-3. Tableau Gas Prices Report ....................................................................................................... 26
Figure 6-4. Tableau Forecast Report........................................................................................................... 26
Figure 6-5. Forecasting Chart ..................................................................................................................... 26
Figure 6-6. Tableau Dashboard ................................................................................................................... 27
Figure 6-7. Tableau Dashboard Details ...................................................................................................... 27
Figure 7-1. Utility Manager Pro Template .................................................................................................. 29
Figure 7-2. Utility Manager Pro Import ...................................................................................................... 30
Figure 7-3. Utility Manager Pro Audit Options .......................................................................................... 31
Figure 7-4. Utility Manager Energy Data Gathering Diagram ................................................................... 32
Figure B-1. Building Energy Codes Program’s Sample Generator ............................................................ 40
Figure B-2. Commercial Lighting Solutions Application ........................................................................... 41

Page x of x
Tables
Table 1-1. Options at a Glance...................................................................................................................... 2
Table 3-1. Option 1 Cost Estimate .............................................................................................................. 12
Table 4-1. Option 2 Phased Approach ........................................................................................................ 19
Table 5-1. Current Data Imports into AEWRS ........................................................................................... 20
Table 5-2. Potential Data Exports from AEWRS ....................................................................................... 20
Table 5-3. Potential Data Imports into AEWRS ......................................................................................... 21
Table 5-4. Application Interface Formats ................................................................................................... 22
Table 6-1. Option 4 Phased Approach ........................................................................................................ 28

Page 1 of 43
1 Introduction
As noted in the U.S. Army Audit Agency Energy Consumption Audit Report (A-2009-0068-FFE), dated
March 12, 2009, and the Water Conservation Resources Audit Report (A-2010-0158-FFE), dated
August 18, 2010, there are many areas of desired improvement for the Army Energy and Water Reporting
System (AEWRS). The current purpose of AEWRS is to serve as a data repository for collecting
information from energy managers, which is then compiled into an annual energy report.
This document summarizes reported shortcomings of the system and provides several alternative
approaches for improving application usability and adding functionality. Options discussed include:
Option 1: Minimal Changes to Existing System. With a minimal budget, this option provides
recommendations for making the most impactful changes to the existing application.
Option 2: Redesign User Interface and Database. This option recommends creating a new graphical
user interface and redesign of the underlying database.
Option 3: Re-engineer to Support a Service-Oriented Middle Tier. This option discusses a more
robust implementation that further separates the application into three tiers: the user interface, the
redesigned database, and a middle layer containing business logic and web services. This option
would most successfully support the import of data from other systems into AEWRS and the export
of data from AEWRS to other systems.
Option 4: Dashboard and Analytics Database. This option further enhances the system to include ad-
hoc queries and a dashboard portal.
Option 5: Utility Manager. This option describes how use of a commercial tool, Utility Manager
Pro™
, could assist in collecting utility data. Incorporating Utility Manager Pro would eliminate the
need for some, but not all, of the suggested changes proposed in Options 1 through 4.
Note: Options 2 through 4 build upon themselves (e.g., Option 3 would include changes suggested in
Option 2.
Future uses for AEWRS and/or its data are considered in Section 8 of the report.
High-level cost estimates of implementing the features described are provided to assist the Army in
understanding the relative costs of the various options. These costs are estimates and should not be
considered binding. The actual costs may vary greatly depending on:
A more thorough requirements analysis, which will provide a better understanding of the solutions
needed
Identification of specific features to be included in the estimate
Who is contracted to perform the work and their experience with the technologies.

Page 2 of 43
Table 1-1. Options at a Glance
Option Description Assessment Cost* Recommendation
1 Minimal
Changes to
Existing System
Pros: Making minimal changes to the current AEWRS would be cheaper
to implement than completely re-engineering the system. Users familiar
with the system might more easily become familiar with the added
functionality.
Cons: Even with enhanced data entry and reporting, the final application
will be inferior to a re-engineered system. A large amount of time will be
spent auditing and correcting data. The current annual report process is
cumbersome and labor intensive due to the need for extensive data
verification, collecting missing data, and correcting erroneous data. If
minimal changes are made to the existing system, the need for additional
resources to create the report will continue.
$380K Not recommended.
Greater changes are needed to
make the system user friendly and
provide accurate data.
However, these changes could be
completed as a temporary fix while
a new system is developed.
2 Redesign User
Interface and
Database
Pros: A system that is easier to use and provides valuable information to
the energy managers is more likely to be used. Accurate data entry will
lead to less time and money spent fixing data later. Providing users with a
means to quickly and accurately track energy consumption and costs
against requirements and goals will raise awareness of needed areas of
improvement or successes that could be duplicated on other projects.
Finally, accurate data that can be easily accessed will permit questions on
energy management to be effectively answered in a timely manner.
Cons: Initial, up-front costs will be higher for requirements gathering,
software development, and data conversions.
$900K Recommend implementing.
A redesigned system would
provide a tool that is easier for
users to interact with and improved
verification of data.
3 Re-engineer to
Support a
Service-
Oriented
Middle Tier
Pros: Implementation of a service-oriented architecture (SOA) allows
automated data exchange with other applications and a separation of
workflow and business logic from the rest of the application. This results
in a more agile and often less expensive response to changing
requirements. For example, data formats and inputs can be modified
quickly without impacting the rest of the application.
Cons: Adding a middle tier with web services and business logic would
incur a higher initial cost.
Option 2:
$900K +
Option 3:
$125K =
$1.025M
Recommend implementing.
A re-engineered system would
provide greater flexibility and
reduce manual data input.
Page 3 of 43
Option Description Assessment Cost* Recommendation
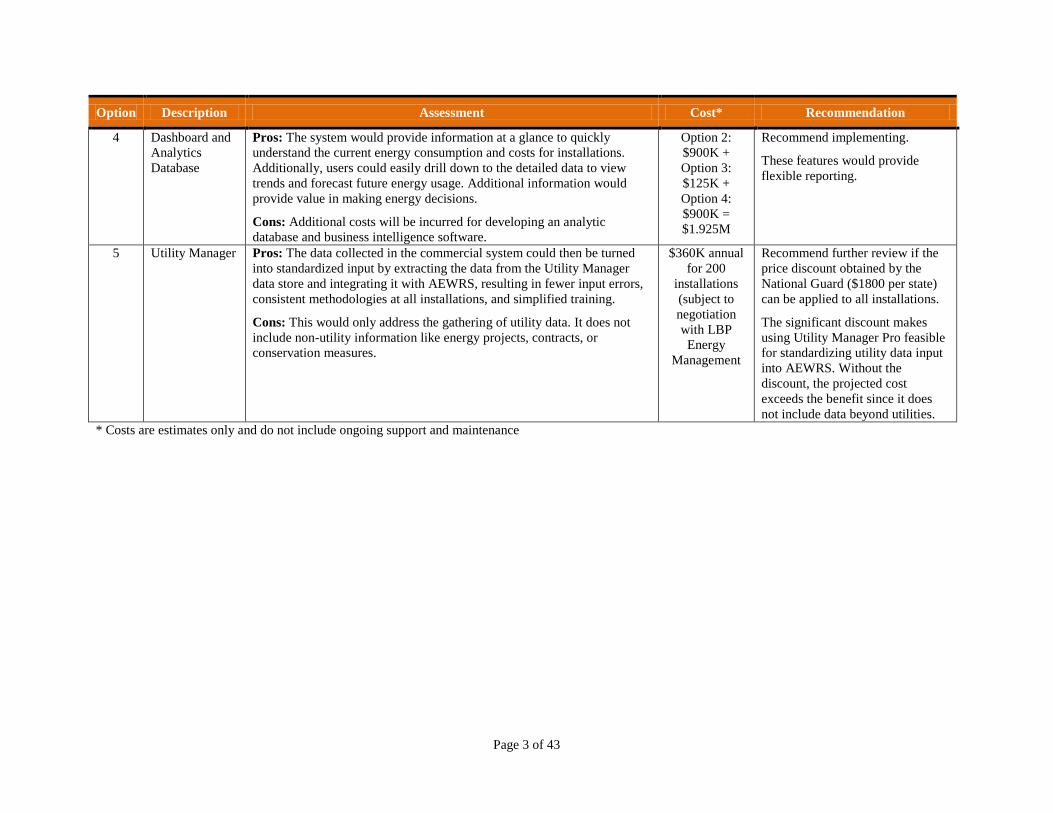
4 Dashboard and
Analytics
Database
Pros: The system would provide information at a glance to quickly
understand the current energy consumption and costs for installations.
Additionally, users could easily drill down to the detailed data to view
trends and forecast future energy usage. Additional information would
provide value in making energy decisions.
Cons: Additional costs will be incurred for developing an analytic
database and business intelligence software.
Option 2:
$900K +
Option 3:
$125K +
Option 4:
$900K =
$1.925M
Recommend implementing.
These features would provide
flexible reporting.
5 Utility Manager Pros: The data collected in the commercial system could then be turned
into standardized input by extracting the data from the Utility Manager
data store and integrating it with AEWRS, resulting in fewer input errors,
consistent methodologies at all installations, and simplified training.
Cons: This would only address the gathering of utility data. It does not
include non-utility information like energy projects, contracts, or
conservation measures.
$360K annual
for 200
installations
(subject to
negotiation
with LBP
Energy
Management
Recommend further review if the
price discount obtained by the
National Guard ($1800 per state)
can be applied to all installations.
The significant discount makes
using Utility Manager Pro feasible
for standardizing utility data input
into AEWRS. Without the
discount, the projected cost
exceeds the benefit since it does
not include data beyond utilities.
* Costs are estimates only and do not include ongoing support and maintenance

Page 4 of 43
2 AEWRS
2.1 Current System
Installations are officially required to report data monthly in AEWRS; however, the system is most
heavily used in September. AEWRS has been in use for many years and has had many new screens, data
fields, and reports added as needed. A comprehensive design requirement does not exist and the system
has been modified on short notice with minimal staffing to meet changing annual report requirements
resulting in a less than optimal design.
Much additional work must be done to create the annual report from the AEWRS data. The cost for
PNNL to provide data analysis of missing, incomplete, or incorrect data and prepare the Army Annual
Energy Report was approximately $50K in 2010.
2.2 Current Architecture
The current architecture, which uses Java code, Windows Operating Systems, Oracle 10g Database
Enterprise Edition, and Oracle Application Server, is appropriate. However, standard Oracle support for
the current database (10.2) expired in July 2010 and extended support expires in July 2013, so an upgrade
to Oracle 11g is recommended. The currently used Oracle Application Server, Release 3, is no longer
supported but there are plans to upgrade.
Page 5 of 43
3 Option 1: Minimal Changes to Existing System
The existing user interface could be updated with better validation rules and minor modifications to
displays. It has colors that are difficult to view and could use improved graphics and a more aesthetic
design. Examples of issues with the current user interface are shown in Section 3.2. Some fundamental
improvements in software development practices are also recommended in this section.
3.1 Software Development Processes
A mission-critical application system should have greater funding and staffing than what is currently
allocated to AEWRS, which only has one part-time application developer. The following recommended
enhancements to the existing system are in addition to maintenance, which is required to keep software
applications current.
In 2010, there was no contract for application support for 6 months, and no changes were made to the
system during that time. It is recommended that any plan for upgrading the system include a budget for
maintenance, including upgrading software platforms and tools to current versions.
The authors of this report also recommend implementing more mature software development practices,
regardless of the future feature set. While software changes would improve the usability, accuracy, and
reliability of the system, process changes in the management of the system should be made to follow
industry standard best practices. The authors were unable to obtain a copy of the database and application
code to complete a detailed evaluation, but several areas of concern were readily visible. The following
changes are recommended regardless of the enhancements made going forward.
The application code is currently not under source-control versioning, which would make it difficult
to roll back to a previous version if needed. There are many free, open-source systems available for
source control such as Subversion (http://subversion.apache.org/) and TortoiseSVN
(http://tortoisesvn.tigris.org/).
Change management is not formalized and changes are done frequently. A spreadsheet is used to
track enhancement requests, but the authors of this report were unable to obtain a current file. A
change management system should be used to more accurately track bugs and enhancement requests
along with their status. Many free, open-source tools are available for this purpose (e.g., Oracle SQL
Developer, which will show schema changes and is free for download).
There is not a current complete data model. A data dictionary document was received, but it only has
60 tables and does not include detailed definitions. There are an additional 195 tables in the database
that are not in the data dictionary document.
More modular code architecture is recommended for performance and ease of maintenance; for
example, some SQL code is embedded in the Java code. There are tools and libraries that allow
database queries to be more generic and separated from the software code. Stored procedures or other
middle-tier objects are commonly employed for this purpose. The addition of a middle tier, discussed
further in Option 3, is also helpful in making more modular and maintainable software.
Database backups are not done nightly and exports are done weekly instead of using Oracle Recovery
Manager backups. This increases the risk of not being able to recover data input by energy managers
Page 6 of 43
in the event of a system failure. It was also communicated that this is currently a manual process and
should definitely be changed to an automated process.
There are production and development systems, but a separate test system is not used. The
development system database was out of date during the assessment team’s visit in December 2010.
The development database was unable to be refreshed from production due to containing the energy
managers proposed baseline changes that had not been approved.
An integrated build server, along with continuous integration processes, would allow developers to
better test their code and catch errors quickly. It would also provide a working version at any stage of
development, which can be used by others to test and evaluate changes and new features as they
progress.
The implementation of best practices, such as formalized testing and controlled change processes, may
initially take time to set up, but will be repaid quickly as the application matures.
3.2 User Interface
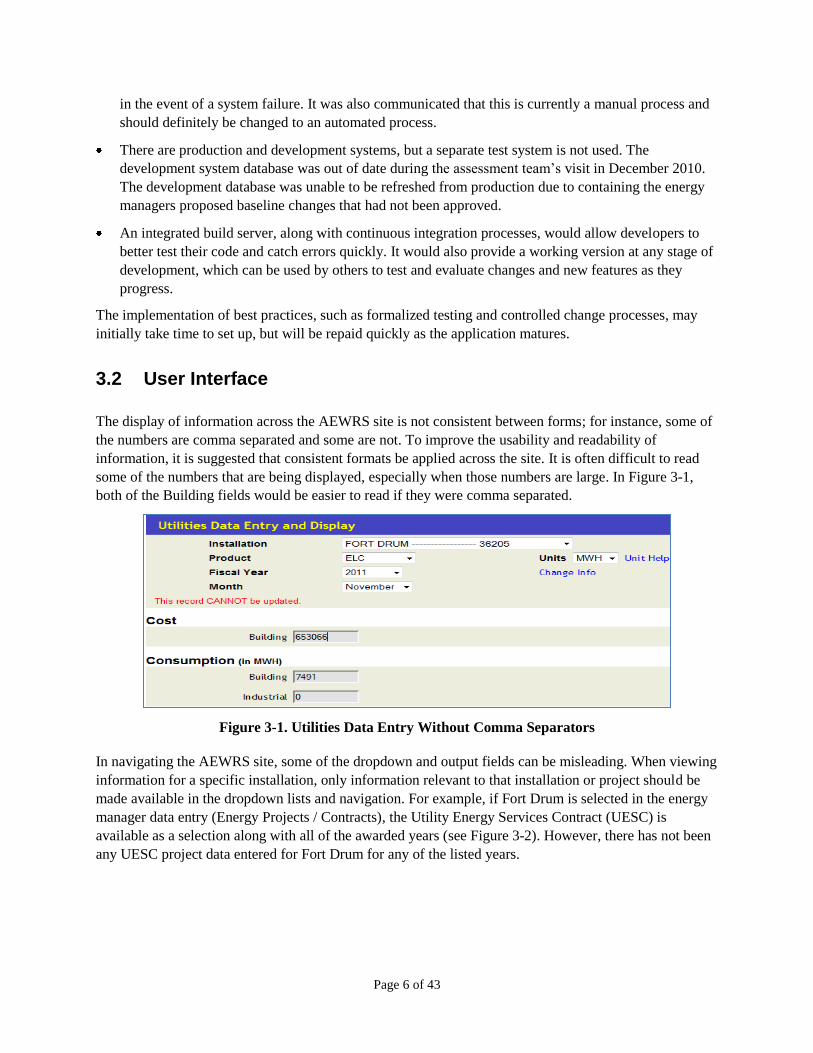
The display of information across the AEWRS site is not consistent between forms; for instance, some of
the numbers are comma separated and some are not. To improve the usability and readability of
information, it is suggested that consistent formats be applied across the site. It is often difficult to read
some of the numbers that are being displayed, especially when those numbers are large. In Figure 3-1,
both of the Building fields would be easier to read if they were comma separated.
Figure 3-1. Utilities Data Entry Without Comma Separators
In navigating the AEWRS site, some of the dropdown and output fields can be misleading. When viewing
information for a specific installation, only information relevant to that installation or project should be
made available in the dropdown lists and navigation. For example, if Fort Drum is selected in the energy
manager data entry (Energy Projects / Contracts), the Utility Energy Services Contract (UESC) is
available as a selection along with all of the awarded years (see Figure 3-2). However, there has not been
any UESC project data entered for Fort Drum for any of the listed years.

Page 7 of 43
Figure 3-2. Irrelevant Dropdown List Selections
3.3 Data Accessibility
The ability to export data from the user entry screens (e.g., Utility or Water) into Excel would help users
evaluate and validate data against previously entered information and use that data for analysis and
reporting (see Figure 3-3). Having to navigate away from the entry screen when trying to do analysis is
time consuming and may impact the user’s ability to validate information. Competing off-the-shelf
products allow for this type of functionality within the user entry sections of their products. Acquiring a
product like Aspose or utilizing java plug-ins to export to Excel would help in applying this functionality
to the current AEWRS system.
Figure 3-3. Data Entry Display with Export Capability
Page 8 of 43
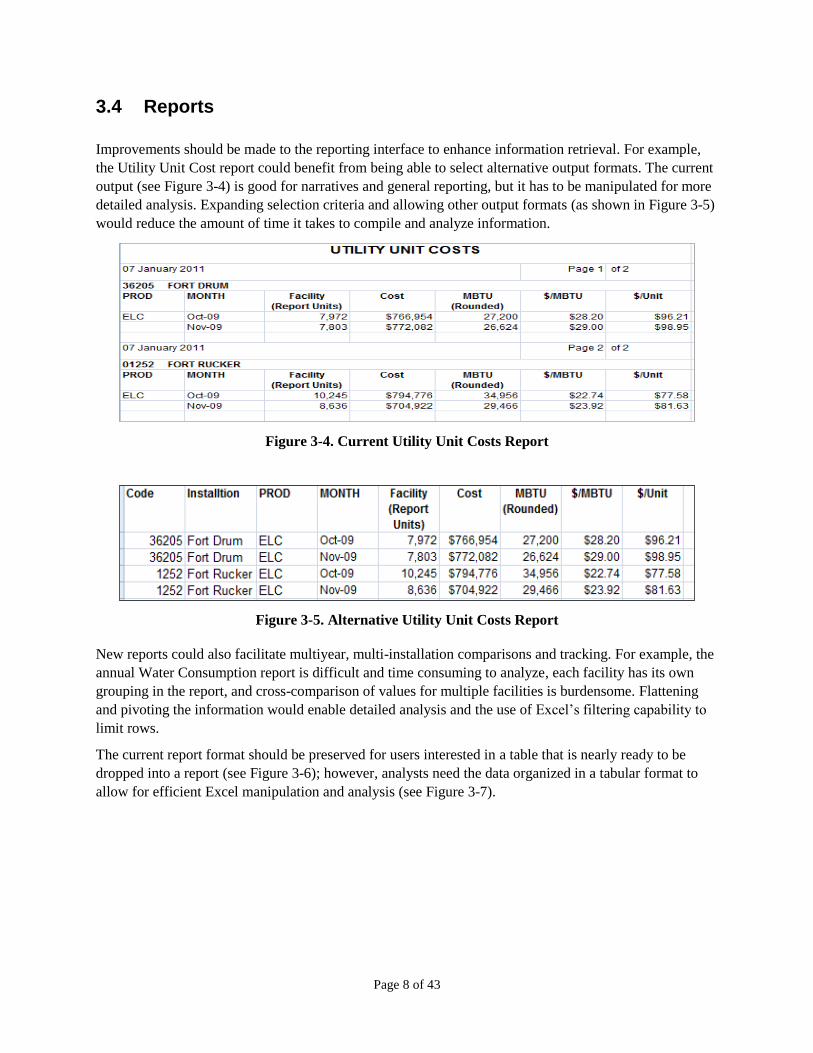
3.4 Reports
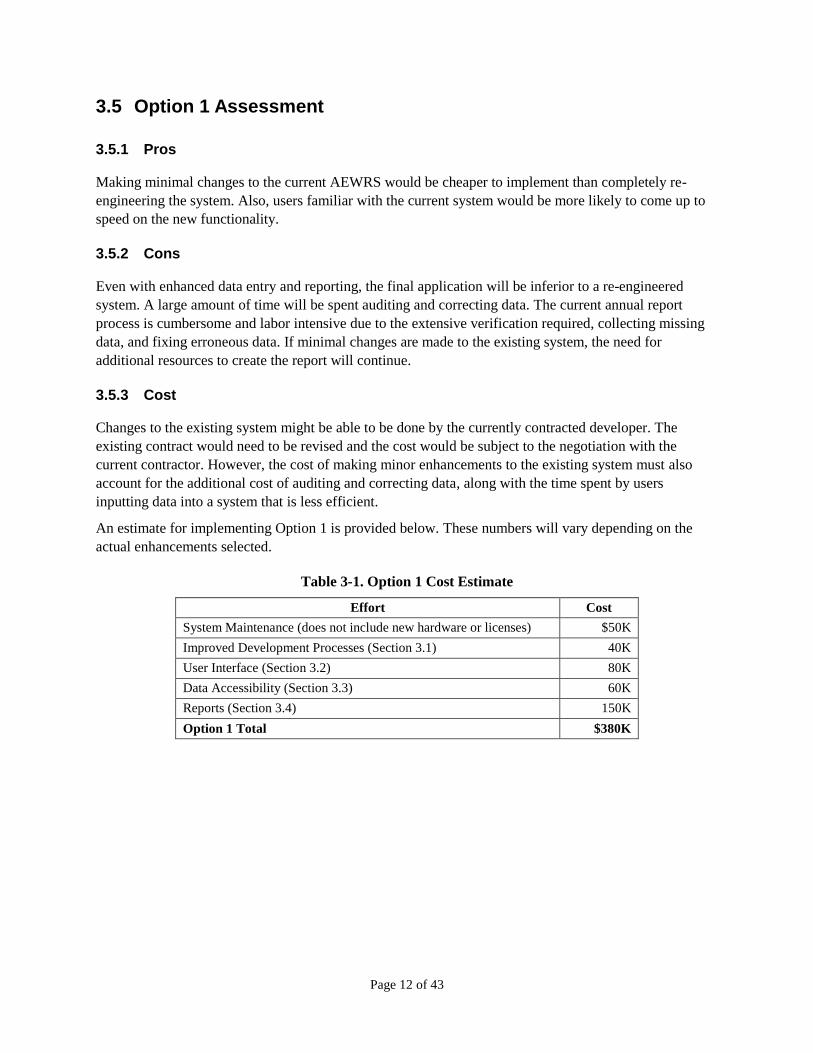
Improvements should be made to the reporting interface to enhance information retrieval. For example,
the Utility Unit Cost report could benefit from being able to select alternative output formats. The current
output (see Figure 3-4) is good for narratives and general reporting, but it has to be manipulated for more
detailed analysis. Expanding selection criteria and allowing other output formats (as shown in Figure 3-5)
would reduce the amount of time it takes to compile and analyze information.
Figure 3-4. Current Utility Unit Costs Report
Figure 3-5. Alternative Utility Unit Costs Report
New reports could also facilitate multiyear, multi-installation comparisons and tracking. For example, the
annual Water Consumption report is difficult and time consuming to analyze, each facility has its own
grouping in the report, and cross-comparison of values for multiple facilities is burdensome. Flattening
and pivoting the information would enable detailed analysis and the use of Excel’s filtering capability to
limit rows.
The current report format should be preserved for users interested in a table that is nearly ready to be
dropped into a report (see Figure 3-6); however, analysts need the data organized in a tabular format to
allow for efficient Excel manipulation and analysis (see Figure 3-7).

Page 9 of 43
Figure 3-6. Water Consumption Report Groupings
Figure 3-7. Flattened Water Consumption Data
3.4.1 Report Data Discrepancies
Users have expressed frustration with discrepancies found within the reports. For example, the Aberdeen
energy manager pointed out that on the Annual Summary Analysis Report for 2010, the MBTU/KSF
(million Btu per thousand square feet) metric showed 146.91, while the progress graph for the same
period showed around 180 MBTU/KSF (Figure 3-8).
Addressing inconsistencies and exposing data details used in graph compilation would ensure data
consistency and help the users isolate potential problems in the reports.

Page 10 of 43
Figure 3-8. Annual Summary Analysis Discrepancy
3.4.2 Other Report Enhancements
Other enhancements to reports include:
Showing data used for the square footage summary number (sourced from the Headquarters
Installation Information System [HQIIS]). These data are currently available, but energy managers
must request the information by email, which is then sent to them in a spreadsheet by the AEWRS
contractor. Energy managers have sometimes seen large variations in square footage between
previous quarters and years. Providing a detailed square footage report would decrease support costs
spent responding to emails and would provide the energy managers with information needed to verify
that the data are accurate. The detailed information could also be used as a basis for correcting any
discrepancies within the source system.
Customizing report columns and grouping criteria. Frequently, columns are blank or show values of
zero for an installation. One user indicated that he never uses the data found in three of the columns in
one of his reports. Not only were they not being used, but he could not recall any of them being
populated with anything other than zero. The example provided was the utilities detail report and the
fields that never seemed to contain any information were (Closing Inv., BTU Content(Opt.),
Industrial Cons., and MSE Cons). The example came from data for the Aberdeen installation.

Page 11 of 43
Allowing the individual selection of more than six installations on a report for comparisons. The
current limit prevents analysis of data for more than six installations within the same report. Instead,
multiple reports must be consolidated manually in Excel to conduct a complete analysis. The system
currently allows reports by installation, command, region, or component. To view data for seven
installations, the report for all installations must be run or the report must be run two times.
Alternatively, if they are in the same command, region, or component, a larger report can be
generated and then the needed data extracted from it.
Allowing selection of more than 3 years of data. A few users mentioned that they need to do analyses
that span multiple years, but it is very time consuming. It was communicated that 3 years was part of
an original requirement. This requirement may need to be readdressed if users now want to analyze a
large block of time.
Including additional percentages, ratios, differences, and totals. Users indicated that the simplest of
calculations must often be completed outside AEWRS. Expanding reports to include some of the
most frequently used calculations may cut down on the amount of time spent manually performing
calculations and reduce the possibility of human error. An example would be the percentage of gross
electricity that is from renewable energy.
Reorganizing the data report to include sub-organization. There are currently too many reports
grouped together in long lists. Adding some grouping levels to the reports may make it easier for the
users to navigate to the desired reports. The grouping levels could provide some extra metadata used
for classifying each of the reports. However, the option to create customized reports might negate the
need for so many report variations.
Making report outputs and user interaction more user friendly. Allowing users to select data that are
actually not available is misleading and confusing. If data elements do not exist for an installation,
region, etc., then those should not be made available for selection. If a report returns zero results, that
information should be displayed within the user interface before creating and saving the report output
file.
Creating monthly reports, which were removed due to confusing results. Monthly reports are not
currently available for missing data, as previously noted in the audit response.
Adding information for heating and cooling degree days (this feature may currently be in
development). A report should be created to normalize the data for heating and cooling degree days.
Page 12 of 43
3.5 Option 1 Assessment
3.5.1 Pros
Making minimal changes to the current AEWRS would be cheaper to implement than completely re-
engineering the system. Also, users familiar with the current system would be more likely to come up to
speed on the new functionality.
3.5.2 Cons
Even with enhanced data entry and reporting, the final application will be inferior to a re-engineered
system. A large amount of time will be spent auditing and correcting data. The current annual report
process is cumbersome and labor intensive due to the extensive verification required, collecting missing
data, and fixing erroneous data. If minimal changes are made to the existing system, the need for
additional resources to create the report will continue.
3.5.3 Cost
Changes to the existing system might be able to be done by the currently contracted developer. The
existing contract would need to be revised and the cost would be subject to the negotiation with the
current contractor. However, the cost of making minor enhancements to the existing system must also
account for the additional cost of auditing and correcting data, along with the time spent by users
inputting data into a system that is less efficient.
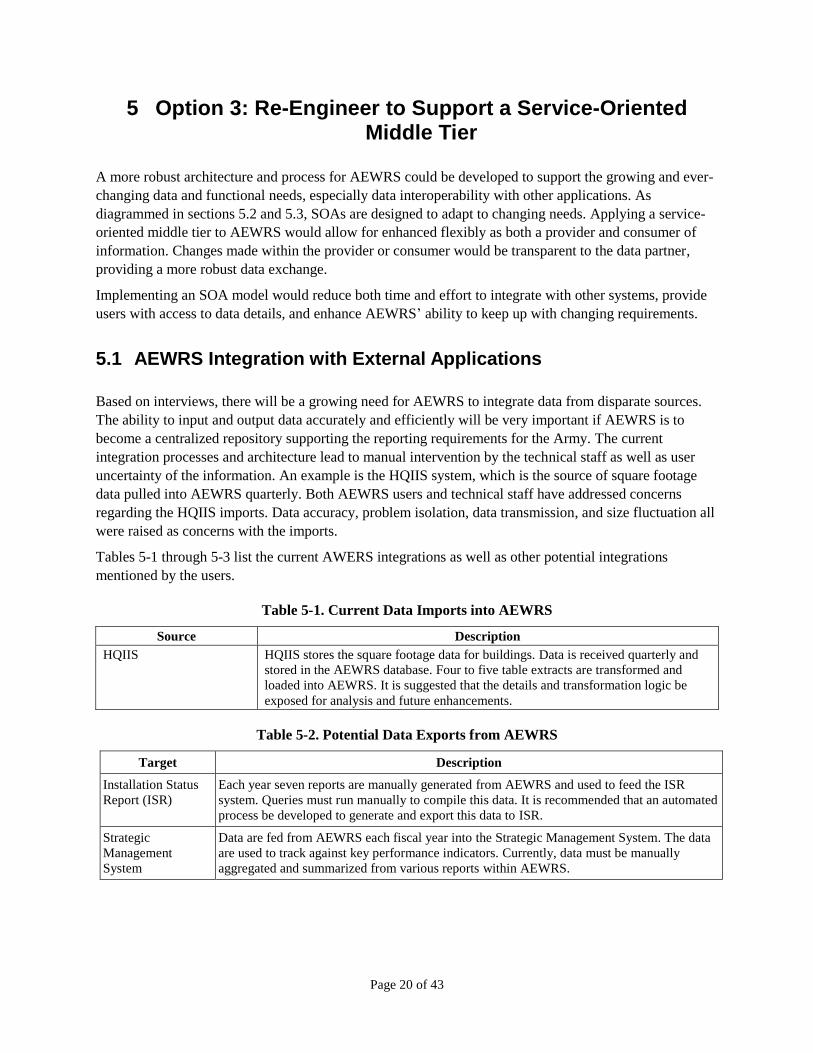
An estimate for implementing Option 1 is provided below. These numbers will vary depending on the
actual enhancements selected.
Table 3-1. Option 1 Cost Estimate
Effort Cost
System Maintenance (does not include new hardware or licenses) $50K
Improved Development Processes (Section 3.1) 40K
User Interface (Section 3.2) 80K
Data Accessibility (Section 3.3) 60K
Reports (Section 3.4) 150K
Option 1 Total $380K

Page 13 of 43
4 Option 2: Redesign Database and User Interface
Improvements are needed to make it easier for energy managers to enter data into AEWRS and view
meaningful information to help them monitor energy performance. Areas of desired improvements in
order of priority are: redesign of the user interface, online help, data entry, notifications, and reports. The
specific tasks are also prioritized within each improvement area. Changes to the user interface and reports
that were identified under Option 1 would be included under Option 2, but the following expanded
capabilities would also be considered.
4.1 Database
The data model should be redesigned to meet expanding data requirements and support the overhaul of
the user interface. It is recommended that an experienced data architect be involved in designing the new
database architecture. Features of the new data model should include:
Intuitive naming conventions for tables and columns. In the current data model, it is very difficult to
determine what each of the tables and columns represent without a detailed data dictionary.
Improved referential integrity should be applied to the data model ensuring accuracy of data entry.
For example, in the current system some of the child tables do not have constraints to the parent
tables, which can lead to data inaccuracy and corruption. A common terminology used for this issue
is ―orphan records‖ for child records without a corresponding parent record. (For example, there are
many entities (Annual, Water, Duers2) that reference the DODAACS Primary Key (DODAAC), but
don't appear to have a Foreign Key relationship to DODAACS)
Differentiation of tables based on usage and ownership. In the current data model, all tables are in the
same schema: HQADDS. Tables used in direct support of the application and those used to receive
information from outside sources should be separated.
Support audit logging and historical information. These data points will be needed to support data
recovery and expanding reporting requirements.
Creation of views and application interfaces. This will insulate the user interface and outside system
integrations from changes made to the base data model.
4.2 User Interface
Input fields could be rearranged for ease of use and reduction of errors. It is recommended that an
experienced user interface designer provide a redesigned layout and help address the following issues:
The data entry screens should be reviewed. For instance, some of the third-party financing inputs
(e.g., Energy Saving Performance Contracts [ESPC], and UESC) are spread across multiple inputs.
This causes confusion and inefficiency, as users have to cross many screens to enter relatively similar
information. In several of the examples that were reviewed, only a few of the fields were populated
and it was not clear from the interface what fields were required for entry. Reorganizing the fields
and/or applying more information about what fields are required could increase the reliability of the
data that is being entered on these screens.

Page 14 of 43
There are a large number of data input fields. It is difficult for personnel to collect all of this
information and then enter it in the right screen. It might be valuable to review the input screens,
verify that there are no redundant inputs, and determine if any inputs can be imported from previous
records or if they are truly necessary.
One-time versus annual data entry. Many screens contain inputs and fields for information that is
entered once; however, a few inputs must be revisited annually so that fiscal year-end data can be
entered (ESPC awards, renewable energy purchase/production/details, etc.). These follow-on annual
inputs have frequently not been completed by the energy managers in AEWRS. Possible solutions
include separating report screens into one-time inputs and annual inputs. Alternatively, the annual
inputs could be included in a single screen, allowing the user to see all items that need to be updated
based on previous year’s data inputs.
The previous year/quarter/month data should be displayed on the data entry screens to make it easier
for users to compare to current data entries. This interface change could cut down on data entry
errors. Previously entered data can be viewed, but not in the data entry screen. If a user wants to
compare the currently entered data to past entries they must navigate back and forth between screens.
Energy managers could define custom thresholds appropriate for their specific installation utility
costs and consumption. Alternatively, the Army could use localized costs to define thresholds. For
example, instead of having a single threshold for all installations that check for water costs (currently
in AEWRS there is just one threshold 0$ - $8,000 MGAL), specific thresholds by installation could
be set to check both cost per million gallons and consumption.
Users should be able to enter data in the unit of measurement the utility bills are received in for
multiple bills. Manual conversion can lead to data entry errors. Even though most of the installations
must summarize numerous bills prior to loading them into AEWRS, the ability to save raw data in the
original units could cut down on data entry errors. AEWRS does currently allow for data conversion,
but only if there is one bill received or if the bills received are billed in the same units. Otherwise, the
users must summarize the billed units outside of AWERS (for instance, in Excel) and then add it to
the system.
Users could enter comments to justify reasons for variances and credits from utility providers. It
appears that in the current system, comments are only allowed when there is a large variance (For
electricity it only flags entries that have greater than 25% variance). The ability to add comments
within different entry sections at any time would document consumption and cost fluctuations along
with the narrative for the yearly report.
AEWRS should permit zero entry records to be created. Currently it is unclear if an installation did
not report energy consumption or if there were no deliveries that month for infrequently used energy
such as propane. Allowing users to apply comments or additional flags to the entries may assist in
evaluating if a record should truly be zero or if the entry was not populated. Energy sources that are
not used at an installation should be flagged or removed from that installations data entry screen.
The AEWRS interface should clearly identify required fields (put a red star next to them, etc.) and not
permit records to be saved with blank values in them. If certain fields are optional for given
installations, remove or disable those fields to avoid confusion and/or possible bad data entry (For
example ESPC and UESC have a quite a few fields exposed for entry, but only require two fields to
be populated).

Page 15 of 43
Automated validation on inputs would help avoid many common errors, such as a $/unit energy check
to make sure the results are sensible (e.g., $/kWh for electricity, $/MMBtu for natural gas). AEWRS
currently has automated audits in place, but these audits appear to be in some cases too generic. (For
example consumption audit errors are only generated if vary by 25% or more and water only if cost
falls outside of $0 - $8,000 per Million Gallons). Similar validations should be applied to water and
renewable energy project entries.
Energy managers could upload data from spreadsheets instead of manually retyping data into each
screen. This would reduce the time to input data and the chance of data errors from mistyping. User
feedback and findings in the U.S. Army Audit Agency Energy Consumption Audit Report suggest that
a lot of work is already completed outside of AEWRS to compile the data. Providing a mechanism
that supports uploading spreadsheets or files may alleviate some of the duplicate entries. Data entry
validation rules in AEWRS would still apply to uploaded data from spreadsheets.
The user interface redesign should minimize record entry requirements by specifying which fields are
required. There are several types of entries (e.g., produced renewable energy records, ESCP/UESC
entries, etc.) that require extensive inputs. However, sometimes the majority of the fields are left
blank when created and are never updated later on. An example of an ESPC entry from Fort Bragg in
2008 is shown in Figure 4-1. The AEWRS User Manual indicates the only required fields are the
Contract No. and Project No. There are 17 ESPC entries for Fort Bragg in 2008 that only have
minimal data. If all of the fields or a majority of the fields are actually required, then that should be
made clear in the interface.
Figure 4-1. ESPC Minimal Entry
Customized user templates would reduce entry errors and the time needed to enter data. A
tremendous amount of work is completed outside of AEWRS to collect data for manual entry.
Knowledge of what to report has been an issue for some energy managers. Currently, installations are
using nonstandard spreadsheets, Access databases, and the National Guard is using the purchased
software product Utility Manager Pro to collect data needed for entry into AEWRS. Use of Utility
Manager Pro as a standard data collection tool is discussed in Section 7.0. Utility Manager Pro also
allows users to define templates that can be applied to their data entry.

Page 16 of 43
4.3 Online Help
Improved context-sensitive help is needed on the data entry screens. The hover help short phrases are not
sufficient and in some cases do not have clear definitions of the process or input field. An example of
insufficient information is the Annual Factors – Relocatable Bldg field, which only has ―TBD‖ for the
hover help. Conversely, when the hover help phrase is lengthy, it is difficult to read. An example of
lengthy hover help is the Annual Factors – Building field, displayed in Figure 4-2.
Some of the information in the user’s manual was found to be out of date, incorrect, and unclear.
Feedback indicated the user’s manual is considered cumbersome to read and consequently not referenced
frequently. Commercial tools, such as RoboHelp, can create online help and a user’s manual from the
same text.
Adding a frequently asked questions section would provide a quick reference area. Alternatively, a
bulletin board forum would permit users to post questions and receive responses that can be viewed by
other users. Currently, questions are emailed by an individual to ACSIM and a response email is sent
back. This is not conducive to knowledge sharing among other users who likely have the same questions.
.
Figure 4-2. Lengthy AERWS Hover Help
4.4 Workflow and Notifications
Workflow implemented by AEWRS could be improved with automated notifications in the form of email,
reports, and/or alerts provided to the user within the system. Examples of such notifications include:
Email status reports regarding meeting energy reductions and costs savings to the energy managers,
garrison commanders, and region directors. Goals that will not be met could be highlighted to
encourage energy managers to be proactive and make changes in a timely manner.
Flag data to identify if an estimate was used and send a reminder email to the energy manager to
update the estimate with accurate data when they are available. Repeat the email at specified time
periods until actual data are entered. Users communicated that they often must enter estimates to meet
data entry requirements even though they haven’t received all of the necessary bills. Competing off

Page 17 of 43
the shelf products like Utility Manager Pro provide this type of functionality. **Note if estimated data
is entered and not updated prior to fiscal year end it cannot be changed in the current system. A new
or updated system should take this into account and allow for the data to be flagged accordingly.
Identification of missing utility reports. Not all utilities will be reported for each month (e.g., fuel oil
may only be used in the winter for heating); therefore, a simple check of 12 records per year and/or
four per quarter may result in too many flags. Doing a cross check to previous fiscal years may be
needed.
Create workflows to automatically send notifications to installations that have not reported by
specified due dates. Track who verified data entered and when it occurred.
Consider requiring users to certify entered records on a monthly/quarterly basis. Do not allow records
for a quarter to be verified unless a key set of entries is completed (e.g., utility consumption and cost,
water consumption, ESPC award payments, etc.). The system could then produce reports for
regional/command energy managers so they know before the month prior to a new fiscal year that
there are missing records. After a user verifies data is complete, the command should also certify the
data. The directions on how to do the certification from Installation Management Command
(IMCOM) are long and difficult to read. Files used for certification should be uploaded into AEWRS,
or the certification should be completed directly in AEWRS.
Create a process to notify energy managers of significant HQIIS square footage changes to ensure
energy consumption is also changed. For example, Fort Eustis was not told that Fort Storey increased
baseline square footage and did not include those energy usages in reports as needed.
Data not being entered for new projects. Reports could be created to identify installations without any
new projects entered and previous projects without updated performance data.
4.5 Enhanced Capability Areas
A redesign of AEWRS could include increased functionality in many capability areas, as is required to
meet changing requirements. The following sections provide a few suggested enhancements.
4.5.1 Water
Information in the current system is not sufficient for the recent Federal Energy Management
Program (FEMP) Guidelines for Estimating Unmetered Industrial Water and Landscaping Water
Use, July 2010. The guidelines have many formulas with different inputs for estimating the various
types of unmetered water usage. To ensure a standard reporting methodology, these guidelines should
be built into AEWRS and the hover help enhanced to eliminate the need to reference paper
documents. Reclaiming water (water harvesting) is a field in AEWRS but is not used by many. More
metadata, such as how the water was used, is needed to make the field useful.
Water reports are not used because the current data are not accurate or meaningful.
4.5.2 Energy Performance and Renewables
While utility consumption currently has rudimentary variance checks in place, renewables do not
have any variance checks. Appropriate verification of input should be added.

Page 18 of 43
Knowledge of the land availability and suitability for expanded renewable energy production at each
installation is needed to understand the potential renewable energy production level.
A report is needed to show progress towards meeting the mandated renewable energy goals from the
Energy Policy Act of 2005, and the DoD goal of 25% renewable energy by 2025. However, changing
requirements affect the complexity in composing these reports.
Analysis tools are needed for tracking performance and calculating energy use intensity and
consumption. These tools are outlined in Section 6, Option 4: Dashboard and Analytics Database.
To achieve net zero targets, 30 installations must produce all energy used via renewables. Trend-line
reports could be used to compare how close each installation is, along with timelines estimating when
these targets might be achieved.
4.5.3 Energy Savings Performance Contract
Currently, users can only enter one ESPC contract record. AEWRS could instead have the ability to
track the history of a contract and capture when contracts are modified. AEWRS should identify and
report missing follow-on entry fields.
Improved capabilities might capture investment value, projected annual savings (cost and energy),
total lifecycle savings, simple payback, contract terms, and energy conservation measures for a
project, corresponding contractor or contracting office, and award date as required elements.
The lack of data from installations and no system to pull data from impact ESPC reporting. Manually
entered data are often incorrect and contract documents must be used for information instead of
AEWRS. Most ESPC data are in schedule forms and could refer to a specific line in a schedule.
Unfortunately, there does not appear to be a clear option for integration of contract information. The
UESC do not refer directly to a specific contract line schedule.
Operations and maintenance (O&M) and repair and replacement (R&R) cost savings are reported on
ESPCs. Fields are not currently required and no report is available that shows which ESPCs are not
providing this data. The O&M Best Practices Guide, Release 3.0, identifies the reasons why this
information should be captured:
O&M and other energy-related cost savings are allowable in Federal ESPCs, and
are defined as reduction in expenses (other than energy cost savings) related to
energy and water consuming equipment. In fact, an analysis of annual measurement
and verification reports from 100 ongoing Super ESPC projects showed that 21% of
the reported savings were due to reductions in O&M costs (LBNL 2007). These
energy-related cost savings, which can also include savings on R&R costs, can
constitute a substantial portion of a project’s savings, yet O&M and R&R cost
savings are often not as diligently verified or reviewed as energy savings.
4.6 Option 2 Assessment
4.6.1 Pros
A system that is easier to use and provides valuable information to the energy managers is more likely to
be used. Accurate data entry will lead to less time and money spent fixing data later. Providing a means to

Page 19 of 43
quickly and accurately track energy consumption and costs against requirements and goals will raise
awareness of needed areas of improvement or successes that could be duplicated on other projects.
Finally, accurate and easily accessed data will permit questions on energy management to be effectively
answered in a timely manner.
4.6.2 Cons
Initial, up-front costs will be higher for requirements gathering, software development, and data
conversions.
4.6.3 Cost
A phased approach will provide basic functionality prior to release of the completed system. Prototypes of
the new user interface and reports would be created and approved prior to development.
Table 4-1. Option 2 Phased Approach
Phase Effort Cost
1 Requirements Gathering and Prototyping $300K
2 Develop Core Functionality
The current AEWRS would be replaced at a point where the new system had implemented
the minimum changes necessary to sustain reporting requirements. Subsequent
functionality would be released iteratively (in stages).
Data Migration
Data Entry
Existing Reports
Help
User Management
Administration
400K
3 Enhanced Reporting (including reports defined in Options 1 and 2) 200K
Total Option 2 $900K
These total costs do not include hardware or licensing with vendors for the operating system, database,
and application server that would all be subject to Army negotiated rates. They also do not include an
extensive addition of new capabilities, some of which are discussed in Section 4.4 (although a start could
be made to address these new requirements).
The timeframe to complete a new system would depend on the budget and scope. A reasonable timeframe
for deployment of a new system, with minimal functionality, is 1 year. Note that Phase 1 could be
conducted without commitments to Phases 2 and 3. This approach would provide for requirements
gathering and screen designs that could be useful even if a decision was made to stay with the existing
system.
Page 20 of 43
5 Option 3: Re-Engineer to Support a Service-Oriented Middle Tier
A more robust architecture and process for AEWRS could be developed to support the growing and ever-
changing data and functional needs, especially data interoperability with other applications. As
diagrammed in sections 5.2 and 5.3, SOAs are designed to adapt to changing needs. Applying a service-
oriented middle tier to AEWRS would allow for enhanced flexibly as both a provider and consumer of
information. Changes made within the provider or consumer would be transparent to the data partner,
providing a more robust data exchange.
Implementing an SOA model would reduce both time and effort to integrate with other systems, provide
users with access to data details, and enhance AEWRS’ ability to keep up with changing requirements.
5.1 AEWRS Integration with External Applications
Based on interviews, there will be a growing need for AEWRS to integrate data from disparate sources.
The ability to input and output data accurately and efficiently will be very important if AEWRS is to
become a centralized repository supporting the reporting requirements for the Army. The current
integration processes and architecture lead to manual intervention by the technical staff as well as user
uncertainty of the information. An example is the HQIIS system, which is the source of square footage
data pulled into AEWRS quarterly. Both AEWRS users and technical staff have addressed concerns
regarding the HQIIS imports. Data accuracy, problem isolation, data transmission, and size fluctuation all
were raised as concerns with the imports.
Tables 5-1 through 5-3 list the current AWERS integrations as well as other potential integrations
mentioned by the users.
Table 5-1. Current Data Imports into AEWRS
Source Description
HQIIS HQIIS stores the square footage data for buildings. Data is received quarterly and
stored in the AEWRS database. Four to five table extracts are transformed and
loaded into AEWRS. It is suggested that the details and transformation logic be
exposed for analysis and future enhancements.
Table 5-2. Potential Data Exports from AEWRS
Target Description
Installation Status
Report (ISR)
Each year seven reports are manually generated from AEWRS and used to feed the ISR
system. Queries must run manually to compile this data. It is recommended that an automated
process be developed to generate and export this data to ISR.
Strategic
Management
System
Data are fed from AEWRS each fiscal year into the Strategic Management System. The data
are used to track against key performance indicators. Currently, data must be manually
aggregated and summarized from various reports within AEWRS.
Page 21 of 43
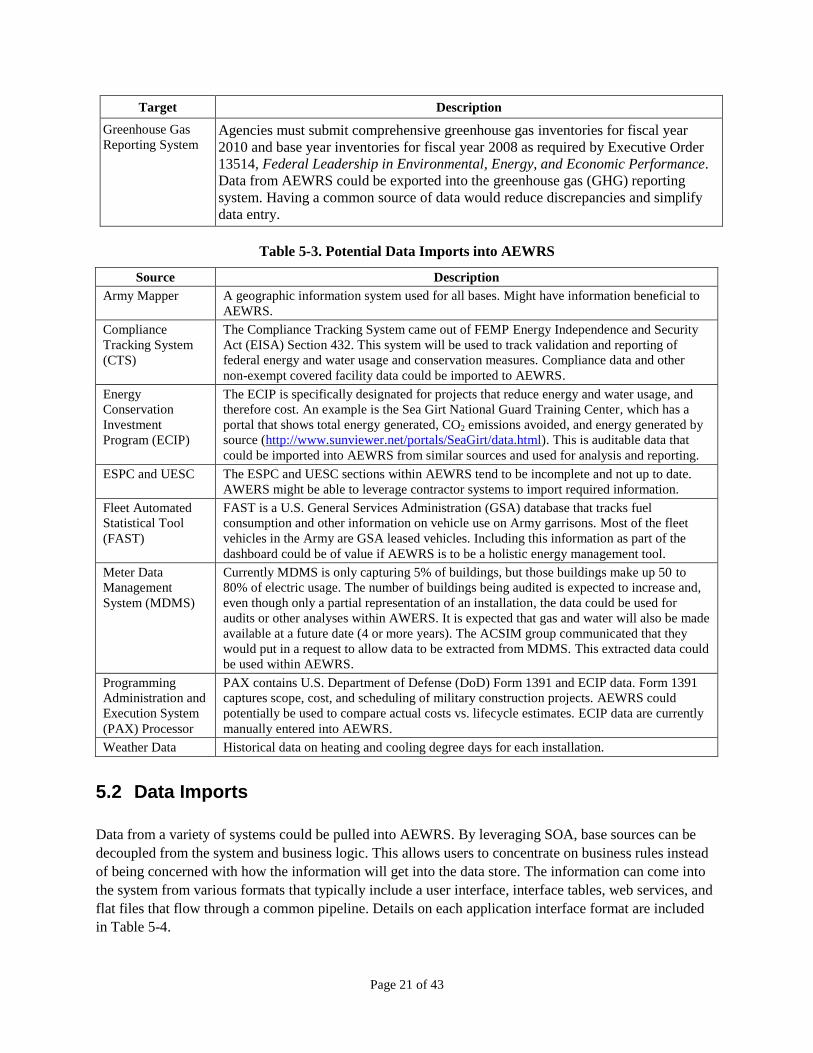
Target Description
Greenhouse Gas
Reporting System Agencies must submit comprehensive greenhouse gas inventories for fiscal year
2010 and base year inventories for fiscal year 2008 as required by Executive Order
13514, Federal Leadership in Environmental, Energy, and Economic Performance.
Data from AEWRS could be exported into the greenhouse gas (GHG) reporting
system. Having a common source of data would reduce discrepancies and simplify
data entry.
Table 5-3. Potential Data Imports into AEWRS
Source Description
Army Mapper A geographic information system used for all bases. Might have information beneficial to
AEWRS.
Compliance
Tracking System
(CTS)
The Compliance Tracking System came out of FEMP Energy Independence and Security
Act (EISA) Section 432. This system will be used to track validation and reporting of
federal energy and water usage and conservation measures. Compliance data and other
non-exempt covered facility data could be imported to AEWRS.
Energy
Conservation
Investment
Program (ECIP)
The ECIP is specifically designated for projects that reduce energy and water usage, and
therefore cost. An example is the Sea Girt National Guard Training Center, which has a
portal that shows total energy generated, CO2 emissions avoided, and energy generated by
source (http://www.sunviewer.net/portals/SeaGirt/data.html). This is auditable data that
could be imported into AEWRS from similar sources and used for analysis and reporting.
ESPC and UESC The ESPC and UESC sections within AEWRS tend to be incomplete and not up to date.
AWERS might be able to leverage contractor systems to import required information.
Fleet Automated
Statistical Tool
(FAST)
FAST is a U.S. General Services Administration (GSA) database that tracks fuel
consumption and other information on vehicle use on Army garrisons. Most of the fleet
vehicles in the Army are GSA leased vehicles. Including this information as part of the
dashboard could be of value if AEWRS is to be a holistic energy management tool.
Meter Data
Management
System (MDMS)
Currently MDMS is only capturing 5% of buildings, but those buildings make up 50 to
80% of electric usage. The number of buildings being audited is expected to increase and,
even though only a partial representation of an installation, the data could be used for
audits or other analyses within AWERS. It is expected that gas and water will also be made
available at a future date (4 or more years). The ACSIM group communicated that they
would put in a request to allow data to be extracted from MDMS. This extracted data could
be used within AEWRS.
Programming
Administration and
Execution System
(PAX) Processor
PAX contains U.S. Department of Defense (DoD) Form 1391 and ECIP data. Form 1391
captures scope, cost, and scheduling of military construction projects. AEWRS could
potentially be used to compare actual costs vs. lifecycle estimates. ECIP data are currently
manually entered into AEWRS.
Weather Data Historical data on heating and cooling degree days for each installation.
5.2 Data Imports
Data from a variety of systems could be pulled into AEWRS. By leveraging SOA, base sources can be
decoupled from the system and business logic. This allows users to concentrate on business rules instead
of being concerned with how the information will get into the data store. The information can come into
the system from various formats that typically include a user interface, interface tables, web services, and
flat files that flow through a common pipeline. Details on each application interface format are included
in Table 5-4.

Page 22 of 43
Table 5-4. Application Interface Formats
Source Description
User Interface Typically, a graphical user interface that is delivered via an application installed on
computer or accessed via web host. Main application used to interact with domain
information.
Interface Tables Exposed in base application, allowing outside sources to feed information in without being
concerned with business rules and application structure. The data fed into interface tables
are queued for processing by base application.
Web Services Application components that allow systems to communicate over open protocols. Web
services allow systems to be integrated regardless of platform or programming language.
Flat Files Typically text-based files used to transmit information between disparate systems. The
common formats are comma- and tab-delimited files.
The common pipeline into the data store is managed by centralizing the logic depicted in Figure 5-1 by
the rules engine. Instead of maintaining duplicate logic for each flow into the system, the logic can be
controlled within the rules engine.
Consume Files (Excel, Flat
File, XML, etc.)
AEWRS Data
Repository
RulesEngine
AEWRSUser Interface
Web Services
Interfaces
Weather Data
MDMS
ECIP
HQIIS
PAX Processor
CTS
Army Mapper
Figure 5-1. Common Pipeline into Data Storage

Page 23 of 43
5.3 Data Exports
The data from AEWRS could also be sent to other systems or extracted from various interfaces. As shown
in Figure 5-2
AEWRS Data
RepositoryAPIs
Web Services
Consume Files (Excel, Flat
File, XML, etc.)
ISR
SMS
Figure 5-2, application programming interfaces (APIs) could be exposed to make it easier for outside
systems to call into AWERS and obtain needed information. If users required that the information be
produced in the form of a data extract, the same APIs could be used to generate the data. Time, effort, and
data integrity are benefits of implementing centralized data extraction from the data store.
AEWRS Data
RepositoryAPIs
Web Services
Consume Files (Excel, Flat
File, XML, etc.)
ISR
SMS
Figure 5-2. AEWRS Data to Other Systems
5.4 Option 3 Assessment
5.4.1 Pros
Implementation of an SOA would allow automated data exchange with other applications and a
separation of workflow and business logic from the rest of the application. This would result in a more

Page 24 of 43
agile and often less expensive response to changing requirements. For example, data formats and inputs
can be modified quickly without impacting the rest of the application.
5.4.2 Cons
Adding a middle tier with web services and business logic would incur a higher initial cost.
5.4.3 Cost
A rough estimate for designing a middle tier into the AEWRS application is $125K. This cost is for
implementation of web services and a business logic layer, and it is in addition to the other enhancements
outlined under options 1 and 2. Each new service (e.g., import of a new data source or export of AEWRS
data to another application) must be estimated separately and is not included in this estimate, as the cost is
very dependent on the data source and the complexities involved in the data exchange.

Page 25 of 43
6 Option 4: Dashboard and Analytics Database
The capabilities of AEWRS could go beyond just being a data repository for generating the annual report
to also provide a means for energy managers to proactively track utility and water usage with trending,
forecasting, and dashboards. This option would transform the system to an energy performance
management system instead of a reporting system. All of the enhancements previously discussed would
still be applicable.
6.1 Energy Dashboards
As the amount of information grows in AEWRS, so will the demand for that information. Organizing and
presenting the information for easy user access will be crucial. Dashboards provide a quick glance at key
indicators and can be tailored for specific users. For instance, the information displayed on an installation
dashboard may be different than what is needed by upper management. Adding interactive components to
dashboards further enhances the ability of users to follow trends and quickly identify anomalies. The
example in Figure 6-1 is from Oracle Business Activity Monitoring.
Figure 6-1. Oracle Dashboard

Page 26 of 43
6.2 Ad-Hoc Reports with Analysis Database
A majority of the users interviewed would like to see expanded reporting capabilities within AEWRS.
The current set of canned reports does not provide the flexibility desired. Adding a data warehouse or a
reporting structure to AEWRS would expose more information and provide more access to the data.
Including an extension for ad-hoc queries using online analytical processing with an analysis database
would allow users to view data in many different formats. This would also provide an easy means to view
trending and forecasting of energy costs and installation performance. Figure 6-2 is an example report
using Oracle’s Business Intelligence Discoverer. Figures 6-3 and 6-4 are example reports from Tableau,
a business intelligence software vendor. Tableau’s product provides both analytic ad-hoc (slice and dice)
reports and dashboards. Users can change measurements, dates, and objects from dropdowns,
checkboxes, radial buttons, entry boxes, and slide bars.
Figure 6-2. Oracle Business Intelligence Discoverer
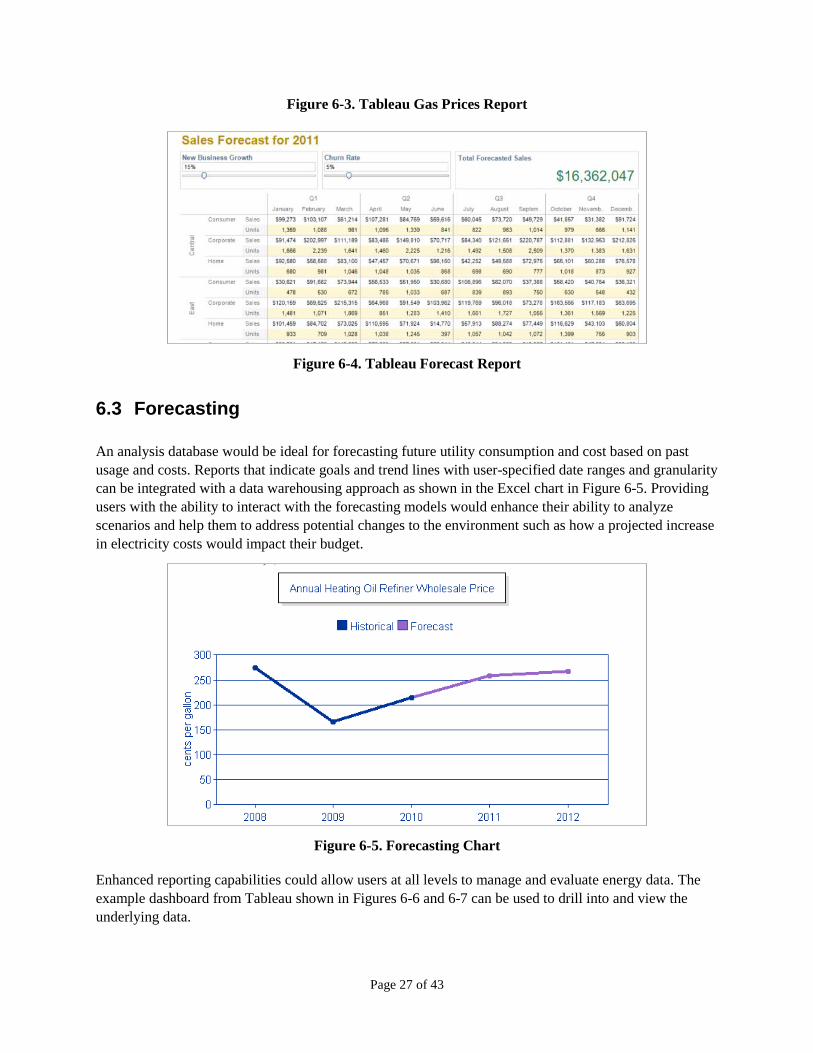
Page 27 of 43
Figure 6-3. Tableau Gas Prices Report
Figure 6-4. Tableau Forecast Report
6.3 Forecasting
An analysis database would be ideal for forecasting future utility consumption and cost based on past
usage and costs. Reports that indicate goals and trend lines with user-specified date ranges and granularity
can be integrated with a data warehousing approach as shown in the Excel chart in Figure 6-5. Providing
users with the ability to interact with the forecasting models would enhance their ability to analyze
scenarios and help them to address potential changes to the environment such as how a projected increase
in electricity costs would impact their budget.
Figure 6-5. Forecasting Chart
Enhanced reporting capabilities could allow users at all levels to manage and evaluate energy data. The
example dashboard from Tableau shown in Figures 6-6 and 6-7 can be used to drill into and view the
underlying data.

Page 28 of 43
Figure 6-6. Tableau Dashboard
Figure 6-7. Tableau Dashboard Details
6.4 Option 4 Assessment
6.4.1 Pros
The system would provide information at a glance to quickly understand the current energy consumption
and costs for installations. Users could easily drill down to the detailed data to view trends and forecast
future energy usage. Additional information would provide value in making energy decisions.

Page 29 of 43
6.4.2 Cons
Additional costs would be incurred for developing an analytic database and business intelligence
software.
6.4.3 Cost
The cost of Tableau Server for DoD, including ad-hoc and dashboard features, would be approximately
$250K. Development costs would need to include consideration of requirements gathering, testing,
development, and meetings, resulting in a rough total estimate of $900K.
The timeframe to complete a new system would depend on the budget and scope. A reasonable timeframe
for adding an analysis database, ad hoc reporting, and dashboard extensions to a new system (as defined
in Option 2) is approximately 1 year. These additional features could be incrementally developed in
stages as shown in Table 6-1.
Table 6-1. Option 4 Phased Approach
Phase Effort Cost
1 Requirements gathering for analytic reports and prototyping $100K
2 Purchase software 250K
2 Analytic database, including the import of existing data 200K
3 Ad Hoc Analytic Reports 200K
4 Dashboards customized for different user groups 150K
Option 4 Total $900K
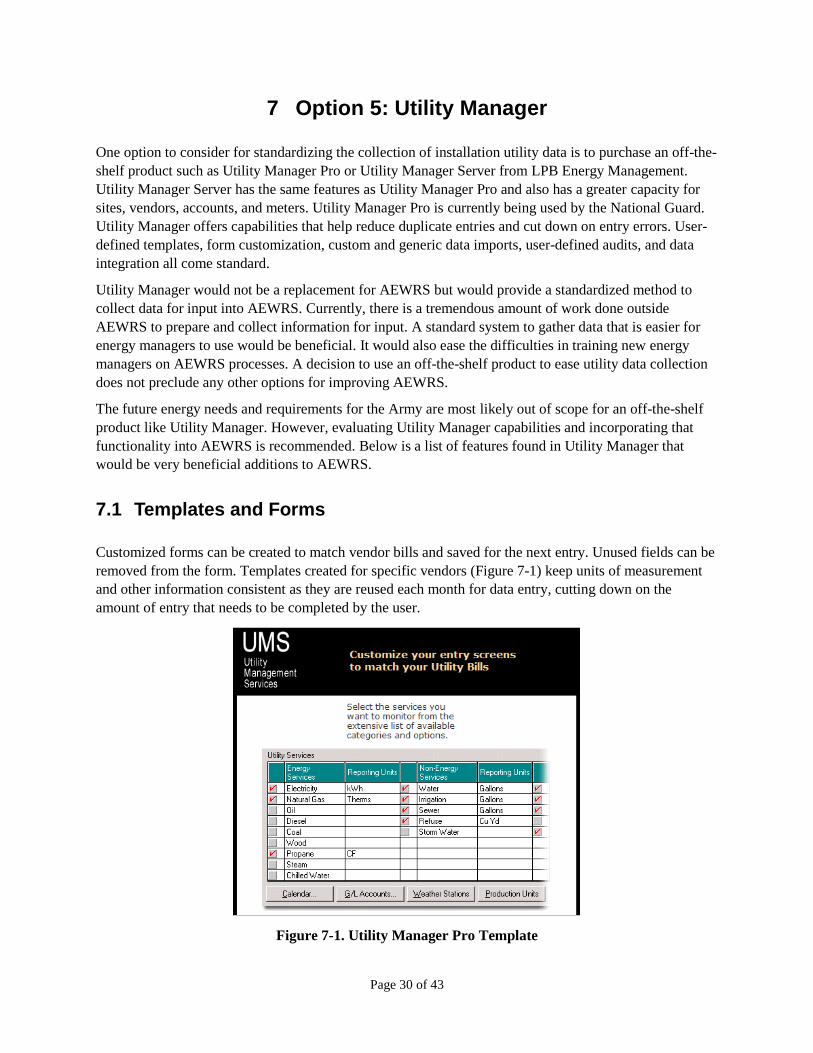
Page 30 of 43
7 Option 5: Utility Manager
One option to consider for standardizing the collection of installation utility data is to purchase an off-the-
shelf product such as Utility Manager Pro or Utility Manager Server from LPB Energy Management.
Utility Manager Server has the same features as Utility Manager Pro and also has a greater capacity for
sites, vendors, accounts, and meters. Utility Manager Pro is currently being used by the National Guard.
Utility Manager offers capabilities that help reduce duplicate entries and cut down on entry errors. User-
defined templates, form customization, custom and generic data imports, user-defined audits, and data
integration all come standard.
Utility Manager would not be a replacement for AEWRS but would provide a standardized method to
collect data for input into AEWRS. Currently, there is a tremendous amount of work done outside
AEWRS to prepare and collect information for input. A standard system to gather data that is easier for
energy managers to use would be beneficial. It would also ease the difficulties in training new energy
managers on AEWRS processes. A decision to use an off-the-shelf product to ease utility data collection
does not preclude any other options for improving AEWRS.
The future energy needs and requirements for the Army are most likely out of scope for an off-the-shelf
product like Utility Manager. However, evaluating Utility Manager capabilities and incorporating that
functionality into AEWRS is recommended. Below is a list of features found in Utility Manager that
would be very beneficial additions to AEWRS.
7.1 Templates and Forms
Customized forms can be created to match vendor bills and saved for the next entry. Unused fields can be
removed from the form. Templates created for specific vendors (Figure 7-1) keep units of measurement
and other information consistent as they are reused each month for data entry, cutting down on the
amount of entry that needs to be completed by the user.
Figure 7-1. Utility Manager Pro Template
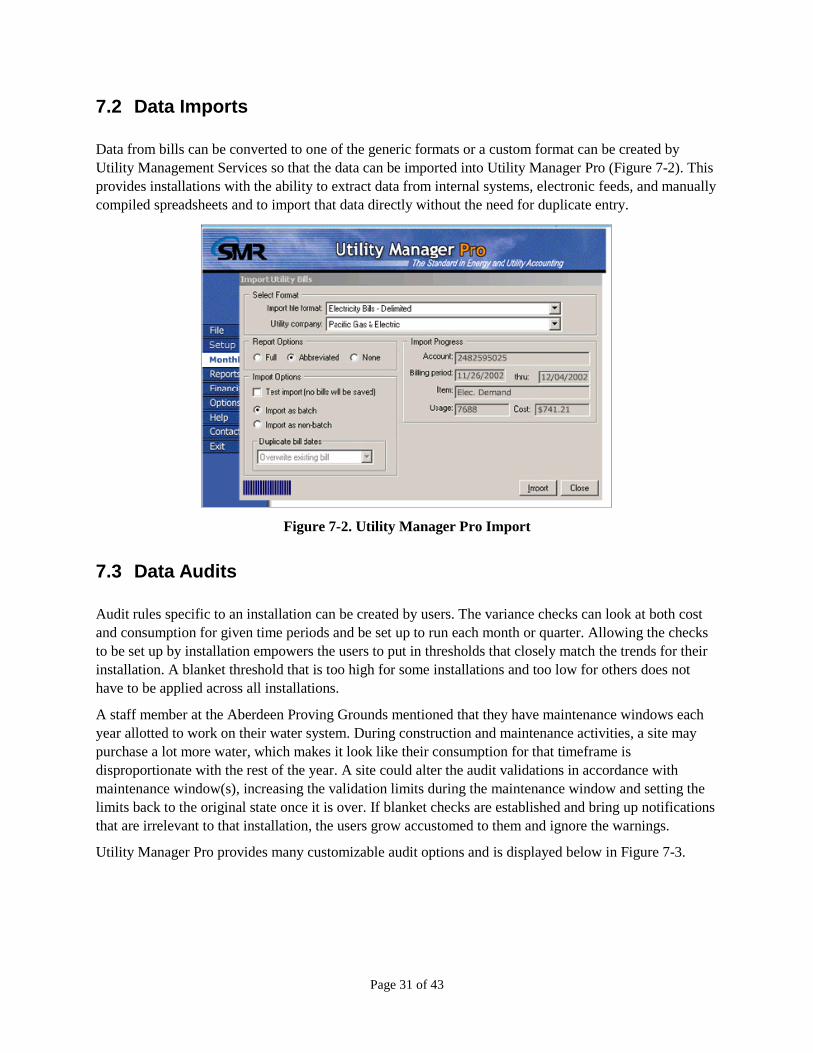
Page 31 of 43
7.2 Data Imports
Data from bills can be converted to one of the generic formats or a custom format can be created by
Utility Management Services so that the data can be imported into Utility Manager Pro (Figure 7-2). This
provides installations with the ability to extract data from internal systems, electronic feeds, and manually
compiled spreadsheets and to import that data directly without the need for duplicate entry.
Figure 7-2. Utility Manager Pro Import
7.3 Data Audits
Audit rules specific to an installation can be created by users. The variance checks can look at both cost
and consumption for given time periods and be set up to run each month or quarter. Allowing the checks
to be set up by installation empowers the users to put in thresholds that closely match the trends for their
installation. A blanket threshold that is too high for some installations and too low for others does not
have to be applied across all installations.
A staff member at the Aberdeen Proving Grounds mentioned that they have maintenance windows each
year allotted to work on their water system. During construction and maintenance activities, a site may
purchase a lot more water, which makes it look like their consumption for that timeframe is
disproportionate with the rest of the year. A site could alter the audit validations in accordance with
maintenance window(s), increasing the validation limits during the maintenance window and setting the
limits back to the original state once it is over. If blanket checks are established and bring up notifications
that are irrelevant to that installation, the users grow accustomed to them and ignore the warnings.
Utility Manager Pro provides many customizable audit options and is displayed below in Figure 7-3.
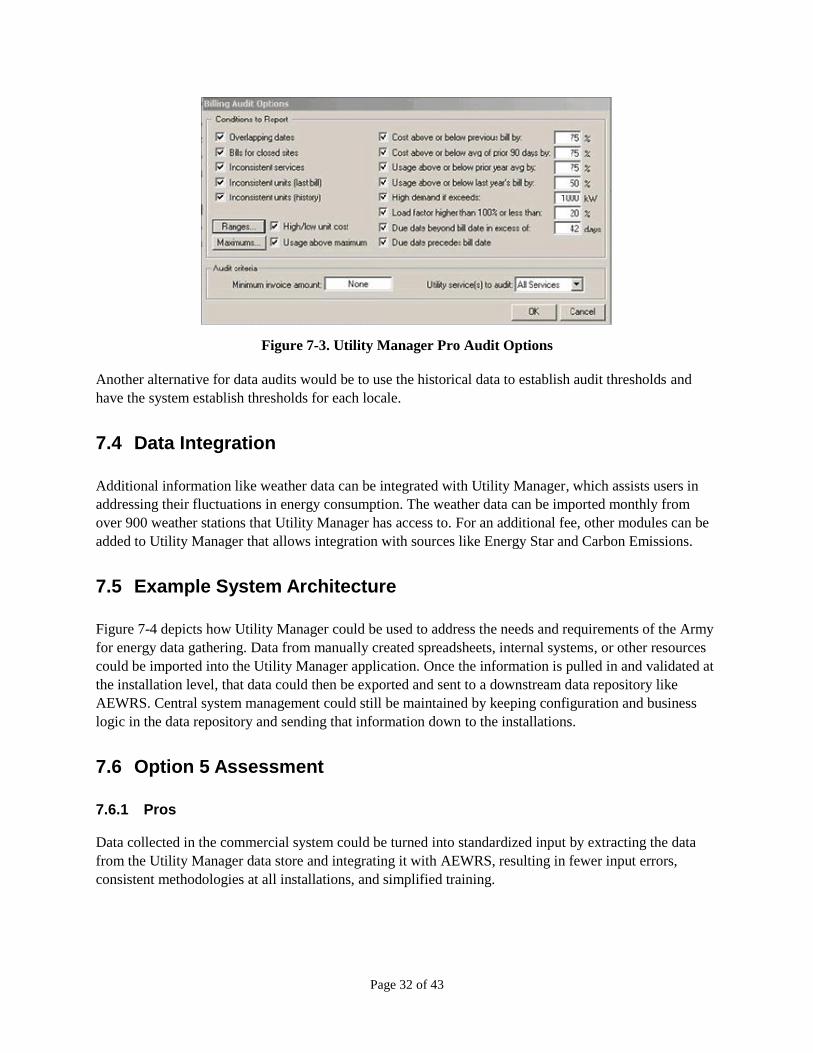
Page 32 of 43
Figure 7-3. Utility Manager Pro Audit Options
Another alternative for data audits would be to use the historical data to establish audit thresholds and
have the system establish thresholds for each locale.
7.4 Data Integration
Additional information like weather data can be integrated with Utility Manager, which assists users in
addressing their fluctuations in energy consumption. The weather data can be imported monthly from
over 900 weather stations that Utility Manager has access to. For an additional fee, other modules can be
added to Utility Manager that allows integration with sources like Energy Star and Carbon Emissions.
7.5 Example System Architecture
Figure 7-4 depicts how Utility Manager could be used to address the needs and requirements of the Army
for energy data gathering. Data from manually created spreadsheets, internal systems, or other resources
could be imported into the Utility Manager application. Once the information is pulled in and validated at
the installation level, that data could then be exported and sent to a downstream data repository like
AEWRS. Central system management could still be maintained by keeping configuration and business
logic in the data repository and sending that information down to the installations.
7.6 Option 5 Assessment
7.6.1 Pros
Data collected in the commercial system could be turned into standardized input by extracting the data
from the Utility Manager data store and integrating it with AEWRS, resulting in fewer input errors,
consistent methodologies at all installations, and simplified training.

Page 33 of 43
7.6.2 Cons
This option would only address the gathering of utility data. It does not include non-utility information
like energy projects, contracts, or conservation measures.
Fort Bragg
Fort Drum
Fort Lewis
Fort Rucker
Installations
AEWRS
Configuration Files
UtilityManager
UtilityManager
UtilityManager
UtilityManager
Headquarters can maintain contact lists, standard lookups, standard templates, etc. and dispatch them down to the installations
Business Logic
Headquarters can maintain algorithms, calculations, high-level thresholds and validations, etc. and dispatch them down to the installations
Figure 7-4. Utility Manager Energy Data Gathering Diagram

Page 34 of 43
7.6.3 Cost
Utility Management Services has two versions available based on the size of the client’s environment.
The list cost of the software is between $10K and $20K per installation, which could be subject to
negotiation depending on the number of deployments. At roughly 200 installations, it would be $2M to
$4M3 to implement a Utility Management Services solution at list price. However, the National Guard has
a negotiated rate of only $1,800 per state with an additional 5% discount. This works out to a monthly
cost per state for the National Guard of only $143. Assuming an additional 200 installations would
require an installation license, the total per year would be approximately $360K. This includes support for
1 year and a license to install the software on up to 5 computers per state. For most installations, the
lighter version (Utility Manager Pro) would be sufficient. Utility Manager Pro can be upgraded to Utility
Manager Server at a later time if necessary. There may also be costs for customizations, support, and
training.
3 These estimates are subject to negotiation and depend on the number of installations that would need the software.
Page 35 of 43
8 New Capabilities
This section describes new capabilities AEWRS could be used to fulfill. These new capabilities are best
supported by redesigned system architecture (e.g., Option 2 or better).
8.1 DoD Energy Reporting Requirements
There is an increasing need to capture and report detailed information on energy consumption and
capabilities throughout all of DoD. Much of the data is not currently contained in AEWRS and is not part
of the annual report. Including all of the capabilities identified by the Energy Working Group would
expand AEWRS into an energy performance management system actively used by all levels of command
rather than a system focused on creating the annual Army Energy Management Report.
The Army Audit Agency indicated a detailed gap analysis of AEWRS and the identified Energy Working
Group capabilities and objectives would be performed by them in the future. The capabilities and
objectives from the working group are included in Appendix A.

Page 36 of 43
9 Summary
It is recommended that AEWRS be redesigned to satisfy the growing list of requirements from the DoD
and Army headquarters. These requirements include an expanding list of data sources that must be
integrated, the need for enhanced reporting capabilities, and the many new data elements that must be
entered and tracked. From the assessment, it is apparent that the current system architecture cannot
support the future needs of the Army. Additionally, the current user interface for AEWRS is very
awkward and time consuming to use. A new interface could be a tremendous improvement if designed
carefully and focused on improving the user experience and reducing input errors.
Regardless of which option is selected for improving AEWRS, expanding the current methodology to
include industry best practices is strongly recommended. The top priorities are utilizing code versioning
and creating a separate test environment, formalized change control processes, and formalized testing
methodologies.

Page 37 of 43
Appendix A. Energy Working Group Identified Capabilities
and Objectives
The Energy Data and Capabilities Master 20101207 spreadsheet from the Energy Working Group
includes the following needed capabilities and objectives. A detailed gap analysis of AEWRS will be
completed by the Army Audit Agency and identify needs.
1. Asset and Geographic Information
a. Identify real property asset, type, location, condition, size, age (year built), owner,
reimbursable users, non-reimbursable users, interest type, operational status, construction
type, and material.
b. Identify major improvements to a facility to include conversions and renovations.
c. Identify (by type) the number of meters planned to be installed by reporting entity and by
year, and the planned cost amount.
d. Identify real property asset and site metering types and locations.
e. Identify temperature (UOM, UOM Code) and degree days by site.
f. Identify the reporting inclusion classifications (Goal, Excluded, Covered, Not-Covered) at the
constructed asset level.
g. Identify data associated with energy-consuming equipment and systems by system type, age,
capacity, manufacturer, and energy performance rating.
h. Identify facility hours of operation and workload.
2. Energy Consumption
a. Determine energy consumption and calculate intensity by type at the site level (from utility
bill) and at constructed asset level and/or at the asset allocation FAC code level.
b. Compare energy consumption by type to historical data at the constructed asset level and/or
at the asset allocation FAC code level.
c. Compare all types of energy consumption by real property FAC code and/or by asset
allocation FAC code and associated size.
d. Track energy consumption by location and climate zone.
e. Measure the amount of energy consumed in a constructed asset by meter.
f. Derive source energy amount from a site-delivered amount of energy.
g. Establish targets and monitor energy consumption against those targets at the component/
installation/constructed asset level.
h. Report performance against external energy consumption targets at the component and
installation level.
i. Forecast facility energy consumption based on
a) Historical consumption in that facility
b) Climate history data for the facility
c) Location from an authoritative source

Page 38 of 43
d) Consumption data from similar facilities (same building use, size, climate zone, age).
3. Utility Cost and Billing Information
a. Determine actual and/or projected total utility costs for energy provider(s) by energy type and
by location (site and installation).
b. Account for reimbursable vs. non-reimbursable utility costs at the constructed asset level.
c. Identify peak demand and hours at the site level (from the utility bill) and the constructed
asset level (from meters).
d. Access utility provider information (vendor identification, tariff information).
4. Identify reporting entity for energy consumption, production, or purchase.
5. Asset Design
a. Identify the standard(s) that a facility is measured against.
b. Determine the level of achievement of the facility relative to the standard(s).
c. Identify inclusion in the FEMP High Performance Buildings Database
(http://eere.buildinggreen.com/).
6. Energy Evaluation and Benchmarking
a. Benchmark and track results for a constructed asset, including asset size (area), type,
consumption, and Energy Star label and rating information.
b. Track completed energy evaluations at the constructed asset level (commissioning and audit).
7. Energy Conservation Measures (ECMs) Identification
a. Identify and track all ECMs associated with each facility (RPUID).
b. Aggregate and report all ECMs by location (RPSUID and Installation Code).
c. Provide information needed to assess the contribution of the ECM to the site or facility
energy security.
d. Track status of each ECM at the constructed asset level.
e. Track when each ECM is complete/operational (placed in service) by RPUID.
f. Identify the estimated cost of ECMs at the constructed asset level.
g. Identify and track the type of acquisition (example, in-house, ESPC, etc.) associated with
each ECM.
8. Energy Conservation Measure Performance
a. Identify estimated annual and life-cycle energy consumption and cost avoidance by energy
type and cost avoidance type (BTUs and O&M) based on historical consumption data or
benchmarking associated with each ECM at the constructed asset level.
b. Identify Savings-to-Investment Ratio and Pay Back Period—based on historical consumption
data or benchmarking—associated with ECMs.
c. Identify the measurement and verification date and methodology for each implemented ECM.
d. Measure and verify actual energy savings/cost avoidance generated by each implemented
ECM.

Page 39 of 43
9. Project Performance/Implementation
a. Identify project name, number, type, sub-type, technology type, status, and actual and
estimated status date implementing each ECM associated with each RPUID.
b. Track project estimated and/or actual total cost amount and project status to date, fund
code(s), funding organization(s), appropriation/ funding year, award date(s) (Project Status
and Date), programmed/appropriation amount, and obligation amount(s).
c. Link the approval document (e.g., DD1391) to project information.
10. Qualification and Training
a. Identify and obtain contact, certification and training information for the energy managers.
b. Quantify persons obtaining energy training each year and the associated cost at a given
installation/site to include both energy managers and other personnel.
11. Renewable Energy Project Identification
a. Identify each renewable project by energy type and location.
b. Link renewable energy project to an asset type of Real Property (RPUID) or Personal
Property.
c. Identify renewable energy project name, number, type, sub-type, technology type, and actual
or estimated status date.
d. Identify and track the acquisition mechanism (example, in-house, ESPC, etc.) associated with
each renewable energy project at the ECM level.
e. Identify renewable energy project ownership type (DoD Platform/DoD Producing Asset,
DoD Platform/Other Entity Producing Asset, Other Entity Platform/Other Entity Producing
Asset).
12. Renewable Energy Project Performance/Implementation
a. Identify renewable energy projects that supply energy to DoD that is not transmitted by or
contributing to a commercial electrical grid.
b. Track renewable energy project estimated and/or actual total cost amount, fund code(s), fund
organization(s), appropriation/funding year, award date(s) (Project Status and Date),
programmed/appropriation amount(s), and obligation amount(s).
c. Measure unit of renewable energy consumed from each renewable energy project by time
period and location (site) and climatic conditions.
d. Measure units of renewable energy actually produced from each renewable energy project by
time period, location (site), and climatic conditions.
e. Determine estimated units of renewable energy to be produced from each renewable energy
project by time period, location (site), and climatic conditions.
f. Measure performance of renewable energy project relative to estimated performance.
13. Renewable Energy Certificates (RECs) Retained
a. Account for RECs retained from renewable energy produced by each DoD component.
14. Purchased renewable energy
a. Account for each type, units and cost of renewable energy purchased.

Page 40 of 43
b. Identify the production location (energy role, postal code) and consumption location for
purchased renewable energy.
c. Account for the type, units and total cost of RECs purchased by each DoD component.
15. Planned Renewable Energy Purchase
a. Forecast each type, units, and cost of renewable energy planned to be purchased.
b. Forecast each type, units, and cost of RECs planned to be purchased.

Page 41 of 43
Appendix B. PNNL Example Web Applications
The URLs below are examples of web applications that PNNL has developed in domains comparable to
AEWRS. The sites show how enhanced and more user friendly interfaces can improve usability and
reduce data entry. The Department of Energy’s Building Energy Codes Program applications employ web
services to exchange data with other applications. Commercial Lighting Solutions uses modern web
interface technologies to provide a more interactive user environment that guides users through a series of
data inputs.
Department of Energy’s Building Energy Code Program Applications
http://energycode.pnl.gov/REScheckWeb/
http://energycode.pnl.gov/COMcheckWeb/
http://energycode.pnl.gov/SampleGen/
Commercial Lighting Solutions
https://www.lightingsolutions.energy.gov/comlighting/login.htm
Figure B-1. Building Energy Codes Program’s Sample Generator

Page 42 of 43
Figure B-2. Commercial Lighting Solutions Application

Page 43 of 43
Appendix C. Interviewed Organizations’ Individuals
Aberdeen Proving Ground (APG)
Anh Dang, Energy Program Manager
Tim McNamara, Deputy to the Garrison Commander
Assistant Chief of Staff for Installation Management (ACSIM)
Benu Arya
Ron Diehl
William Eng
Valerie Hines
Cecile Holloway
Steve Kaiser
David Purcell
Randy Smidt
Paul Richardson
Doug Waters
Deputy Assistant Secretary of the Army (DASA)
Paul Volkman
National Guard HQ
CW3 Christopher Swihart
Pacific Northwest National Laboratory (PNNL)
Marcus De La Rosa
Doug Dixon
Bryan Russo
US Army Audit Agency (USAAA)
Kimberly Craig
Brian Desvignes
Robin Gibbs
Clarence Johnson, Jr
Devyn Pulliam

Page 44 of 43