armstrong laboratory risk assessment of polychlorinated …
TRANSCRIPT

AL/OE-TR-1996-0153
mr~
UNITED STATES AIR FORCE ARMSTRONG LABORATORY
Risk Assessment of Polychlorinated Biphenyls (PCBs) On-Board Navy
Ships
i •'■■ 19970520 036
: •■:■■;■■.■ BJ.Larcom/ArA:A^ .>;. A
WRIGHT-PA1TERSON AFB, OH 45433-7400
US, ARMY MEDICAL RESEARCH DETACHMENT WALTER REED ARMY INSTITUTEQF RESEARCH
WRIGHT-PATTERSON AFB, OH 45433-7400
■:■; ■■ - ■ ;■ EM Merrill \y, A
OPERATIONAL TECHNOLOGIES CORP. 1010 WOODMAN DRIVE; SUITE 160
DAYTON, Qhf 45432
';;-V ■• WW Jederberg
NAA/AL MEDICAL RESEARCH INSTITUTE ^ TOXICOLOGY DIVISION
WRIGHT-PATTERSON AFB; OH 45433-7903
_-/
^fflC QUAUTY INSPBCTBO 8 December 1996
NMRI-96-72 WRAIR/TR-96-0007
Approved for public release;
distribution is unlimited.
**• -.^.».-i^äWBB
NOTICES;
When US Government drawings, specifications or other data are used for any purpose other than ä definitely;; related Government procurement operation, the Government thereby incurs no responsibility nor any■]) obligation whatsoever, and the fact that the Government may have formulated, furnished, or in any way,' | supplied the said drawings, specifications, or other data is not to be regarded by implication or otherwise, as in '\ any manner licensing the holder or any other person or corporation, or conveying any rights or permission to- j manufacture, use, or sell" any patented invention that may in any way be related thereto.
Please do not request-copies'of this report from the Armstrong Laboratory. Additional copies may.|«| purchased from: ■
i ' , NATIONAL TECHNICAL INFORMATION SERVICE • M
\ " f 5285 PORT ROYAL ROAD • " SPRINGFIELD, VIRGINIA 22161 ., -" V<
Federal Government agencies and their contractors registered with the Defense Technical Information Center i should direct requests for copies of this report to:
DEFENSE TECHNICAL INFORMATION CENTER ■8725 JOHN J.KINGMANRD STE0944 '
- , FTBELVOIRVA 22060-6218 ■ ,
DISCLAIMER This Technical Report is published as received and has not
been edited by me Technical Editing Staff of the Armstrong ' ' ^ti ■■ - - Laboratory. • . • / 'ÄSl
TECHNICAL REVIEW AND APPROVAL
AL/OE-TR-1996-0153 WRAIR/TR-96-0007
NMRI-95-72
This report has been reviewed by the'Office of Public Affairs (PA) and is releasable to the National Technical Information Service (NTIS).; At NTIS, it. will be available to the general public, including foreign nations
This technical report has been reviewed and is approved for publication.
FOR THE COMMANDER
TERRY A, CHILpRESS, Lt Col, USAF.'BSC; Director, Toxicology Division' Armstrong Laboratory •

REPORT DOCUMENTATION PAGE Form Approved OMB No. 0704-0188
Pubic reporting burden for this collection of information is est.mated to average 1 hour per response, including the time for reviewing instructions, searching existing data sources gathering and maintaining the data needed, and completing and reviewing the collection of information. Send comments regarding this burden estimate or any other aspect of this collection of «-.formation including suggestions for reducing this burden to Washington Headquarters Services, Directorate for Information Operations and Reports. 1215 Jefferson Davis Highway Suite 1204 Arlington VA 22202- 4302. and to the Office of Management and Budget. Paperwork Reduction Project (0704-0188), Washington, DC 20503
1. AGENCY USE ONLY (Leave Blarrk) 2. REPORT DATE
December 1996 3. REPORT TYPE AND DATES COVERED
Interim - July 1995 - December 1996 4. TITLE AND SUBTITLE
Risk Assessment of Polychlorinated Biphenyls (PCBs) On-BoardNavy Ships
6. AUTHOR(S)
B.J. Larcom, J.M. Cline, E.A. Merrill, W.W. Jederberg, K.R. Still
7. PERFORMING ORGANIZATION NAME(S) AND ADDRESS(ES)
Operational Technologies Corporation 1010 Woodman Drive, Suite 160 Dayton, OH 45432
SPONSORING/MONITORING AGENCY NAME(S) AND ADDRESS(ES)
Armstrong Laboratory, Occupational and Environmental Health Directorate Toxicology Division, Human Systems Center Air Force Materiel Command Wright-Patterson AFB OH 45433-7400
11. SUPPLEMENTARY NOTES
5. FUNDING NUMBERS
Contract F41627-94-D-9003/003 PE 62202F PR 7757 TA 7757A2 WU 7757A205
8. PERFORMING ORGANIZATION REPORT NUMBER
10. SPONSORING;MONITORING AGENCY REPORT NUMBER
AL/OE-TR-1996-0153 WRAIR/TR-96-0007 NMRI-96-72
12a. DISTRIBUTION/AVAILABILITY STATEMENT
Approved for public release; distribution is unlimited.
12b. DISTRIBUTION CODE
13. ABSTRACT (Maximum 200 words)
Shipyard workers and active duty personnel have the potential to be exposed to various congeners of Polychlorinated Biphenyls (PCBs) during operational, maintenance and disposal scenarios. On 6 December 1994 the US Environmental Protection Agency (EPA) proposed a revision of the PCB ruling which would significantly impact Navy O & M costs and limit options for disposal of ships and submarines. The significant drivers to the EPA criteria were assessed. Additional occupational samples were collected to provide a statistically significant data base from which to evaluate possible exposure. No samples were identified with PCB in the vapor phase, therefore, inhalation was not considered a pathway of concern. Dermal exposure was found to be the only potential exposure route. A probabilistic risk assessment was conducted for both shipyard workers and crew members. The level of risk was determined to be acceptable for both active duty and shipyard workers. The approach presented here is applicable for PCB exposure in all three services.
14. SUBJECT TERMS
Polychlorinated Biphenyls Risk Assessment Submarines
15. NUMBER OF PAGES
72
16. PRICE CODE
17. SECURITY CLASSIFICATION OF REPORT
UNCLASSIFIED
18. SECURITY CLASSIFICATION OF THIS PAGE UNCLASSIFIED
19. SECURITY CLASSIFICATION OF ABSTRACT UNCLASSIFIED
20. LIMITATION OF ABSTRACT
UL
NSN 7540-01-280-5500 Standard Form 298 (Rev. 2-89) Prescribed by ANSI Std. Z39-18 298-102

THIS PAGE INTENTIONALLY LEFT BLANK
11
TABLE OF CONTENTS
SECTION PAGE
LIST OF FIGURES iv LIST OF TABLES iv
PREFACE AND ACKNOWLEDGEMENTS v ABBREVIATIONS vi INTRODUCTION 1
Background 1 Scope 2
SUMMARY OF PROPOSED RULE CHANGE 3 Background 3 Key Sections of Proposed Rule 3
ANALYSIS OF CRITERIA USED IN PCB REGULATION 7 ACGIH Guidelines for PCBs 7 NIOSH Recommendations for PCBs 8 IARC Recommended Criteria 9 USEPA Surface Contamination Standards 11 USEPA PCB Cancer Potency Factor 12
TOXICITY 14 Available Epidemiology Data 14 Review of Experimental Dose Response Studies 15 USEPA's Carcinogenicity/Potency Designation 17 PCB Health Effects Summary Conclusion 18
ENVIRONMENTALAND OCCUPATIONAL EXPOSURE ASSESSMENT 19 Scenarios .19 Characterization of PCB Contamination on Navy Vessels 22 Background Levels of PCB 38
RISK CHARACTERIZATION 42 RECOMMENDATIONS 47 REFERENCES 49 APPENDIX A:
Assumptions Used in Probabilistic Risk Assessment A-1 APPENDIX B:
Risk Characterization Forecast Statistics B-1
HI

LIST OF FIGURES
FIGURE PAGE
1 Risk Assessment Conceptual Model 20
2 Forecast: Riskto Active Crew 45
3 Forecast: Risk to Shipyard Workers 45
4 Target Forecast: Risk to Active Crew 46
LIST OF TABLES
TABLE PAGE
1 Summary of Occupational Sampling Conducted by Bremerton 24 Naval Hospital: Submarine Dismantling Operations
2 8-Hour TWAs for Steel Shot & Sand Blasting Operations 27
3 8-Hour TWAs for Needle Gunning Operations 28
4 8-Hour TWAs for Hand Chipping Operations 28
5 Summary of Solid Sample Results Classified by Function 29
6 Inactive Ships PCB Survey Results - 25 April 1994 30
7 Statistical Summary of PCB Bulk Samples by Material Type 31
8 Statistical Summary of PCB Swipe Samples by Submarine Component .33
9 Statistical Summary of Swipes taken from "High Contact" Surfaces 34
10 TCLP Results from Shipboard Materials 37
11 Exposure Factor Assumptions 43
IV

PREFACE AND ACKNOWLEDGEMENTS
Animals were not used in this study. The authors would like to acknowledge the technical support of Dr Joseph Prince, Ms Teri Sterner and SSG Bill Herman. Outstanding on-site support was provided by Ms Penny Jones, Puget Sound Naval Shipyard and Mr. Greg Martinen, Bremerton Naval Hospital. Laboratory analysis was conducted by Mr. George Lindsay and Mr. Ray Collins, Navy Environmental Preventive Medicine Unit #2. Quality control and assurance was performed by LT Paul Son, MSC, USN, Naval Medical Research Institute Detachment (Toxicology). Funding was provided by Naval Sea Systems Command; Navy coordination and direction was provided by Ms. Andrea Lunsford, Navy Environmental Health Center. The opinions and assertions contained herein are those of the authors and are not to be construed as official or reflecting the view of the Navy Department or Naval Service at large.

LIST OF ABBREVIATIONS
ACGIH American Conference of Governmental Industrial Hygienists ATSDR Agency for Toxic Substances and Disease Registry CERCLA Comprehensive Environmental Response Compensation and
Liability Act DOD Department of Defense DOE Department of Energy GC Gas Chromatography HEPA High Efficiency Particulate Air IARC International Agency for Research on Cancer IEHR Institute for Evaluating Health Risks LADD Lifetime Average Daily Dose LOD Limit of Detection NAVSEA Naval Sea Systems Command NCF NAVSEA Copy Files NCI National Cancer Institute ND Non-Detect NIOSH National Institute for Occupational Safety and Health OSHA Occupational Safety and Health Administration PCB Polychlorinated biphenyls PCDD Polychlorinated dibenzodioxins PCDF Polychlorinated dibenzofurans PEL Permissable Exposure Limit PPE Personal Protective Equipment PSNS Puget Sound Naval Shipyard QA/QC Quality Assurance/Quality Control RCRA Resource Conservation and Recovery Act REL Recommended Exposure Limit STEL Short Term Exposure Limit TCLP Toxicity Characteristic Leaching Procedure TLV Threshold Limit Value TSCA Toxic Substances Control Act TWA Time Weighted Average USEPA United States Environmental Protection Agency
VI

INTRODUCTION
Background
Older Department of Defense (DOD) systems employed a variety of components which have been identified as containing polychlorinated biphenyls (PCBs) either as contaminants or as part of the formulation. These PCB articles were selected for their performance characteristics including fire retardant properties. The Navy has, for some years, been gathering data on the extent of the distribution of these PCB articles throughout the weapon systems and the level of their PCB contamination.
Proposed rule changes to 40 CFR 761 "PCB Manufacturing, Processing, Distribution in Commerce and Use Prohibitions" published on 6 Dec 1994 has the potential to significantly impact Naval operations and disposal efforts. Although the proposed rule changes included corrective actions enabling the Navy to continue employing its weapon systems, it included added authorizations, monitoring, disposal, labeling and risk management requirements. Potential actions of concern to the Navy include: 1) continued operation of the systems by either Navy personnel or operation by foreign nationals after a foreign military sales action; 2) eventual dismantling and disposal of the systems, and 3) disposal of entire systems at sea, either as a result of use as targets or as artificial reefs for ecological enhancement. Each of these options may pose a risk to the environment or to human health if the PCBs are released.
The US Navy is actively reducing the number of older vessels, including submarines, which contain PCB materials primarily as additives or contaminants in paint, electrical cable, insulation materials and rubber. The Navy has interests in the remediation of PCB-contaminated sites, disposal of non-remediation materials, authorized use of PCBs, monitoring requirements and PCB record keeping. On-going operations and maintenance activities periodically involve removal, repair and replacement of contaminated materials. The maintenance processes involve removal of the items and yield exposure to bulk materials, airborne debris from chipping, needle-gunning and blasting processes. From a mass balance perspective, the removed material will eventually appear as fugitive emissions or, more likely, as waste streams of contaminated media and solid waste requiring disposal.
PCBs were produced in the United States (principally by Monsanto as Aroclors 1221, 1232, 1242, 1248, 1254, 1260, 1262, and 1268) for use in closed systems (capacitors and transformers) and open systems such as plasticizers, coatings, inks, and as a fire retardant or an extender in various organic compounds. The Agency for Toxic Substances and Disease Registry (ATSDR) Toxicology Profile contains a review of the chemical and physical characteristics and production and import information (ATSDR, 1993). In 1974, PCB use was restricted to electronic applications in "closed" systems. In the US, production was stopped in 1979. Disposal is limited to che/nical waste landfills, incineration and high-efficiency boilers. US Environmental Protection Agency (USEPA)
1

studies show environmental levels of PCBs have significantly declined since 1980 (ATSDR, 1993).
Scope
The Navy spends an estimated $4 billion annually for vessel maintenance tasks. Should the USEPA-proposed rules be promulgated, the Navy will need to consider its future fiscal planning estimates as added costs will occur. The estimated cost to the Navy for the first year of compliance with the proposed ruling would be $1,150 million; this estimation includes the new sampling and labeling requirements, management of PCB materials for disposal and concrete pad removal at shore facilities with transformers. The annual costs for subsequent years would be approximately $563 million per year, which would include new use conditions and disposal management during maintenance (NCF (NAVSEA Copy Files) #1).
Results reported herein represent a three and one-half month effort to support the Navy in defining an approach for a PCB human health risk assessment and documenting the status of existing data. Through a three phase contractual effort, three objectives were pursued: 1) review of the science and its effectiveness in the current PCB compound specific risk analysis; 2) assess the criteria used in setting the proposed rule changes, and 3) examine means to improve exposure characterization for occupational and environmental scenarios. Additionally, an evaluation and summarization of USEPA Toxic Substances Control Act (TSCA) Docket files of comments on the proposed rule were conducted on relevant correspondence; Naval Sea Systems Command (NAVSEA) files on PCBs were indexed and relevant information on human health risk was summarized.
No empirical or laboratory effort was conducted under this effort; only review of the literature and analysis of existing data were included in the scope. The Navy, under separate but parallel efforts, acquired additional data on potential submarine contamination levels. These data were statistically analyzed and the results are reported here along with further characterization of exposures. Literature on toxicology, human health effects, dose-response assessment and criteria documentation were reviewed and assessed. Results reported from this effort are provided to the Navy for determination if sufficient baseline data are available to perform risk-based decision making on alternatives to PCB article disposal.
This effort consisted of: 1) summary of proposed rule change; 2) concurrent literature search; 3) analysis of the scientific basis for current PCB risk criteria; 4) toxicology summary; 5) environmental and occupational exposure assessment; 6) risk characterization, and 7) recommendations.

SUMMARY OF PROPOSED RULE CHANGE
The USEPA has proposed an amendment to its rules under TSCA for disposal of PCBs per 59 FR 62788, 6 Dec 1994 for revision of 40 CFR 761. The proposed ruling includes:
New requirements for determining PCB concentration Marking, storage, and disposal requirements Decontamination levels and procedures Reporting and record keeping requirements for PCBs, PCB items, and environmental media contaminated with PCBs or PCBs commingled with radioactive materials New references and definitions New authorizations and exemptions Registration on certain electrical transformers Regulation on combustion in industrial furnaces Regulation on disposal of liquids in landfills Coordination of PCB disposal approval with other Federal and State programs Revision of the reportable quantity in the spill cleanup policy Coordination of remediation strategies of PCBs with Resource Conservation and Recovery Act (RCRA) and Comprehensive Environmental Response Compensation and Liability Act (CERCLA) provisions.
TSCA Section 6(e)(1)(A) allows the USEPA to promulgate rules prescribing methods of PCB disposal. TSCA Section 6(e)(1)(B) provides the USEPA with the authority to promulgate rules to require marking of PCB items. TSCA Section 6(e)(3)(B) provides that any person may petition USEPA for an exemption from the prohibition on the manufacture, processing and distribution in commerce of PCBs. The USEPA may grant an exemption if an unreasonable risk of injury to health or the environment would not result.
Background
PCB-contaminated would mean anything that contains or contacts PCBs at concentrations of 50 parts per million (ppm) to less than 500 ppm. For surfaces, PCB concentrations greater than 10 micrograms per 100 square centimeters (10 ^g/100 cm2) and less than 100 (o.g/100 cm2 would be defined as PCB-contaminated.
Key sections of proposed rule
Several key sections of the proposed rule that would potentially affect submarine decommissioning (e.g., sale to foreign government, disposal, or ocean sinking) include:
• Authorizations, pre-TSCA uses of PCBs • PCB non-remediation wastes
Disposal of PCB/radioactive wastes Disposal of PCB-bound materials Disposal of small capacitors Disposal of solvents Transboundary movement of PCBs for disposal Oil-filled equipment manufactured after the ban Appendix III: "Sampling Non-Liquid, Non-Metal Non Remediation Waste Generated by Processing Materials Containing Recyclable Metals"
Authorizations, pre-TSCA uses of PCBs
Section 761.30(q) would authorize the continued use of PCB articles, at any concentration in use prior to 1979, provided there is monitoring, the material remains intact and does not pose an unreasonable risk. It does not include removal. This section would establish the National Institute for Occupational Safety and Health (NIOSH) recommended exposure level as the occupational exposure permissible exposure criteria and includes an associated surface level contamination criteria. Disposal of PCB articles would need to comply with these requirements; exceptions to these constraints are identified.
PCB non-remediation wastes
These items would include non-liquid bulk waste or debris from human-created structures where construction materials were manufactured or coated (e.g., paint containing PCBs), PCB-impregnated electrical, sound-deadening or other types of insulation and gaskets and all other PCB items or PCBs not otherwise specified in Section 761.60. The USEPA-preferred disposal method as proposed by Section 761.62 is a well-engineered and operated solid waste landfill with appropriate monitoring to detect PCB release to the environment. The proposed rule would allow the applicant to request disposal by incineration, chemical waste landfill or alternative disposal method approved by the Regional Administrator upon application. However, non-uniform concentrations may result in specified limitations per Section 40 CFR 761.62(c)(4). In accordance with 40 CFR 761.62(c), the applicant could make a risk-based disposal request. An alternative to risk-based TSCA disposal approval would be leachability- based disposal per 40 CFR 761.62(b). If the waste, as measured by the Toxicity Characteristic Leaching Procedure (TCLP), is less than 50 micrograms per liter, the waste could be disposed of in a municipal solid waste landfill provided the landfill is notified 15 working days in advance of receipt of the waste. The USEPA sought comments on these self-implementing options of non-remediation wastes under Section 761.62(b). The third proposed disposal option under Section 761.62(a) would allow performance-based disposal in a TSCA-approved incinerator or chemical waste landfill. This option would be viable in cases where the waste had high levels of leachable PCBs or costs were prohibitive for a risk-based disposal approval under the proposed Section 761.62(c).

Disposal of PCB/radioactive wastes
Because of the potential for PCB to be commingled with radioactive waste, this proposed rule would amend 40 CFR 761.65 to allow self-implementation and case-by- case extensions to the one-year time limit for storage and disposal requirements for both PCB and PCB/radioactive wastes. However, the extension would be granted only if there are no unreasonable risks of injury to health or the environment and it can be demonstrated that relevant treatment or disposal actions are being pursued. New PCB/radioactive waste definitions are proposed in Section 761.3. Because of the limited capacity of the Department of Energy (DOE) Oak Ridge incinerator, the USEPA recognizes that PCB/radioactive wastes would require storage beyond the one-year limit. However, periodic extension requests would still be required.
Disposal of PCB-containing materials
The USEPA proposed definition of PCB-containing materials would include the plastic insulating material in electrical cable, or lead cable insulated with PCB oil-soaked paper. The lead cable is used in high voltage distribution of electric power, i.e., 5,000 volts and above. The USEPA welcomed information on any use of electrical cable containing PCBs and potential risks of exposure to workers, the public, and the environment. Cable decontamination procedures would be regulated. "Open burning" of PCB oil-soaked paper in scrap yards would be subject to enforcement action.
Disposal of small capacitors
Proposed TSCA disposal requirements for PCB capacitors are provided at Section 761.60(b)(2). PCBs as a hazardous substance under CERCLA have a reportable quantity of one pound. If fluorescent light ballasts containing PCB small capacitors exceeding one pound are placed in a disposal drum, the situation would generally be regarded as a reportable release under CERCLA Many facilities are disposing of their light ballasts or small capacitors in TSCA incinerators to simply avoid Superfund liability should the municipal landfill become subject to a CERCLA cleanup action. Twenty-five light ballasts would probably exceed the one pound reporting requirement, as each ballast has about 0.67 ounces of PCBs.
Disposal of solvents
The disposal of solvents exceeding 50 ppm PCBs would need to be in a TSCA approved facility per Section 761.79. The proposed rule would allow disposal of hydrocarbon solvents with less than 50 ppm PCBs, per Section 761.20(e) or decontamination by processes such as filtration.

Transboundary movement of PCBs for disposal
Current regulations in 40 CFR 761.20(b)(2) promulgated under provisions of Section 6(e) of TSCA authorize the import and export for disposal of PCBs only at concentrations less than 50 ppm. It is proposed per Section 761.20(b)(3) to create certain categorical exceptions to the general ban on import for disposal of PCBs at 50 ppm or greater. Sections 761.20(b)(4) and (c)(3) would not allow import or export of PCBs at 50 ppm or greater for purposes other than disposal (including import for use, reuse, or recycling). This restriction could have significant impact on the Navy's ability to sell the submarines to foreign governments. The USEPA would allow import of PCB items for disposal on a case-by-case basis where it would not impose an unreasonable risk of injury of health or the environment. The USEPA considers the use of the PCB items owned by the US government overseas, that are then returned to the US, as neither imports nor exports.
Oil-filled equipment manufactured after the ban
On July 2, 1979, a ban was placed on the manufacture of PCBs in oil-filled equipment. If the equipment is certified to contain no PCBs at the time of manufacture, and has not been subsequently serviced with PCB containing fluids, the equipment would not be assumed to be PCB-contaminated and would not be subject to the provisions of 40 CFR 761.
Appendix III: "Sampling Non-Liquid, Non-Metal Non Remediation Waste Generated by Processing Materials Containing Recyclable Metals"
At least 7.5 cups or 100 gram subsamples would be taken from a uniform pile of waste. They would then be combined into a composite sample for PCB analysis.

ANALYSIS OF CRITERIA USED IN PCB REGULATION
Several regulatory standards and recommended criteria on PCBs are currently in existence. Although these represent the present regulatory levels, most were published some time ago and therefore do not reflect newer studies and interpretations of study results. Several of these standards and criteria are discussed in respect to their bearing on current PCB regulation. The American Conference of Governmental Industrial Hygienists (ACGIH) guideline has been adopted by the Occupational Safety and Health Administration (OSHA) as law. The NIOSH and the International Agency for Research on Cancer (IARC) documents currently stand as official recommendations. The surface contamination standard has been used by USEPA in their regulations and their cancer potency factor is currently used in risk assessments. The proposed rule would elevate the NIOSH recommendation to law, superseding the higher OSHA regulatory levels.
ACGIH Guideline for PCBs
Introduction
The Threshold Limit Values (TLVs), set by the ACGIH were not established explicitly on the potential risk of cancer from exposure to PCBs. The TLV committee recommends a TLV-TWA (Time Weighted Average) of 1 mg/m3 for mixtures of 42% chlorine and 0.5 mg/m3 for mixtures of 54% chlorine, with a skin notation for both. These values have been adopted by OSHA as their Permissible Exposure Limits (PELs) and were not changed or evaluated during the 1989 OSHA rule-making on air contaminants.
Basis for guideline
In 1946, the ACGIH began listing PCBs with "toxic dusts, fumes and mists" in its recommendations of maximum allowable concentrations of air contaminants; they recommended an allowable workplace concentration of 1 mg/m3 for all PCBs. The ACGIH continued to recommend this level until 1956, when they specified 1 mg/m3 as the TLV for PCB mixtures containing 42% chlorine and 0.5 mg/m3 for 54% chlorine mixtures (ACGIH, 1956). This recommendation was based upon information in the reports of Schwartz (1936), Drinker (1939), Treon et al. (1956) and Meigs et al. (1954). ACGIH stated that these levels would seem to offer reasonably good protection against systemic toxicity, but may not guarantee complete freedom from chloracne.
In 1961, the ACGIH added the "skin" notation to the TLVs of those substances, including PCBs, which, in liquid form, can penetrate the skin to cause systemic effects (ACGIH, 1961). The skin notation was not intended to include PCBs in solid phase.
ACGIH has repeatedly reviewed the scientific literature and continues to recommend these levels as an adequate exposure value against significant adverse
7

health effects including cancer. The issue of PCBs actually causing cancer in humans remains under current review. The existing data suggest that any role PCBs have in the development of cancer is highly complex. PCBs appear to have little or no genotoxic effects. It is the more highly chlorinated PCBs, i.e., penta- or hexachlorobenzenes, that have the greater carcinogenic potency in rodents; however, toxicity appears to decrease with mixtures exceeding 60% chlorine (Safe, 1994). Hence, the TLV is lower for 54% mixtures than the TLV is for 42% mixtures; no TLVs are specified for 60% or 68% mixtures. There is also inadequate epidemiological evidence for the carcinogenicity of PCBs in regulated occupational settings (ACGIH, 1991).
NIOSH Recommendation for PCBs
Introduction
The criteria for the NIOSH Recommended Exposure Limit (REL) (1 ng/m3), established in 1977, is primarily based on documented cases of chloracne, liver toxicity (Meigs et al., 1954; Hasegawa et al., 1972; Hara et al., 1974, 1975; Ouw et al., 1976; Levy et al., 1977), irritation of skin and mucous membranes (Ouw et al., 1976; Levy et al., 1977), and adverse reproductive effects (Linder et al., 1974; Allen et al., 1974; Barsotti et al., 1976). The studies do not demonstrate that PCBs alone can cause these effects; which increases the conservatism of the initial 1977 NIOSH recommendation. The following paragraphs describe the findings upon which NIOSH based its REL.
Basis for recommended standard
Most of the chloracne cases identified involved work with or around heated PCBs (Birmingham, 1964; Hasegawa et al., 1972; Oliver, 1969; Ouw et al., 1976). In one study at a capacitor manufacturing plant where chloracne was common, PCB vapors were detected at 0.095-0.95 mg/m3 and particulate PCB concentrations were found within the range of 0.02-0.65 mg/m3 (Hasegawa et al., 1972). One major problem with the association of chloracne with PCBs at levels as low as 0.095 mg/m3 is the possibility that other contaminants in the mixtures may be responsible for the adverse effects. In the case of heated PCBs, polychlorinated dibenzofurans (PCDFs) and possibly polychlorinated dibenzodioxins (PCDDs), which are highly toxic combustion products of PCBs, would likely be present. PCDFs have reportedly been released from heated PCBs at temperatures as low as 300°F, while PCDDs are produced at higher temperatures (approximately 700°F) (Buser, 1979). All PCB mixtures contain some contamination from the manufacturing process. Therefore, it is questionable whether the cause of chloracne was actually PCBs, furans, dioxins, other contaminants or a combination of the above.
In the majority of studies where chloracne was found there were indications of liver injury (Meigs et al., 1954; Hasegawa et al., 1972; Hara et al., 1974, 1975; Ouw et al., 1976). In these studies, liver injury occurred with exposures at the lowest levels of all the
8

occupational exposure ranges reported. Again, it should be noted that these studies involved heated PCBs; exposure concentrations of PCB congeners or contaminants such as PCDDs were not identified. Also most of these studies did not identify whether the PCB concentrations represented vapor or particulate phases or the proportions of both when exposure to a combination of particulates and vapor was involved.
Adverse developmental effects, such as low birth weight and chloracne, were noted among human and animal infants nursed by mothers with high PCB exposures (Curley et al.,1973; Yoshimura, 1974; Bell, 1976). It has since been demonstrated that the adverse effects noted in these studies were likely due to PCDD/PCDF contaminants in the PCB mixtures (Kunita et al., 1984; Masuda et al, 1985; Safe, 1994).
NIOSH concluded that PCBs were potential carcinogens and that occupational and animal studies have not demonstrated a level of exposure that will not subject the worker to possible liver injury. Hence, it was recommended that the TWA concentrations of PCBs in the breathing zone of workers be maintained at or below the minimally detectable TWA concentration for up to 10-hour workday, 40-hour workweek. The minimally detectable concentration of PCBs for the monitoring of occupational exposures at that time was considered to be 1.0 ^ig/rn3 (NIOSH, 1977).
IARC Recommended Criteria
Introduction
The IARC regards all PCBs as being probable human carcinogens (IARC Group 2A). This determination is based on "limited human and insufficient animal" carcinogenicity data. Although several studies associate an increased risk of hepatobiliary cancer with PCB exposure, the human data is considered limited because study numbers were small, dose-response relationships could not be proved and confounding factors could not be excluded (IARC, 1987). The animal carcinogenicity data is questionable since malignant tumors were not produced in more than a single species during several separate studies; dose-response relationships were also not observed (IARC, 1978). The studies that IARC (1978; 1987) found to be pertinent are discussed below; the references remain as originally cited.
Basis for recommended criteria
Occupational exposures: Workers heavily exposed to Aroclor 1254 were diagnosed with a significant increase (2/31) in malignant melanomas; cancers at other sites were also reported. Exposure to other chemicals was probable (Bahn et al., 1976; 1977). Of 2,500 US workers exposed to PCBs as identified in the 1981 Brown and Jones study and the 1987 Brown study, a significant number (five) of liver and biliary cancer deaths were observed. Four of the five deaths were women. Male workers at a capacitor
9

plant in Italy who were first exposed to 54% chlorine and, later, 42% chlorine PCBs were diagnosed with a significant excess of all cancers; the predominant forms were digestive, lymphatic and hematopoietic cancers. Female workers showed a slight increase in cancer of the lymphatic and hematopoietic tissues (Bertazzi et al., 1982). Subsequently the study was expanded to 2,100 people who worked during 1946-1982. The workers, male and female, had significantly increased rates of cancer mortality as compared to local populations. In males, total gastrointestinal cancers were increased; deaths from hematological neoplasms were increased among females (Bertazzi et al., 1987). A Swedish study examined 142 male capacitor plant workers exposed to PCB mixtures containing up to 42% chlorine between the years of 1965 and 1978. There were no significant increases in cancer deaths or incidence as compared to the local population. One highly exposed worker developed two relatively rare tumors (a malignant lymphoma and a slow-growing desmoid mesenchymal tumor) ten years after the start of exposure (Gustavssonetal., 1986).
Accidental inqestion exposures: In 1984, Umeda reported on the Yusho incident in Japan involving a large population which had ingested cooking oil contaminated with PCBs. During the period from 1963 through 1983, Yusho patients showed a significantly increased risk of all cancers; the risk of primary liver cancer was increased nearly five times. Co-contamination of the cooking oil with polychlorinated quaterphenyls and PCDFs was confirmed. A dose-response relationship could not be formed. A later study of 887 male Yusho patients confirmed a significant increase in mortality due to total malignancies (33), liver cancer (9), and lung cancer (8) as compared to the local population. Confounding exposures, namely PCDFs or PCDDs, could not be ruled out. There were no significant increases in cancer mortality for the 874 female Yusho patients also examined (Kuratsune et al., 1986). Kikuchi (1984) performed autopsies often Yusho patients; the two adenocarcinomas of the liver that were found could not be directly associated with PCB exposure. In 1983 and 1984, 79 and 125 Yusho patients were examined with ultrasonic and tumor marker tests; no hepatic-cell carcinomas were found (Okumura and Sakaguchi, 1985). Unger et al. (1982) associated PCB levels in subcutaneous adipose tissue with cancers of the pancreas, stomach, colon, prostate and ovaries. In 1984, Unger et al. were unable to associate PCB content in breast adipose tissue with breast cancer.
Animal carcinogenicity studies: Male mice fed 500 mg Kanechlor 500/kg of diet developed liver nodules after 32 weeks. Mice receiving 0, 100 or 250 mg/kg Kanechlor 500 or 0, 100, 250 or 500 mg/kg Kanechlor 300 or 400 did not develop tumors of any type (Ito et al., 1973). Male mice receiving 300 mg Aroclor 1254/kg of diet for 6 or 11 months developed hepatomas; the results showed a dose-response relationship. Adenofibrosis liver lesions were seen in all mice fed Aroclor 1254 for 11 months (Kimbrough and Linder, 1974). Male and female rats fed 0, 20, 100, 500 or 1000 mg Aroclor 1260/kg diet responded significantly with hepatic adenofibrosis in a dose-response fashion. A higher response rate occurred in rats fed 0, 20, 100 or 500 mg Aroclor 1254/kg of diet (Kimbrough et al., 1972). Female rats fed 38.5 to 616 mg Kanechlor 400/kg of diet developed significant adenomatous nodules in the liver after 400 days; treated male rats did not produce lesions (Kimura and Baba, 1973). Ito et al. (1974) reported effects of
10

dosing male rats with Kanechlor 300, 400, or 500 at 0, 100, 500, or 1000 mg/kg of diet. Cholangiofibrosis occurred at the 1000 mg dose level; nodular hyperplasia of the liver occurred at all dose levels except control. All effects increased with degree of chlorination and dose, Kimbrough et al. (1975) reported significant hepatocellular carcinomas and neoplastic iiver nodules in female rats exposed to 100 mg Aroclor 1260/kg of diet for 21 to 22 months. PCB intake declined from 11.6 mg/kg body weight- day to 6.1 mg/kg at 3 months of exposure and to 4.3 mg/kg at 20 months of exposure. There were no significant increases of non-hepatic tumors. Norback and Weltman (1985) and Schaeffer et al. (1984) also observed benign and malignant hepatic neoplasms in rats. Rats dosed orally with Aroclor 1254 responded with significant intestinal metaplasia as well as hepatocellular carcinomas and adenomas (Ward, 1985). Induction of skin tumors in mice was inconclusive due to inadequate testing (DiGiovanni et al., 1977; Hori etal., 1985).
USEPA Surface Contamination Standards
Introduction
Surface contamination standards appear to have evolved from USEPA in the recent past. Two internal memoranda are the only formal references identified which describe the process employed to derive the standards. Hammerstrom (1986) provided guidance on an acceptable level of quantification for PCB transfer from surfaces to skin. Schweer (1986) expanded that methodology to cover dermal exposures to high contact surfaces in residential settings.
Basis for recommended standard
Risks from surface contamination are based upon an estimation of absorbed systemic dose from a dermal transfer mechanism. Little impact on the lifetime average daily dose is estimated from volatilization, inhalation or ingestion from contaminated surfaces (Hammerstrom, 1986). A potency factor of 4 (mg/kg-day)"1, transfer/absorption rate of unity (100%), lifetime exposure of 70 years (25,550 days), contact with 140,000 cm2 of contaminated surface (10 fag/100 cm2), and lifetime average daily dose calculated for 50 kg body weight was used to derive a risk of 4.4 x10"5 (Schweer, 1986). Hammerstrom (1986) used low and high contact to 10 jug/100 cm2 surfaces at a risk of 106 to back calculate transfer rates resulting in a range from 3.1% to 28%.
The occupational risk assessment analyses for both low contact areas and high contact areas were examined. Lifetime exposure areas of 41,200 cm2 for low exposure and 11,600 cm2 for high exposure areas and transfer rates of 1% and 25%, respectively, yielded a risk of 10"6 at the 10 fj.g/100 cm2 contamination level (Hammerstrom, 1986).
11

The method employed by the USEPA to estimate the risks from surface contamination conformed to the policy of the agency in the mid-1980s. It accepted the worst-case scenario, assumed total absorption, estimated high material transfer rates and accepted the potency factor in use at the time within the agency. Potential weaknesses in the scenario include: surface area contacted; duration of exposure; assumption of total absorption; and lack of quantified estimates of transfer rates.
USEPA PCB Cancer Potency Factor
Introduction
In 1986, the USEPA prepared an assessment of the adverse health effects associated with PCBs. The USEPA's intent were to suggest acceptable exposure levels whenever sufficient data was available (USEPA, 1986a). In September 1996 the USEPA released PCBs: Cancer Dose-Response Assessment and Application to Environmental Mixtures, EPA/600/P-96/001F. This report updates PCB cancer dose-response toxicity information.
Basis for potency factor
The new assessment differentiates between mixtures and considers cancer studies to develop a range of dose-response slopes. This allows for the selection of an appropriate slope representative of the mixture and exposure pathway. Upper-bound potency estimates for PCB mixtures and a range of central estimates, as well as sources of uncertainty are included.
Implications for dismantling/disposal or continued use of Naval submarines
The proposed PCB ruling would allow the continued use of PCB containing materials which exhibit an environmental release rate below 0.001 mg/m3 (1.0 i^g/m3) for a 10-hour workday, 40-hour workweek, as measured by workplace air monitoring. Alternatively, a surface contamination level of less than 10 ug/100 cm2 would be allowed. Quarterly workplace air monitoring activities would be required for the first year and annually thereafter. No criteria for this guidance is given in the ruling; however, it appears that the allowable airborne level was adopted from the NIOSH REL established in 1977.
By adopting the NIOSH recommendation, the PCB ruling would, in fact, set a more stringent standard for allowable occupational exposures to PCBs than the OSHA standard. OSHAs PELs are 1.0 mg/m3 for Aroclor 1248 and 0.5 mg/m3 for Aroclor 1254 mixtures.
12
In US Navy exposures, it is expected that PCB-containing participates will become airborne from the PCB removal activities, but PCBs in the vapor phase will not be released. One possible exception is the metal cutting processes utilizing flame torches. Vapor releases have largely been prevented by cleaning the PCB contamination from the outlines prior to metal cutting.
In comparison to PELS for PCBs in other industrialized nations with occupational and environmental standards similar to those of the US, the allowable airborne level in the proposed rule is much more stringent. For example, Australian PEL is 0.5 mg/m3 and the 15-minute Short Term Exposure Limit (STEL) is 1 mg/m3; where PCBs are also categorized as probable human carcinogens, with a skin notation. Germany enforces a 0.5 mg/m3 PEL, with a 30 minute STEL of 5 mg/m3. Sweden's permissible PCB limit is 0.01 mg/m3; the 15 minute STEL is 0.01 mg/m3 (ACGIH, 1991).
The proposed rule would offer the Navy an authorization for continued use of the PCB-contaminated materials but would include significant monitoring, labeling and disposal constraints.
13

TOXICITY
Available Epidemiological Data
Overall, studies of PCB carcinogenicity have been inconsistent and provided limited evidence (IARC, 1987). Numerous epidemiological studies of workers exposed to PCBs have been conducted in the US (Brown and Jones, 1981; Brown, 1986; Shalat et al., 1989; Sinks et al., 1992), in Sweden (Gustavson et al., 1986), in Italy (Bertazzi et al., 1987) and in Canada (Yassi et al., 1994). However, none of these studies have provided conclusive evidence that PCB exposure is causally related to human cancers. Although excess risks of hepatic, biliary tract, or gall bladder cancer and of digestive and pancreatic cancers have occurred, many were not statistically significant when analyzed against expected cancer occurrences. Often, workers were found to be simultaneously exposed to other chemicals including trichloroethylene, toluene, and methyl isobutyl ketone. Additional reasons for inconclusive study results include small study numbers, combination of data from multiple plants in different geographical regions, high blood levels of PCBs in workers from areas of lower cancer incidence and questionable grouping of liver, biliary and gall bladder cancers. Due to these limitations, including concurrent exposure to other chemicals, PCB exposures could not be causally related to hepatic cancer incidence.
Similarly, statistically significant increases in malignant melanoma, pancreatic cancer and ocular melanoma incidence were reported (Bahn et al., 1976,1977: Lawrence, 1977; NIOSH, 1977; Davidorf and Knupp, 1979; Emmettetal., 1988). These studies reported Aroclor 1254, 1242 and 1016 in frequent use over extensive periods of time. However, these studies were generally regarded as inconclusive since PCB exposures were not quantified, the number of cases and the cohort sizes were frequently small, and expected cancer rates were based on US population data rather than on local rates. Additionally, the workers were simultaneously exposed to various solvents (toluene, xylene, methyl ethyl ketone, trichloroethylene, and 1,1,1,-trichloroethane) and unspecified metals from brazing and soldering operations.
Yusho (1968) and Yu-Cheng (1979) ingestion incidents
The most convincing evidence for any lack of human toxicity is found in the data from two incidents of human PCB ingestion in contaminated rice oil. There is no conclusive evidence of cancer in people who ingested heated rice oil containing PCBs during the Japanese Yusho and Chinese Yu-Cheng incidents (Hsu et al., 1985; Kuratsune et al., 1986). Although several symptoms were reported, these disappeared overtime. Subsequent monkey studies using PCBs with and without PCDFs provided evidence to suggest the PCDFs were the contaminants that caused the Yusho and Yu- Cheng symptoms.
14

Conclusion of human epidemiology data
Based upon the extensive epidemiological studies and human experience of PCB exposures, some PCB congeners have been characterized as probably carcinogenic (IARC, 1987).
Review of Experimental Dose Response Studies
There are no studies regarding cancer in animals after inhalation exposure to PCBs. Six PCB feeding studies have been conducted. Two of these studies (Kimbrough et al., 1975; Norback and Weltman, 1985) reported statistically significant occurrence of malignant responses (adenocarcinoma, hepatocellular carcinoma and neoplastic nodules) to Aroclor 1260 in rodent species.
Rats
A recent rat study (Brunner et al., 1996) tested both sexes of Sprague-Dawley rats at several dose levels for Aroclors 1260 (25, 50, or 100 ppm), 1254 (25, 50, or 100 ppm), 1242 (50 or 100 ppm), and 1016 (50, 100, or 200 ppm) for a duration of 104 weeks. This effort provided the most comprehensive data for dose-response modeling and demonstrated a statistically significant increased incidence of liver adenomas or carcinomas in female rats for all Aroclors and in males for 1260. Several of these tumors were hepatocholangiomas. Thyroid gland follicular cell adenomas or carcinomas were increased in males for all Aroclors with a significant dose trend noted for Aroclors 1254 and 1242.
Kimbrough et al. (1972) conducted a study on Aroclor 1254 and 1260. Neither neoplastic nodules nor hepatocellular carcinomas developed in Sherman rats (10 per sex) treated with dietary doses as high as 72.4 mg/kg-day for eight months. Increased incidence of adenofibrosis of the liver was observed; adenofibromas are not carcinomas and were not considered pre-cancerous by the investigators. However, sensitivity of this study was limited by the small number of animals and the short duration. Due to these limitations, carcinogenicity can neither be concluded or discounted.
Kimbrough et al.(1975) reported 14% (26/184) hepatocellular carcinomas and 92% (170/184) hepatic neoplastic nodules in female Sherman rats fed an estimated dose of 5 mg/kg-day Aroclor 1260 for approximately 21 months. This was considered a significant increase in both hepatocellular carcinomas and neoplastic nodules. Incidence of neoplastic lesions was not increased in tissues other than liver; all major tissues and organs were examined. Subsequently, Norback and Weltman (1985) reported late appearing, non-metastasizing liver tumors in Sprague-Dawley rats fed an estimated average dose of 3.45 mg/kg-day Aroclor 1260 for 24 months. Hepatocellular carcinomas or neoplastic nodules were found in 95.7% (45/47) of female rats and 15.2% (7/46) of male rats treated 18 months or longer.
15
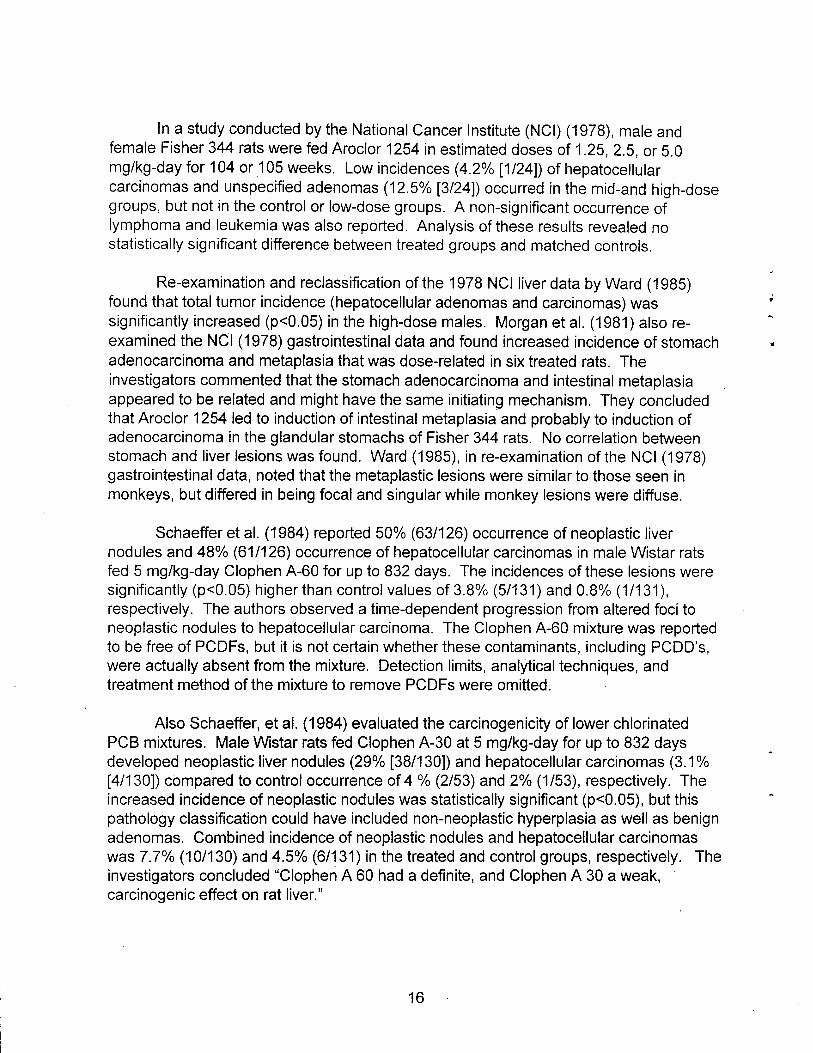
In a study conducted by the National Cancer Institute (NCI) (1978), male and female Fisher 344 rats were fed Aroclor 1254 in estimated doses of 1.25, 2.5, or 5.0 mg/kg-day for 104 or 105 weeks. Low incidences (4.2% [1/24]) of hepatocellular carcinomas and unspecified adenomas (12.5% [3/24]) occurred in the mid-and high-dose groups, but not in the control or low-dose groups. A non-significant occurrence of lymphoma and leukemia was also reported. Analysis of these results revealed no statistically significant difference between treated groups and matched controls.
Re-examination and reclassification of the 1978 NCI liver data by Ward (1985) found that total tumor incidence (hepatocellular adenomas and carcinomas) was significantly increased (p<0.05) in the high-dose males. Morgan et al. (1981) also re- examined the NCI (1978) gastrointestinal data and found increased incidence of stomach adenocarcinoma and metaplasia that was dose-related in six treated rats. The investigators commented that the stomach adenocarcinoma and intestinal metaplasia appeared to be related and might have the same initiating mechanism. They concluded that Aroclor 1254 led to induction of intestinal metaplasia and probably to induction of adenocarcinoma in the glandular stomachs of Fisher 344 rats. No correlation between stomach and liver lesions was found. Ward (1985), in re-examination of the NCI (1978) gastrointestinal data, noted that the metaplastic lesions were similar to those seen in monkeys, but differed in being focal and singular while monkey lesions were diffuse.
Schaeffer et al. (1984) reported 50% (63/126) occurrence of neoplastic liver nodules and 48% (61/126) occurrence of hepatocellular carcinomas in male Wistar rats fed 5 mg/kg-day Clophen A-60 for up to 832 days. The incidences of these lesions were significantly (p<0.05) higher than control values of 3.8% (5/131) and 0.8% (1/131), respectively. The authors observed a time-dependent progression from altered foci to neoplastic nodules to hepatocellular carcinoma. The Clophen A-60 mixture was reported to be free of PCDFs, but it is not certain whether these contaminants, including PCDD's, were actually absent from the mixture. Detection limits, analytical techniques, and treatment method of the mixture to remove PCDFs were omitted.
Also Schaeffer, et al. (1984) evaluated the carcinogenicity of lower chlorinated PCB mixtures. Male Wistar rats fed Clophen A-30 at 5 mg/kg-day for up to 832 days developed neoplastic liver nodules (29% [38/130]) and hepatocellular carcinomas (3.1% [4/130]) compared to control occurrence of 4 % (2/53) and 2% (1/53), respectively. The increased incidence of neoplastic nodules was statistically significant (p<0.05), but this pathology classification could have included non-neoplastic hyperplasia as well as benign adenomas. Combined incidence of neoplastic nodules and hepatocellular carcinomas was 7.7% (10/130) and 4.5% (6/131) in the treated and control groups, respectively. The investigators concluded "Clophen A 60 had a definite, and Clophen A 30 a weak, carcinogenic effect on rat liver."
16

Mice
Ito et al. (1973) found 58.3% (7/12) liver nodular hyperplasia and 41.7% (5/12) hepatocellular carcinomas in mice fed 65 mg/kg-day Kanechlor 500 (52-54% chlorine by weight) for 32 weeks.' Neither response was determined significant. The statistical power of this study was low due to the small number of animals, relatively short treatment duration and no post-treatment observation period. These lesions were not observed in mice treated with lower doses (32.5 or 13 mg/kg-day) of Kanechlor 500. Other tissues (non-liver) were not examined histologically by Kimbrough and Linder (1974) nor by Ito et al. (1973).
No proliferative lesions (nodular hyperplasia or hepatocellular carcinoma) were observed in mice fed estimated doses of 65 mg/kg-day, or less, Kanechlor 400 (48% chlorine by weight) or Kanechlor 300 (40-42% chlorine by weight) for 32 weeks (Ito et al., 1973). Limitations of this study included small numbers of animals, a relatively short treatment period, and no observation period following treatment.
Kimbrough and Linder (1974) conducted another study and found significant increases (45.5% [10/22]) in benign hepatomas among male Balb/c1 mice fed an estimated dose of 49.8 mg/kg-day Aroclor 1254 for 11 months. Increases were not significant (4.2% [1/24]) in mice similarly treated for six months followed by a five-month recovery period. Hepatomas were non-existent in the two control groups. No malignant tumors were observed, but investigators noted that the tested mouse strain only rarely develops spontaneous hepatomas. Therefore, the hepatomas were considered potentially malignant. Additionally, adenofibrosis occurred in all 22 mice treated in the 11- month exposure group.
Assessment and conclusion of dose response data
Neither mouse study contained confirming evidence of any hepatocarcinoma. The above studies showed that potency of PCB mixtures increases with chlorine up to 60%.
The regulatory community used numerous studies including: Brunner et al. (1996), Norback and Weltman (1985) and Kimbrough et al. (1975) to develop a range of human potency and slope estimates.
USEPA's Carcinogenicity/Potency Designation, as of September 1996
In 1987, the Safe Drinking Water Criteria Document for PCBs cited a slope factor of 7.7 (mg/kg/day)"1 based on the total incidence of liver carcinomas and neoplastic nodules reported by Kimbrough et al. (1975) and Norback and Weltman (1985). The newly released PCBs: Cancer Dose-Response Assessment and Application to Environmental Mixtures provides slope estimates and three tiers of human potency for environmental mixtures. The high risk and persistence tier is used for pathways that tend
17

to increase risk, such as Aroclor 1260 and 1254. Criteria include dermal exposure (if an absorption factor has been applied), food chain, sediment or soil ingestion, dust or aerosol inhalation, presence of dioxin-like congeners, or early-life exposures. The central slope (Per mg/kg-d computed as 0.10/ED10) is 1 and upper-bound slope (Per mg/kg-d computed as 0.10/LED10) is 2. The low risk and persistence tier has a central slope of 0.3 and upper-bound slope of 0.4 and is used for dermal exposure (if no absorption factor has been applied to reduce external dose), inhalation of evaporated congeners, and ingestion of water-soluble congeners. The lowest risk and persistence tier has a central slope of 0.04 and upper-bound slope of 0.07 and used for mixtures with congeners containing 4 chlorines comprising less that 1/2% of total PCBs.
In 1991, the Institute for Evaluating Health Risks (IEHR) recognized the need for consensus criteria for diagnoses of liver tumors and neoplasms in rats (Moore, 1991; Moore et al., 1994). The IEHR group of seven expert toxicologists and veterinarian pathologists undertook a re-evaluation of the animal data on PCBs. The studies which dealt with rats exposed to 60%, 54% or 42% chlorine content PCBs were considered to be the best available on which to evaluate cancer potential. The study tissues were blind code marked and examined by the panel of experts without knowledge of the prior diagnoses. The studies on Aroclor 1260 consistently resulted in a high incidence of liver tumors. Studies of the lower chlorine content mixtures showed no statistically significant increases in liver tumors. They concluded that "the science policy of assuming that all PCBs are probable human carcinogens with a potency equivalent to the mixture that contains 60% chlorine has no scientific foundation and should be reconsidered" (Moore et al., 1994). They also indicated that it is not proper to continue a policy which does not consider newer data (i.e., developed subsequent to initial judgments) that indicate such formulations are non carcinogenic or weakly carcinogenic. Furthermore, only 12% of all PCBs sold in this country had the 60% chlorine formulation. IEHR recommended development of separate risk assessments for each major PCB group or formulation. IEHR concluded the current cancer policy clearly overestimates cancer risks associated with PCB exposures. Additionally, "there appears to be no scientific basis for continuing the practice of selecting only part of the available data for deriving potency estimates." The IEHR level would reduce any cancer risk estimates by a factor of four. IEHR recommended using 1.9 (mg/kg-day)"1 instead of the previous USEPA value of 7.7 (mg/kg-day)"1 (Moore et al., 1994).
PCB Health Effects Summary Conclusion
A review of carcinogenicity criteria and the experimental database of PCB health effects indicates there are insufficient scientific data to designate all PCBs as carcinogenic. The 1996 USEPA tiered approach to PCB environmental mixtures provides ranges with estimation of dose associated with 10% increased incidence and 95% lower bound on ED10. Further information on contaminant interactions, specific congener toxicity, dose/response and pharmacokinetics are necessary to appropriately interpret PCB toxicity.
18

ENVIRONMENTAL AND OCCUPATIONAL EXPOSURE ASSESSMENT
Scenarios
Exposure information was collected from two sources. Literature references on case studies and reports on environmental contamination levels were assessed to establish baseline information. Secondly, samples collected both during and prior to this effort were statistically assessed to characterize human exposures. Reference to additional information has been acquired, but analysis was not included in the current effort as access to those data has not yet been authorized.
Sources of potential PCB items found on nuclear submarines are (Puget Sound Naval Shipyard (PSNS), 1994):
Ensolite hull insulation (MIL-P-15280) Cork hull insulation (MIL-C-561/HH-C-561) Armaflex hull insulation (MIL-P-15280) Pipe, vent, or machinery insulation, lagging cloth and adhesives Heat resistant and aluminum paste paint (TT-P-28, MIL-P-14276 or DOD-P-24555) Banding and sheet rubber used for cableways, pipe hanger liners, sound isolation mounts, vent gaskets Wool felt ventilation gaskets (MIL-G-20241/MIL-STD-2148) Electrical cable Felt leached areas in bilges Other materials used as damping installed over previously installed damping wool felt Gas pads and rubber products found in missile tube liners (mastic may have asbestos)
Note: A specific evaluation is prescribed for submarine reactor compartment disposal per Reactor Compartment Disposal Manual NAVSHIPDPUGETINST P9210.15A. Radioactive material commingled with PCB waste must meet both the 40 CFR 761 requirements in addition to any radioactive requirements specified.
With respect to human health risk assessments, there is a limited set of scenarios which requires analysis. If the Navy continues to employ the PCB containing submarines/surface ships as operational weapons platforms or seeks approval for foreign military sales, the resultant exposure scenario is operational. If dismantling of the vessels is selected, the scenario includes both dismantling activities and the ultimate disposition of contaminated articles. A conceptual model of the exposure scenarios is provided in Figure 1.
19

— u re o
O «J
VI k_ u -^ 1M o
c 5
?S Ü o 8.Ö c
c C u c
'3 2
>> es
« V V.
3 V) O a.
e o
s
ee '"5 5 3 O c. M
r V.
it c
X
"a
o .2 > =
< =.
-3 u
£ 3 ~ ,3
s VI
u «I
V in «
es
LB
■a u ' V»
_u 2 o .£ « es
!"= P 2 3 > o
k. U
<
e U C5 s
C/2 M C
es u
« u u 3 O
C/3
11 o T S
IS S °° 8 -
.2 .c
5 3
18 > c
t* -3
t t 2P » c. S
. .£ •« -3 'JE e ca .£ ■= • « -a "=
Mill SJ u z s
'■Ml e o
•7 O. .O
O *U es S 4> CJ
CO
61) e
o c O
I
> « & M W
'S.
g
S u
.1 C
g.
o 8 c
c u
'•5
LU Q O
< 1- Q_ LU Ü 2 O Ü
LU
CO CO LU CO CO <
CO
a:
c -= •5 "5 ^2 JZ c S3 .£ -c So " "3 =
^52-3" C P " «o u c 2
E
O 1 c
8 I
V; c
a O z
«
20
Operations and maintenance scenario
A health risk assessment on the operations scenario would consider the contamination levels, spatial distribution of contaminated articles, processes employed, and the modes of exposure. In effect, this scenario would involve normal crew operation, routine maintenance at sea and refurbishment/repair in port. Due to gaps in the regulatory language, a strict interpretation of existing rules suggests there is no current authorization to use PCB contaminated weapons systems where the contamination is not "totally enclosed" in electronic components. The data provided in the following section indicate that PCB-containing articles are widespread throughout the submarines and surface ships.
Operational crews vary significantly from the average population. They exclude both ends of the age distribution in that both the very young and old are not present; ages range from approximately 17 to 50 years. The vast majority of the Navy population is male; however, women also serve aboard surface vessels. Naval personnel with a weakened health status are generally not included, at least from a chronic exposure scenario perspective, due to military medical standards. The population does include all racial groups.
Potential exposure pathways include dermal, inhalation and ingestion. Dermal exposure can occur through contact with low and high exposure surface areas; casual contact may occur with contaminated articles as part of mission execution or as part of maintenance operations as described below. Inhalation pathways are feasible through volatilization of PCB liquids and generation of PCB contaminated dusts or PCB aerosols; however the air monitoring data gathered on a number of operating activities indicate that inhalation is an insignificant pathway. Ingestion is feasible through transfer of PCBs from contaminated skin directly to the mouth, from contaminated surfaces to food stuffs and/or from ingestion of PCB dusts trapped in the bronchial mucous, refluxed and swallowed.
Further analysis of the repair and refurbishment activities is required. During these two complex activities, individuals could be exposed to the contaminated articles normally located in low probability contact areas (e.g., insulation, gaskets, etc.). The frequency, duration, transfer factors and absorption rates of PCBs in this activity were estimated for the risk characterization.
Scrapping scenario
In this scenario, the submarines/ships would be brought into port, decommissioned, dismantled, decontaminated and disposed of as scrap. The exposure factors identified during the refurbishment would be very similar to this scenario with some notable exceptions. This activity would be conducted in port but likely not in the same facility as the refurbishment. Much less care could be expected in execution of the tasks since the outcome is scrapping of the materials. The removal processes would be
21

conducted onboard the submarine. During the process, the ventilation system would become inoperable.
Significant worker personal protection would be employed during these activities. The level of Personal Protective Equipment (PPE) necessary depends upon the extent of the exposure expected. If exposure to soot is expected, workers should wear outer coveralls made of a non-woven fabric such as spunbonded Tyvek to exclude particulates. If the exposure is to liquids (as could be the case if a transformer spill occurred) or if the form of contamination is unknown, the outer coverall should be made of chemically resistant materials such as Saranax-coated Tyvek or Viton-coated neoprene. Gloves and boots should be made of neoprene, nitrile, butyl rubber, or Viton; these materials have been shown to be resistant to permeation by PCBs (Schwoppe et al., 1985). Hence, dermal contact during some dismantling operations may be an incomplete exposure pathway, not requiring assessment..
Receptors would consist of industrial workers and laborers, both male and female. Since dismantling would include torch cutting of structures, volatilization of PCB coatings and other materials could occur. In addition, thermal byproducts such as PCDFs may result from hot work on PCBs. Therefore, inhalation could also be a potential exposure pathway for some activities. No contamination of food or drinking water should be expected because eating and drinking are allowed only in "clean" areas.
Characterization of PCB Contamination on Navy Vessels
The following subsections present PCB characterization information from Naval vessels; the information was obtained from three sources: the NAVSEA Copy Files (NCF), PSNS, and the Bremerton Hospital. The NCFs provided useful PCB survey data taken from surface ships and submarines. That information included air samples, wipe samples (e.g., electrical cables, surfaces of high contact, paint) and bulk samples.
The Bremerton Navy Hospital data included air monitoring results on a number of submarine dismantling activities. In addition, information pertaining to air monitoring results before and after a transformer fire on the USS Thomas Edison were included.
The submarine media database obtained from PSNS contains PCB data gathered between 1990 and 1995. The database, created for research and development, contains over 22,000 bulk and swipe samples, mainly taken from dismantled pieces.
Airborne emissions
Ventilation system monitoring: In 1990, the Navy conducted air monitoring in submarine and surface ship ventilation systems to determine whether airborne PCBs are escaping from ventilation systems. A total of 66 samples were collected from both
22

submarines and surface vessels using NIOSH Method 5503 at intake vents "upstream" and outlet vents "downstream" of PCB contaminated gaskets. Gasket materials were tested and were confirmed to be PCB contaminated. Volumes of air samples ranged from 338 to 438 liters, and no detectable PCBs were found in any of the samples during normal operating conditions. This information strongly suggests that PCBs are not airborne contaminants in submarine or surface ship spaces and are not emitted from the ventilation systems equipped with PCB felt gaskets (NCF #24).
Although PCBs are not an airborne contaminant during normal operating conditions, the Navy was concerned that PCBs could become airborne during the cleaning of ventilation ducts. Shipboard ventilation system ducts are periodically cleaned using an extraction system which employs a flailing device to loosen dirt and dust and a vacuum unit to collect the resultant airborne debris. Some abrading of the exposed edges of the PCB-laden gasket sometimes occurs. To determine if this duct cleaning system causes the release of PCBs into the atmosphere, the Navy collected air samples from USS Nimitz (CVN 68) using NIOSH Method 5503 in two locations: 1) air exhausted by the vacuum and 2) air outside the duct approximately 18" away from the duct opening. The samples were collected under three conditions: 1) with vacuum running, prior to cleaning with the flailing device, 2) during operation of both the vacuum and flailing device, and 3) after removal of the flailing device with the vacuum still running. The laboratory analyses indicated there were no detectable airborne PCBs discharged from the extraction unit (NCF #24). Again, this information concludes that PCBs are not an airborne contaminant on submarines and surface ships, even during ventilation maintenance.
Bulk samples taken from the material collected in the vacuum tank of the ventilation extraction system indicated 3600 ppm PCB in the debris loosened by the mechanical abrasion of felt. As a result, the Navy now requires personnel operating the extraction unit to wear proper PPE and to treat the collected dust and debris as PCB waste. The PPE and handling procedures eliminate the need for personnel contact with vent joint gaskets (NCF #24).
At sea monitoring: On 16 Sept 1989, air sampling was conducted on the USS Guardfish (SSN 612) while underway. PCBs were not detected by laboratory analysis. The air samples were collected (using NIOSH Method 5503) in the maneuvering room, engine room upper level (above the main engine complex), and engine room lower level (main engine complex) (NCF #1).
Monitoring of dismantling activities: Industrial hygiene personnel from the Bremerton Naval Hospital sampled a number of dismantling and maintenance operations and calculated 8-hr TWAs based on the sampling durations. The Bremerton findings are listed in Table 1. Generally, the operations listed are conducted over 6 hour periods. Therefore, the TWAs were recalculated to assume the sampled activity occurred over a 6 hour period in an 8-hr workday (please see the 5th column in Table 1).
23
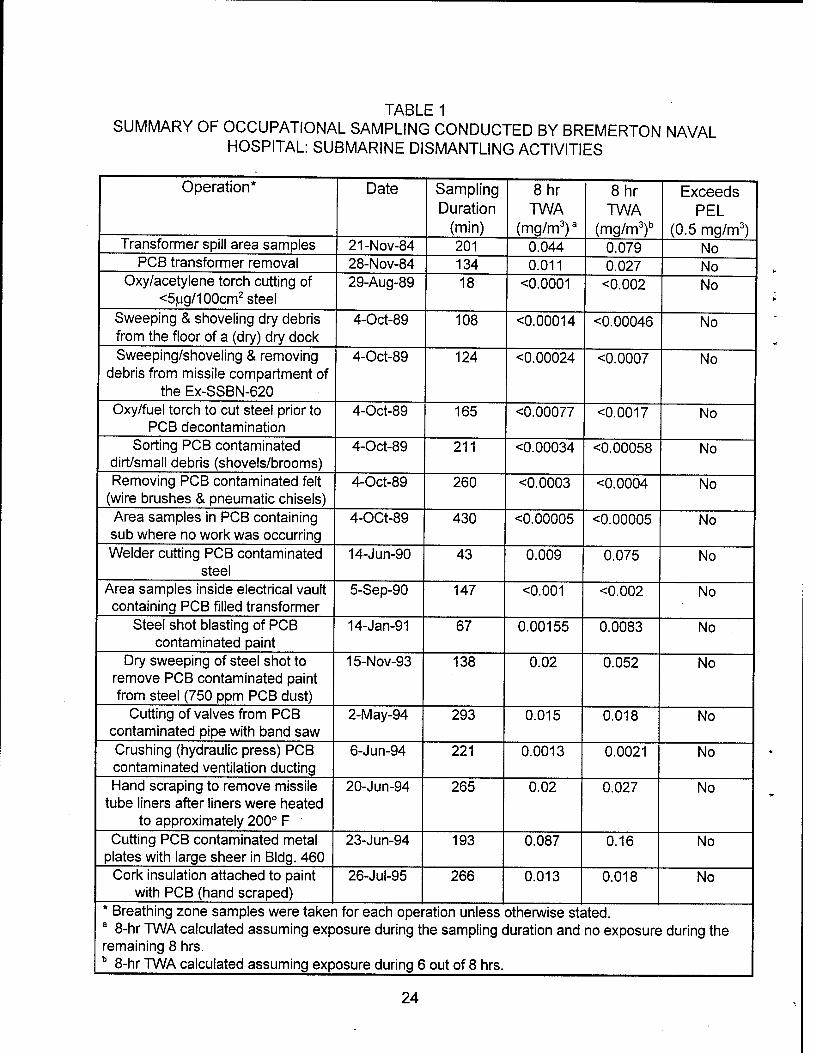
TABLE 1 SUMMARY OF OCCUPATIONAL SAMPLING CONDUCTED BY BREMERTON NAVAL
HOSPITAL: SUBMARINE DISMANTLING ACTIVITIES
Operation* Date Sampling Duration
(min)
8hr TWA
(mg/m3)a
8hr TWA
(mg/m3)b
Exceeds PEL
(0.5 mg/m3) Transformer spill area samples 21-Nov-84 201 0.044 0.079 No
PCB transformer removal 28-Nov-84 134 0.011 0.027 No Oxy/acetylene torch cutting of
<5ng/100cm2 steel 29-Aug-89 18 <0.0001 <0.002 No
Sweeping & shoveling dry debris from the floor of a (dry) dry dock
4-Oct-89 108 O.00014 <0.00046 No
Sweeping/shoveling & removing debris from missile compartment of
the Ex-SSBN-620
4-Oct-89 124 <0.00024 <0.0007 No
Oxy/fuel torch to cut steel prior to PCB decontamination
4-Oct-89 165 <0.00077 <0.0017 No
Sorting PCB contaminated dirt/small debris (shovels/brooms)
4-Oct-89 211 <0.00034 <0.00058 No
Removing PCB contaminated felt (wire brushes & pneumatic chisels)
4-Oct-89 260 <0.0003 <0.0004 No
Area samples in PCB containing sub where no work was occurring
4-OCt-89 430 <0.00005 <0.00005 No
Welder cutting PCB contaminated steel
14-Jun-90 43 0.009 0.075 No
Area samples inside electrical vault containing PCB filled transformer
5-Sep-90 147 <0.001 <0.002 No
Steel shot blasting of PCB contaminated paint
14-Jan-91 67 0.00155 0.0083 No
Dry sweeping of steel shot to remove PCB contaminated paint from steel (750 ppm PCB dust)
15-NOV-93 138 0.02 0.052 No
Cutting of valves from PCB contaminated pipe with band saw
2-May-94 293 0.015 0.018 No
Crushing (hydraulic press) PCB contaminated ventilation ducting
6-Jun-94 221 0.0013 0.0021 No
Hand scraping to remove missile tube liners after liners were heated
to approximately 200° F '
20-Jun-94 265 0.02 0.027 No
Cutting PCB contaminated metal plates with large sheer in Bldg. 460
23-Jun-94 193 0.087 0.16 No
Cork insulation attached to paint with PCB (hand scraped)
26-Jul-95 266 0.013 0.018 No
* Breathing zone samples were taken for each operation unless otherwise stated. a 8-hr TWA calculated assuming exposure during the sampling duration and no exposure during the remaining 8 hrs. b 8-hr TWA calculated assuming exposure during 6 out of 8 hrs.
24

In September 1995, additional personal samples of PCB decontamination operations on submarines at PSNS were collected by the Tri-Service Toxicology's Industrial Hygiene Team from Wright-Patterson Air Force Base. The operations sampled include steel shot blasting, sand blasting, needle gunning, and chipping of felt plates by hand. As part of the dismantling process, decontamination efforts reduce exposure to numerous toxicants. Operations deemed most likely to expose workers to PCBs were selected for sampling.
Decriptions of operations sampled: Steel shot blasting involved the use of steel pellets expelled at high velocities against metal hull surfaces to reduce PCB surface contamination levels to 100 ug/100 cm2. PCB-containing materials such as paint and/or mastic (insulating material) were removed. The on-hull process was conducted in a contained area inside the decommissioned SSBN John Adams operations section under negative pressure with High Efficiency Particulate Air (HEPA) vacuums. Blast booths were used for off-hull blasting and were equipped with exhaust ventilation consisting of two 260 cubic feet per minute (cfm) HEPA vacuums. Shot was recovered and used again. PPE for blast operators consisted of air supplied blaster's hoods with disposable Tyvex suits over work clothes. Canvas coveralls were worn over Tyvex suits to protect workers from the shot blast. Earplugs, gloves, and booties were also required .
Sand blasting followed the same process except sand was substituted for steel shot. Sand blasting was performed to compare efficiency of paint and/or mastic removal from hulls with steel shot blasting. Sand blasting was conducted at a off-hull (blast booth) site only. A sand recovery sample was collected in addition to blasting samples. Blasting PPE required.
During the needle gunning operation, a gun-shaped tool containing steel rods was used on metal surfaces to remove paint and/or mastic along cut lines (dismantling requires the hull to be cut into frame sections). When the trigger was pressed, high pneumatic pressure forced the steel rods to be pushed rapidly and repeatedly forward and back, pounding the contaminated material off the metal. For on-hull operations, the work area was marked off and self-contained. Off-hull operations were conducted in a blast booth. PPE for needle gun operators consisted of air supplied bubble hoods, disposable coveralls over work clothes, ear plugs, gloves, and booties.
Wre brushes and pneumatic chisels were used to remove dry PCB contaminated felt during the hand chipping operation. This was conducted off-hull in a covered but not contained area. Visible particles were not generated by this procedure and respirators were not worn. PPE worn by workers consisted of disposable coveralls, booties, gloves, and hearing protection.
Sampling protocol: Samples were collected using NIOSH Method #5503 (NIOSH, 1994). Gilian (West Caldwell, NJ) Dual Mode Low Flow air pumps were calibrated to a flow rate of 0.1 to 0.2 L/min dependent on the operation sampled. Sampling train consisted of a disposable Swinnex cassette pre-loaded with a 13 mm glass fiber filter attached to a florisil (100 mg/50 mg) tube. Personal breathing zone samples were collected outside of any PPE
25

worn by the worker. Pumps were strapped to the back of workers to protect them from flying debris. Sampling trains were taped down over the shoulder of the worker. During blast operations, sampling trains were provided extra taping to protect glass sorbent tubes. Due to the high risk of sample loss, the majority of blast workers were double pumped. Replicates for Quality Assurance/Quality Control (QA/QC) purposes were taken and analyzed for 10% of the samples.
Sampling was conducted in one hour increments for most operations. At the end of the period, the entire sampling outfit was removed and replaced by a new one. Each pump was post-calibrated and decontaminated. Pumps were inspected for impact damage. Filters were removed with tweezers and placed in 7-ml glass vials with teflon-lined caps. Florisil tubes were capped and placed in glass vials. Tweezers were cleaned with methanol. Pumps were charged, as needed, calibrated, and set-up with new sampling train. Samples were packaged, including 2 field blanks per 10 samples, and sent off for analysis.
Analytical protocol: Primary samples were analyzed (Aroclors 1242, 1254, 1260, and 1268) by the Environmental Preventive Medicine Unit Two in Norfolk, Virginia. QA/QC samples were analyzed (Aroclors 1016, 1221, 1232, 1242, 1248, 1254, and 1260) by Clayton Environmental Consultants in Novi, Michigan. The samples were digested with hexane and analyzed by gas chromatography. The detection limit (LOD) specified by the lab for PCB samples was 0.25 ug.
Calculations: Concentrations (C) were calculated for PCBs in the air volume (V) sampled using the following equation:
C = (F + T) V
where F is mass on glass fiber filter in ug T is mass in florisil sorbent tube in ug V is volume (exposure time X pump calibration) in liters
In the case of nondetects (LOD), it was necessary to estimate the average mass by replacing the nondetectable value (0.25 ug) with LOD/Ö2 (Hornung and Reed, 1990) or 0.177 ug. When both filter and sorbent tube were nondetectable, the total mass assigned for that sample was 0.177 ug. Eight-hour TWAs were calculated for each worker's exposure during the work day using the following equation (National Safety Council, 1988):
8-hr TWA = CJ, + C2T2 + CnTn/ 480 min
where C is the concentration in mg/m3
T is time of exposure in minutes n is respective sample periods
Since ug/L (original concentration units) is equivalent to mg/m3 (8-hr TWA units), no mathematical conversions were necessary. Eight-hour TWAs were calculated for an
26

average work day exposure of 6 hours. No exposure was assumed during the remaining 2 hours since this time was used to don PPE, remove PPE, and shower. Sampling efforts rarely collected 6 hours of data, thus the average air concentration for sampled periods was used for the unsampled portion of the 6 hour workday.
Sample results: Below are the resulting 8-hr TWAs (see Tables 2 - 4). The detection limit specified by the lab for PCB samples was 0.25 ug. Over 50% of all the filter samples were reported as below the detection limit. All sorbent tubes resulted in nondetects indicating the absence of a vapor phase. Shot blasting was the only operation where sample results exceeded the LOD (Table 2). Aroclors 1254 and 1268 were detected. Since there is no specific PEL for Aroclor 1268, TWAs were compared to the PEL for Aroclor 1254 - chlordiphenyl (54% chlorine). This PEL (0.5 mg/m3) is the most stringent limit of any PCB mixture listed by OSHA and ACGIH. None of the operations sampled exceeded the OSHA PEL for Arochlor 1254. Replicate samples confirmed these results.
TABLE 2 8-HOUR TWAs FOR STEEL SHOT & SAND BLASTING OPERATIONS
Date Hull no. TWA Aroclor 1254(mg/m3,(a
TWA Aroclor 1268(mg/m3,la
Exceeds PEL (0.5 mg/m31)?
25-Sep-95 620 (on hull) 0.0115c 0.2334 No 25-Sep-95 620 (on hull) 0.0113° 0.0113c No 26-Sep-95 620 (on hull) 0.0239c 0.0738 No 26-Sep-95 620 (on hull) 0.0262c 0.0262c No 27-Sep-95 634 (off hull) 0.023c 0.071 No 28-Sep-95 35 (on hull) 0.1724 0.0221° No 28-Sep-95 35 (on hull) 0.241 0.0217° No 28-Sep-95 35 (on hull) 0.3089 0.0221° No 28-Sep-95 658 (off hull)d 0.0245c 0.0399 No
Average TWA for Blasting b 0.0936 0.0579 No
a Calculated as a 6 hour blast/8 hour workday. b Average of TWAs for all workers sampled. c TWA calculated on nondetect (LOD) sample. d Sand Blasting sample.
27

TABLE 3 8-HOUR TWAs FOR NEEDLE GUNNING OPERATIONS
Date . Hull no. TWA Aroclor 1254(ma/m31a
TWA Aroclor 1268(ma/m31a
Exceeds PEL (0.5 ma/m3^
26-Sep-95 620 (on hull) 0.0129 0.0129 No 26-Sep-95 620 (on hull) 0.0129 0.0129 No 26-Sep-95 620 (on hull) 0.017 0.017 No 26-Sep-95 620 (on hull) 0.0171 0.0171 No 28-Sep-95 658 (off hull) 0.016 0.016 No 28-Sep-95 658 (off hull) 0.0165 0.0165 No
Average TWA for Needle Gunning Operationsb 0.0154 0.0154 No
d Calculated as a 6 hour blast/8 hour workday. B Average of TWAs for all workers sampled. * All TWAs calculated on nondetect (LOD) samples.
TABLE 4 8-HOUR TWAs FOR HAND CHIPPING OPERATION
Date Hull no. TWA Aroclor 1254(mq/m3^a
TWA Aroclor 1268(mg/m3^a
Exceeds PEL (0.5 mg/m3^
28-Sep-95 641,620, 663 (off hull) 0.0213 0.0213 No 28-Sep-95 641,633 (off hull) 0.0205 0.0205 No
a Calculated as a 6 samples.
hour work/8 hour workday. All TWAs calculated on nondetect (LOD)
PSNS sampling conclusions: It can be concluded from these results that worker exposure to PCBs from ship dismantling activities would not exceed permissible limits; however, this would not preclude the use of PPE, including respiratory protection, to protect against other hazards such as particulates, heavy metals (namely lead and chromium), solvents, projectiles, ergonomic Stressors and excessive noise. These results support the assumption that any PCB air contamination aboard operational vessels would fall below the LOD. Under normal operational conditions, one would not expect to see higher concentrations of either PCB vapors or particulates with adsorbed PCBs than one would see under dismantling conditions (blasting operations). Area samples collected by Bremerton Naval Hospital in PCB-containing submarines (PSNS) where no operations were occurring also resulted in nondetects. In assessing the risk for an operational, dismantling or maintenance scenario, the LOD would appear to serve as a conservative exposure point concentration. It is important to note that no vapor phase was detected in any of the sample results.
28

Bulk samples of on-board materials
Solid samples from 78 inactive ships were also statistically analyzed as part of the Navy's effort to evaluate possible personnel exposure to PCBs (NCF #87). This study evaluated the distribution of the PCB solid samples and statistical differences between ships and material types. The analysis was complicated because nearly 50% of the data consisted of non-detects.
Because there were too few data for some ship classes to obtain any reasonable estimates of the population parameters, only the six largest classes were considered. A significant difference was found between four of the six ship classes and between ships within classes as well. From the combined data set, the estimated probability of exceeding 50 ppm was 37.6%, but from class to class this value varied considerably. It should be noted that when the bulk samples were collected, every effort was made to sample from locations likely to have high concentrations of PCBs. If samples were taken from random locations, the concentrations would likely be lower. However, since no random samples were taken, there is no way to determine how much this data tends to overestimate actual exposure levels.
To evaluate the data by material type, the samples were classified into four groups by function: 1) vent gaskets and insulation; 2) wires and cables; 3) bulkhead insulation, and 4) others (See Table 5). The PCB levels were highest for the vent gaskets, with a mean of 34.8 (antilog of 3.55), and lowest for the bulkhead insulation, which had a mean of0.58(antilogof3.55).
TABLE 5 SUMMARY OF SOLID SAMPLE RESULTS CLASSIFIED BY FUNCTION
Material Category Number < DL Number > DL
In Mean (ppm)
Std. Dev. P
Vent Gaskets /Insulation
285 488 3.55 5.14 0.472
Wires and Cables 194 204 1.97 3.25 0.27 Bulkhead Insulation 134 46 -0.54 4.03 0.13 Other 64 67 1.96 5.16 0.35 Combined 677 805 2.35 4.93 0.38 Notes: DL = Detection Limit (1 |ag/g). The data were lognormally transformed. Adapted from Ross et al., 1993; NCF #87, Appendix 4.
The results from a survey of bulk samples taken from inactive ships performed in 1994 showed similar results (See Table 6) (NCF #1, 1995). Both databases revealed wide variance in PCB concentrations and a large percentage of non-detects. Considering that sampling in both cases was performed to identify likely PCB articles, the percentage of randomly sampled items exceeding the 50 ppm criteria is likely to be much lower than the values indicated.
29

TABLE 6 INACTIVE SHIPS PCB SURVEY RESULTS 25 APRIL 1994
Material Number No. > 50 ppm
% over 50 ppm
Mean (ppm) Max (ppm)
Vent gaskets 1363 504 37% 18982 550000 Cable or wire 1666 266 26% 451 240000 Bulkhead Insulation
504 90 18% 616 73000
Vent Insulation 32 2 6% 69 1100 Oil 904 11 1% 9 5000 Rubber Items 330 23 7% 25 3700 Paint 161 • 14 9% 635 45000 Doubleback Tape
282 31 11% 28 1400
Adapted from NCF #1, Enclosure 18, 1994.
The materials listed in the PSNS database include, but are not limited to, mastic, rubber, arobol, armaflex, felt insulation, electrical insulation, and paints. The method detection limit for the PCB bulk samples reported by the Puget Sound lab was 20 ppm. The Puget Sound lab reported that these LOD were set for compliance purposes with surface contamination and bulk concentration guidelines (10 ug/100 cm2 and 50 ppm PCB), and are higher than technically achievable. Based upon this information, half of the LOD was used to represent sample concentrations below the LOD. This method is consistent with the treatment for non-detects described in USEPA's Risk Assessment Guidance for Superfund (RAGS) (USEPA, 1989). ,
Table 7 presents a statistical summary of the bulk samples from PSNS. Outliers were not removed, because without access to original sampling data, it was impossible to judge extreme datapoints as data-entry mistakes or valid values. Unlike typical environmental data, extreme outliers in man-made materials can be expected. The distribution of the data was highly skewed. In most cases, the standard deviation exceeded the mean several times. This was similar to the distributions seen in surface ship data from the NAVSEA files (see Tables 5 and 6)(NCF #1). Review of the results revealed that the median (or 50th percentile) was a much better representation of central tendency and potential exposure levels than the mean.
Felt insulation was found to contain the greatest concentration of PCBs. White foam and arobol, which are also insulating materials, contained lower concentrations. Except for felt, the median values indicated that the majority of the samples fell well below the 50 ppm limit for PCB contamination, as specified in 40 CFR 761. Few samples contained detects of Aroclor 1242 and 1248. The majority of PCBs found on the submarines were Aroclor 1254, 1260 and 1268 mixtures.
30

TABLE 7 STATISTICAL SUMMARY OF PCB BULK SAMPLES BY MATERIAL TYPE
Material Category
Analyte N Mean (ppm)
Std. Dev. (ppm)
Min. (ppm)
Max. (ppm)
Median (ppm)
All bulk samples Total Ar 7432 560.6 2619.3 10.0 69000.0 28.0 All bulk samples Ar 1242 130 257.28 2600.0 10.0 30000.0 14.0 All bulk samples Ar 1248 71 26.22 24.43 4.8 140.0 19.0 All bulk samples Ar 1254 2307 338.2 1098.0 10.0 36000.0 66.0 All bulk samples Ar 1260 640 224.0 1242 1.1 26000.0 31.5 All bulk samples Ar 1268 884 1204.8 4127.95 10.0 35000.0 23.0 Paints Total Ar 4167 251.7 1394.1 10.0 59000.0 27.0 Electrical Insulation
Total Ar 12 13.6 12.1 10.0 53.0 10.0
Felt Total Ar 11 27400.1 24357.7 10.0 69000.0 18000.0 Cork Total Ar 270 230.8 828.0 9.0 6400.0 18.0 Foam (White) Total Ar 54 1584.0 2991.6 2.0 13000.0 38.0 Armaflex Total Ar 304 70.7 384.9 10.0 5200.0 12.0 Arobol Total Ar 223 656.5 2337.3 10.0 24000.0 29.0 Rubber Total Ar 504 213.7 1617.4 10.0 26000.0 22.5
Notes: • Ar = Aroclor • Non-detects were assigned a value of half the LOD, (10 ppm). Therefore, statistical results
at or below 10 ppm indicate that the values fall below the LOD. • Material types, e.g. paint, electrical insulation, etc., are included in the "All bulk samples"
category.
Surface swipe samples
Two types of swipe samples were found in the PSNS database, field test kit samples and gas chromatography (GC) analyzed swipe samples. For characterization purposes in this report, only the GC analyzed samples were included in the statistical analysis. The method detection limit of the GC analyzed swipes was 5 pg/100 cm2.
Table 8 presents a statistical summary of the swipe data from PSNS broken out by submarine component. As with the bulk samples, a large degree of variance was found among the swipes. Again, the median presented the best representation of potential exposure levels. Considerably fewer swipes were analyzed for specific PCB mixture content (e.g., Aroclor 1254 or 1260) than for total PCBs. It appeared that the median surface contamination from Aroclor 1254 was considerably greater than that of total Aroclor in several components. This result was apparently a function of a much smaller sample population for Aroclor 1254.
31

Although, the toxicity of Aroclor 1254 or 1260 may be of greater concern than the other mixtures detected, it appeared more realistic to use the median total Aroclor levels for evaluating risks from dermal contact with contaminated surfaces. This was due to the limited number of Aroclor 1248 and 1254 samples.
Swipe samples from surfaces of high contact
NAVSEA negotiated an agreement with the USEPA which established PCB management policy on Navy vessels. The agreement specified a cleanup standard for eating and food preparation surfaces, and crew bunks and furniture in offices, medical stations, crew living spaces and recreation quarters of 10 ug/100 cm2. It specified 100 ug/100 cm2 in other areas of lower contact. Background PCB levels on such surfaces are expected to be below 10 ug/100 cm?, although there are no data supporting this assumption.
Using the methodology provided in a USEPA memo entitled "PCB Spill Exposure Scenarios" (Schweer, 1986) NAVSEA calculated the hypothetical carcinogenic risk to a sailor exposed during duty aboard a Navy vessel from exposure to PCB surface levels of 100 i-ig/100 cm2. Several conservative assumptions were used in the calculation. The hypothetical risk result was 1.5 x 10"5, indicating that 100 jj.g/100 cm2 is an appropriate level for machinery and space areas in Navy vessels (NCF # 1).
Random swipe samples taken in living areas of operating ships have shown no PCBs above 10 jj.g/100 cm2. The sampling effort was concerned only with counter tops in mess decks and galleys, and furniture in crew living spaces and medical stations. The sampling effort did not include decks, overheads, bulkheads or the surfaces of ship machinery or systems (NCF #13).
For comparison, swipe samples from assumed "high contact" areas were selected from the PSNS database and statistically analyzed. Swipe samples taken were selected to represent potential "high contact" surfaces in submarines. The range of concentrations detected are listed in Table 9.
Despite the large range in surface level contamination, the majority of surface swipes taken were below the 10 jig/100 cm2 level. The probability of contacting surfaces of high concentration appeared to be low.
32
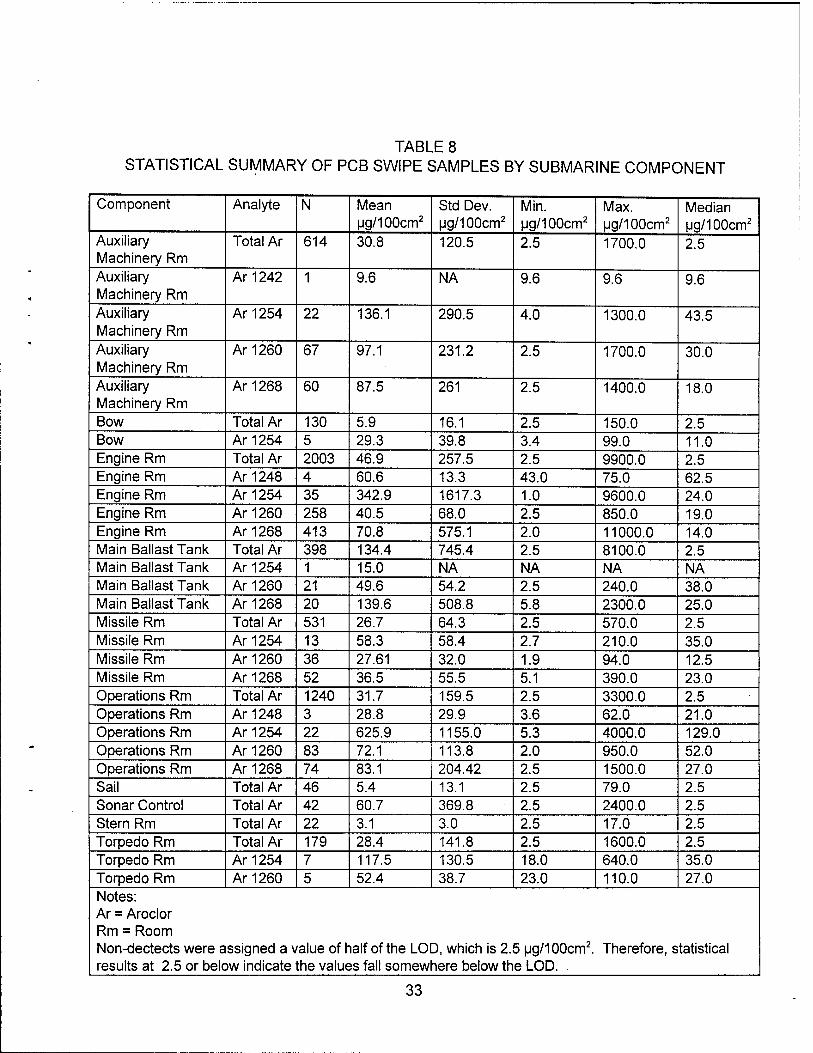
TABLE 8 STATISTICAL SUMMARY OF PCB SWIPE SAMPLES BY SUBMARINE COMPONENT
Component Analyte N Mean ug/100cm2
Std Dev. ug/100cm2
Min. ug/100cm2
Max. ug/100cm2
Median ug/100cm2
Auxiliary Machinery Rm
Total Ar 614 30.8 120.5 2.5 1700.0 2.5
Auxiliary Machinery Rm
Ar 1242 1 9.6 NA 9.6 9.6 9.6
Auxiliary Machinery Rm
Ar 1254 22 136.1 290.5 4.0 1300.0 43.5
Auxiliary Machinery Rm
Ar 1260 67 97.1 231.2 2.5 1700.0 30.0
Auxiliary Machinery Rm
Ar 1268 60 87.5 261 2.5 1400.0 18.0
Bow Total Ar 130 5.9 16.1 2.5 150.0 2.5 Bow Ar 1254 5 29.3 39.8 3.4 99.0 11.0 Engine Rm Total Ar 2003 46.9 257.5 2.5 9900.0 2.5 Engine Rm Ar 1248 4 60.6 13.3 43.0 75.0 62.5 Engine Rm Ar 1254 35 342.9 1617.3 1.0 9600.0 24.0 Engine Rm Ar 1260 258 40.5 68.0 2.5 850.0 19.0 Engine Rm Ar 1268 413 70.8 575.1 2.0 11000.0 14.0 Main Ballast Tank Total Ar 398 134.4 745.4 2.5 8100.0 2.5 Main Ballast Tank Ar 1254 1 15.0 NA NA NA NA Main Ballast Tank Ar 1260 21 49.6 54.2 2.5 240.0 38.0 Main Ballast Tank Ar 1268 20 139.6 508.8 5.8 2300.0 25.0 Missile Rm Total Ar 531 26.7 64.3 2.5 570.0 2.5 Missile Rm Ar 1254 13 58.3 58.4 2.7 210.0 35.0 Missile Rm Ar 1260 36 27.61 32.0 1.9 94.0 12.5 Missile Rm Ar 1268 52 36.5 55.5 5.1 390.0 23.0 Operations Rm Total Ar 1240 31.7 159.5 2.5 3300.0 2.5 Operations Rm Ar 1248 3 28.8 29.9 3.6 62.0 21.0 Operations Rm Ar 1254 22 625.9 1155.0 5.3 4000.0 129.0 Operations Rm Ar 1260 83 72.1 113.8 2.0 950.0 52.0 Operations Rm Ar 1268 74 83.1 204.42 2.5 1500.0 27.0 Sail Total Ar 46 5.4 13.1 2.5 79.0 2.5 Sonar Control Total Ar 42 60.7 369.8 2.5 2400.0 2.5 Stern Rm Total Ar 22 3.1 3.0 2.5 17.0 2.5 Torpedo Rm Total Ar 179 28.4 141.8 2.5 1600.0 2.5 Torpedo Rm Ar 1254 7 117.5 130.5 18.0 640.0 35.0 Torpedo Rm Ar 1260 5 52.4 38.7 23.0 110.0 27.0 Notes: Ar = Aroclor Rm = Room Non-dectects were assigned a value of half of the LOD, which is 2.5 ug/100cm2. Therefore, statistical results at 2.5 or below indicate the values fall somewhere below the LOD.
33

TABLE 9 STATISTICAL SUMMARY: SWIPES FROM "HIGH CONTACT" SURFACES (a)
Analyte N Mean Std. Dev. Min Max Median Q1 Q3 Total Ar 3698 52 326 0 9500 3 3 32 Ar-1242 4 7 5 4 14 6 4 12 Ar-1248 8 15 30 2 89 4 2 8 AM 254 75 11 14 2 82 5 3 13 Ar-1260 593 50 296 1 4000 7 3 16 Ar-1268 690 46 453 0 11000 6 3 12 Ar = Aroclor Q1 = 25th Percentile
Q3 = 75th Percentile (a) = High contact areas; swipes taken below 8 ft.
Electrical cables aboard Navy vessels (swipe and bulk samples)
Some electrical cables on older ships and submarines may contain PCBs as a result of former manufacturing processes. In August of 1992, the Navy undertook an extensive program to determine if cables containing PCBs in excess of 50 ppm presented an unreasonable risk to health or the environment if left in place aboard US Navy vessels (NCF #87). The program used the resources of several laboratories, including those at Norfolk Naval Shipyard, PSNS, Naval Surface Warfare Center-Annapolis Detachment and Naval Research Laboratory. The program spanned a range of topics from sampling and analysis of PCBs on the surfaces of shipboard cables to laboratory investigation of the mobility of bulk PCBs from internal cable components to the cable surface. In total, 398 bulk and wipe samples representing 72 ships in 31 classes were used in the analysis.
In brief, the data showed that: 1) while some shipboard cables contained PCBs in excess of 5000 ppm, 95% contained less than 500 ppm and over 72% contained less than 50 ppm PCBs; 2) the probability of finding PCBs on a cable surface in excess of 10 ug/100 cm2 was extremely low (less than 0.63%) and there was a 0.09% probability of a cable surface exceeding 100 |ag/100 cm2; 3) there was no correlation between bulk and surface PCB levels, and 4) the mobility of PCBs from internal cable components to the cable surface was negligible.
Because the sampling protocol used in these studies was designed to locate PCBs at high concentrations and the ships sampled represented some of the oldest in the fleet, the results constituted a worst case description of PCB contamination of shipboard electrical cable surfaces. Even though the results were conservatively biased and do not represent valid probability of exposure, the results did indicate minimal risk to personnel or environment due to exposure from PCBs associated with the continued use of Navy
34

ship cables. If a random sampling had been taken, the probability of exceeding of 50 ppm would have been considerably lower.
The Navy also performed studies to determine if certain conditions to which shipboard cables might be exposed could cause the diffusion of PCBs to the cable surface (NCF #87). Seven cables from the decommissioned USS Queenfish with detectable surface levels of PCBs were used. The armor sheath of each cable was removed before the initial surface wipes were collected and treatments applied. Three treatments were evaluated: 1) three cables were subjected to 200°F for 48 hours; 2) three cables were coated with a film of hydraulic and lubricating oil (2190 TEP) and subjected to 140°F for 24 hours, and 3) one cable was subjected to a pressure corresponding to 6000 feet of sea water for 24 hours.
A comparison of the results indicated that PCB levels after treatment were either equal to or slightly less than prior to treatment. Also, the distribution of PCB congeners measured was the same in the before and after treatment swipes, demonstrating that the treatments did not degrade or selectively extract PCB congeners. There was no statistical correlation between the bulk and surface PCB levels in the cable samples. In addition, PSNS acquired further ship and submarine cable bulk and surface PCB- contamination data supporting the conclusion that there was no correlation between cable bulk and surface levels (NCF #87).
These results indicated that the selected treatments did not increase the concentrations of PCBs on the cable surface. After many years of service and abusive treatments, the PCBs in the cable components remained in-place. Therefore, continued use of Navy cable is unlikely to pose a risk of exposure to personnel or the environment.
The use of swipe samples to indicate PCB concentration or exposure is highly uncertain. The USEPA is assuming that a PCB article with <100 |ig/100 cm2 constitutes a PCB-contaminated article (>50 ppm and <500 ppm PCBs), and >100 (ig/100 cm2
constitutes a PCB article (>500 ppm). There is no documentation to show that PCB content can be predicted on the basis of wipe test results. In addition, wipe samples are taken using a hexane saturated cotton swab, which would be expected to extract PCBs even from bound matrixes. Swipe sampling does not indicate the amount of PCBs that would transfer to the skin upon contact.
Bulk samples have shown PCB levels above the USEPA advisory level of 50 ppm in approximately 24% of all cables removed from Navy vessels and crafts (NCF #3). However, PCBs in cable do not pose a direct hazard to personnel or the environment. The PCBs are tightly bound in the plastic, are not released when the cable is cut and do not migrate to the surface. Therefore, they cannot be ingested. PCBs in cables are non- liquid; they do not evaporate and do not present an airborne exposure risk under normal operating or dismantling conditions.
Variations in PCB surface concentrations from the same article have been noted with varying wipe techniques. For example, the Navy subjected one cable sample to
35

repeated surface swipe sampling. The first surface swipe was taken before the armor sheath was removed; all subsequent swipes were taken from insulation material immediately under the sheath. The initial cable surface swipe with the armor sheath intact yielded a PCB level below detection (<1 ug/100 cm2). Three subsequent surface swipes of the insulation (rubber) material all showed the same quantity of PCBs (8 ug/100 cm2). Two additional surface swipes were taken with less pressure and the cable surfaces were only wiped once (versus twice before). Both of these samples showed approximately 2 ug/100 cm2 PCBs (NCF #87). These results suggest that the wiping process can extract PCBs from materials. In addition, the amount of PCBs sampled from a cable surface using the swipe procedure will depend upon exactly how the surface is wiped.
TCLP
At NAVSEA's request, PSNS collected samples of typical shipboard materials known to contain PCBs in excess of 50 ppm. These materials included wool felt sound damping material, Ensolite™ rigid foam insulation, rubber gaskets, paint and electrical cable jacketing. These materials were tested for leachability characteristics. The samples were collected from materials previously analyzed in accordance with USEPA Method 8080 and found to contain PCBs, generally in excess of 50 ppm. The results of the analyses showed that the materials, with the exception of the wool felt, leach less than the limit of 50 ^ig PCBs/L as would be specified in the proposed rule (see Table 10). The felt material, given its high PCB content, leached a remarkably small amount, but the leachate was in excess of the proposed limit. It is likely that the felt's wool fibers have a higher affinity for the TCLP solvent than for the PCBs, causing a small percentage of the PCBs to be freed.
Surface wipes of these materials showed that the PCBs are not mobile and remained fixed in the material (NCF #1). Although additional testing could be conducted, all results to date support this conclusion. The PCBs are contained within the matrix of the non-felt materials, do not migrate to the surface, and would not be expected to leach PCBs in excess of the proposed TCLP limit of 50 ppb.
Available PCB, PCDF and PCDD data from a submarine fire
Air, water, and surface (swipes and core) samples were taken from the USS Thomas A. Edison (USS 610) in 1990 after a fire occurred on the defueled and inactivated submarine while it was in dry-dock. PCB bearing materials were known to exist in thermal insulation, electrical cable and rubber items located in the fire area. The samples were analyzed for PCBs and related combustion products, namely PCDFs and PCDDs. Listed below is a summary of the data (PSNS, 1990).
36

TABLE 10 TCLP RESULTS FROM SHIPBOARD MATERIALS
Ship Hull Number / Location Material Type PCB Content (ppm) TCLP (jug PCB/I) SSN634 / Missile Compartment Felt 110,000 57 SSN641 / Missile Compartment Felt 110,000 65 SSN662 / Torpedo Room Ensolite 1,300 <1.0 SSN662 / Operations Ensolite 13,000 <1.0 SSN657 / Missile Compartment Rubber 260 <1.0 SSN657 / Missile Compartment Rubber 96 <1.0 SSN584 Electrical Cable 32,000 <1.0 SSN656 Electrical Cable 250 <1.0 SSN656 Electrical Cable 950 <1.0 SSN656 Electrical Cable <20 <1.0 SSN634 / Torpedo Room Paint 63 <1.0 SSN634 / Missile Compartment Paint 86 <1.0 SSN634 / Operations Paint 72 <1.0 SSN641 / Operations Paint 10,000 4.8 SSN641 / Missile Compartment Paint 1,500 <1.0 SSN641 / Aux. Machine Room Paint 100 <1.0 SSN650 / Operations Paint 140 <1.0 SSN663 / Bow Compartment Paint 3,000 <1.0 SSN663 / Bow Compartment Paint 280 <1.0 SSN663 / Engine Room Paint 700 <1.0 Adapted from T. Pape, 1995; NCF #1, Enclosure 5.
Air samples
• Nine air samples were taken before the fire occurred. No radioactivity was detected and the PCB levels were all less than the OSHA PEL of 0.5 mg/m3.
• During the fire, when the smoke plume was at its peak, one air sample was taken using the NIOSH protocol; the sample result was 0.0018 mg PCB/m3.
• After the fire, four samples were taken inside the boat, in the fire area. The PCB levels detected in these samples were found to be 0.0045 mg/m3 or less.
Water samples
• Samples were gathered from a pool inside the boat created by water used to fight the fire. One sample taken from the surface of the pool resulted in 619 ppb. Another sample taken from below the surface resulted in 18 ppb.
• Water dripping from the hull was measured at 9 ppb. • Twelve samples from dry-dock discharge inlets were mostly Non-Detects (NDs);
two measured 2 ppb. Two samples from the pump wells measured at 38 and 120 ppb.
• Any concentration detected was above USEPA's current discharge limit of none.
37

Surface samples
Swipe samples taken of the dry-dock in the path of the smoke plume were all NDs. Nine core samples from the dry dock concrete floor were between 1.2 and 1.5 ppm; seven samples were NDs. All external ship samples fell below USEPA's limit of 25 ppm for restricted access areas. Swipe samples for PCBs from areas within the ship showed readings from ND to 430|ag/100cm2.
PCDD samples
• All PCB swipe samples on external surfaces of the ship were ND for PCDDs. • Seven soot samples from inside the ship showed PCDD levels ranged from 0.64 to
24.6 ng/100 cm2. This level of PCDD contamination was considered extremely low.
• PCB cleaning methods were determined adequate for the clean-up of any PCB- generated PCDDs.
• A swipe sample from a fireman's hat gave a positive finding of 53 jig PCB and 5.4 ng PCDD-equivalent per 100 cm2.
In addition, medical monitoring was conducted on all personnel with potential PCB exposure from either the fire or cleanup beginning the day after the fire and continuing through the next six days. Blood samples were analyzed for PCB content. The average blood concentration detected among the 135 individuals with the greatest probability of exposure was 2.61 ppb; the maximum detected concentration was 8.9 ppb. The mean serum concentration in the non-occupationally exposed population in the US has been found to be between 4 and 8 ppb, with 95% of the population having serum PCB concentrations less than 20 ppb (Kreiss, 1985). Therefore, the PCB serum levels were well within the ranges found in non-occupationally exposed populations.
This data indicated that no significant release of PCBs or PCDDs/PCDFs to the environment occurred as a result of the fire. This data also suggested that a significant exposure to these contaminants would not likely result from hot work (involving cutting metals with torches or welding) performed under controlled conditions protective of the workers health. It is noted that cut lines are cleaned to 100 |ag/100 cm2 prior to cutting and workers use appropriate PPE, including supplied air.
Background levels of PCBs
The following paragraphs present ambient levels of PCBs in air, water, soil and foodstuff that have been reported in recent literature. There is little background information on PCB levels in typical construction materials or occupational environments outside of the PCB manufacturing industries.
38

Because of their wide-spread use, high persistence and other physical and chemical properties, PCBs are ubiquitous throughout the environment all over the world. Due to their lipophilic properties, PCBs readily bioaccumulate and are almost universally present in organisms in the environment. Biomagnification in food chains has also been demonstrated. The more highly chlorinated congeners accumulate preferentially.
Air
Globally, PCBs are found in air concentrations from 0.002 to 15 ng/m3. In industrial areas, levels can be as high as 30 ng/m3(ATSDR, 1993.) In general, air levels over industrial areas or landfills are the highest. Air concentrations have a direct effect on PCB levels in rain water and snow. PCBs in rain and snow are found in the range of 1 to 250 ng/L (ASTDR, 1993).
Under indoor occupational conditions, the levels in the air may be much higher. For instance, in the manufacturing of transformers or capacitors, levels of up to 1 mg/m3
have been observed (World Health Organization (WHO), 1993). In acute emergencies, concentrations of up to 16 mg/m3 have been measured (WHO, 1993). Through fires and/or explosions, soot has been produced that contains levels of 8000 mg PCB/kg soot. In the latter situation, PCDFs may also be present. PCDDs may be found in fire accidents with transformers containing simple chlorinated benzenes and PCBs.
Of interest for comparing airborne levels on operating submarines to background levels are those values reported in the literature for indoor office buildings and residential settings. MacLeod (1981) estimated the presence of PCBs in workplaces and homes in the US. Three facilities, an industrial research facility, an academic facility, and a shopping complex were sampled. Periods of sampling ranged from two days to six months. It was found that the median indoor air concentration of PCBs was at least one order of magnitude higher than that in the surrounding outdoor air. The average indoor air concentrations (calculated as Aroclor 1242 plus Aroclor 1254) ranged from 44 to 240 ng/m3. Outdoor levels of up to 18 ng/mg3 were found. Several homes were also sampled. In the homes, 9 out of 14 areas sampled were kitchens. The average concentrations in kitchens ranged from 150 up to 500 ng/m3 and, in other rooms, from 39 to 170 ng/m3. In one library, a level of 400 ng/m3 was detected. It has been suggested that certain electrical appliances and devices (such as fluorescent lighting ballasts) and building materials (elastic sealant), which have PCB-containing components, may emit PCBs into the indoor air, thereby elevating indoor PCB levels significantly above outdoor background levels (Balfanz et al., 1993).
Oatman and Roy (1986) studied PCB exposure levels in public buildings in Minnesota. Air samples and surface wipe samples taken in five state-owned office buildings and two elementary schools were analyzed for Aroclor 1242, 1254, and 1260. The average airborne levels in buildings with PCB transformers were nearly twice the levels in buildings without transformers containing PCBs, (i.e., 457 ± 223 versus 229 ±
39

106 ng/m3, respectively). The mean concentration of surface wipes taken in buildings without PCB transformers was 0.17 (ig/100 cm2; the mean of wipes taken in buildings with PCB transformers was 0.23 fig/100 cm2. As shown above, there was wide variation in air concentrations between different buildings; however, the air concentrations were significantly affected by the presence of PCB containing transformers. Unlike this data, the lack of detetion of air concentrations of PCBs aboard Navy vessels during normal operations agin suggest that the PCBs are bound.
Water
Surface water may be contaminated by PCBs from atmospheric fallout, direct emissions from point sources, or waste disposal. Because of adsorption on suspended particles, PCB concentrations in heavily contaminated waters may be several times greater than the solubility of PCB would deem feasible. When sediment is allowed to settle out of a water column, PCBs are generally no longer above the detection limit.
The concentrations of PCBs in large open water masses such as the oceans and Great Lakes provide useful information for establishing background levels in water. The total concentration of 82 congeners of PCB in water from Lake Superior decreased to a value of 0.18 ng/L in 1992 from its value of 2.4 ng/L in 1980 (Jeremiason et al., 1994), reflecting the diminishing levels of background PCBs in the environment since the discontinuation of their use. The mean concentration in Lake Michigan was 1.8 ng/L, with concentrations higher in near-shore samples (mean of 3.2 ng/L) than in open lake samples (mean of 1.2 ng/L). In polluted waters in the Netherlands and the coastal Lake Michigan area, levels of 100 to 500 ng/L water have been measured (WHO, 1993). In non-polluted fresh waters of North America, fresh waters might contain less than 5 ng/L (WHO/EURO, 1988). In the oceans, levels of 0.05 to 0.6 ng/L have been found. (WHO, 1993)
PCBs have been found in surface waters throughout the world. In non- contaminated areas, drinking water contains less than 1 ng PCBs/L, but levels of up to 5 ng/L have been reported (WHO, 1993). Filtration is very effective in reducing PCB levels in water.
Soil and Sediment
Soil and sediment in several unpolluted areas contain levels of PCBs ranging from less than 0.01 up to 2.0 mg/kg. In industrialized areas, the levels detected are much higher (i.e., up to 500 mg/kg) (WHO, 1993).
40

Food
In past years, many thousands of samples of different foodstuffs have been analyzed in several countries for contaminants including PCBs. Most samples have been taken from individual food items, especially fish, meat and milk. Human food has become contaminated with PCBs by three main routes:
• Uptake from the environment by fish, birds, livestock (via food chain) and crops, • Migration from packaging materials into food (mainly below 1 mg/kg but, in some
cases, up to 10 mg/kg), and • Direct contamination of food or animal feed by an industrial accident.
The levels for the most important PCB-containing food items were: animal fat (20- 240 jig/kg), cow's milk (5-200 ng/kg), butter (30-80 ng/kg) and fish (10-500 ng/kg), on a fat basis. These are the major foods in which PCB contamination needs consideration. Vegetables, cereals, fruits, and a number of other products contained levels of less than 10 (ag/kg. It appears that PCB levels in fish and animal foodstuffs are slowly decreasing (WHO, 1993).
On the basis of the evaluated backgroung data, the adult average dietary intake of PCBs amounts to a maximum of 100 \xg per week or approximately 14 |ag/person-day. For a 70 kg person, this is an intake of 0.2 ^g/kg body weight-day (WHO/EURO, 1988).
41

RISK CHARACTERIZATION
Two exposure pathways were identified as potential risk to workers, inhalation and dermal exposure. However, no vapor phase was detected during dismantling operations (cleaning of ventilation systems and at-sea operations) and appropriate PPE was used to prevent exposure to particulates. Therefore, inhalation is not a pathway of concern and no further action is required beyond the standard workplace monitoring. The issue of potential dermal exposure to solid or bound PCBs versus liquid raises the question of transfer and absorption. A probabilistic risk assessment on crew members and shipyard maintenance workers, the two cases where dermal exposure is most likely, was performed using Crystal Ball® (Decision Engineering, Denver CO, 1993). In this approach, a distribution of data rather than a single data point is used to represent key exposure variables. A range of results are then calculated.
For active duty crew members the distributions listed in Table 11 were used in the risk calculation. It was assumed the only dermal area to be in contact with painted surfaces and gaskets were the hands and forearms. The frequency of exposure was estimated to be 30 minutes each day. While sleeping, eating and at a workstation the crew members would not be contacting any surface which may contain PCBs. The limited exception would include any repair activities. Those would then be considered maintenance and the frequency would not apply for the entire time that individual would be aboard the submarine or ship. The days per year onboard ship is estimated to range from 180 to 335 days with a point estimate of 10 months or 305 days.
For shipyard workers it was also assumed that only the forearms would be exposed to PCB-containing materials. During dismantling activities these workers wear PPE. However, a worst case scenario was assumed to cover periods when general maintanance and repairs are conducted and PPE may not be worn . During maintanance and repair workers may contact materials of high concentrations such as felt damping or rubber caskets.
The representative distribution of swipe concentrations that active crew members may be exposed to included only samples from submarine compartments where work is normally conducted, i.e. the engine room, auxiliary machine room, operation room, sonar room, etc. This was done to ensure that concentrations from inner hull or materials inaccesssible during normal operations would not be included in the analysis. Materials such as PCB saturated felt damping and other insulating materials highly skew the concentration distributions and would result in overestimation of risk by two or more orders of magnitude. In the risk calculation one half of the detection limit was used in the case of NDs and 5 percent of the outliers were removed.
42

TABLE 11 EXPOSURE FACTOR ASSUMPTIONS
Factor Distribution Type
Range Means or most likely value
Basis
c = swipe lognormal ND-80 8.41 ng/100cm2 PSNS PCB concentration PCB iag/100cm2 database onboard stdev = 15.4 c = swipe lognormal ND - 590 29.07ng/100cm2 PSNS PCB concentration PCB |ag/100cm2 database from dismantled stdev = 56.6 materials sa = surface area triangular 1690-4050 3120 cm2/day surface area of contacted cm2/day hands and foreams (arms/hands) (Versar, Inc. 1991) t = transfer factor triangular 1 - 25% 10% Hammerstram, 1986 a = dermal absorption triangular 12-44% 30% Wester et. al. 1993 d = duration (active triangular 2 - 20 yr 8yr Navy communication crew) d = duration (shipyard triangular 1- 20 yr 2yr Navy communication workers) cf = conversion factor NA NA 0.001 mg/ug NA f = frequency of triangular 3.75 - 6.98 6.35 d/yr 30 minute exposure exposure (active crew) d/yr per day while
onboard 180-335 d/yr with the mean at 305 d/yr
f = frequency of triangular 22.5-64.8 d/yr 31.3 d/yr 6 hr/day on exposure (shipyard dismantling projects, workers) from 90 to 250 d/tyr
with the mean of 6 hr/d for 125 d/yr
bw = body weight lognormal 46-143 kg stdev = 12.2
Mean = 81 kg Flemming etal., 1996
at = lifetime averaging - - 25,550 d Based upon a 70 yr time lifetime. (USEPA,
1989) NA= not applicable, ND = nondetects, stdev = standard deviation
The distribuition used to represent shipyard workers included the entire database, with 5 percent of the outliers removed. NDs were again assigned one half the detection limit (2.5 ug/cm2). This population is more likely to contact materials with high PCB concentrations during dismantling activities. Because the PSNS PCB database compiles the results from various types of materials sampled, several of which are not identified in the database, very large variance was expected.
43
Body weight was derived from an extensive survey of Navy fleet members (Flemming et al., 1996). It is believed that this distribution better represents Naval submariners than body weight distributions from the general population. Body weight and total skin surface area are strongly correlated. Phillips et al. (1993) reported a correlation coefficient of 0.986 from a data set of 401 adults, indicating that surface area is dependent on body weight. This study did not develop correlation between surface area to body weight for specific parts of the human body. A literature search did not reveal any such studies, however the correlation between body weight and the surface area of the forearms and hands is not expected to be as high due to the presence of less fat on the extremites. Therefore, a correlation of 0.75 was assumed between body weight and surface area of the hands and forearms. The actual correlation is likely to be higher. Assuming a correlation of 0.75 is conservative and reduces uncertainty.
Distributions of several parameters were not available, such as absorption, frequence and duration. In situations where the minimum, maximum and 'most likely to occur' values were known, triangular distributions were assigned. Lifetime Average Daily Dose (l_ADD) is calculated using the equation below and the parameters listed in Table 11.
LADD = cxsaxtxaxdxfxcf bwxat
The LADD is then multiplied by a cancer slope factor to calculate a risk level. A detailed description of each of the assumptions, including the distribution data of each probability distribution used in the model are provided in Appendix A.
The recent USEPA approach to PCB dose-response assessment recommends a tiered approach to quantify risk from persistent PCB contamination (USEPA, 1996). A range from a central slope to an upper-bound slope is assigned to three tiers of potential risk. The upper bound slope (2 mg/kg-d "1) of the high risk tier was used in assessing dermal risk. The high risk level is applied in cases using an absorption factor and also accounts for dioxin-like congeners which may be present in the media. If intake is not adjusted with an absorption factor, USEPA recommends using the central slope (0.3 mg/kg-d"1) for the low risk and persistence tier. For this risk assessment, a uniform distribution between 0.3 and 2.0 mg/kg1 was used.
The resulting frequency distributions of risk to both the active crew and the shipyard workers are shown in Figures 2 and 3, respectively. The forecasted risk from dermal exposure to both the active crew members are the shipyard workers are at acceptable levels.
44

.12
.092
:= .06 J= ca
g .03 OL
.000
0.00E+
Frequency Chart 975 Trials Shown 52
iBMean = 3.88E-7B, llfflllllll.l. -111~ T-1 T.\., ■ .ii
5.63E-7 1.13E- 1.69E-
39
CD
26 - n
i 2.25E-6
Figure 2. Forecast: Risk to Active Crew
The entire simulated range of risk to the active crew is from 2.26E-9 to 6.65E-6. After 975 Trials, the standard error of the mean is 3.56E-8. The 90 percentile is 9.77E-7. Therefore, the risk to the active crews from dermal uptake of PCBs is insignificant and does not warrant further investigation or mitigation to reduce exposure. The statistics of the forcast are listed in Appendix B.
.258 i
.19
S .12 JD (5
J3 O
.064
.000
0.00E+
Frequency Chart
BMean = 9.73E-6g I.I.I...I.I.I .-. i-i ~
981 Trials Shown 253
18
12
63.2
rt
CO
2.00E-5 4.00E-5 6.00E-5 i
8.00E-5
Figure 3. Forecast: Risk to Shipyard Workers
Risks to the shipyard workers were slightly higher due to a higher exposure concentration and contact rate. The entire range is from 1.08E-8 to 3.82E-4. After 1000 trials, the standard error of the mean is 8.03E-7 and the mean is 9.73E-6 (Figure 3). The 90th percentile is at a risk level of 2.31E-5, well within acceptable levels. A summary of the forecast statistics is provided in Appendix B.
This distribution of risk incorporates the assumption that shipyard workers will directly contact any PCB-containing material on the submarines during dismantling
45

activities. These results represent a worse case scenario. In actuality, the workers wear PPE and the dermal pathway is unlikely if not eliminated completely.
Sensitivity analysis allows judgment of those assumptions which have the most influence on risk. During each simulation, the assumptions are ranked according to their correlation to the forecast result. The assumptions with the highest ranked correlation can be considered the most important factors in the model.
The results of the sensitivity analysis performed on the risk calculations are presented in Figure 4. The exposure parameter contributing the greatest variance to risk is surface concentration. The measured ranked correlations for surface concentration and transfer factor were 0.75 and 0.41, respectively. This was expected at the onset of the assessment, given the highly skewed distribution of collected PCB swipe data. The parameter contributing the second highest amount of uncertainty is the transfer rate of PCBs from the various media to the skin. Consistent data on this factor was not available at the time of the analysis. The assigned triangular distribution, ranging from 0 to 50% with a most likely value of 10% (see Table 12 and Appendix A), represents a very conservative assumption which impacts uncertainty in the direction of overestimation.
Data regarding the variability of transfer rates from different media is not available. The swipe samples were taken using hexane soaked gauze which is likely to result in significantly higher levels than samples collected without a solvent. As discussed earlier, it has been demonstrated that the variation in pressure applied while conducting swipe sampling will result in varying surface concentrations.
Sensitivity Chart
Surface concentration on board
Transfer Factor
.75
.4
■ Jl^H
Cancer Slope Factor .3 ■■ Exposure duration of active crew .3 ■■ Skin absorption factor .2 M Exposure frequency of dismantling .1 ■ Skin surface area .04 1 Surface concentration .04 1 Exposure Frequency .0 J BW = Body weight .0 1 Exposure duration shipyard workers .00 1 * - Correlated assumption -0.5 0 0.5
Measured by Rank Correlation
Figure 4. Target Forecast: Risk to Active Crew
46
RECOMMENDATIONS
Based upon the information gathered a number of recommendations have been identified which would be useful for reducing the uncertainties in the human health risk assessment. Many of these recommendations address the lack of specific data for assessing exposures. Other recommendations identify additional research needs. The following paragraphs discuss these needs and recommendations in further detail.
Relevant exposure information
The air and wipe sample data, provided from the NAVSEA Copy File and PSNS have indicated that air concentrations under most operational and dismantling conditions remain below detection limits. Westinghouse Material Technology Development has additional information regarding work-time studies on these vessels for establishing "real world" exposure scenarios and information regarding characterization data. This information could increase the data base for the risk assessment and should be included.
A toxicity assessment of the Aroclor 1268 mixture
A number of literature searches on Aroclor 1268 toxicity and its congener breakdown have resulted in very limited information. Aroclor 1268 has been detected throughout Navy submarines and surface ships. Studies have shown increasing toxicity of PCBs with increased chlorine content up to 60% and possible decreasing toxicity above 60%. Dose response and toxicity information on Aroclor 1268 would be useful in assessing its risks inconjunction with Navy vessels.
An assessment of transfer factors and dermal absorption rates of PCBs
Dermal absorption appears to be a significant exposure route for liquid but not for solid PCBs. Dermal contact to PCBs in Navy submarines and surface ships would primarily involve contact with a PCB-containing material (e.g., paint and insulating materials). In such cases, the PCBs are bound in solid phase. Transfer rates for determining bioavailability from these materials have not been determined; however, the results of TCLP tests suggest PCBs are not highly mobile. In addition, dermal absorption rates of PCBs have been reported to range from approximately 1% using a soil dosing media, to 44% using water as the dosing vehicle (Wester et al., 1993).
47

Conclusion
These gaps increase the uncertainty and tend to overestimate the potential risk in the final assessment. Human data in the literature are of limited value, since PCB exposures were mixtures, specific aroclors were frequently not identified and specific congeners were never identified. The results of sampling and data review indicated that with proper engineering controls dioxins (PCDDs) and furans (PCDFs) are not a concern during dismantling and an inhalation exposure pathway is not significant. Navy studies to date show that PCBs remain bound in the cable and paints and the potential for dermal exposure does not appear to be a significant pathway.
48

REFERENCES
ACGIH. 1961. Report of the Committee on Threshold Limits. In: Transactions of the 23rd Annual Meeting, American Conference of Governmental Industrial Hygienists, Detroit, April 9-12. pp. 70-8.
ACGIH. 1991. Documentation of the Threshold Limit Values and Biological Exposure Indices, Sixth Edition. American Conference of Governmental Industrial Hygienists, Inc., Cincinnati, OH.
Allen JR, Carstens LA, Barsotti DA. 1974. Residual effects of short-term, low-level exposure of nonhuman primates to polychlorinated biphenyls. Toxicol. Appl. Pharmacol. 30: 440-51. (Cited in NIOSH, 1977.)
ATSDR. 1993. Toxicological profile for selected PCBs (Aroclor -1260, -1254, -1248, - 1242, -1232, -1221, and -1016). U.S. Department of Health and Human Services, Public Health Service. TP-92/16.
Bahn A, Grover P. Rosenwaike I, O'Leary K, Stellman J. 1977. PCB and melanoma. N. Engl. J. Med. 296: 108.
Bahn AK, Rosenwaike I, Herman N, Grover P, Stellman J, O'Leary K. 1976. melanoma after exposure to PCB. N. Engl. J. Med. 295: 450.
Balfanz E, Fuch J, Kreper H. 1993. Sampling and analysis of PCBs in indoor air due to permanently elastic sealants. Chemosphere 26(5): 871-80.
Barsotti DA, Marlar RJ, Allen JR. 1976. Reproductive dysfunction in rhesus monkeys exposed to low levels of polychlorinated biphenyls (Aroclor 1248). Fd. Cosmet. Toxicol. 14: 99-103. (Cited in NIOSH, 1977.)
Bell M. 1976. Ultrastructural features of gastric mucous and sebaceous glands after ingestion of Aroclor 1242 by rhesus monkeys. In: Proceedings of the National Conference on Polychlorinated Biphenyls, November 19-21, 1975, Chicago, EPA 560/6- 75-004. U.S. Environmental Protection Agency, Office of Toxic Substances, pp. 350-8. (Cited in NIOSH, 1977.)
Bertazzi PA, Riboldi L, Pesatori A, Radice L, Zocchetti C. 1987. Cancer mortality of capacitor manufacturing workers. Am. J. Ind. Med. 11: 165-76.
Bertazzi PA, Zocchetti C, Guercilena S, Delia Foglia M, Pesatori A, Riboldi L. 1982. Mortality study of male and female workers exposed to PCBs. In: Proceedings of the international symposium on prevention of occupational cancer, Helsinki, 1981. Geneva, International Labor Office, pp. 242-8. (Cited in IARC, 1987.)
49

Birmingham DJ. 1964. Occupational dermatology - current problems. Skin 3: 38-42. (Cited in NIOSH, 1977.)
Brown DP. 1986. Mortality of workers exposed to polychlorinated biphenyls: An update. National Institute for Occupational Safety and Health. NTIS PB86-2016000.
Brown DP, Jones M. 1981. Mortality and industrial hygiene study of workers exposed to polychlorinated biphenyls. Arch. Environ. Health 36:120-9. (Cited in IARC, 1987.)
Brown DP. 1987. Mortality of workers exposed to polychlorinated biphenyls. An update. Arch. Environ. Health 42(6): 333-9. (Cited in IARC, 1987.)
Brunner MJ, Sullivan TM, Singer AW, Ryan mj, Toft II JD, Menton RS, Graves SW, Peters AC. 1996. An assessment of the chronic toxicity and oncogencity of Aroclor-1016, Aroclor-1254, and Aroclor-1260 administered in diet to rats. Columbus, OH: Battelle Study No. SC920192., Chronic toxicity and oncogenicity report. (Cited in EPA/600/P- 96/001F).
Buser HR. 1979. Formation of polychlorinated dibenzofurans (PCDFs) from the pyrolysis ofPCBs. Chemosphere 5: 439.
Curley A, Burse VW, Grim ME. 1973. Polychlorinated biphenyls- Evidence of transplacental passage in the Sherman rat. Fd. Cosmet. Toxicol. 11:471-76. (Cited in NIOSH, 1977.)
Davidorf FH, JA Knupp. 1979. Epidemiology of ocular melanoma: Incidence and geographic relationship in Ohio (1967-1977). Ohio State Med. J. 75: 561-4.
Decision Engineering, Inc. 1993. Crystal Ball® Version 3.0. Denver, CO.
DiGiovanni J, Viaje A, Berry DL, Slaga TJ, Juchau MR. 1977. Tumor-initiating ability of 2,3,7,8-tetrachlorodibenzo-p-dioxin (TCDD) and Aroclor 1254 in the two-stage system of mouse skin carcinogenesis. Bull. Environ. Contam. Toxicol. 18: 552-7. (Cited in IARC, 1987.)
Drinker CK. 1939. Further observations on the possible systemic toxicity of certain of the chlorinated hydrocarbons with suggestions for permissible concentrations in the air of workrooms. J. Ind. Hyg. Toxicol. 1: 155-9. (Cited in ACGIH, 1991.)
Emmet EA, Maroni M, Jeffries J, Schmith J, Levin BK, Alvares A. 1988. Studies of transformer repair workers exposed to PCBs. II. Results of clinical laboratory investigations. Am. J. Ind. Med. 14: 47-62.
Flemming CD, Little OM and Carpenter RL, 1996. Statistical Description of Physiological Variable for seven Naval Populations. Naval Medical Research Institute/Toxicology Detachment, Wright-Patterson Air Force Base, OH. Unpublished.
50

Gustavsson P, Hogstedt C, Rappe C. 1986. Short-term mortality and cancer incidence in capacitor manufacturing workers exposed to polychlorinated biphenyls (PCBs). Am. J. Ind. Med. 10: 341-4. (Cited in IARC, 1987.)
Hammerstrom KA. 5 Feb 1986. Cleanup of PCB Spills Located Indoors. EPA Memorandum.
Hara.l, Harada A, Kimura S, Endo T, Kawano K. 1974. Follow-up study of condenser factory after use of PCB discontinued (Part I). Japan Journal of Industrial Health 16: 365- 6. (Jap) (Cited in NIOSH, 1977.)
Hara et al. 1975. Follow-up study of condenser factory after use of PCB discontinued (Part III). Japan Journal of Industrial Health 17: 371-2. (Jap) (Cited in NIOSH, 1977.)
Hasegawa H, Sato M, Tsuruta H. 1972. Report on survey of work area environment where PCB is handled and of the health of workers handling PCB. In: Special Research Report on Prevention of Environmental Pollution by PCB-like Substances. Japan, Research Coordination Bureau, Science and Technology Agency, pp. 141-99. (Jap) (Cited in NIOSH, 1977.)
Hori M, Fujita K, Yamashiro K, Toriyama F, Hirose R, Shukuwa T, Toyoshima H, Yoshida H. 1985. Methylcholanthrene induced mouse skin cancer. Fukuoka Igaku Zasshi 76: 208-14. (Cited in IARC, 1987.)
Hornung R, Reed L. 1990. Estimation of average concentration in the presence of non- detectable values. Appl. Occup. Environ. Hygiene 5(1): 46-51.
Hsu S, Ma C, Kwo-Hsiung S, Wu S, Hsu N, Yeh C, Wu B. 1985. Discovery and epidemiology of PCB poisoning in Taiwan: A four year follow-up. Environ. Health Perspect. 59: 5-10.
IARC. 1978. IARC monographs on the evaluation of the carcinogenic risk of chemicals to humans. Volume 18. World Health Organization, Lyon, France, pp. 22, 66-7.
IARC. 1987. IARC monographs on the evaluation of the carcinogenic risk of chemicals to humans. Supplement 7. World Health Organization, Lyon, France, pp. 322-6.
Ito N, Nagasaki H, Arai M, Makiura S, Sugihara S, Hirao K. 1973. Histopathologic studies on liver tumorigenesis in mice by technical polychlorinated biphenyls and its promoting effect on liver tumors induced by benzene hexachloride. J. Natl. Can. Inst. 51: 1637-46.
Ito N, Nagasaki H, Makiura S, Arai M. 1974. Histopathological studies on liver tumorigenesis in rats treated with polychlorinated biphenyls. Gann. 65:545-9. (Cited in IARC, 1978.)
51

Jeremiason JP, Hornbuckled KC, Eisenreich SS. 1994. PCBs in Lake Superior-1978- 1982: Decreases in water concentrations reflect loss by volatilization. Environ Sei Technol. 28(5): 903-14.
Kikuchi M. 1984. Autopsy of patients with Yusho. Am. J. Ind. Med. 5: 19-30. (Cited in IARC, 1987.)
Kimbrough RD, Linder RE. 1974. Induction of adenofibrosis and hepatomas of the liver in BALB/cJ mice by polychlorinated biphenyls (Aroclor 1254). J. Natl. Cancer Inst. 53: 547-52.
Kimbrough RD, Linder RE, Gaines TB. 1972. Morphological changes in livers of rats fed polychlorinated biphenyls. Light microscopy and ultrastructure. Arch. Ind. Health 25: 354- 64.
Kimbrough RD, Squire RA, Linder RE, Strandberg JD, Montali RJ, Burse VW. 1975. Induction of liver tumors in Sherman strain female rats by polychlorinated biphenyl Aroclor 1260. J. Natl. Cancer Inst. 55: 1453-9.
Kimura NT, Baba T. 1973. Neoplastic changes in the rat liver induced by polychlorinated biphenyl. Gann. 64: 105-8. (Cited in IARC, 1978.)
Kreiss K. 1985. Studies on populations exposed to PCBs. Environmental Health Perspectives, 60: 193-199.
Kunita N, Kasshimoto T, Miyata H, Fukushima S, Hori S, Obana H. 1984. Causal agents of Yusho. Am J Ind Med. 48:5-45.
Kuratsune M, Nakamura Y, Ikeda M, Hirohata T. 1986. Analysis of deaths seen among patients with Yusho (Abstract FL17). In: Dioxin 86. 1986. Proceedings of the VI International Symposium on Chlorinated Dioxins and Related Compounds. Fukuoka, Japan, pp. 179. (Cited in IARC, 1987.)
Lawrence C. 1977. PCB? and melanoma. N. Engl. J. Med. 296: 108.
Levy B, Meyer C, Lowry L, Smallwood A. 1977. Health Hazard Evaluation Determination Report No. 76-52-386, Hazard Evaluation Services Branch, Division of Technical Services, Westinghouse Electric Corporation, Bloomington, Indiana. Cincinnati, US Dept. Health, Education, and Welfare, Center for Disease Control, National Institute for Occupational Safety and Health. (Cited in NIOSH, 1977.)
Linder RE. Gaines TB, Kimbrough RD. 1974. The effect of polychlorinated biphenyls on rat reproduction. Fd. Cosmet. Toxicol. 12: 63-77. (Cited in NIOSH, 1977.)
MacLeod KE. 1981. Polychlorinated biphenyls in indoor air. Environ. Sei. Technol. 15: 926-8.
52

Meigs JW, Albom JJ, Kartin BL. 1954. Chloracne from an unusual exposure to Aroclor. JAMA 154: 1417-18. (Cited in ACGIH, 1991.)
Masuda Y, Kurok H, Haraguchi K, Nagayama J. 1985. PCB and PCDF congeners in the blood and tissues of Yusho an dYu-Cheng patients. Environ Health Perspect. 59:53-58.
Moore JA. 1 Jul 1991. Letter from President IEHR to Hon. H. Habich.
Moore JA, Hardisty J, Banas D, Smith M. 1994. A comparison of liver tumor diagnoses from seven PCB studies in rats. Reg. Toxicol. Pharmacol. 20: 362-70.
Morgan R, Ward J, Hartman P. 1981. Aroclor 1254-induced intestinal metaplasia and adenocarcinoma in the glandular stomach of F-344 rats. Cancer Res. 41: 5052-9.
National Safety Council. 1988. Fundamentals of Industrial Hygiene, 3rded.
NCF#1. Department of Navy. 17 Apr 1995. Complete response to proposed rule.
NCF #3. Memo from Commander NAVSEA to Naval Vessel Register. 4 Feb 1994. Management of Electrical Cables Removed form Vessels and Crafts (Revised). Ser 03VE/026.
NCF #13. Memo to CDR, Norfolk NSY. 9 Jul 1993. Surface wipe survey of food service and living areas in Navy ships approval.
NCF #24. Edmonds, I. 1990. Polychlorinated Biphenyls Generated by Extraction Systems' Duct Cleaning System. Test Report No. TRPSNS/PCB-90/260.4-01. PSNSY, Bremerton, WA.
NCF #87. Ross, M; Mangum, S. & Adema, C. 19 Apr 1993. Sampling and Analysis of Polychlorinated Biphenyls in Navy Ship Cables. Report prepared for the Naval Sea Systems Command Code 05V. Letter Ser 6110/121.
NCI. 1978. Bioassay of Aroclor 1254 for possible carcinogenicity. Natl. Can. Inst. NTIS PB279624.
NIOSH. 1977. Criteria for a recommended standard...Occupational Exposure to Polychlorinated Biphenyls (PCBs). Publication No. 77-225. U.S. Department of Health, Education, and Welfare, Center for Disease Control, National Institute for Occupational Safety and Health.
NIOSH. 1994. Manual of analytical methods, 4th edition. P&CAM 244, U.S. Department of Health, Education, and Welfare.
53

Norback DH, Weltman RH. 1985. Polychlorinated biphenyl induction of hepatocellular carcinoma in the Sprague-Dawley rat. Environ. Health Perspect. 60: 97-105. (Cited in IARC, 1987.)
Oatman L, Roy R. 1986. Surface and indoor air levels of polychlorinated biphenyls in public buildings. Bull. Environ. Contam. Toxicol. 37: 461-6.
Okumura M, Sakaguchi S. 1985. Hepatic cell carcinoma and the patients with Yusho. Fukuoka Igaku Zasshi 76: 229-32. (Cited in IARC, 1987.)
Oliver NE. 1969. Chloracne. Arch. Dermatol. 99: 127-8. (Cited in NIOSH, 1977.)
Ouw HK, Simpson GR, Siyali DS. 1976. The use and health effects of Aroclor 1242, a polychlorinated biphenyls in an electrical industry. Arch. Environ. Health 31: 189-94. (Cited in NIOSH, 1977.)
Phillips LJ, Fares RJ and Schweer G, 1993. Distributions of total skin surface area to body weight ratios for use in dermal exposure assessments. J Expos Anal Environ Epidemiol. (3)3: 331-338.
PSNS. 18 Apr 1990. Fire on the Thomas A Edison (SSN 610) Environmental Impact Investigation. Bremerton, Washington. Letter Ser 6000/063.
PSNS. Apr 1994. PCB, Sampling and Handling of, Industrial Process Instruction, Puget Sound Naval Shipyard, WA.
Safe S. 1994. Polychlorinated biphenyls environmental impact biochemical and toxic responses and implications for risk assessment. Crit. Rev. Toxicol. 24(2): 87-149.
Schaeffer E, Greim H, Goessner W. 1984. Pathology of chronic polychlorinated biphenyl (PCB) feeding in rats. Toxicol. Appl. Pharmacol. 75: 278-88.
Schwartz L. 1936. Dermatitis from Synthetic Resins and Waxes. Am. J. Pub. Health 26: 586-592. (Cited in ACGIH, 1991.)
Schweer G. 18 Apr 1986. PCB Spill Exposure Scenarios. EPA Memorandum.
Schwoppe AD, Costa PP, Jackson JO, Weitman, DJ. 1985 Guidelines for the selection of chemical protective clothing. 2nd ed. (Report sponsored by the U.S.EPA, Office of Occupational Health and Safety, Washington, D.C.) Arthur D. Little, Inc., Cambridge, Massachusetts.
Shalat S, True L, Fleming L. 1989. Kidney cancer in utility workers exposed to polychlorinated biphenyls. Br. J. Ind. Med. 46: 823-4.
54

Sinks T, Steele G, Smith AB, Watkins K, Shults RA. 1992. Mortality among workers exposed to polychlorinated biphenyls. Am. J. Epidemiol. 136(4): 389-98.
Treon JF, Cleveland FP, Cappel J, Atchley RW. 1956. Thetoxicity of the vapors of Aroclor 1242 and Aroclor 1254. (Cited in ACGIH, 1991.)
Umeda G. 1984. Studies on long-term effects of PCBs on human body: mortality from primary liver cancer and prevalence of ischemic heart disease (Abstract #19.8). In: Eustace IE, ed. 1984. Proceedings of the XXI International Congress on Occupational Health, Dublin, pp. 166. (Cited in IARC, 1987.)
Unger M, Kiaer H, Blichert-Toft M, Olsen J, Clausen J. 1984. Organochlorine compounds in human breast fat from deceased persons with and without breast cancer and in a biopsy material from newly diagnosed patients undergoing breast surgery. Environ. Res. 34: 24-8. (Cited in IARC, 1987.)
Unger M, Olsen J, Clausen J. 1982. Organochlorine compounds in the adipose tissue of deceased persons with and without cancer: a statistical survey of some potential confounders. Environ. Res. 29: 371-6. (Cited in IARC, 1987.)
USEPA. 1986a. Office of Research and Development, Office of Health and Environmental Assessment, "Health Effects Assessment for Polychlorinated Biphenyls (PCBs)", EPA/540/1-86-004.
USEPA. 1986b. Risk assessment guidelines of 1986. EPA document #EPA/600/8- 87/045.
USEPA. 1989. Risk assessment guidance for SUPERFUND, Volume 1, human health evaluation manual (Part A). EPA/540/1-89/002. Office of Emergency and Remedial Response, Washington, DC
USEPA. 1996 . PCBs: cancer dose-response assessment and application to environmental mixtures. EPA document #EPA/600/P-96/001F. National Center for Environmental Assessment, Office of Research and Development, Washington DC.
Versar, Inc. 1991. Analysis of the impact of exposure assuptions on risk assessment of chemicals in the environment, phase II: uncertainty analyses of existing exposure assessment methods, Draft Report. Prepared for Exposure Assessment Task Group, Chemical Manufacturers Association, Washington, D.C.
Ward JM. 1985. Proliferative lesions of the glandular stomach and liver in F344 rats fed diets containing Aroclor 1254. Environ. Health Perspect. 40: 89-95. (Cited in IARC, 1987.)
55
Wester R, Maibach H, Sedik L, Melendres J. 1993. Percutaneous absorption of PCBs from soil: In vivo rhesus monkey, in vitro human skin, and binding to powdered human stratum corneum. J. Toxicol. Environ. Health. 39: 375-82.
WHO. 1993. Environmental health criteria 140. Polychlorinated biphenyls and terphenyls (Second Edition). World Health Organization, Geneva, pp. 149-211.
WHO/EURO. 1988. PCBs, PCDDs and PCDFs in breast milk. Results on WHO coordinated interlaboratory quality control studies and analytical field studies. World Health Organization, Regional Office for Europe (Environmental Health Series 34), Copenhagen. (As cited by WHO, 1993).
Yassi A, Täte R, Fish D. 1994. Cancer mortality in workers employed at a transformer manufacturing plant. Am. J. Ind. Med. 25(3): 425-37.
Yoshimura T. 1974. Epidemiological study on Yusho babies born to mothers who had consumed oil contaminated by PCB. Fukuoka Acta Med. 65: 74-80. (Jap) (Cited in NIOSH, 1977.)
56

APPENDIX A
Assumptions Used in Probabilistic Risk Assessment
Assumption: Skin surface area (cm )
Triangular distribution with parameters: Minimum 1.69E + 03 Most likely 3.12E + 03 Maximum 4.05E + 03
Selected range is from 1.69E + 3 to 4.05E + 3 Mean value in simulation was 2.99E + 3
l.flK*] MK*1 2.S7E*] 3.4« »3 «,05E*3
Correlated with: BW = Body weight (kg) 0.75
Assumption: Surface concentration on board (ug/cm )
Lognormal distribution with parameters: Mean 8.41 E-02 Standard Dev. 1.54E-01
Selected range is from 0.00E + 0 to 7.73E-1 Mean value in simulation was 7.34E-2
on board (ug/cmZ)
L 1.0Ä-3 3.»«-1 7.0TC-1 1 15E + 0 1.53C + 0
Assumption: Surface concentration (dismantling) (ug/cm2)
Lognormal distribution with parameters: Mean 2.91 E-01 Standard Dev. 5.66E-01
Selected range is from 0.00E + 0 to 5.00E + 0 Mean value in simulation was 3.03E-1
Surfac* conoMtratton (dlamandlng) (wQtama)
1.111-1 1.4H.0 :.B4C*0 4.2B€*0 5.«tl*0
57

Assumption: Skin absorption factor (unittess)
Triangular distribution with parameters: Minimum Most likely Maximum
1.20E-01 3.00E-01 4.40E-01
Selected range is from 1.20E-1 to 4.40E-1 Mean value in simulation was 2.87E-1
SUn Mbmorption factor (unmam)
J.OOC-I 2.BOE1 J.90C-I
Assumption: Exposure Frequency (day/yr)
Triangular distribution with parameters: Minimum 3.71E + 00 Most likely 6.35E + 00 Maximum 6.98E + 00
Selected range is from 3.71E + 0 to 6.98E + 0 Mean value in simulation was 5.69E + 0
Exposur« Frequency (day/yr)
1.71E-0 453E*0 535E-0 9.17E-0 8.9fl(*0
Assumption: BW = Body weight (kg)
Lognormal distribution with parameters: Mean 8.10E + 01 Standard Dev. 1.22E + 01
Selected range is from 4.60E+1 to 1.43E + 2 Mean value in simulation was 8.10E + 1
BW - Body wmght (kg)
S.tlE*! 8.»7T*1 8.13E*1 1071*2 1.28E ♦ 2
Correlated with:
Skin surface area (cm2) 0.75
Assumption: Exposure duration of active crew (yrs)
Triangular distribution with parameters: Minimum 2.00E + 00 Most likely 8.00E + 00 Maximum 2.00E + 01
Selected range is from 2.00E + 0to 2.00E + 1 Mean value in simulation was 1.00E + 1
Exposur« duration of actrv« craw {yr»|
I.OM-0 a.50C*0 l.toe+1 1.5S(*1 2.00C+I
58

Assumption: Transfer Factor (unittess)
Triangular distribution with parameters: Minimum 0.00E + 00 Most likely 1.00E-01 Maximum 5.00E-01
Selected range is from 0.0OE + 0 to 5.00E-1 Mean value in simulation was 2.01 E-1
Transtar Factor (unltkMSI
O.OOC-0 1 JSM 2.50C-1 1.75M S.OOI-1
Assumption: Cancer Slope Factor (mg/kg-day)'
Uniform distribution with parameters: Minimum 3.00E-01 Maximum 2.00E + 00
Mean value in simulation was 1.16E + 0
Cuicir Stop« Factor (mg/kg-day)-1
3.00C-1 7 25E-1 1 15£*0 t.SSE-0 I.OOE-0
Assumption: Exposure duration of dismantling workers
Triangular distribution with parameters: Minimum 1.00E + 00 Mostl likely 2.00E + 00 Maximum 2.00E + 01
Selected range is from 1.00E + 0 to 2.00E + 1 Mean value in simulation was 7.56E + 0
Exposure duration of dismantling worker«
Assumption: Exposure frequency of dismantling worker
Triangular distribution with parameters: Minimum 2.25E + 01 Most likely 3.13E + 01 Maximum 6.48E + 01
Selected range is from 2.25E + 1 to 6.48E + 1 Mean value in simulation was 4.00E + 1
Exposure frequency of dismantling
J.J5E*t J.31E-1 4.37E + 1 5.4IE*l l.«.l
59

60

APPENDIX B
Risk Characterization Forecast Statistics
Statistics of risk to Active Crew Value Trials 975 Mean 3.88E-07 Median (approx.) 1.57E-07 Mode (approx.) 3.55E-08 Standard Deviation 6.93E-07 Variance 4.80E-13 Skewness 4.70E+00 Kurtosis 3.35E+01 Coeff. of Variability 1.79E+00 Range Minimum 2.26E-09 Range Maximum 6.65E-06 Range Width 6.65E-06 Mean Std. Error 3.32E-08
Percentile Risk Level (approx.) 0% 2.26E-09 10% 1.96E-08 20% 4.17E-08 30% 6.37E-08 40% 1.01E-07 50% 1.57E-07 60% 2.21 E-07 70% 3.43E-07 80% 5.45E-07 90% 9.77E-07 100% 6.65E-06
61

Statistics of risk to the Shipyard Workers: Trials Mean Median (approx.) Mode (approx.) Standard Deviation Variance Skewness Kurtosis Coeff. of Variability Range Minimum Range Maximum Range Width Mean Std. Error
Value 1000 9.73E-06 2.39E-06 1.92E-06 2.54E-05 6.45E-10 7.12E+00 7.36E+01 2.61 E+00 1.08E-08 3.82E-04 3.82E-04 8.03E-07
Percentile 0% 10% 20% 30% 40% 50% 60% 70% 80% 90% 100%
Risk Level (approx.) 1.08E-08 3.62E-07 7.14E-07 1.07E-06 1.59E-06 2.39E-06 3.65E-06 6.09E-06 1.09E-05 2.31 E-05 3.82E-04
62

o i]
o > r
W
€