armenia energy training program - usaid
TRANSCRIPT

ARMENIA ENERGY TRAINING PROGRAM
Contract No. LAG-I-00-98-00011-00, Task Order Two
Technical Report
Course on Wholesale and Retail Tariff Structure
April 16, 1999
Submitted to U.S. Agency for International Development
Submitted by the Academy for Educational Developmentwith Hagler Bailly Services

Technical Report, Course #2 April 16, 1999 ## 1
ARMENIA ENERGY SECTOR TRAINING PROGRAMTechnical Report
Course # 2 : Wholesale and Retail Tariff Structures for Electricity
USAID Strategic Objective 1.5 A more economically sustainable and environmentallysound energy sector
Intermediate Result 2 Increased economic efficiency in the energy sector
Participant profile Armenia’s energy companies, government ministries andregulatory entities with competence over the energy sector
A. Course Purpose
Armenia currently is moving towards introduction of a time-differentiated tariff structure inelectric power sector. The tariff is anticipated to cut peak power demand and result in substantialsavings to the power sector and to the economy as a whole. The goal of this training programwas to introduce the basic concepts associated with wholesale and retail tariff structures, and toprovide attendees with sufficient skills to begin to design appropriate tariffs within Armenia.
B. Dates/Trainers/Attendees
The course was conducted February 15-19, 1999. Leszak Kasprowicz served as the primaryinstructor. Boris Shapiro, Jake Delphia, and Bruce Hutchinson also taught sections of the course. All of the trainers received positive evaluations from course participants on the course evaluationform. The list of participants is shown as Table 1. Participants represented a variety ofArmenian energy sector organizations, including energy producers, distributors, and the EnergyRegulatory Commission. The consumer perspective was represented by representatives from theConsumers’ Union of Armenia.

Technical Report, Course #2 April 16, 1999 ## 2
TABLE 1: LIST OF PARTICIPANTS
# Name Employer Feb.15 Feb.16 Feb.17 Feb.18 Feb.191 Marine Petrosyan Ministry of Energy • • • • •2 Gagik Tokmajan Ministry of Finance • • • • •3 Garegin
Baghramyan ERC • • • • •
4 Anahit Avetisyan ERC • • • •5 Anahit Babayan ERC • • • •6 Arthur Vardanyan ERC • • • •7 Aram Karapetyan ERC • • •8 Zoya Galstyan Armenergo • • • • •9 Tigran Vardanyan Armenergo • • • • •10 Samvel Galstyan Southern Network •11 Marine
Hovhannisyan Southern Network • • •
12 Araik Zakaryan Southern Network • •13 Vanush Fakhuryan Southern Network •14 Anahit Sarksyan Yerevan TPP • • • •15 Ruben Aleksanyan Sevan-Hrazdan Cascade • • • •16 Vahe Petrosyan Vorotan Cascade • • • • •17 Aleksander
GaloyanANPP • • • •
18 Grigor Manoukyan ANPP • • • •19 Armen Poghosyan Consumers’ Association • • • • •20 Gagik Mkrtchyan Consumers’ Association •21 Armen Galstyan Consumers’ Association • • • • •22 Rafik Sarkisyan Consumers’ Association23 Svetlana
GanjumyanInstitute of Energy • • • •
C. Material Covered
The course focus fell into five key areas: Wholesale Tariffs, Distribution Tariffs, Cost of Service,Retail Tariffs, and Regulatory Considerations. The agenda is attached as Appendix A. Thecourse materials presented are attached as Appendix B.
From the instructors’ perspective, the seminar seemed to be a strong tool for helping to introduceissues and concepts that are an important part of the overall restructuring program. The courseincluded a lot of active discussion that allowed for increased interaction both between instructorsand participants, and among the participants themselves.
D. Participant Evaluations
AED administered an exit questionnaire to assess participant satisfaction with the courseimmediately after its conclusion. The following key points emerged from the evaluation.

Technical Report, Course #2 April 16, 1999 ## 3
• Most of the participants believe that the course will be very useful for them, is directlyrelevant to their work, and that it was conducted at the appropriate level. Participantsindicated that they anticipate applying what they learned in the course to their work.
• Participants gave the instructors high marks for the course. Most participants indicatedthat they have made arrangements to maintain contact with the instructors and/or eachother through e-mail, telephone, etc.
• The instructors’ knowledge of Russian made their interaction with the audience veryclose and comprehensive. Several participants requested that translation of the coursematerials be done by individuals with a greater knowledge of the sector, since some of themore technical information was not translated precisely.
• Participants expressed interest in the eight remaining courses to be conducted under thistraining program, and indicated that they would like to receive information about theother sessions so that they can plan to attend, if possible.
• Participants considered the program to be well-designed and well-organized, and to havemet its objectives.
• Participants offered several suggestions for future courses. They would like to see moreexamples and practical exercises that require them to apply what they are learning. Mostparticipants also indicated that they felt this training program was too short for theamount of material covered, and that they would like to see longer programs in this areain the future.
E. Anticipated Outcomes
Short-Term: Participants will maintain contact with the instructors and with each otheras the reform process moves forward.
Hagler Bailly will continue to work with the key players to finalize two-part tariffs forgeneration, the bulk supply tariff, and transmission and distribution wheeling tariffs. Dialogue will continue among the participants and workshop instructors as the processmoves forward.
Long-Term: In the longer term, participants are expected to be prepared for initialimplementation of the to-be-proposed tariff structure.
F. Recommended Follow-up
Contact should be maintained with course attendees as the tariff reforms move forward. Anumber of attendees indicated that they considered the workshop to have been too short for thematerial covered, and USAID may want to consider conducted a second seminar on this topicwhen the tariff structure is adopted to deal with issues associated with its implementation.

Technical Report, Course #2 April 16, 1999 ## 4
G. Conclusions
Overall, the workshop was positively received and was given high marks by the attendees. Thisseminar seems to have helped advance the reforms being undertaken under the Armenia PowerSector Reform project by increasing knowledge about how the different types of tariffs workgenerally and how they may work in Armenia, specifically, shortly before such tariffs areintroduced in Armenia.
One key area to which more attention needs to be paid for future courses is the translation of thecourse materials, since it is important that the participants receive the correct message from thelecturers since very often a proper word choice plays a critical role.
Technical Report, Course #2 April 16, 1999 ## 5
APPENDIX A
Seminar Outline
Wholesale And Retail Electricity Tariff Structuring

Technical Report, Course #2 April 16, 1999 ## 6
Seminar Outline
Armenian Power Sector
Wholesale And Retail Electricity Tariff Structuring
Course Instructor: Leszak Kasprowicz, Hagler Bailly
Day 1
Topic One: Wholesale Tariffs
I. Power Market Reform
A. Participants
B. Service Providers
C. Energy Commission Role
D. The use of tariffs in the restructured Power Market
II. Designing Rates
A. Understandability
B. Proper incentives to providers and recipients of service
C. Proper risk allocation
D. Opportunity to fully recover revenue requirement
III. Tariff Methodology
A. Generation tariffs
1. Local Generator Tariffs
2 Import Tariffs
3. Ancillary Services Tariffs
B. Transmission Tariffs
1. Connection charges

Technical Report, Course #2 April 16, 1999 ## 7
2. System Upgrade
3. Wheeling
4. Losses
Day 2
Topic One Con’t: Wholesale Tariffs
III. Tariff Methodology (Continued)
A. Dispatch Tariffs
B. Wholesale Contracting Tariffs
C. Funds Administration Tariffs
D. Bulk Supply Tariffs
Topic Two: Distribution Tariffs
I. Application and Examples of Wholesale Tariffs
A. Distribution Wheeling Tariffs
B. Customer Eligibility
C. Wheeling Rates
D. Connection Charge
E. Metering Requirements
F. Reactive Power Provisions
G. Energy Balancing
H. Impact on Other Customers
I. Contractual Terms and Conditions
J. System Upgrades
Technical Report, Course #2 April 16, 1999 ## 8
II. Methodology and Examples
A. Micronets
B. Performance-Based Regulation
Day 3
Topic Three: Cost of Service
I. Definitions
A. Embedded Cost
B. Marginal Cost
II. Functionalization of Costs
A. Generation
B. Transmission
C. Distribution
D. General
III. Classification of Costs
A. Demand
B. Energy
C. Customer
IV. Allocation of Costs
A. Customer Classes
B. Voltage level

Technical Report, Course #2 April 16, 1999 ## 9
V. Revenue Requirements
A. Fixed Costs
B. Variable Costs
VI. Methodology and Examples
Day 4
Topic Four: Retail Tariffs
I. Customer Data
A. Load Data
B. Sales Data
II. Rate Components
A. Customer Charge
B. Energy Charge
C. Demand Charge
III. Rate Design
A. Energy-only Rates
B. Energy and Demand Rates
IV. Special Rates and Concepts
A Lifeline Rates
B. Demand Ratchet

Technical Report, Course #2 April 16, 1999 ## 10
C. Time-of-use Rates
D. Interruptible Rates
E. Standby Rates
F. Economic Development Rates
V. Methodology and Examples
Day 5
Topic Four Con’t: Retail Tariffs
I. Influencing Customer Behavior
A. Demand-side Management (DSM) Concept
1. Passive DSM
2. Active DSM
B. DSM Programs
1. Design
2. Implementation
3. Evaluation
II. Methodology and Examples
Topic Five: Regulatory Considerations
I. Tariff Change Process

Technical Report, Course #2 April 16, 1999 ## 11
A. Utility-initiated Filing
1. Commission-initiated Review
2. Tariff Review and Approval Process at the Commission
3. Enforcement
II. Customer-Electric Utility Issues
A. Rights and Obligations
1. Quality of electric Service
a) Payment for Electric Services
b) Termination of Electric Service
2. Disputes and Their Resolution
III. Questions and Answers-Discussion
A. Conclusion of the Course

Technical Report, Course #2 April 16, 1999 ## 12
APPENDIX B
Seminar Materials
Wholesale And Retail Electricity Tariff Structuring

Cost of ServiceCost of Service
Presented byPresented by
Bruce N. HutchinsonBruce N. HutchinsonHagler Bailly Hagler Bailly Services, Inc.Services, Inc.YerevanYerevan, Republic of Armenia, Republic of Armenia
February 1999February 1999
5/17/99 Hagler Bailly Services, Inc. 2
Cost of ServiceCost of Service
Discussion OutlineDiscussion Outline
uu DefinitionsDefinitionsuu Functionalization Functionalization of costsof costsuu Classification of CostsClassification of Costsuu AllocationAllocationuu Revenue RequirementsRevenue Requirementsuu Rate DesignRate Design

5/17/99 Hagler Bailly Services, Inc. 3
Cost of ServiceCost of Service
DefinitionDefinition
Cost of Service is the expert estimation ofCost of Service is the expert estimation ofthe costs of providing electric service tothe costs of providing electric service tocustomers.customers.
5/17/99 Hagler Bailly Services, Inc. 4
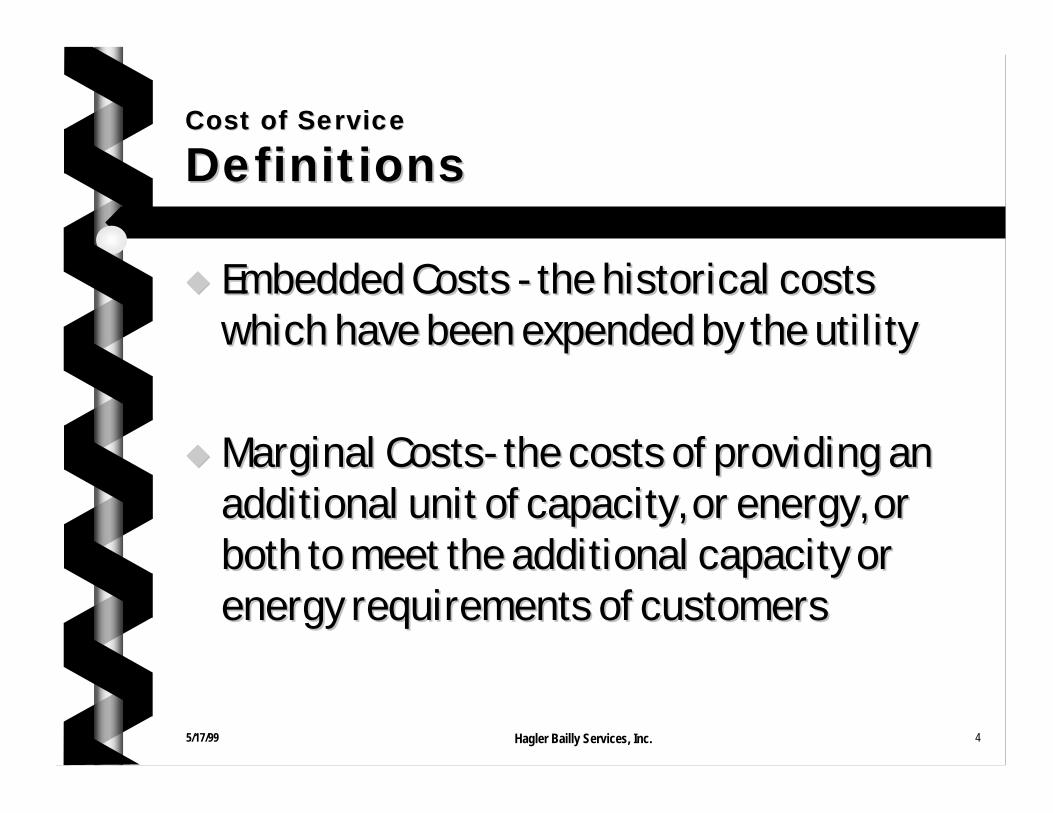
Cost of ServiceCost of Service
DefinitionsDefinitions
uu Embedded Costs - the historical costsEmbedded Costs - the historical costswhich have been expended by the utilitywhich have been expended by the utility
uu Marginal Costs- the costs of providing anMarginal Costs- the costs of providing anadditional unit of capacity, or energy, oradditional unit of capacity, or energy, orboth to meet the additional capacity orboth to meet the additional capacity orenergy requirements of customersenergy requirements of customers
5/17/99 Hagler Bailly Services, Inc. 5
Cost of ServiceCost of Service
Uses for Cost of ServiceUses for Cost of Service
uu Rate DesignRate Design
uu Support for price levels for various classesSupport for price levels for various classes
uu Cost trends (year by year)Cost trends (year by year)
uu Earnings (by customer group)Earnings (by customer group)
uu Sales promotion (to show relativeSales promotion (to show relativeprofitability by class of service)profitability by class of service)

5/17/99 Hagler Bailly Services, Inc. 6
Cost of ServiceCost of Service
Types of Cost of ServiceTypes of Cost of Service
uu Specific areas of service territorySpecific areas of service territoryuu Urban and RuralUrban and Ruraluu Voltage ClassesVoltage Classesuu Customer classesCustomer classesuu Rate ClassesRate Classesuu Load types (specific industry or customer)Load types (specific industry or customer)uu Appliances and equipmentAppliances and equipment
5/17/99 Hagler Bailly Services, Inc. 7
Cost of ServiceCost of Service
Functionalization Functionalization of Costsof Costs
uu GenerationGeneration
uu TransmissionTransmission
uu DistributionDistribution
uu GeneralGeneral
5/17/99 Hagler Bailly Services, Inc. 8
Cost of ServiceCost of Service
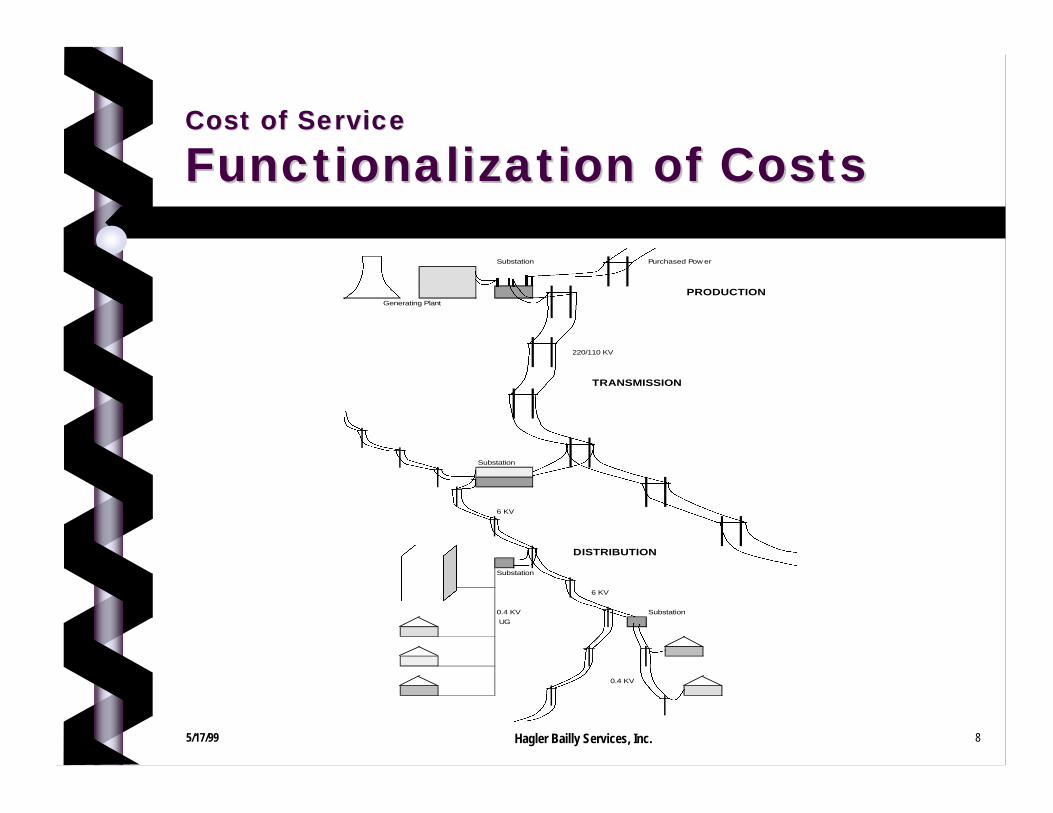
Functionalization Functionalization of Costsof CostsSubstation Purchased Pow er
PRODUCTIONGenerating Plant
220/110 KV
TRANSMISSION
Substation
6 KV
DISTRIBUTION
Substation
6 KV
0.4 KV Substation
UG
0.4 KV
5/17/99 Hagler Bailly Services, Inc. 9
Cost of ServiceCost of Service
Classification of CostsClassification of Costs
uu Demand - KilowattsDemand - Kilowatts
uu Energy - Kilowatt-hoursEnergy - Kilowatt-hours
uu Customer - Number of customersCustomer - Number of customers

5/17/99 Hagler Bailly Services, Inc. 10
Cost of ServiceCost of Service
Allocation of CostsAllocation of Costs
uu Customer ClassificationsCustomer Classificationséé ResidentialResidentialéé CommercialCommercialéé IndustrialIndustrialéé OtherOther
uu Voltage Level DeliveryVoltage Level Deliveryéé High voltageHigh voltageéé Medium voltageMedium voltageéé Low VoltageLow Voltage

5/17/99 Hagler Bailly Services, Inc. 11
Cost of ServiceCost of Service
Allocation of Costs (Losses)Allocation of Costs (Losses)
uu Classification of LossesClassification of Losseséé Demand (Demand (KWKW))éé Energy (Energy (KWHKWH))
uu Levels of LossesLevels of Losseséé GenerationGenerationéé TransmissionTransmissionéé High voltage distributionHigh voltage distributionéé DistributionDistribution

5/17/99 Hagler Bailly Services, Inc. 12
Cost of ServiceCost of Service
Allocation MethodologiesAllocation Methodologies
uu System Peak LoadsSystem Peak Loadséé Single PeakSingle Peakéé Average of Monthly PeaksAverage of Monthly Peakséé Summer/Winter PeakSummer/Winter Peak
uu Energy UsageEnergy Usageuu Combination of Peak loads and energy usageCombination of Peak loads and energy usageuu CustomersCustomers
éé Number of CustomersNumber of Customerséé Weighted CustomersWeighted Customers

5/17/99 Hagler Bailly Services, Inc. 13
Cost of ServiceCost of Service
Allocation MethodologiesAllocation Methodologies
Daily Load Shapes
0
200
400
600
800
1000
1200
1400
1600
1 2 3 4 5 6 7 8 9 10 11 12 13 14 15 16 17 18 19 20 21 22 23 24
Hour
MW
Series1 Series2 Series3

5/17/99 Hagler Bailly Services, Inc. 14
Cost of ServiceCost of Service
Revenue RequirementsRevenue Requirements
uu Fixed Costs - Fixed Costs - Costs which are incurred regardless of the levelCosts which are incurred regardless of the levelof usage by the customers. These costs include: depreciation, certainof usage by the customers. These costs include: depreciation, certaintaxes, some wages,taxes, some wages,
uu Variable Costs Variable Costs - Costs which vary directly in proportion to- Costs which vary directly in proportion tothe sales of energy. These costs include: fuel, operation andthe sales of energy. These costs include: fuel, operation andmaintenance,maintenance,
5/17/99 Hagler Bailly Services, Inc. 15
Cost of ServiceCost of Service
Rate DesignRate Design
The cost of service study should be used as aThe cost of service study should be used as ahelp to the design of rates. It is not the onlyhelp to the design of rates. It is not the onlytool for designing rates, but providestool for designing rates, but providesinformation based on technical andinformation based on technical andeconomic principles.economic principles.

February 15-19, 1999 Wholesale and Retail Electric Tariffs 1
Definitions
• Price discrimination-charging two or more different pricesfor the same product or service when the cost of supplyingcomparable units of output does not vary
• Cross subsidization-charging a class of customers a pricethat is greater or less than an acceptable cost standard forserving that class
• Predatory pricing-setting prices designed to destroy acompetitor
• Limit-entry pricing-setting a price designed to forecloseentry into a market by a potential competitor

February 15-19, 1999 Wholesale and Retail Electric Tariffs 2
What is a Tariff?
• Rate-the price for electric service
• Schedule-provisions necessary for billing for various loadconditions of the customers
• Rules and regulations-a statement of the general practicesthe utility follows in carrying on its business with itscustomers
• Tariff-all rates, schedules and rules and regulations in asingle document

February 15-19, 1999 Wholesale and Retail Electric Tariffs 3
Purpose of the Tariffs
• to reflect the cost of serving different customer classes
• to provide incentive to reduce/increase demand
• to retain customers on the system
• to respond to particular customer needs
• to spur economic development
• to provide competitive advantage for customers and utilities
• to offer choices to a customer

February 15-19, 1999 Wholesale and Retail Electric Tariffs 4
Customers
• The main reason why we have electric systems in place
• The main cause of costs associated with the operation of theelectric systems
This is why the electric companies should know theircustomers, especially:
• number of customers they serve
• types of customers, their income level and demographics
• their profile of energy use and typical end-uses
• customer needs regarding the electric service

February 15-19, 1999 Wholesale and Retail Electric Tariffs 5
Data Acquisition
• Steps involved in load and other customer data acquisition
– Design of Study
– Collection of Data
– Estimation of historic loads and information by class
– Use of data
February 15-19, 1999 Wholesale and Retail Electric Tariffs 6
Selecting Customers
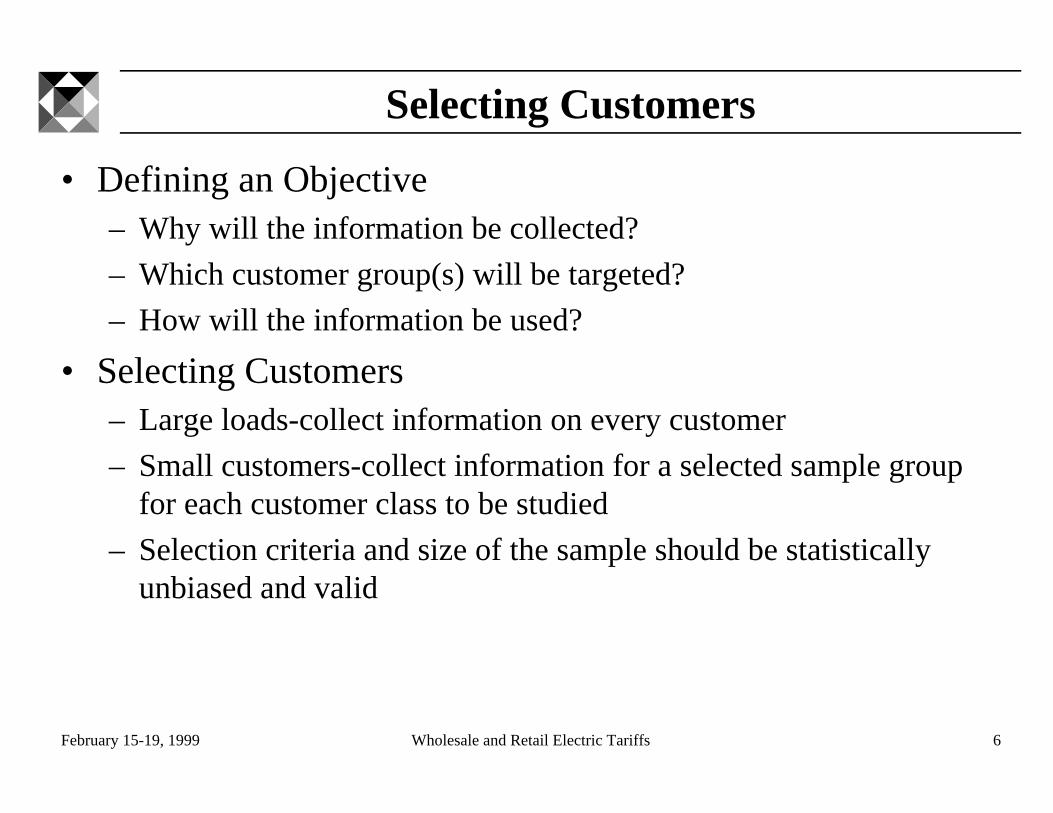
• Defining an Objective– Why will the information be collected?
– Which customer group(s) will be targeted?
– How will the information be used?
• Selecting Customers– Large loads-collect information on every customer
– Small customers-collect information for a selected sample groupfor each customer class to be studied
– Selection criteria and size of the sample should be statisticallyunbiased and valid

February 15-19, 1999 Wholesale and Retail Electric Tariffs 7
Data Collection
• Installation of load recorders
• Customer billing information
• Duration of study-preferably 12 consecutive months
• Demographic information collection
• Appliance (end-use) saturation data
• Use of surveys
• Use of focus groups

February 15-19, 1999 Wholesale and Retail Electric Tariffs 8
Load Data Use
• designing rates
• evaluating conservation measures
• forecasting system peaks and load profile
• predicting customer behavior
• marketing research studies
• monitoring

February 15-19, 1999 Wholesale and Retail Electric Tariffs 9
Examples of Compiled Data
• Coincident Demand-demand of a rate class at the time of a specifiedsystem peak hour
• Non-coincident Demand-maximum demand of a rate class,regardless of when it occurs
• Coincident Factor-ratio of the coincident demand of a class to itsnon-coincident demand
• On-peak and off-peak kilowatt-hours• Load Factor-the ratio of average demand over a designated time
period to the maximum demand occurring in that period

February 15-19, 1999 Wholesale and Retail Electric Tariffs 10
Load Factor
Maximum Load
Load (MW)
Time (hours)
Total Energy (MWh)
Time
LF =Total Energy
Time * Maximum Load* 100 %

February 15-19, 1999 Wholesale and Retail Electric Tariffs 11
Monthly Residential Billing Data-Example
Block Size
kWh Block kWhEach Block Cumm.
Each Block Cumm.
Each Block Cumm.
Each Block Cumm.
Each Block Cumm.
Each Block Cumm.
0-10 10 15 15 1.5 1.5 75 75 0.1 0.1 9,925 9,925 9.9 9.9 11-20 10 27 42 2.7 4.2 405 480 0.4 0.5 9,715 19,640 9.7 19.6 21-25 5 18 60 1.8 6.0 405 885 0.4 0.9 4,745 24,385 4.7 24.4 26-50 25 118 178 11.8 17.8 4,425 5,310 4.4 5.3 22,025 46,410 22.0 46.4 51-75 25 180 358 18.0 35.8 11,250 16,560 11.3 16.6 18,300 64,710 18.3 64.7 76-100 25 213 571 21.3 57.1 18,638 35,198 18.6 35.2 13,388 78,098 13.4 78.1 101-125 25 179 750 17.9 75.0 20,138 55,336 20.1 55.3 8,488 86,586 8.5 86.6 126-150 25 98 848 9.8 84.8 13,475 68,811 13.5 68.8 5,025 91,611 5.0 91.6 151-175 25 58 906 5.8 90.6 9,425 78,236 9.4 78.2 3,075 94,686 3.1 94.7 176-200 25 36 942 3.6 94.2 6,750 84,986 6.8 85.0 1,900 96,586 1.9 96.6 201-225 25 21 963 2.1 96.3 4,463 89,449 4.5 89.4 1,188 97,774 1.2 97.8 226-250 25 14 977 1.4 97.7 3,325 92,774 3.3 92.8 750 98,524 0.8 98.5 251-275 25 10 987 1.0 98.7 2,625 95,399 2.6 95.4 450 98,974 0.5 99.0 276-300 25 6 993 0.6 99.3 1,725 97,124 1.7 97.1 250 99,224 0.3 99.2 over 300 7 1,000 0.7 100.0 2,876 100,000 2.9 100.0 776 100,000 0.8 100.0
Total 1,000 100.0 100,000 100.0 100,000 100.0
Bills Ending in Block Total kWh for Bills Ending in Block Total kWh Billed in BlockNumber Percentage Number Percentage Number Percentage

February 15-19, 1999 Wholesale and Retail Electric Tariffs 12
Rate Components
• Customers Charge-reflects investment charges and expenses relatedto a portion of the general distribution system, connection facilities,metering equipment, meter reading, billing and accounting. Expressedin $/customer
• Energy Charge-reflects costs of energy supplied to customers.Expressed in $/kWh
• Demand Charge-reflects costs of servicing the customer’s demand.Includes investment charges and expenses in connection withgenerating plants, transmission lines, substations, and part ofdistribution system not included in customer charge. Expressed in$/kW
• Adjustments-surcharges and refunds. Expressed in $/kWh

February 15-19, 1999 Wholesale and Retail Electric Tariffs 13
Optimal Rates
• are cost-of-service based to ensure equity and avoiddiscrimination
• provide stable and predictable revenues
• provide consistent price signals
• are simple
• encourage efficient operations and efficient use of resources
• support quality service
• are competitive

February 15-19, 1999 Wholesale and Retail Electric Tariffs 14
Flat Rate
• Pros– simple, easy to understand, easy to apply– appropriate when price responsiveness of small and large customers is the same
and the marginal costs of serving them are equal
• Cons– Customers that use little/a lot energy underpay/overpay their fair share of fixed
costs– Revenues subject to energy consumption fluctuation
Energy Rate Total Bill Av. Cost0 0.030$ -$ 0.030$
100 0.030$ 3.00$ 0.030$ 200 0.030$ 6.00$ 0.030$ 300 0.030$ 9.00$ 0.030$ 400 0.030$ 12.00$ 0.030$ 500 0.030$ 15.00$ 0.030$ 600 0.030$ 18.00$ 0.030$ 700 0.030$ 21.00$ 0.030$ 800 0.030$ 24.00$ 0.030$ 900 0.030$ 27.00$ 0.030$
1000 0.030$ 30.00$ 0.030$
Monthly Bill and Average Cost
0
5
10
15
20
25
30
35
0 100 200 300 400 500 600 700 800 900 1000Consumption (kWh)
Bill
($)
0.0000.0050.0100.0150.0200.0250.0300.0350.0400.0450.050
Av.
Co
st (
$/kW
h)

February 15-19, 1999 Wholesale and Retail Electric Tariffs 15
Flat Rate with a Customer ChargeCustomer Charge 5.00$
Energy Rate Total Bill Av. Cost0 0.030$ 5.00$ 0.120$
100 0.030$ 8.00$ 0.080$ 200 0.030$ 11.00$ 0.055$ 300 0.030$ 14.00$ 0.047$ 400 0.030$ 17.00$ 0.043$ 500 0.030$ 20.00$ 0.040$ 600 0.030$ 23.00$ 0.038$ 700 0.030$ 26.00$ 0.037$ 800 0.030$ 29.00$ 0.036$ 900 0.030$ 32.00$ 0.036$
1000 0.030$ 35.00$ 0.035$
Monthly Bill and Average Cost
0
5
10
15
20
25
30
35
40
0 100 200 300 400 500 600 700 800 900 1000Consumption (kWh)
Bill
($)
0.000
0.010
0.020
0.030
0.040
0.050
0.060
0.070
0.080
Av.
Cos
t ($/
kWh)
• Pros– simple, easy to understand, easy to apply
• Cons– to a lesser degree similar to Flat Rate

February 15-19, 1999 Wholesale and Retail Electric Tariffs 16
Flat Rate with a Minimum Bill
Energy RateMinimum Charge Total Bill Av. Cost
0 0.030$ 10.00$ 10.00$ 0.120$ 100 0.030$ 10.00$ 10.00$ 0.100$ 200 0.030$ 10.00$ 10.00$ 0.050$ 300 0.030$ 10.00$ 10.00$ 0.033$ 400 0.030$ 10.00$ 12.00$ 0.030$ 500 0.030$ 10.00$ 15.00$ 0.030$ 600 0.030$ 10.00$ 18.00$ 0.030$ 700 0.030$ 10.00$ 21.00$ 0.030$ 800 0.030$ 10.00$ 24.00$ 0.030$ 900 0.030$ 10.00$ 27.00$ 0.030$
1000 0.030$ 10.00$ 30.00$ 0.030$
Monthly Bill and Average Cost
0
5
10
15
20
25
30
35
0 100 200 300 400 500 600 700 800 900 1000
Consumption (kWh)
Bill
($)
0.000
0.010
0.020
0.030
0.040
0.050
0.060
0.070
0.080
Av.
Cos
t ($/
kWh)
• Pros– stabilizes revenue stream to the utility– makes revenue less sensitive to changes in consumption
• Cons– those that do not use the minimum energy pay more

February 15-19, 1999 Wholesale and Retail Electric Tariffs 17
Declining Block Energy Rate
• Pros– promotes energy use in the situation of excess capacity– appropriate when marginal cost of servicing large users is less than the
marginal cost of small users• Cons
– adverse effect if marginal cost is rising– off-peak users subsidize the on-peak users– burdens small users that do not expand consumption
First 100 kWh 0.10$ Next 200 kWh 0.05$
All kWh above 300 kWh 0.02$
Energy Total Bill Av. Cost0 -$ 0.130$
100 10.00$ 0.100$ 200 15.00$ 0.075$ 300 20.00$ 0.067$ 400 22.00$ 0.055$ 500 24.00$ 0.048$ 600 26.00$ 0.043$ 700 28.00$ 0.040$ 800 30.00$ 0.038$ 900 32.00$ 0.036$
1000 34.00$ 0.034$
Monthly Bill and Average Cost
0
5
10
15
20
25
30
35
40
0 100 200 300 400 500 600 700 800 900 1000
Consumption (kWh)
Bil
l ($
)
0.000
0.010
0.020
0.030
0.040
0.050
0.060
0.070
0.080
0.090
0.100
Av
. C
os
t ($
/kW
h)

February 15-19, 1999 Wholesale and Retail Electric Tariffs 18
Lifeline Rates
• Pros– corrects for the negative effects of declining block rates– assures basic service to low income consumers
• Cons– abuse by wealthy consumers– cross subsidization
First 100 kWh 0.05$ All kWh above 100 kWh 0.10$
Energy Total Bill Av. Cost0 -$ 0.130$
100 5.00$ 0.050$ 200 15.00$ 0.075$ 300 25.00$ 0.083$ 400 35.00$ 0.088$ 500 45.00$ 0.090$ 600 55.00$ 0.092$ 700 65.00$ 0.093$ 800 75.00$ 0.094$ 900 85.00$ 0.094$
1000 95.00$ 0.095$
Monthly Bill and Average Cost
0102030405060708090
100
0 100 200 300 400 500 600 700 800 900 1000
Consumption (kWh)
Bil
l ($
)
0.0000.0100.0200.0300.0400.0500.0600.0700.0800.0900.100
Av
. C
os
t ($
/kW
h)

February 15-19, 1999 Wholesale and Retail Electric Tariffs 19
Declining Block Rate with Customer ChargeCustomer charge 5.00$
First 100 kWh 0.10$ Next 200 kWh 0.05$
All kWh above 300 kWh 0.02$
Energy Bill Av. Cost0 5.00$ 0.200$
100 15.00$ 0.150$ 200 20.00$ 0.100$ 300 25.00$ 0.083$ 400 27.00$ 0.068$ 500 29.00$ 0.058$ 600 31.00$ 0.052$ 700 33.00$ 0.047$ 800 35.00$ 0.044$ 900 37.00$ 0.041$
1000 39.00$ 0.039$
Monthly Bill and Average Cost
0
5
10
15
20
25
30
35
40
45
0 100 200 300 400 500 600 700 800 900 1000
Consumption (kWh)B
ill
($)
0.000
0.020
0.040
0.060
0.080
0.100
0.120
0.140
Av
. C
os
t ($
/kW
h)
• Pros and Cons similar to those in Declining Block energy rate
February 15-19, 1999 Wholesale and Retail Electric Tariffs 20
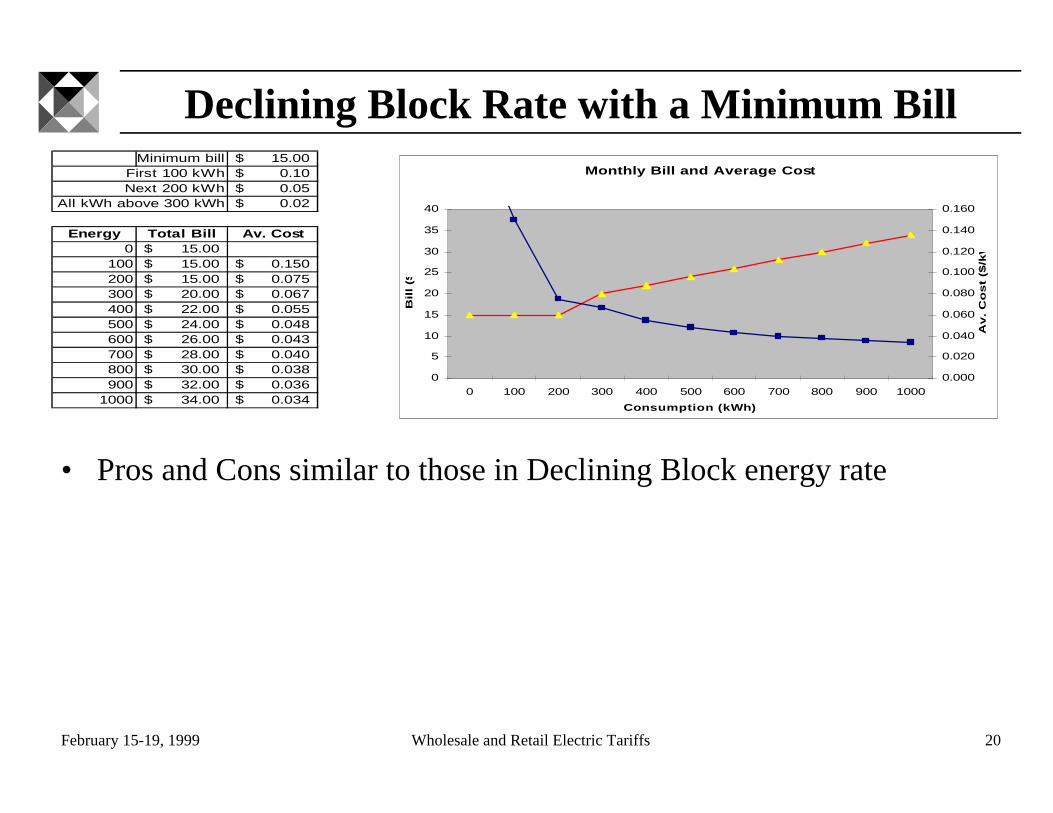
Declining Block Rate with a Minimum BillMinimum bill 15.00$
First 100 kWh 0.10$ Next 200 kWh 0.05$
All kWh above 300 kWh 0.02$
Energy Total Bill Av. Cost0 15.00$ 0.250$
100 15.00$ 0.150$ 200 15.00$ 0.075$ 300 20.00$ 0.067$ 400 22.00$ 0.055$ 500 24.00$ 0.048$ 600 26.00$ 0.043$ 700 28.00$ 0.040$ 800 30.00$ 0.038$ 900 32.00$ 0.036$
1000 34.00$ 0.034$
Monthly Bill and Average Cost
0
5
10
15
20
25
30
35
40
0 100 200 300 400 500 600 700 800 900 1000
Consumption (kWh)B
ill
($)
0.000
0.020
0.040
0.060
0.080
0.100
0.120
0.140
0.160
Av
. C
os
t ($
/kW
h)
• Pros and Cons similar to those in Declining Block energy rate

February 15-19, 1999 Wholesale and Retail Electric Tariffs 21
Inverted Energy RateMinimum bill -$
First 300 kWh 0.02$ Next 200 kWh 0.05$
All kWh above 500 kWh 0.10$
Energy Total Bill Av. Cost0 -$ 0.020$
100 2.00$ 0.020$ 200 4.00$ 0.020$ 300 6.00$ 0.020$ 400 11.00$ 0.028$ 500 16.00$ 0.032$ 600 26.00$ 0.043$ 700 36.00$ 0.051$ 800 46.00$ 0.058$ 900 56.00$ 0.062$
1000 66.00$ 0.066$
Monthly Bill and Average Cost
0
10
20
30
40
50
60
70
0 100 200 300 400 500 600 700 800 900 1000
Consumption (kWh)B
ill
($)
0.000
0.020
0.040
0.060
0.080
0.100
Av
. C
os
t ($
/kW
h)
• Pros– promotes conservation of energy– appropriate if the marginal cost of serving large users is greater than the
marginal cost of small users• Cons
– potential subsidization of small users by large users

February 15-19, 1999 Wholesale and Retail Electric Tariffs 22
Inverted Energy Rate with a Minimum BillMinimum Bill 5.00$
First 300 kWh 0.02$ Next 200 kWh 0.05$
All kWh above 500 kWh 0.10$
Energy Total Bill Av. Cost0 5.00$ 0.200$
100 5.00$ 0.050$ 200 5.00$ 0.025$ 300 6.00$ 0.020$ 400 11.00$ 0.028$ 500 16.00$ 0.032$ 600 26.00$ 0.043$ 700 36.00$ 0.051$ 800 46.00$ 0.058$ 900 56.00$ 0.062$
1000 66.00$ 0.066$
Monthly Bill and Average Cost
0
10
20
30
40
50
60
70
0 100 200 300 400 500 600 700 800 900 1000
Consumption (kWh)B
ill
($)
0.000
0.020
0.040
0.060
0.080
0.100
Av
. C
os
t ($
/kW
h)
• Pros and Cons similar to those for Inverted Energy Rate

February 15-19, 1999 Wholesale and Retail Electric Tariffs 23
Inverted Energy Rate with a Customer ChargeCustomer Charge 5.00$
First 300 kWh 0.02$ Next 200 kWh 0.05$
All kWh above 500 kWh 0.10$
Energy Total Bill Av. Cost0 5.00$ 0.180$
100 7.00$ 0.070$ 200 9.00$ 0.045$ 300 11.00$ 0.037$ 400 16.00$ 0.040$ 500 21.00$ 0.042$ 600 31.00$ 0.052$ 700 41.00$ 0.059$ 800 51.00$ 0.064$ 900 61.00$ 0.068$
1000 71.00$ 0.071$
Monthly Bill and Average Cost
0
10
20
30
40
50
60
70
80
0 100 200 300 400 500 600 700 800 900 1000
Consumption (kWh)B
ill
($)
0.000
0.020
0.040
0.060
0.080
0.100
Av
. C
os
t ($
/kW
h)
• Pros and Cons similar to those for Inverted Energy Rate
February 15-19, 1999 Wholesale and Retail Electric Tariffs 24
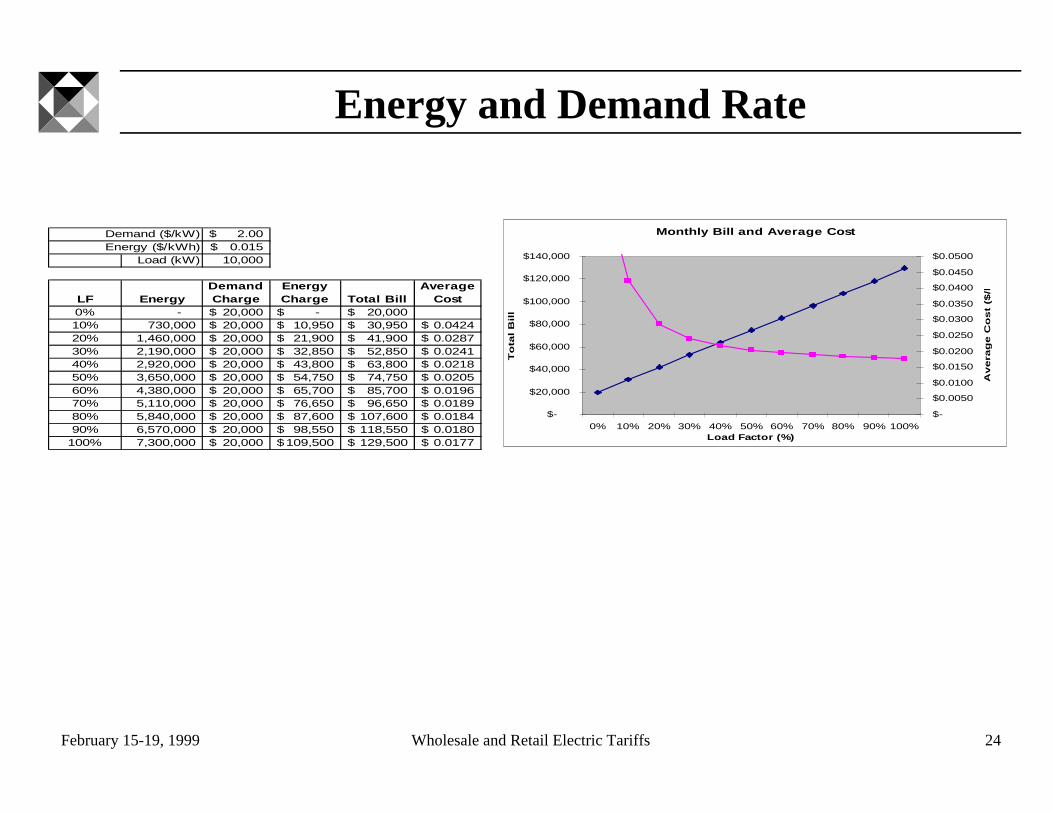
Energy and Demand Rate
Demand ($/kW) 2.00$ Energy ($/kWh) 0.015$
Load (kW) 10,000
LF EnergyDemand Charge
Energy Charge Total Bill
Average Cost
0% - 20,000$ -$ 20,000$ 0.0800$ 10% 730,000 20,000$ 10,950$ 30,950$ 0.0424$ 20% 1,460,000 20,000$ 21,900$ 41,900$ 0.0287$ 30% 2,190,000 20,000$ 32,850$ 52,850$ 0.0241$ 40% 2,920,000 20,000$ 43,800$ 63,800$ 0.0218$ 50% 3,650,000 20,000$ 54,750$ 74,750$ 0.0205$ 60% 4,380,000 20,000$ 65,700$ 85,700$ 0.0196$ 70% 5,110,000 20,000$ 76,650$ 96,650$ 0.0189$ 80% 5,840,000 20,000$ 87,600$ 107,600$ 0.0184$ 90% 6,570,000 20,000$ 98,550$ 118,550$ 0.0180$
100% 7,300,000 20,000$ 109,500$ 129,500$ 0.0177$
Monthly Bill and Average Cost
$-
$20,000
$40,000
$60,000
$80,000
$100,000
$120,000
$140,000
0% 10% 20% 30% 40% 50% 60% 70% 80% 90% 100%Load Factor (%)
To
tal
Bil
l ($
)
$-
$0.0050
$0.0100
$0.0150
$0.0200
$0.0250
$0.0300
$0.0350
$0.0400
$0.0450
$0.0500
Av
era
ge
Co
st
($/k
Wh
)

February 15-19, 1999 Wholesale and Retail Electric Tariffs 25
Energy, Demand and Customer Charge RateCustomer Charge ($) $1,000
Demand ($/kW) 2.00$ Energy ($/kWh) 0.015$
Load (kW) 10,000
LF EnergyDemand Charge
Energy Charge Total Bill
Average Cost
0% - 20,000$ -$ 21,000$ 0.0800$ 10% 730,000 20,000$ 10,950$ 31,950$ 0.0438$ 20% 1,460,000 20,000$ 21,900$ 42,900$ 0.0294$ 30% 2,190,000 20,000$ 32,850$ 53,850$ 0.0246$ 40% 2,920,000 20,000$ 43,800$ 64,800$ 0.0222$ 50% 3,650,000 20,000$ 54,750$ 75,750$ 0.0208$ 60% 4,380,000 20,000$ 65,700$ 86,700$ 0.0198$ 70% 5,110,000 20,000$ 76,650$ 97,650$ 0.0191$ 80% 5,840,000 20,000$ 87,600$ 108,600$ 0.0186$ 90% 6,570,000 20,000$ 98,550$ 119,550$ 0.0182$
100% 7,300,000 20,000$ 109,500$ 130,500$ 0.0179$
Monthly Bill and Average Cost
$-
$20,000
$40,000
$60,000
$80,000
$100,000
$120,000
$140,000
0% 10% 20% 30% 40% 50% 60% 70% 80% 90% 100%Load Factor (%)
To
tal B
ill ($
)
$-
$0.0050
$0.0100
$0.0150
$0.0200
$0.0250
$0.0300
$0.0350
$0.0400
$0.0450
$0.0500
Avera
ge C
ost
($/k
Wh
)

February 15-19, 1999 Wholesale and Retail Electric Tariffs 26
Hours-of-use Demand Rate
First 50 kWh per kW of demand 0.035$ Next 100 kWh per kW of demand 0.025$
All energy in excess of 150 kWh per kW 0.015$ Load (kW) 100
LF (kWh/kW)Energy (kWh) Total Bill
Average Cost
- - -$ 0.0800$ 50 5,000 175$ 0.0350$
100 10,000 300$ 0.0300$ 150 15,000 425$ 0.0283$ 200 20,000 500$ 0.0250$ 250 25,000 575$ 0.0230$ 300 30,000 650$ 0.0217$ 350 35,000 725$ 0.0207$ 400 40,000 800$ 0.0200$ 450 45,000 875$ 0.0194$ 500 50,000 950$ 0.0190$ 550 55,000 1,025$ 0.0186$ 600 60,000 1,100$ 0.0183$ 650 65,000 1,175$ 0.0181$ 700 70,000 1,250$ 0.0179$ 730 73,000 1,295$ 0.0177$
Monthly Bill and Average Cost
$-
$200
$400
$600
$800
$1,000
$1,200
$1,400
- 50 100 150 200 250 300 350 400 450 500 550 600 650 700 730
Load Factor (kWh/kW)
Tota
l Bill
($)
$-
$0.0050
$0.0100
$0.0150
$0.0200
$0.0250
$0.0300
$0.0350
$0.0400
$0.0450
$0.0500
Ave
rage
Cos
t ($/
kWh)
February 15-19, 1999 Wholesale and Retail Electric Tariffs 27
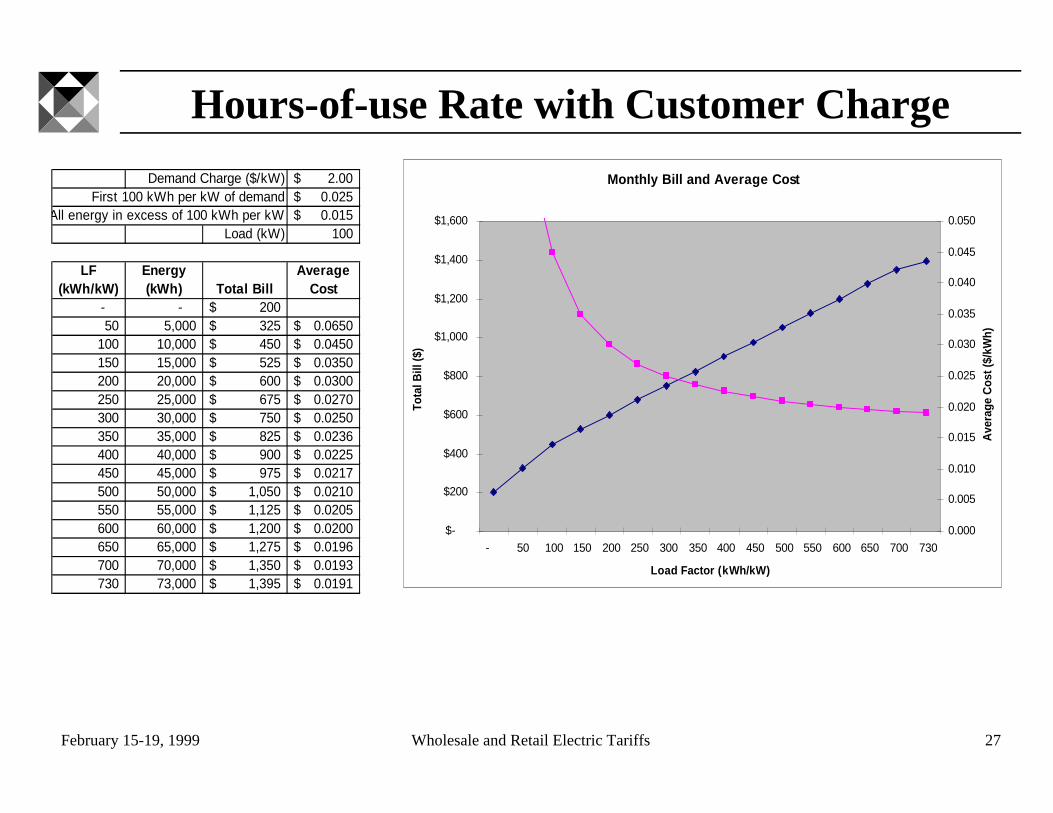
Hours-of-use Rate with Customer Charge
Demand Charge ($/kW) 2.00$ First 100 kWh per kW of demand 0.025$
All energy in excess of 100 kWh per kW 0.015$ Load (kW) 100
LF (kWh/kW)
Energy (kWh) Total Bill
Average Cost
- - 200$ 0.0800$ 50 5,000 325$ 0.0650$
100 10,000 450$ 0.0450$ 150 15,000 525$ 0.0350$ 200 20,000 600$ 0.0300$ 250 25,000 675$ 0.0270$ 300 30,000 750$ 0.0250$ 350 35,000 825$ 0.0236$ 400 40,000 900$ 0.0225$ 450 45,000 975$ 0.0217$ 500 50,000 1,050$ 0.0210$ 550 55,000 1,125$ 0.0205$ 600 60,000 1,200$ 0.0200$ 650 65,000 1,275$ 0.0196$ 700 70,000 1,350$ 0.0193$ 730 73,000 1,395$ 0.0191$
Monthly Bill and Average Cost
$-
$200
$400
$600
$800
$1,000
$1,200
$1,400
$1,600
- 50 100 150 200 250 300 350 400 450 500 550 600 650 700 730
Load Factor (kWh/kW)
Tota
l Bill
($)
0.000
0.005
0.010
0.015
0.020
0.025
0.030
0.035
0.040
0.045
0.050
Ave
rage
Cos
t ($/
kWh)
February 15-19, 1999 Wholesale and Retail Electric Tariffs 28
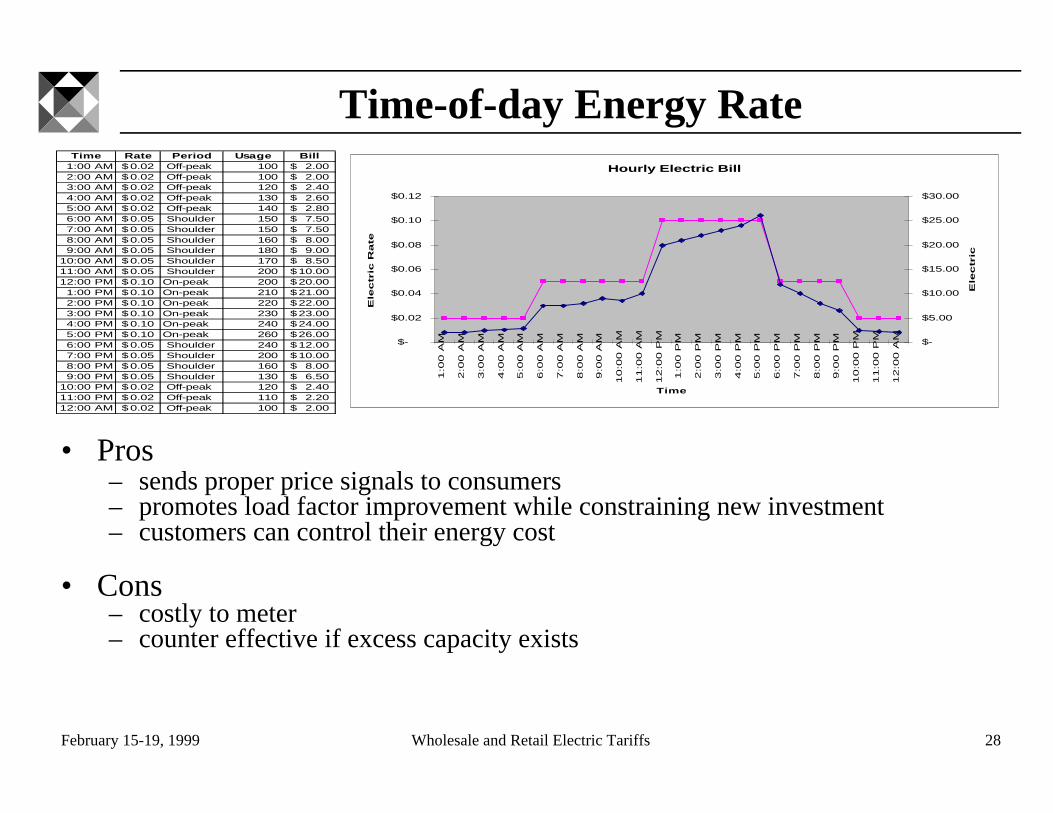
Time-of-day Energy RateTime Rate Period Usage Bill
1:00 AM 0.02$ Off-peak 100 2.00$ 2:00 AM 0.02$ Off-peak 100 2.00$ 3:00 AM 0.02$ Off-peak 120 2.40$ 4:00 AM 0.02$ Off-peak 130 2.60$ 5:00 AM 0.02$ Off-peak 140 2.80$ 6:00 AM 0.05$ Shoulder 150 7.50$ 7:00 AM 0.05$ Shoulder 150 7.50$ 8:00 AM 0.05$ Shoulder 160 8.00$ 9:00 AM 0.05$ Shoulder 180 9.00$
10:00 AM 0.05$ Shoulder 170 8.50$ 11:00 AM 0.05$ Shoulder 200 10.00$ 12:00 PM 0.10$ On-peak 200 20.00$ 1:00 PM 0.10$ On-peak 210 21.00$ 2:00 PM 0.10$ On-peak 220 22.00$ 3:00 PM 0.10$ On-peak 230 23.00$ 4:00 PM 0.10$ On-peak 240 24.00$ 5:00 PM 0.10$ On-peak 260 26.00$ 6:00 PM 0.05$ Shoulder 240 12.00$ 7:00 PM 0.05$ Shoulder 200 10.00$ 8:00 PM 0.05$ Shoulder 160 8.00$ 9:00 PM 0.05$ Shoulder 130 6.50$
10:00 PM 0.02$ Off-peak 120 2.40$ 11:00 PM 0.02$ Off-peak 110 2.20$ 12:00 AM 0.02$ Off-peak 100 2.00$
Hourly Electric Bill
$-
$0.02
$0.04
$0.06
$0.08
$0.10
$0.12
1:0
0 A
M
2:0
0 A
M
3:0
0 A
M
4:0
0 A
M
5:0
0 A
M
6:0
0 A
M
7:0
0 A
M
8:0
0 A
M
9:0
0 A
M
10
:00
AM
11
:00
AM
12
:00
PM
1:0
0 P
M
2:0
0 P
M
3:0
0 P
M
4:0
0 P
M
5:0
0 P
M
6:0
0 P
M
7:0
0 P
M
8:0
0 P
M
9:0
0 P
M
10
:00
PM
11
:00
PM
12
:00
AM
Time
Ele
ctr
ic R
ate
$/k
Wh
$-
$5.00
$10.00
$15.00
$20.00
$25.00
$30.00
Ele
ctr
ic B
ill
• Pros– sends proper price signals to consumers– promotes load factor improvement while constraining new investment– customers can control their energy cost
• Cons– costly to meter– counter effective if excess capacity exists
February 15-19, 1999 Wholesale and Retail Electric Tariffs 29
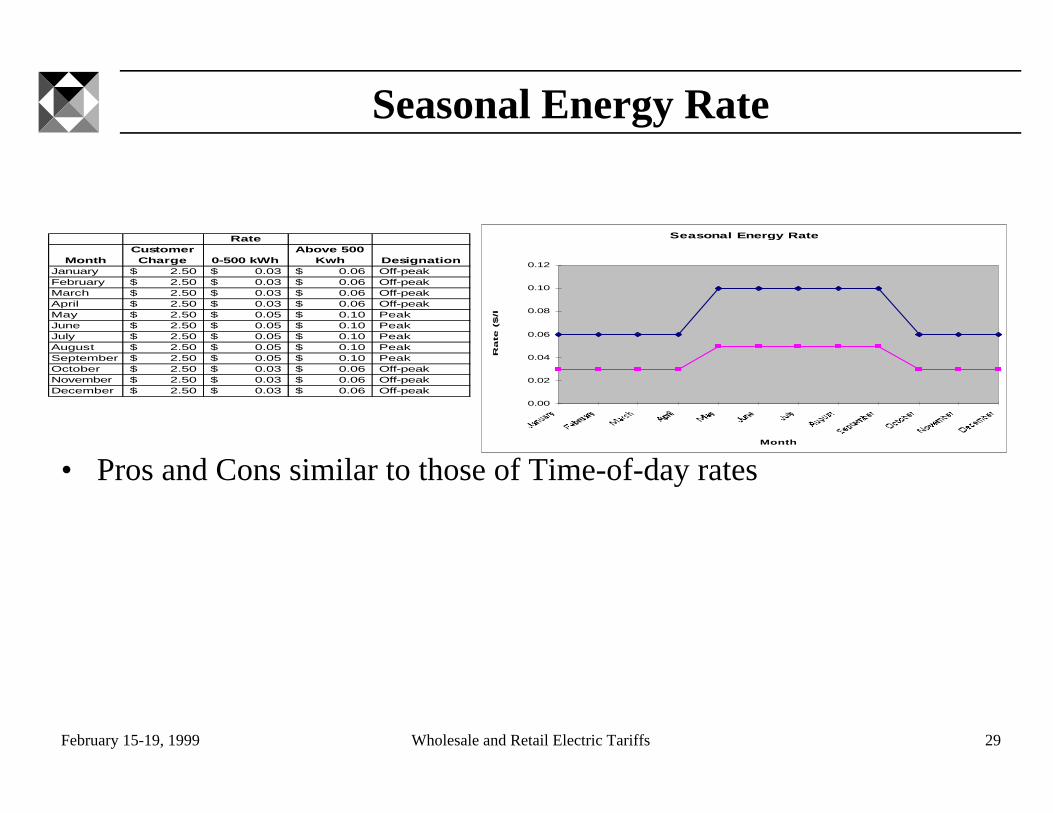
Seasonal Energy Rate
Rate
MonthCustomer Charge 0-500 kWh
Above 500 Kwh Designation
January 2.50$ 0.03$ 0.06$ Off-peakFebruary 2.50$ 0.03$ 0.06$ Off-peakMarch 2.50$ 0.03$ 0.06$ Off-peakApril 2.50$ 0.03$ 0.06$ Off-peakMay 2.50$ 0.05$ 0.10$ PeakJune 2.50$ 0.05$ 0.10$ PeakJuly 2.50$ 0.05$ 0.10$ PeakAugust 2.50$ 0.05$ 0.10$ PeakSeptember 2.50$ 0.05$ 0.10$ PeakOctober 2.50$ 0.03$ 0.06$ Off-peakNovember 2.50$ 0.03$ 0.06$ Off-peakDecember 2.50$ 0.03$ 0.06$ Off-peak
Seasonal Energy Rate
0.00
0.02
0.04
0.06
0.08
0.10
0.12
Month
Rate
($/k
Wh
)
• Pros and Cons similar to those of Time-of-day rates

February 15-19, 1999 Wholesale and Retail Electric Tariffs 30
Ratchet Demand Clause
• Billing method that charges the consumer the higher offixed percentage of his maximum monthly demand in aspecified period of time or his current demand– provides revenue stability to the utility– distributes revenue responsibility more equitably between high-
and low-load factor customers– provides a price signal for increasing annual load factor– may induce unnecessary consumption during other than on-peak
times– may impose financial hardship on low-load factor customers
• Can be set either equal to or higher than the class load factor

February 15-19, 1999 Wholesale and Retail Electric Tariffs 31
Interruptible Rates
• Utility, or customer at utility’s request, interrupts the use ofa certain amount of electric load
• Provide utilities a means of reducing their generating,transmission and distribution capacity requirements andstabilizing system frequency
• Offer customers an alternative to self-generation and leavingor by-passing a utility system
• Appropriate to customers that are willing to acceptdecreased reliability in exchange for a reduced demandcharge

February 15-19, 1999 Wholesale and Retail Electric Tariffs 32
Real-time Pricing (RTP)
• Real-time prices vary to reflect changes in the marginal costof supplying electricity
• Rates vary hourly, as oppose to a pre-defined manner inTOU rates
• Pros– provide proper price signal
– customer decides when to purchase electricity
– RTP tend to decrease the peak use
• Cons– expensive implementation cost

February 15-19, 1999 Wholesale and Retail Electric Tariffs 33
Standby Rates
• Power is taken from the utility by a customer who self generates. Thecustomer is entitled to power on demand. Power offered by the utilitycomes as supplementary, maintenance or backup power.
• Supplementary power-supplied anytime in addition to what thecustomer ordinarily generates. It is usually priced at the same price asregular firm service.
• Maintenance power- power supplied during scheduled outages of thecustomer’s own generating facility. Since the service is scheduledpower can be delivered during off-peak times and be priced at levellower than firm service.
• Backup power-power supplied during unscheduled outages. It ispriced between supplementary and maintenance service

February 15-19, 1999 Wholesale and Retail Electric Tariffs 34
Economic Development Rates (EDR)
• Help to expand loads by encouraging new businesses tomove into a service territory or by helping existingbusinesses stay and grow.
• Provide discounts for incremental energy and demand
• Pros– increase the customer base, energy usage/revenue, employment– retains existing businesses, prevents negative effects on the local
economy
• Cons– accelerate the utility’s need for capacity expansion– may provide unfair advantage to businesses

February 15-19, 1999 Wholesale and Retail Electric Tariffs 35
Demand-side Management (DSM)
• Combination of conservation and load-management policiesand techniques that influence customers pattern of energyuse without decreasing their current comfort level
• Benefits to the customers– lower monthly electricity bills
– increase in comfort level
• Benefits to the utility– reduced fuel costs
– deferred capital additions
– control of peak demands
– improved generating efficiency
– increased system reliability

February 15-19, 1999 Wholesale and Retail Electric Tariffs 36
Types of DSM Programs
• Passive-programs require utility-initiated efforts; howeveronce the programs are implemented the utility no longerinfluences the effects
• Active-programs require utility control, usually through asignal to a device or a customer

February 15-19, 1999 Wholesale and Retail Electric Tariffs 37
DSM Programs
• Design– objective
– participants
– DSM potential
– costs
• Implementation– timing
– third-party involvement
• Evaluation– engineering analysis
– cost-benefit analysis

February 15-19, 1999 Wholesale and Retail Electric Tariffs 38
DSM Objectives
Peak clipping
- direct load control
Valley filling
- nighttime security lighting
Load shifting
- thermal storage

February 15-19, 1999 Wholesale and Retail Electric Tariffs 39
DSM Objectives (cont.)
Strategic conservation
- insulation, efficient end-use
Strategic load growth
- economic development
Flexible load shape
- interruptible load
February 15-19, 1999 Wholesale and Retail Electric Tariffs 40
Cost-Benefit Analysis of DSM Programs
• the Participant Test– compares the benefits and costs to the customer due to the
participation in a program
• the Utility Cost Test (Revenue Requirement Test)– measures net costs of a program as a resource option based on the
costs incurred by the utility
• The Rate Impact Measure (Non-participants Test)– measures an impact on customer bill or rates due to changes in
utility revenues and operating costs caused by the program
• the Total Resource Cost Test– measures net costs of a DSM program as a resource option based
on the total cost of the program

February 15-19, 1999 Wholesale and Retail Electric Tariffs 41
Cost-Benefit Analysis of DSM Programs (cont.)
• Societal Test– measures the change in the total resource costs to society as a
whole rather than to only the service territory
Which test is the best?
All five perspectives provide valuable information in theevaluation of a program. If a program fails from oneperspective it can be redesigned.

February 15-19, 1999 Wholesale and Retail Electric Tariffs 42
Load Shift Concept
Hydro 0.2c/kWh
Nuclear 0.4c/kWh
Coal 2.5c/kWh
Combined cycle 3.0c/kWh
Combustion turbine 7.0c/kWh
0
25%
50%
100%
75%
12 18 24624

February 15-19, 1999 Wholesale and Retail Electric Tariffs 43
Storage vs. Conventional Electric Heat
-
0.5
1.0
1.5
2.0
2.5
3.0
3.5
1 2 3 4 5 6 7 8 9 10 11 12 13 14 15 16 17 18 19 20 21 22 23 24
Hour of day
Ele
ctri
c P
ow
er (
kW)
Conventional Storage heat
On peak period

February 15-19, 1999 Wholesale and Retail Electric Tariffs 44
Conventional and Storage Heating
Usage Period kWh Rate Cost Period kWh Rate Cost Period kWh Rate Cost Period kWh Rate CostBase On peak 1,600 0.06$ 96.00$ On peak 1,600 0.11$ 169.60$ On peak 1,600 0.11$ 169.60$ On peak 1,200 0.11$ 127.20$
Off peak 2,400 0.06$ 144.00$ Off peak 2,400 0.03$ 69.60$ Off peak 2,400 0.03$ 69.60$ Off peak 2,800 0.03$ 81.20$ Total 4,000 240.00$ Total 4,000 239.20$ Total 4,000 239.20$ Total 4,000 208.40$
Water Heat On peak 2,000 0.06$ 120.00$ On peak 2,000 0.11$ 212.00$ On peak 2,000 0.11$ 212.00$ On peak - 0.11$ -$ Off peak 2,000 0.06$ 120.00$ Off peak 2,000 0.03$ 58.00$ Off peak 2,000 0.03$ 58.00$ Off peak 4,000 0.03$ 116.00$ Total 4,000 240.00$ Total 4,000 270.00$ Total 4,000 270.00$ Total 4,000 116.00$
Space Heat On peak 4,200 0.06$ 252.00$ On peak 4,200 0.11$ 445.20$ On peak - 0.11$ -$ On peak - 0.11$ -$ Off peak 7,800 0.06$ 468.00$ Off peak 7,800 0.03$ 226.20$ Off peak 12,000 0.03$ 348.00$ Off peak 12,000 0.03$ 348.00$ Total 12,000 720.00$ Total 12,000 671.40$ Total 12,000 348.00$ Total 12,000 348.00$
Annual Bill 1,200.00$ 1,180.60$ 857.20$ 672.40$ Savings -$ 19.40$ 342.80$ 527.60$
Conventional Heating Conventional Heating on TOU Rates Storage Water and Heating on TOU RatesStorage Heating on TOU Rates
February 15-19, 1999 Wholesale and Retail Electric Tariffs 45
Tariff Setting
• Tariffs can be reviewed and modified at the Commission’sor Licensee’s initiative (Energy Law, Article 34)
• Review is based on the information provided by theLicensee (Energy Law, Article 35)
• Penalties can be imposed on those that do not followCommission’s directives (Energy Law, Article 27)
• The review process at the Energy Commission is governedby the internal Commission’s Rules and Procedures
• The tariffs are set using principles described in the law(Energy Law, Article 14)
• No tariff decision can be appealed (Energy Law, Article 28)
February 15-19, 1999 Wholesale and Retail Electric Tariffs 46
Consumer Rights and Obligations
• Energy usage has to be metered– Energy Law, Article 7
• Illegal consumption is prohibited– Energy Law, Article 8
• Delivered energy has to be of a certain quality– Civil Code, Article 554
• Payment for energy has to be made in a timely manner– Civil Code, Article 556
• Services can be disconnected for non-payment– Civil Code, Article 558

February 15-19, 1999 Wholesale and Retail Electric Tariffs 47
Disputes
• Any dispute between the supplier and the user of the energyshould be resolved between them first
• If no satisfactory solution can be found the next step is tofile a complaint with the Energy Commission
• The Energy Commission will attempt to decide the case(Energy Law, Article 20)
• If the Commission’s decision does not satisfy any of theparties involved it can be further appealed to the court withthe exception of tariff setting (Energy Law, Article 28)