arizona state data report - welcome to astho breast cancer learning community data report 2 arizona...
TRANSCRIPT
Arizona Breast Cancer Learning Community Data Report 1
Arizona State Data Report
ASTHO Breast Cancer Learning Community:
“Using Data to Address Disparities in Breast Cancer Mortality at the State Level”
Arizona Department of Health Services
ADDRESS: 150 North 18th Ave. Phoenix, AZ 85007 PHONE 602-542-1222
MAIN POINT(S) OF CONTACT: Virginia Warren
DATA SOURCES USED IN REPORT: Meeting notes, GIS, Census
STAKEHOLDERS (list organization names): Komen Arizona, American Cancer Society, Navajo Nation, Hopi Tribe, Tohono O’odham Nation, Gila River Indian Community, Hispanic Nurses Association, Mayo Clinic Cancer Center, Baggit!, University of Arizona Cancer Center, Mountain Park Community Health Center, Arizona Alliance for Community Health Centers, Health Net Health Plan, AHCCCS (Medicaid), Maricopa Integrated Health Services, Arizona State University, Centers for Disease Control, Invitae, Ebony House, Department of Education, Pilgrim Rest, Southwest Prostate Foundation, San Carlos Apache HealthCare Corporation, Hospice of the Valley, Maricopa County Dept. of Public Health, Breast Center of Southern Arizona and ADHS. (Of course CDC and ASTHO were also at the meeting.)
ABSTRACT/DESCRIPTION (300 WORDS OR LESS): Arizona held two levels of stakeholders’ meetings; one with a small group for planning purposes and then the larger gathering of all stakeholders. The event was standing room only, as stakeholders shared information about the meeting more people asked to participate. The room was moved once due to escalating attendance, and still was not really big enough for the group. During the initial stakeholder meeting, the data was shared with those participating. They asked questions and pointed out items they could not understand. Changes were made to prepare the data for the larger Stakeholder Meeting on March 25th. Arizona’s data demonstrate that women of color, African American, Hispanic and American Indian, are typically diagnosed with breast cancer at a younger age than Non-Hispanic Whites. Their cancer type is also more aggressive. American Indian women in some cases had a longer time period between diagnosis and treatment initiation. Screening Breakout The meeting had distinct focused work group sessions, the first focused on screening. During that discussion some unanswered questions were: how to tailor screening, which genetic risk tool to use and promote, are there environmental factors, how does economic status relate to late stage diagnosis and mortality rates and who monitors imaging quality (this is a consolidated listing). There were also additional stakeholders listed for inclusion in subsequent meetings. Follow up: Time to Diagnosis/Treatment Initiation Questions raised during this break out session included: why those with access to screening did not take advantage, how do we access Commission on Cancer data for Arizona, is mobile chemo and alternative, how are different tumor types related to age, could we use incidence to mortality ratios, what is the link between insurance status and stage of diagnosis. Again additional partners were discussed with private insurance, CoC accredited hospitals and Arizona State University Health Informatics being listed for future involvement.

Arizona Breast Cancer Learning Community Data Report 2
Arizona State Data Report
Quality of Treatment Arizona has 9 CoC accredited hospitals serving 7 million people. There are now more hospitals looking at securing this level of accreditation, but this will take a long time. Some questions arising during this breakout session were: how to know whether patients are receiving the correct treatment counseling, how do we know the quality of mammography services being provided, distance to services is significant in many areas, does access to FQHCs make a difference and more. Additional stakeholders to invite to the table included insurance companies (payers), clinical researchers, and those conducting clinical trials. There is a great deal of interest in the data available, in the aggregate, from Arizona’s CoC facilities. Impact to Date Team Arizona continues to collect data related to these issues. Contact has been made with Commission on Cancer to determine who does/does not have CoC accreditation in Arizona. CoC also let us know who is working on future accreditation. They are not sure CoC facility data is available for Arizona right now. There have been some local issues that may limit access for a while. We are working on that, more in the future.
LESSONS LEARNED: 1. Arizona’s women of color are diagnosed with breast cancer about 7 years younger than Non-Hispanic Whites. 2. When diagnosed with breast cancer, their tumor types are more aggressive than those of Non-Hispanic Whites. 3. In Arizona, it is not feasible for this population to be screened using USPSTF guidelines.
NEXT STEPS: 1. Continue working with CoC to determine the levels of Arizona specific data available. 2. Complete white paper on the steps/costs associated with becoming a CoC accredited facility. 3. Continue gathering and sharing related data to inform the Stakeholders.
Arizona Breast Cancer Learning Community Data Report 3
Arizona State Data Report
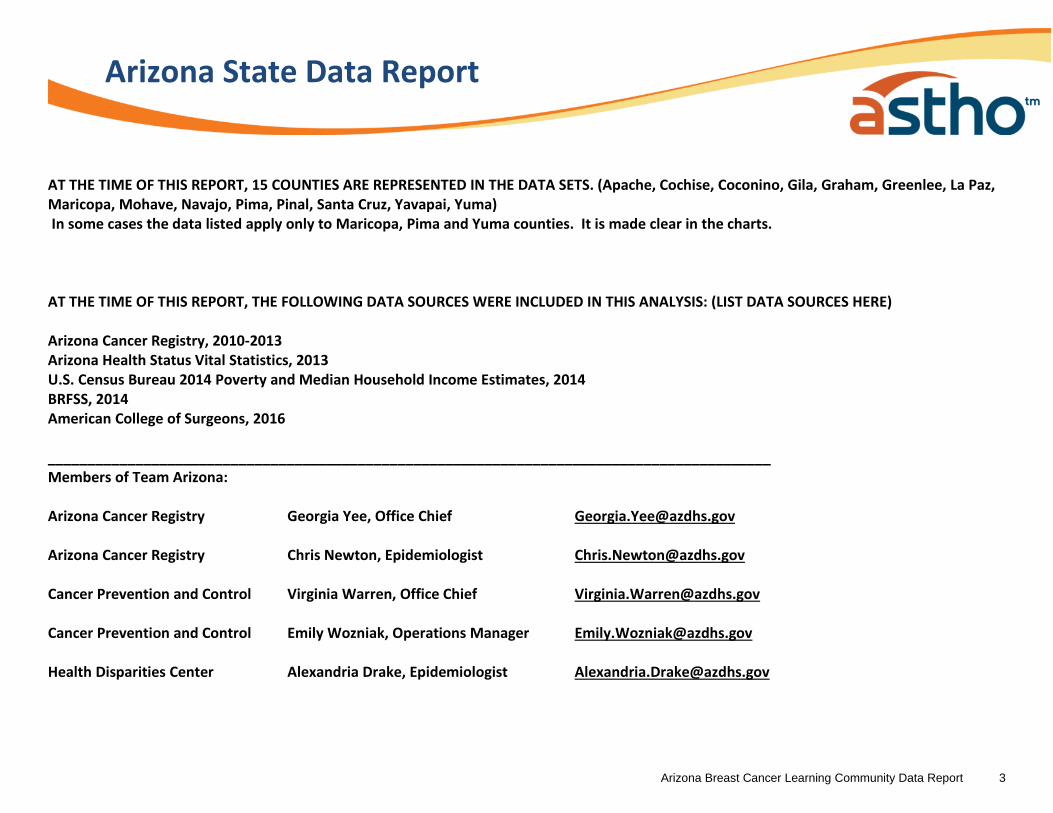
AT THE TIME OF THIS REPORT, 15 COUNTIES ARE REPRESENTED IN THE DATA SETS. (Apache, Cochise, Coconino, Gila, Graham, Greenlee, La Paz, Maricopa, Mohave, Navajo, Pima, Pinal, Santa Cruz, Yavapai, Yuma) In some cases the data listed apply only to Maricopa, Pima and Yuma counties. It is made clear in the charts. AT THE TIME OF THIS REPORT, THE FOLLOWING DATA SOURCES WERE INCLUDED IN THIS ANALYSIS: (LIST DATA SOURCES HERE) Arizona Cancer Registry, 2010-2013 Arizona Health Status Vital Statistics, 2013 U.S. Census Bureau 2014 Poverty and Median Household Income Estimates, 2014 BRFSS, 2014 American College of Surgeons, 2016 ___________________________________________________________________________________________ Members of Team Arizona: Arizona Cancer Registry Georgia Yee, Office Chief [email protected] Arizona Cancer Registry Chris Newton, Epidemiologist [email protected] Cancer Prevention and Control Virginia Warren, Office Chief [email protected] Cancer Prevention and Control Emily Wozniak, Operations Manager [email protected] Health Disparities Center Alexandria Drake, Epidemiologist [email protected]

Arizona Breast Cancer Learning Community Data Report 4
Arizona State Data Report
Arizona Overview Arizona is an extremely diverse state in regards to both geography and population. According to the 2015 United States Census, the total population in Arizona was approximately 6.8 million. Arizona has fifteen large counties, and while each county varies greatly in population density, it is important to note that 80 percent of the total population lives in Maricopa and Pima counties (the respective locations of the cities of Phoenix and Tucson). The map on page 8 illustrates population by county. Arizona’s residents vary greatly by race and ethnicity. The table below depicts the population characteristics for the state.
Race/Ethnicity Percent (US Census Data, 2015)
White, not Hispanic or Latino 55.8%
Hispanic or Latino 30.7%
American Indian or Alaska Native 5.3%
Black or African American 4.8%
Asian 3.4%
Two or More Races 2.7%
Context
Arizona Breast Cancer Learning Community Data Report 5
Arizona State Data Report
In addition to being a racially and ethnically diverse population, Arizona’s residents possess unique characteristics that may present distinctive challenges to accessing culturally and linguistically-appropriate health care, including cancer screening, diagnostics, and treatment. For example, the US Census Bureau estimates that in 2010-2014, about 27% of Arizona residents speak a language other than English at home. Arizona is also home to 22 sovereign American Indian Communities. The map on page 7 depicts the locations of tribal communities across the state. Cancer Programs at Arizona Department of Health Services
The Arizona Department of Health Services (ADHS) possesses several programs that work collaboratively to address the burden of cancer in Arizona. The Bureau of Public Health Statistics, Office of Health Registries, houses the Arizona Cancer Registry at the Arizona Department of Health Services. The Office of Cancer Prevention and Control resides in the Division of Public Health Services, Bureau of Health Systems Development, at ADHS. Together, these programs make up the Arizona Cancer Prevention and Control Team. The Arizona Cancer Registry (ACR) supports the collecting of cancer cases (incidence) and deaths (mortality) from cancer across the state of Arizona. Cancer reporting became mandatory on January 1, 1992. All cancer cases are reported to the ACR by providers, hospitals, pathology laboratories, and clinics across the state. The ACR reviews data accuracy, provides statistical support, responds to data requests, and monitors data trends. The Office of Cancer Prevention and Control contains two CDC-funded programs: the Comprehensive Cancer Control Program and the Breast and Cervical Cancer Early Detection Program. The Arizona Comprehensive Cancer Control Program enabled the development of the Arizona Cancer Coalition (ACC), a statewide group of public health professionals, providers, medical directors, survivors, and patients, who aim to reduce the incidence and mortality of cancer in Arizona. The ACC is composed of six “Action Teams” having specific cancer-related goals: Policy, Prevention, Early Detection, Treatment, Survivorship, and Research. To find out more about the Arizona Cancer Coalition, visit azcancercoalition.org. The Breast and Cervical Cancer Early Detection Program, known locally as the Well Woman HealthCheck Program (WWHP), provides breast and cervical cancer screening and diagnostic services and linkage to treatment to uninsured Arizonans. The WWHP has been offered in Arizona since 1993 and screens 7,000 women each year across the state. The WWHP is offered in all fifteen counties of Arizona through contracted providers

Arizona Breast Cancer Learning Community Data Report 6
Arizona State Data Report
(Arizona Cancer Programs, continued) belonging to federally qualified health centers (FQHCs) or county health departments. To view a listing of contracted providers and to learn more about the program, visit wellwomanhealthcheck.org. If cancer is found, Arizona offers the Breast and Cervical Cancer Treatment Program (BCCTP), and patients are enrolled in an AHCCCS-health plan at no cost to them. The patient’s cancer treatment is completely covered. If a woman does not qualify for the BCCTP, she may be eligible for treatment support through community grant programs funded by Susan G. Komen Arizona. To learn more about the BCCTP, please visit the BCCTP Eligibility webpages. In addition, the Office of Cancer Prevention and Control seeks to educate providers and the community about the importance of timeliness of services and appropriate patient follow up, systems change approaches, and effective electronic health record (EHR) system utilization within federally qualified health centers (FQHCs). Cancer Stakeholders The Arizona Cancer Prevention and Control Team is fortunate to collaborate frequently with many partners across the state that address cancer. Many of our core stakeholders participate in Work Groups within the Arizona Cancer Coalition and the Melanoma Task Force. We held our first Breast Cancer Collaborative Stakeholder Meeting on March 25, 2016, with the support of the following partners: American Cancer Society, Arizona Health Care Cost Containment System (Arizona’s Medicaid program), Arizona Alliance for Community Health Centers, Arizona State University, Bag-It!, Breast Center of Southern Arizona, Centers for Disease Control and Prevention, Department of Education, Ebony House, Gila River Indian Community, Health Net Health Plan, Hopi Tribe, Hospice of the Valley, Hispanic Nurses Association, Invitae, Maricopa Integrated Health Services, Maricopa County Department of Public Health, Mayo Clinic Cancer Center, Mountain Park Community Health Center, Navajo Nation, Pilgrim Rest, San Carlos Apache HealthCare Corporation, Southwest Prostate Foundation, Susan G. Komen Arizona, Tohono O’odham Nation, and The University of Arizona Cancer Center.

Arizona Breast Cancer Learning Community Data Report 7
Arizona State Data Report
The state of Arizona has 22
sovereign American Indian
Communities. With 5% of the
state’s population identifying
as American Indian, Arizona
ranks 3rd in the nation for
states with the largest
American Indian population.
Arizona Tribal Land and Reservations

Arizona Breast Cancer Learning Community Data Report 8
Arizona State Data Report
Arizona is a very diverse state in terms
of the size and population of our
counties. Our least populated county is
Greenlee County with 9,529 residents
and our most populated county is
Maricopa County with 4,167,947
residents. Pima County also has over
one million residents with a population
of 1,010,025.
Population by County
Arizona Breast Cancer Learning Community Data Report 9
Arizona State Data Report
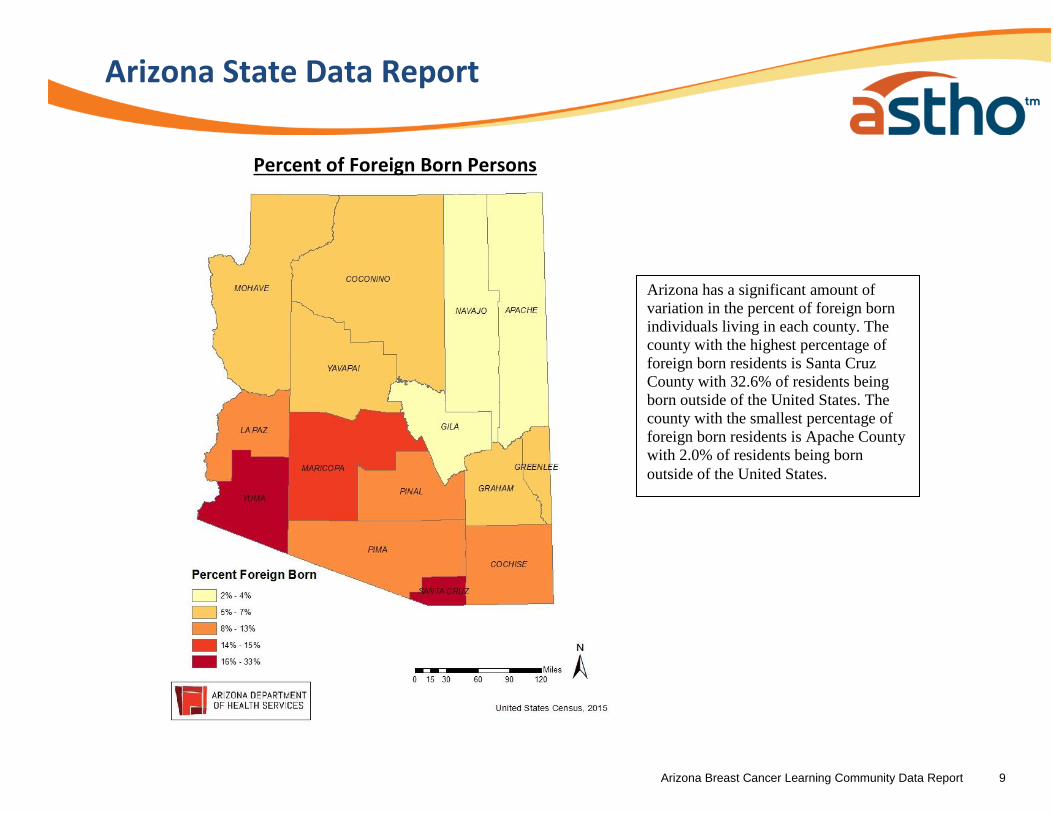
Arizona has a significant amount of
variation in the percent of foreign born
individuals living in each county. The
county with the highest percentage of
foreign born residents is Santa Cruz
County with 32.6% of residents being
born outside of the United States. The
county with the smallest percentage of
foreign born residents is Apache County
with 2.0% of residents being born
outside of the United States.
Percent of Foreign Born Persons

Arizona Breast Cancer Learning Community Data Report 10
Arizona State Data Report
Screening
Time Since Last Mammogram by Race/ Ethnicity
Source: BRFSS, 2014
The above table shows time since last mammogram by Race/Ethnicity using
BRFSS data. The table shows that compared to White Non-Hispanic women,
Black/African American, American Indian, and Hispanic women get screened
more frequently during the suggested screening time frame recommended by the
American Cancer Society. Black/African American women surveyed were most
likely to have had a mammogram within the past year or past two years at 88%.
* Note: BRFSS data is
based on self-reported
Race/Ethnicity.
Therefore there is not a
specified definition of
Hispanic origin
provided to survey
participants.

Arizona Breast Cancer Learning Community Data Report 11
Arizona State Data Report
Women 40+ Who Have Had a Mammogram in the Past 2 Years
Source: BRFSS, 2014
66% 70%63% 65%
24% 17% 28% 24%
9% 13%10% 10%
0%
10%
20%
30%
40%
50%
60%
70%
80%
90%
100%
White Non-Hispanic Black American Indian Hispanic
Unsure
No
Yes
Looking more specifically at age differences, it can be observed that
70% of Black women over the age of 40 have had a mammogram in the
past two years. White Non- Hispanic women were the next highest
group at 66% followed by Hispanic women at 65% and American Indian
women at 63%.

Arizona Breast Cancer Learning Community Data Report 12
Arizona State Data Report
Women 50+ Who Have Had a Mammogram in the Past 2 Years
Source: BRFSS, 2014
68%78%
68% 68%
23%12%
23% 22%
9% 15% 9% 10%
0%
10%
20%
30%
40%
50%
60%
70%
80%
90%
100%
White Non-Hispanic Black American Indian Hispanic
Unsure
No
Yes
The survey results for women over the age of 50 had similar results as
women over the age of 40. Black women had the highest reports of having a
mammogram in the past 2 years at 78%. This was followed by White Non-
Hispanic, American Indian, and Hispanic women all at 68%. All of the
examples given so far go against the original hypothesis that minority
women in Arizona had worse screening rates when compared to other
(specifically White Non-Hispanic) women.

Arizona Breast Cancer Learning Community Data Report 13
Arizona State Data Report
This map shows the locations of the 160
licensed mammography facilities in the
state of Arizona as of 6/29/2016. The
map also includes a gray driving zone
that represents an hour drive from the
closest mammography facility. This
shows areas of the state where
mammograms are not easily available
to residents.

Arizona Breast Cancer Learning Community Data Report 14
Arizona State Data Report
Diagnosis/ Mortality Data
Source: Arizona
Cancer Registry
*Note: The Arizona
Cancer Registry defines
White Hispanic as White
Race or Race indicated as
Other and an Ethnicity
Code of: Mexican, Puerto
Rican, Cuban, South or
Central American, Other
Spanish, or Spanish ‘NOS’

Arizona Breast Cancer Learning Community Data Report 15
Arizona State Data Report
*Because of small case counts, Blacks & American Indians are placed in All other races & Unknown races in Yuma County
Source: Arizona Cancer Registry

Arizona Breast Cancer Learning Community Data Report 16
Arizona State Data Report
*Because of small case counts, Blacks & American Indians are placed in All other races & Unknown races in Yuma County
Source: Arizona Cancer Registry

Arizona Breast Cancer Learning Community Data Report 17
Arizona State Data Report
*Because of small case counts, Blacks & American Indians are placed in All other races & Unknown races in Yuma County
Source: Arizona Cancer Registry

Arizona Breast Cancer Learning Community Data Report 18
Arizona State Data Report
This map shows the percent of
early stage diagnoses overlaid with
Federally Qualified Health Center
locations. According to the map
there doesn’t seem to be a blatant
correlation between multiple FQHC
locations and earlier breast cancer
detection. This map also gives an
example of population distribution
in the state, with many of the more
densely populated areas having
more FQHCs. The color scheme on
this map has been flipped from the
other maps in this profile so the
dark purple color represents an
undesirable outcome like in the
other maps.
*Note: The Arizona Cancer
Registry defines an Early Stage
Diagnosis as a diagnosis at the In
Situ or Local Stage using SEER
Summary Stage.
Arizona Breast Cancer Learning Community Data Report 19
Arizona State Data Report
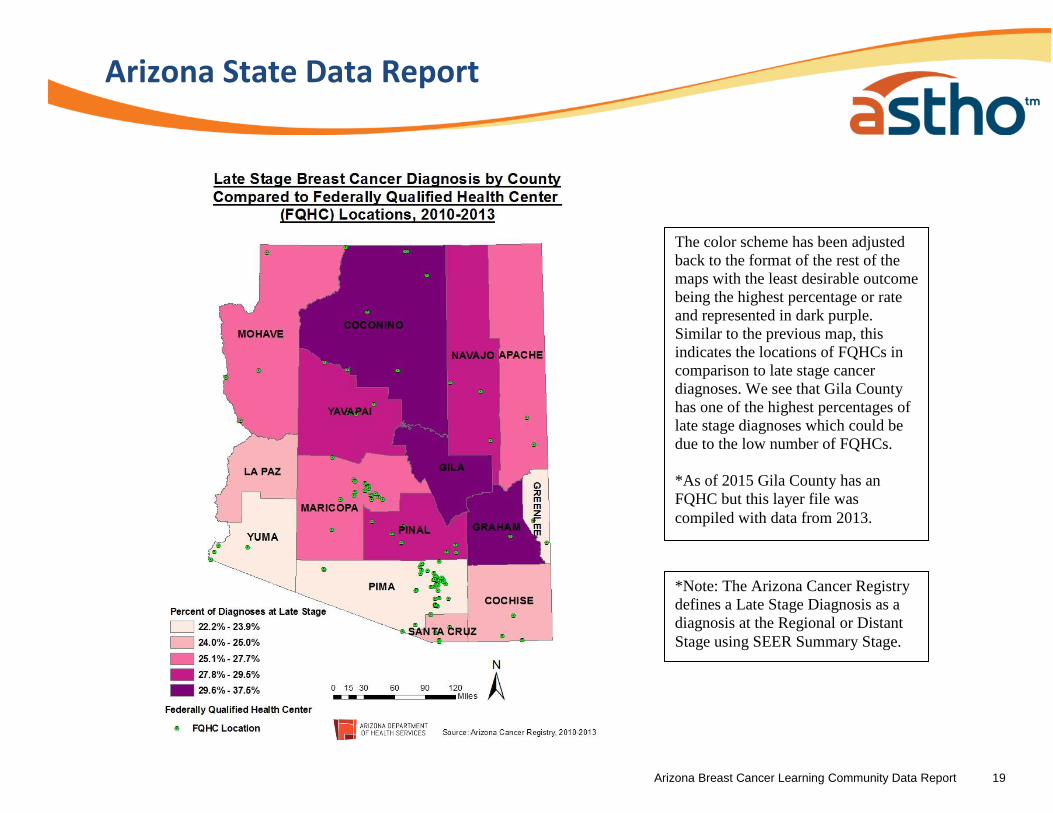
The color scheme has been adjusted
back to the format of the rest of the
maps with the least desirable outcome
being the highest percentage or rate
and represented in dark purple.
Similar to the previous map, this
indicates the locations of FQHCs in
comparison to late stage cancer
diagnoses. We see that Gila County
has one of the highest percentages of
late stage diagnoses which could be
due to the low number of FQHCs.
*As of 2015 Gila County has an
FQHC but this layer file was
compiled with data from 2013.
*Note: The Arizona Cancer Registry
defines a Late Stage Diagnosis as a
diagnosis at the Regional or Distant
Stage using SEER Summary Stage.

Arizona Breast Cancer Learning Community Data Report 20
Arizona State Data Report
A factor that may influence a late
stage breast cancer diagnosis is lack
of insurance. This map compares
the percent of late stage diagnoses
by county to the percent uninsured
from that county. Interestingly, the
three counties with the highest
percentage of late stage diagnoses
were in the lower two categories for
percent uninsured.
Arizona Breast Cancer Learning Community Data Report 21
Arizona State Data Report
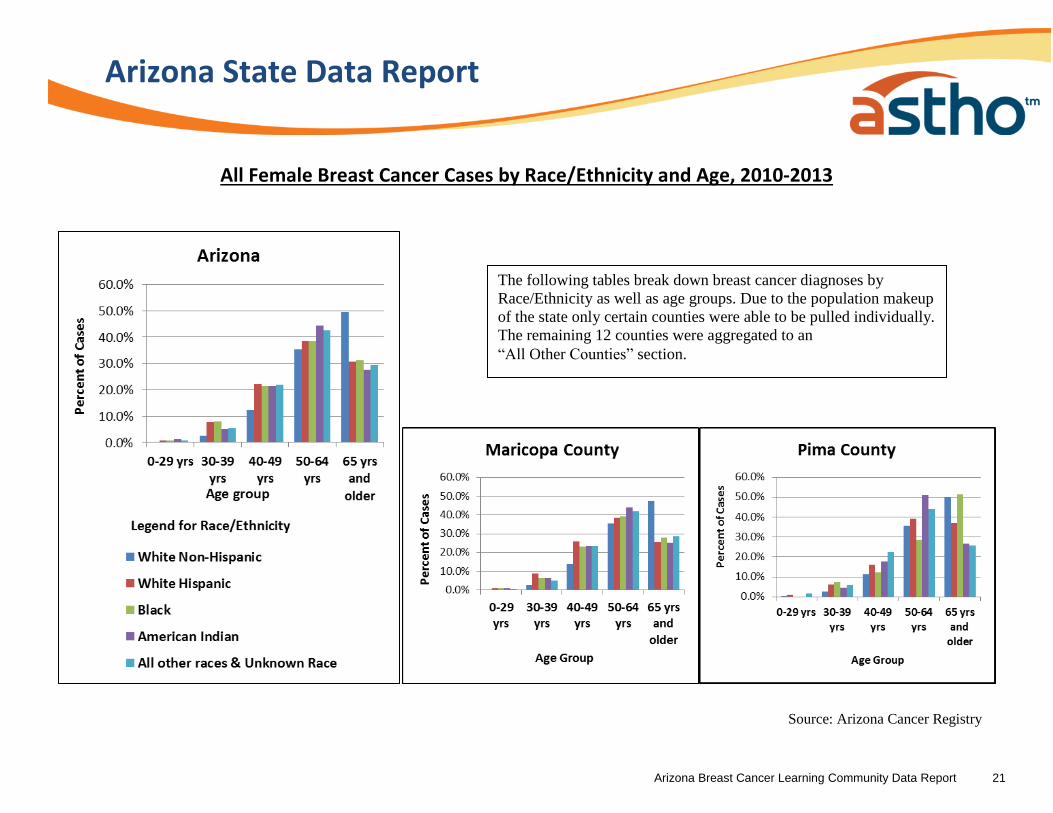
All Female Breast Cancer Cases by Race/Ethnicity and Age, 2010-2013
The following tables break down breast cancer diagnoses by
Race/Ethnicity as well as age groups. Due to the population makeup
of the state only certain counties were able to be pulled individually.
The remaining 12 counties were aggregated to an
“All Other Counties” section.
Source: Arizona Cancer Registry

Arizona Breast Cancer Learning Community Data Report 22
Arizona State Data Report
All Female Breast Cancer Cases by Race/Ethnicity and Age, 2010-2013 (Continued)
*Because of small case counts, Blacks & American Indians are
placed in All other races & Unknown races in Yuma County.
What is especially interesting to note is the difference in
the age of diagnosis in the different Races/Ethnicities.
Please refer below for the median age of diagnosis.
Median Age by Race/Ethnicity
White Non-Hispanic 64 Years
White Hispanic 57 years
Black 58 years
American Indian 57 years
Source: Arizona Cancer Registry

Arizona Breast Cancer Learning Community Data Report 23
Arizona State Data Report
This map compares breast cancer mortality rates with Race/Ethnicity demographic information taken
from the 2014 Census. This not only highlights counties with higher mortality rates but also provides
information on potential intervention target groups in individual counties or regions. Hispanic
includes unknown race with an ethnicity of Hispanic.
Arizona Breast Cancer Learning Community Data Report 24
Arizona State Data Report
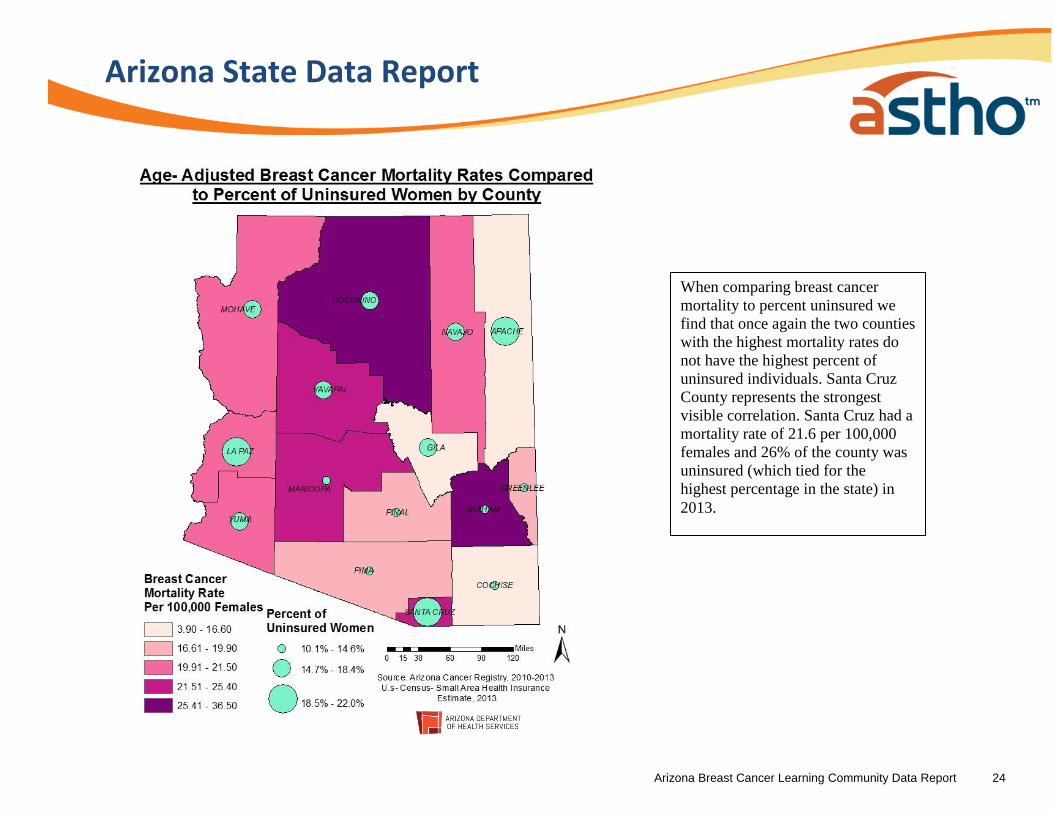
When comparing breast cancer
mortality to percent uninsured we
find that once again the two counties
with the highest mortality rates do
not have the highest percent of
uninsured individuals. Santa Cruz
County represents the strongest
visible correlation. Santa Cruz had a
mortality rate of 21.6 per 100,000
females and 26% of the county was
uninsured (which tied for the
highest percentage in the state) in
2013.

Arizona Breast Cancer Learning Community Data Report 25
Arizona State Data Report
The final mortality map compares
median household income to
mortality rates. This represents
another method used to use
demographic and socio-economic
status data to compare to mortality
rates. Median household income does
not seem to be a strong indicator to
higher breast cancer mortality rates in
a county. Graham County and
Coconino County have the highest
mortality rates in the state but neither
are in the lowest median household
income category represented.

Arizona Breast Cancer Learning Community Data Report 26
Arizona State Data Report
Quality
This map shows the 9 locations of
Commission on Cancer (CoC) Hospitals
in the State of Arizona. This hospital
designation is given by the American
College of Surgeons to facilities that
provide high-quality patient centered
care. Through accreditation by the CoC
organizations are showing they have
established data-driven performance
measures to enhance quality of care.
For comparison, there are 9 CoC
accredited hospitals just in the city of
Atlanta (not including suburbs or the
metropolitan area) and there are 14 CoC
hospitals located in the city of
Chicago1. This shows that with a
population of nearly 7,000,000 in the
state of Arizona, not only is there an
uneven distribution of CoC accredited
hospitals but also a significant lack in
number of CoC accredited hospitals.
1https://www.facs.org/search/cancer-
programs