areaundergraph
DESCRIPTION
http://www.physicsfirstmo.org/Archive/AreaUnderGraph.pdfTRANSCRIPT

Meera Chandrasekhar ([email protected]) Dorina Kosztin ([email protected]) Department of Physics and Astronomy University of Missouri, Columbia
Support: National Science Foundation Math-Science Partnership Institute Grant NSF DUE 0928924
www.physicsfirstmo.org
www.physicsfirstmo.org
Students obtain straight lines graphs from different experiments
Students figure out quickly that the slope of a linear graph has a physical meaning
Additional physical meaning in certain graphs: area under the curve
Today we will analyze three experiments Uniform Motion v – t graph Accelerated Motion v – t graph Work F – d graph
www.physicsfirstmo.org
Same position means same speed Position and velocity graphs show the path of the particle Difficulty relating real world motion to a graph Leading particle moves at a faster speed Velocity must always be positive The meaning of the phrase “graph a-versus-b”. Identify quantity in a graph that will answer the question (coordinate,
slope, area) Same velocity means same acceleration for two objects Zero velocity means zero acceleration

www.physicsfirstmo.org
Position, distance and displacement have different meanings.
Uniform motion means that an object travels equal distance in equal time intervals.
Uniform accelerated motion means that velocity changes by equal amounts in equal time intervals
An object that accelerates is speeding up, slowing down, or turning.
Motion can be described in different ways: with words, graphs, motion diagrams and mathematical models.

www.physicsfirstmo.org

www.physicsfirstmo.org
position changes linearly with time the rate of change of position with time = velocity slope of graph = velocity slope is constant => velocity is constant length of distance travelled in unit time is the same

www.physicsfirstmo.org
same distance travelled in the same time interval velocity is constant calculate the distance traveled as the area under the v vs t graph

www.physicsfirstmo.org
v (cm/s)
t (sec)
1 2 3 4 5 6 7
3
What is the distance traveled in the first second? What is the distance traveled in the first 2 seconds? What is the distance traveled between 3 s and 6 s?
3 cm
3 cm
3 cm
3 cm
3 cm
3 cm
3 m

www.physicsfirstmo.org

www.physicsfirstmo.org
How is the v vs t different for the accelerated motion? Demo: the spark timer

www.physicsfirstmo.org
graph is not linear => velocity is not constant slope is not constant => can only calculate slope at a point = instantaneous velocity length of distance traveled in unit time increases

www.physicsfirstmo.org
velocity is not constant, changes linearly with time slope of velocity graph represents the rate at which velocity changes = acceleration calculate acceleration as the slope of the v vs t graph. calculate the distance traveled as the area under the v vs t graph

www.physicsfirstmo.org
v (m/s)
t (sec)
1 2 3 4 5 6

www.physicsfirstmo.org
www.physicsfirstmo.org
www.physicsfirstmo.org
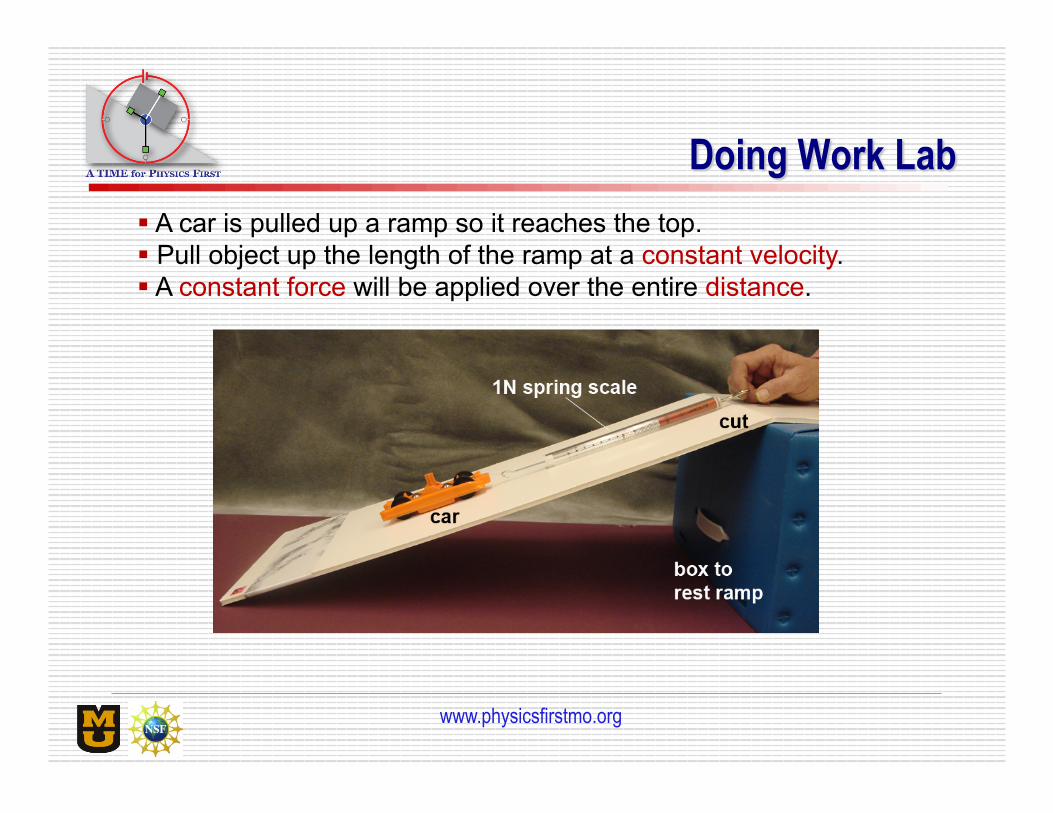
A car is pulled up a ramp so it reaches the top. Pull object up the length of the ramp at a constant velocity. A constant force will be applied over the entire distance.

www.physicsfirstmo.org
In order to develop the relationship between force, work and distance, we need to measure force required to travel up each ramp and compare them

www.physicsfirstmo.org
0
0.1
0.2
0.3
0.4
0.5
0 0.2 0.4 0.6 0.8 1
App
lied
Forc
e (N
)
Ramp length, distance Δx (m)
Force vs. distance traveled on ramp Δx (m) F (N)
1 0.24
0.9 0.26
0.8 0.28
0.7 0.32
0.6 0.4
0.5 0.46
Table: Force F required for different lengths of ramp, Δx (height of ramp =16.5 cm)

www.physicsfirstmo.org

www.physicsfirstmo.org
Today we analyzed three experiments Uniform Motion v – t graph Accelerated Motion v – t graph Work F – d graph
This method can be used whenever the product of the variables on the two axes has physical meaning