are there myths on road impact and transport in sub-saharan
TRANSCRIPT

HAL Id: halshs-00830006https://halshs.archives-ouvertes.fr/halshs-00830006
Submitted on 4 Jun 2013
HAL is a multi-disciplinary open accessarchive for the deposit and dissemination of sci-entific research documents, whether they are pub-lished or not. The documents may come fromteaching and research institutions in France orabroad, or from public or private research centers.
L’archive ouverte pluridisciplinaire HAL, estdestinée au dépôt et à la diffusion de documentsscientifiques de niveau recherche, publiés ou non,émanant des établissements d’enseignement et derecherche français ou étrangers, des laboratoirespublics ou privés.
Are There Myths on Road Impact and Transport inSub-Saharan Africa?
Monica Beuran, Marie Castaing Gachassin, Gaël Raballand
To cite this version:Monica Beuran, Marie Castaing Gachassin, Gaël Raballand. Are There Myths on Road Impactand Transport in Sub-Saharan Africa?. Documents de travail du Centre d’Economie de la Sorbonne2013.49 - ISSN : 1955-611X. 2013. <halshs-00830006>

Documents de Travail du Centre d’Economie de la Sorbonne
Are There Myths on Road Impact and Transport
in Sub-Saharan Africa?
Monica BEURAN, Marie Castaing GACHASSIN, Gaël RABALLAND
2013.49
Maison des Sciences Économiques, 106-112 boulevard de L'Hôpital, 75647 Paris Cedex 13 http://centredeconomiesorbonne.univ-paris1.fr/bandeau-haut/documents-de-travail/
ISSN : 1955-611X
1
Are There Myths on Road Impact and Transport in Sub-Saharan Africa?
Monica Beuran
Marie Castaing Gachassin
Gaël Raballand1
Abstract: As planned large investments in road infrastructure continue to be high on the agenda of many
African countries, only few of these countries have actually amended their investments strategy. In many
cases, there seems to be a preference for a status quo that can easily be explained by political economy
factors driving the policies in the sector. This paper first presents data on the state of roads in Sub-Saharan
Africa (length, density, condition) as well as on investments in the sector over the last decades. It then
demonstrates how most countries’ strategies are based on some misperceptions and recommends some
changes to improve the developmental impact of roads investments. Better prioritization of investments,
better procurement and contract management, better projects implementation and better monitoring are
still needed, in spite of the efforts observed in the last 10 years.
Keywords: transport, roads, Sub-Saharan Africa, strategy, infrastructure, procurement.
JEL Codes: H41, O18, O55, R42
Résumé : Alors que les investissements routiers sont toujours en tête des agenda de la plupart des pays
Africains, seuls certains d’entre eux ont modifié leur stratégie d’investissement. Il semble en effet existé
une préférence pour le status quo, préférence due aux facteurs d’économie politique conduisant les
décisions dans le secteur. Cet article présente tout d’abord l’état des routes en Afrique Sub-saharienne
(longueur, densité, condition) et sur les investissements dans ce secteur sur les dernières décennies. Il
démontre ensuite que la plupart des stratégies des pays concernés sont basées sont des perceptions
erronées et recommande des changements pour améliorer les impacts développementaux des
investissements routiers. Malgré les efforts observés sur les 10 dernières années, des améliorations restent
à faire en termes de hiérarchisation des priorités, de gestion et d’acquisition des contrats, de mise en
œuvre et de suivi des projets.
Mots clés : Transport, routes, Afrique Sub-saharienne, stratégie, infrastructure.
Codes JEL : H41, O18, O55, R42
1 Monica Beuran, consultant, (corresponding author) Marie Castaing Gachassin, PhD, University Paris 1 Pantheon-
Sorbonne, Gaël Raballand, senior economist, World Bank. The authors would like to thank Antonio Estache for
inputs, Jean-François Arvis, Charles Kunaka, Arnaud Desmarchelier, Louise Fox, Tshepo Kgare and Ann May for
comments and suggestions.
Documents de Travail du Centre d'Economie de la Sorbonne - 2013.49
2
1. Introduction
The lack of an effective transport system is considered as one of the main impediments to
economic development and poverty reduction. In Sub-Saharan Africa (SSA), road transport is by far the
dominant transportation mode, carrying over 75% of passengers and freight. But more than 50% of these
roads are in poor condition, mainly due to underfinanced and poor management of road maintenance
(Zietlow 2007). Intra-regional connectivity is said to be overall deficient. The focus on road investments
in SSA has become increasingly important for enabling growth and poverty reduction.
As yet, investment strategies have been mainly based on a too simplistic assumption that
infrastructure would inevitably yield a large economic impact, whereas reality is much more complex2.
For instance, access to roads and road condition along the main corridors in SSA are not as bad as
expected. Also, some measures undertaken to tackle the cost of transport such as establishing one-stop
border posts, commercialize road agencies or develop a rural access index seem not to have the predicted
impact (even though rigorous evaluations still need to be carried out). Knowledge on the developmental
impact of roads is improving and already calls for revising strategies. The objective is to enhance the
impact of roads investments through better prioritizing investments and better monitoring procurement
and projects implementation.
This is a particular need while a recent scaling-up of roads infrastructure investments has been
launched and is being implemented. Hence, at the time of current or planned large investments in road
infrastructure, many countries have not yet amended their investments strategy.
It is usually forgotten that a road infrastructure is only part of the investments needed for
improved mobility and accessibility. Transport services, typically provided by the private sector, are
equally important. However, the public sector sometimes proceeds to invest in infrastructure only to
realize the private sector does not follow through in providing transport services. In order to maximize
returns, it is important that investments in both are realized.
The paper is organized as followed. The next section presents a literature review based on a
narrative survey and a quantitative analysis. The third section gives a picture of the situation in the road
sector in SSA in the last two decades (i.e. trends in infrastructure endowments, roads quality and costs,
spending trends), It reviews the institutional development in the sector and presents roads investments
policies. The third section summarizes the recent research findings related to roads investments in SSA
2 Three key factors matter for the developmental impact of roads investments: strategy (by assessing the economic
impact, selecting a technical solution, assessing sustainability of the selected technical option), sector financing
(assessing revenues related to network size and unit costs) and institutional support (the institutional structure and
various incentives among donors/governments/local authorities).
Documents de Travail du Centre d'Economie de la Sorbonne - 2013.49

3
and the fourth section calls for some possible adjustments of road investments strategies in SSA. The final
section concludes and proposes some areas for further research.
2. Literature Review
The roads-poverty relation can be assessed 1) by focusing on the channels of the impact of roads
on poverty or 2) by defining a poverty proxy as a function of road access.
Several channels can be identified. First, roads facilitate the provision of basic needs to the poor
such as health and education (Mu and van de Walle, 2007; Khandker et al, 2009). Roads are also a
complementary input for these provisions of human capital formation facilities to be effective (Gannon
and Liu, 1997).
Second, roads ease access to markets. The greater availability of inputs and their reduced prices
due to lower transport costs increase productivity as showed by Khandker et al (2010), Minten and Stifel
(2008), or Gibson and Rozelle (2003) . In turn, production and income increase too (; Jacoby and Minten,
2009; Wondemu and Weiss, 2010; Stifel et al, 2012).
The last channel concerns employment. First, transport infrastructure can reduce poverty by
creating employment and new job opportunities (Jacobs and Greaves, 2003). The construction and
maintenance of a road are labor-intensive operations and can provide job opportunities to people living
around. Ianchovichina et al (2012) show that "roads projects [have] a direct impact on creation of
relatively low-skilled jobs". Second, the provision of roads also entails a greater and/or cheaper
availability of labor markets. For example, Mu and van de Walle (2007) show that road projects in
Vietnam increased employment opportunities by 11% for unskilled labor. Finally, the literature provides
insights on the relation between road access and the two ways to define diversification of income sources:
choice of the sector, and multiplication of activities.
The choice of the sector refers to the choice between agriculture and non-agriculture activities.
Smith et al (2001) show that road rehabilitation projects in Uganda extended job opportunities in the
service sector. In Tanzania, this kind of project developed job opportunities for non-agricultural
employment (Lanjouw et al, 2001). Gollin and Rogerson (2010) show that large subsistence agriculture
sectors are promoted by a lack of transportation infrastructure in Uganda.
The other way to think about diversification is as a multiplication of income sources. On the one
hand, diversification occurs in remote areas as a way to deal with the local demand for multiple goods and
Documents de Travail du Centre d'Economie de la Sorbonne - 2013.49

4
services (Barrett et al, 2001; Block and Webb, 2001). On the other hand, access to markets can help
develop multi-activities since opportunities to diversify are greater (Gibson and Rozelle, 2003).
However, due to data limitation, it can be hard to disentangle the three channels and researchers
may prefer to define a global impact of roads access on poverty. Various works report that road
connectivity has a positive and significant impact on poverty. Evidence notably include Jacoby (2000),
Bigman et al (2000), Jalan and Ravallion (2002), Deininger and Okidi (2003), Mogues et al (2008), Nuru
and Seebens (2008), Dercon et al (2009, 2011).
The common limitation of all these works is that they generally cannot control for the typical
endogeneity bias affecting the roads-poverty/development relation. Endogeneity can stem from a
simultaneous determination issue coming from unobservable determinants. In fact, the decision to build a
road is subject to various demands, such as geographical and topographic conditions that also determine
economic condition. Simultaneous determination can also lead to biased estimates of roads impact
because people do not randomly settle next to roads once they have been constructed. In particular, the
localization choices of people are driven by specific individual characteristics that can also dictate their
poverty status. In the same vein, a reverse causality issue may also be at work as the poverty status of a
household can determine their localization choices alongside a road.
Van de Walle (2009) recommends the use of appropriate estimation methods such as difference-
in-difference, Propensity Score Matching, and instrumentation.3 The General Method of Moments is also
used to deal with unobservable characteristics as in Jalan and Ravallion (2002), Dercon et al (2009, 2011)
and Khandker and Koolwal (2011). Finally, the use of a general equilibrium context can also help in
dealing with the endogeneity issue between road management and investment decision.4 A more macro
literature on transport and development (urbanization, trade) develops clever identification strategies
based on new GIS dataset and historical perspectives: Atack et al (2009), Jedwab and Moradi (2011),
Banerjee et al (2012), Storeygard (2012).
If this narrative survey seems to legitimate the massive roads investments implemented in SSA,
Estache (2010) underlines that such studies make comparisons and generalizations difficult. However,
Castaing Gachassin (2013) shows in her meta-analysis that the micro literature on the roads-poverty
relation reports a true underlying empirical effect and that it is not due to a publication bias.
Therefore, roads help decreasing poverty in developing regions but knowledge about the
heterogeneity of roads impacts is still limited. The next step for the empirical literature is to document the
3 See the papers of Khandker et al (2009, 2010) and Mu and van de Walle (2007) for examples of DD and matching,
and Gibson and Rozelle (2003) for instrumentation. 4 See Fan et al (2000) on India, Fan et al (2002) and Fan and Chan-Kang (2004) on China, Fan et al (2004) on
Thailand, Fan et al (2005) on Tanzania.
Documents de Travail du Centre d'Economie de la Sorbonne - 2013.49

5
variety of effects and their conditioning to regional, local and individual characteristics to achieve
efficiency in roads investments.
3. Data on Road Infrastructure in Sub-Saharan Africa
Road infrastructure endowments
Figure 1 below depicts the actual situation of all world regions for the total road network density
in relation to land area. SSA lags far behind, with density that represents less than a quarter of the world
average. Defining road density in terms of population5, the situation marginally differs (see Figure 2).
This density is slightly lower than the Middle East's and the North Africa; and slightly higher than South
Asia.
Figure 1: Spatial Density of Road Network
Source: Gwilliam et al (2008)
Figure 2: Total Road Network per capita
5 This is more accurate as the first measure partly reflects the low population densities in the region.
Documents de Travail du Centre d'Economie de la Sorbonne - 2013.49

6
Source: Gwilliam et al (2008)
This general world description hides the heterogeneity experienced across African countries. On average
in SSA road-to-population density is of about 3.7 kilometers per thousands of inhabitants; it ranges from
0.37 for Sudan to 35.7 for Namibia (see Table 1 below).
Table 1: Roads Density per country in SSA (in kilometers per thousands of inhabitants)
RANK COUNTRY DENSITY RANK COUNTRY DENSITY 1 Namibia 35.67 24 Cape Verde 2.50 2 South Africa 8.44 25 Cameroon 2.36
3 Gabon 6.70 26 Sao Tome and
Principe
2.34
4 Equatorial Guinea 6.57 27 Burundi 2.27
5 Central African
Republic
6.41 28 Kenya 2.13
6 Zambia 6.37 29 Gambia, The 2.12
7 Botswana 5.89 30 Ghana 2.03
8 Chad 4.20 31 Mozambique 1.73
9 Congo, Rep. 3.84 32 Nigeria 1.69
10 Angola 3.81 33 Comoros 1.66
11 Guinea 3.69 34 Mauritius 1.63
12 Liberia 3.64 35 Rwanda 1.60
13 Lesotho 3.35 36 Togo 1.45
14 Guinea-Bissau 3.31 37 Senegal 1.44
15 Somalia 3.25 38 Mali 1.33
16 Congo, Dem. Rep. 3.21 39 Eritrea 1.17
17 Madagascar 3.17 40 Burkina Faso 1.14
18 Cote d'Ivoire 3.08 41 Benin 0.97
19 Mauritania 2.98 42 Niger 0.89
20 Swaziland 2.90 43 Ethiopia 0.46
21 Tanzania 2.59 44 Sudan 0.37
22 Sierra Leone 2.59
23 Malawi 2.53 Source: World Development Indicators
Documents de Travail du Centre d'Economie de la Sorbonne - 2013.49
7
These first figures and table only provide a snapshot that should not be used to infer policy
recommendations. First, road density data are weak proxies to benchmark their economic impact since
roads investments depend primarily on the size of a country and the location of settlements. Also, lengths
and densities are actually not relevant objectives as expanding networks may not be necessary in the
region. This also questions the fiscal sustainability of such projects which is hard to achieve in the region.
Second, it does not inform on the issues of condition and quality which are at the core of the sector's
challenges. Finally, the issues related to the governance of the road sector cannot be assessed with such
data.
Road infrastructure spending
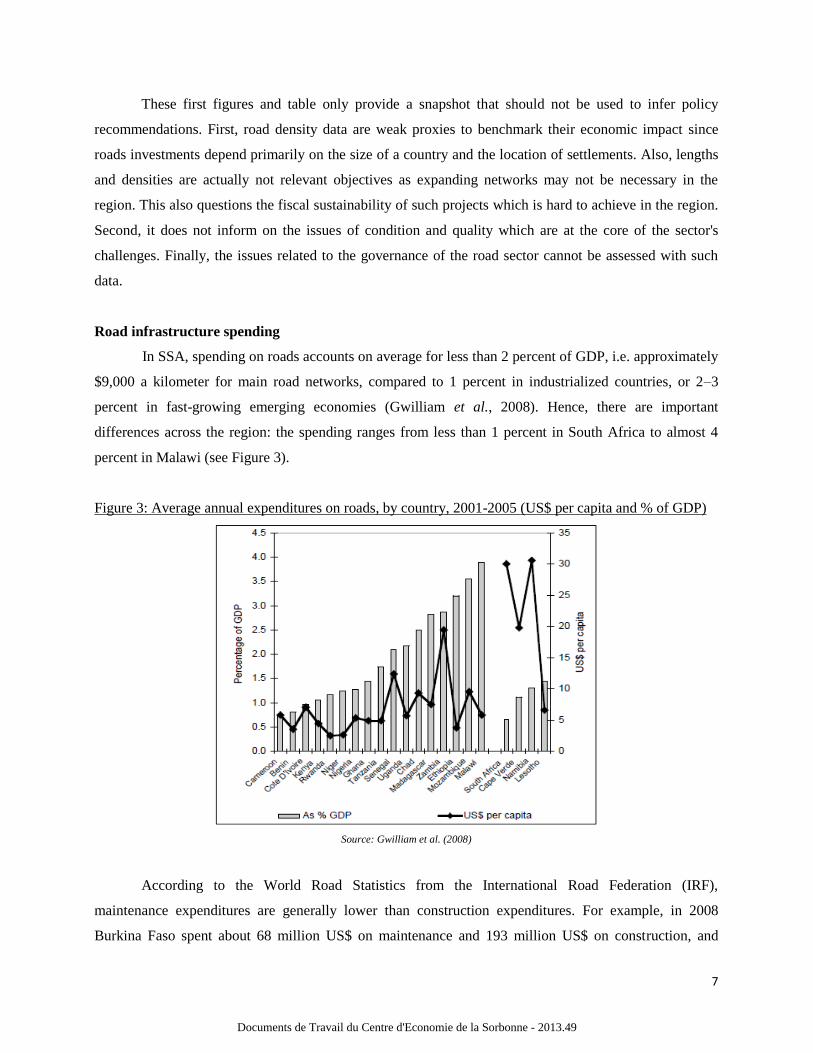
In SSA, spending on roads accounts on average for less than 2 percent of GDP, i.e. approximately
$9,000 a kilometer for main road networks, compared to 1 percent in industrialized countries, or 2–3
percent in fast-growing emerging economies (Gwilliam et al., 2008). Hence, there are important
differences across the region: the spending ranges from less than 1 percent in South Africa to almost 4
percent in Malawi (see Figure 3).
Figure 3: Average annual expenditures on roads, by country, 2001-2005 (US$ per capita and % of GDP)
Source: Gwilliam et al. (2008)
According to the World Road Statistics from the International Road Federation (IRF),
maintenance expenditures are generally lower than construction expenditures. For example, in 2008
Burkina Faso spent about 68 million US$ on maintenance and 193 million US$ on construction, and
Documents de Travail du Centre d'Economie de la Sorbonne - 2013.49

8
Tanzania about 124 million US$ on maintenance and 182 million US$ on construction. If some countries
spend more on maintenance than construction (Ghana, Congo or Cameroon), on average capital
expenditures actually represent two thirds of the total roads spending when needs should share equally
between capital and maintenance operations (Gwilliam et al, 2008).
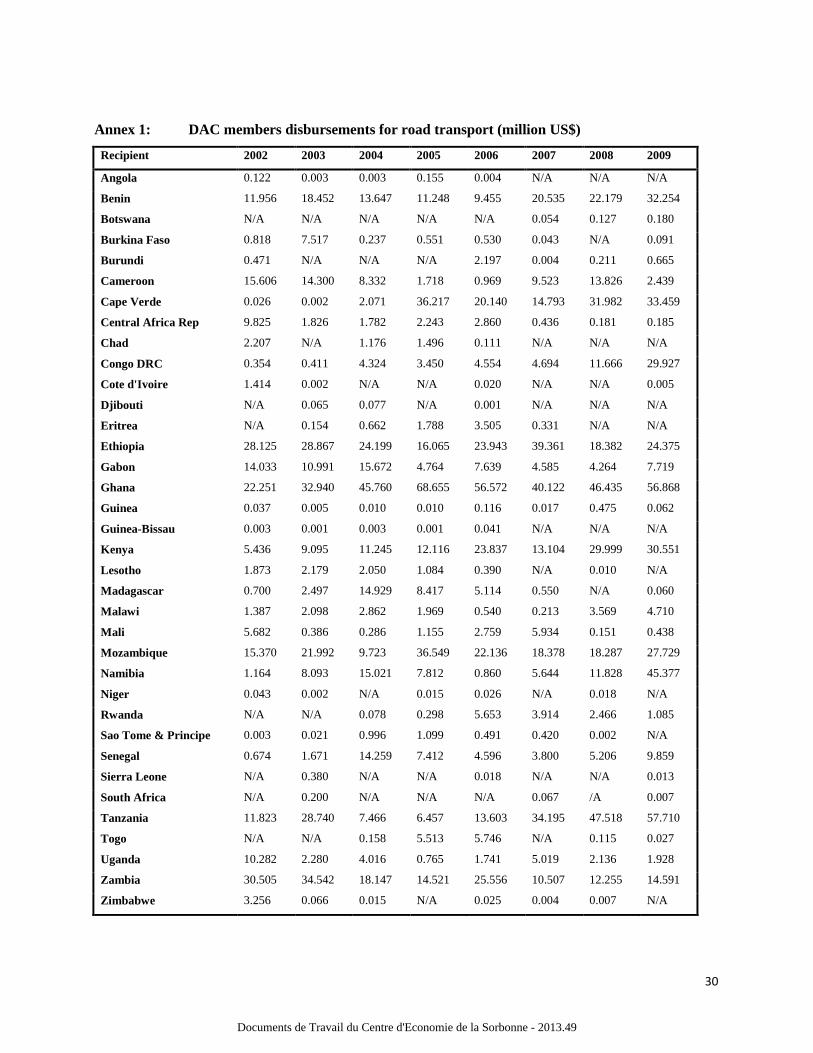
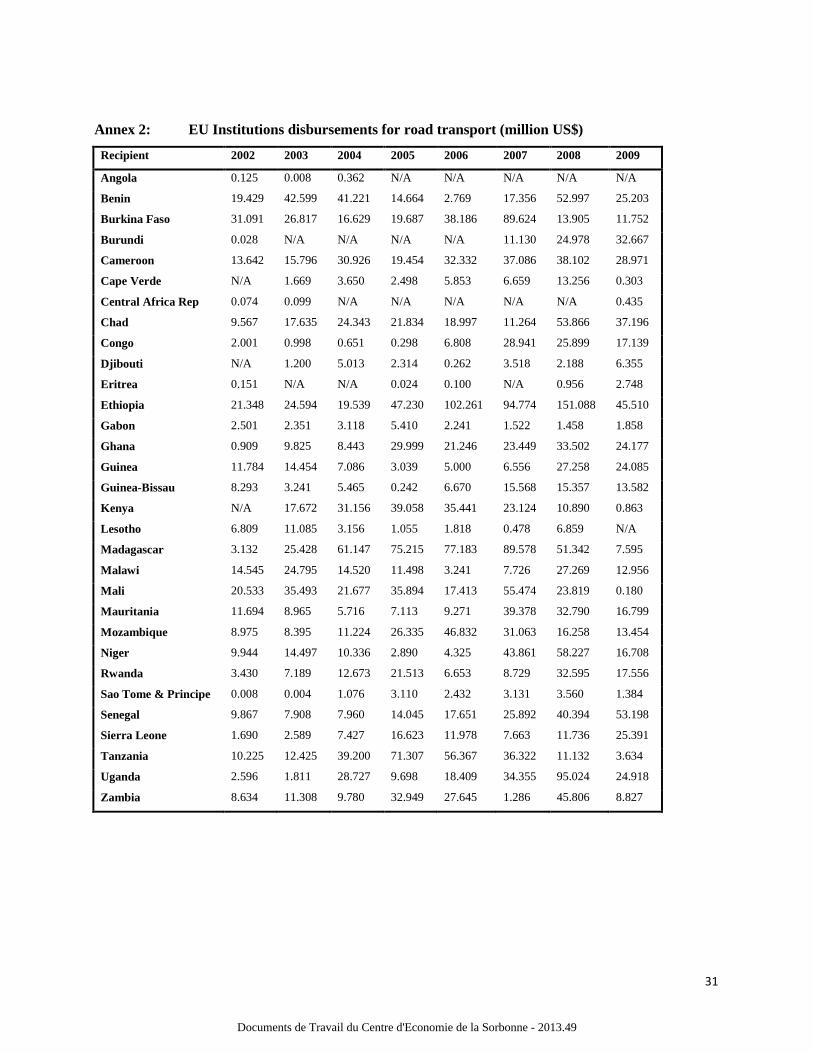
Investing in SSA’s roads infrastructure is one of the priorities of donors6. Table 2 below presents
the percentages of aid amounts disbursed by donors in the total spending of the country, computed for
those countries for which expenditure data was available from the IRF. On average aid accounts for about
20% in the total spending but it varies a lot across countries.
Table2: Aid disbursements in total expenditures, by country
Total Expenditure(*)
million US$
Total aid (**)
million US$
Aid/Expenditure (%)
Burkina Faso (2008) 260.96 23.9 9.15
Cameroon (2007) 527.39 71.1 13.5
Ethiopia (2003) 106.19 106.65 100
Ghana (2003; 2004; 2005) 123.1; 198.9; 257.4 69.94; 95; 149.4 56.8; 47.8; 58
Tanzania (2008) 356.94 112.42 31.5
Zambia (2005) 264.3 53.91 20.4
Source: World Road Statistics for expenditure data and OECD-DAC for aid data. Note: (*) includes maintenance and construction expenditures. (**) includes DAC, EU Institutions and IDA disbursements.
As the figures presented above show, spending seems to be not an issue in the road sector. More
than the issue of missing links, the problem of poor road maintenance mainly due to a capital bias seems
to be at work here. Insufficient maintenance translates into substantial additional costs, as rehabilitation
costs are several times higher than the cumulative costs of sound preventive maintenance. The issue is
well-known since the end of the 1980s (Harral et Faiz, 1988), and was re-emphasized regularly for
instance by the World Bank Development Report in 1994. According to the World Bank (2010)
addressing under-maintenance in the road sector could save about $1.9 billion a year in rehabilitation.
Road quality and costs
Substantial variations across countries in the region also exist with regard to the quality of roads.
According to Gwilliam et al. (2008) about half of the main network is in good condition, and an
additional one-third is in fair condition. For rural networks only about a quarter is in good condition and a
quarter in fair condition. Also, Carruthers et al. (2009) report that only 30% of the road network linked to
6 Tables in the Annex 1,2 and 3 show aid disbursements over the period 2002-2009 from DAC members, EU
Institutions and IDA.
Documents de Travail du Centre d'Economie de la Sorbonne - 2013.49

9
regional connectivity is currently in good condition. Large variations across countries can be related to
some extents to differences in GDP, or geographic and topographic conditions. But the quality of the
institutional and financing framework of the road sector is the main determinant of these differences.7
According to Alexeeva et al. (2008), the average cost of the road works are quite similar, except
for Kenya where the rehabilitation and reconstruction cost is particularly high , 955,755 US$/km (see
Table 3). The periodic maintenance works in Mozambique cost twice as high as in Zambia.
Table 3: Average cost per km of a 2-lane road by type of work8 and type of road
9 (2007US$/km)
Rehabilitation & construction Re-gravel Upgrade to paved Periodic
maintenance
Country Inter-urban Urban Inter-urban Inter-urban Rural Inter-urban
Congo 68,094
Congo (DRC) 228,872 65,750
Ethiopia 388,207 322,373
Ghana 261,052 114,566
Kenya 955,755
Mozambique 278,661 197,086
Madagascar 54,602 104,992
Malawi 420,838 56,874
Nigeria 329,909 1,505,480
Tanzania 348,209
Uganda 420,220
Zambia 25,005 87,946
Source: Queiroz et al. (2008).
Institutional development
According to Bruschett (2005), about 45 billion US$ of road stock was wasted during the 1970s
and 1980s as a consequence of inadequate maintenance, which could have been avoided if about only $12
billion would have been spent on preventive maintenance. The common belief that emerged at that time
was that Africa suffers from an under financing of maintenance expenditures, considered mainly as an
institutional problem (OECD/ ECMT, 2007).
The first generation of earmarked road funds in Africa appeared in the late 1980s10
as a solution.
They were based on earmarking of fuel taxes as opposed to the previous financing mode through the
general budget. However, the issue of inadequate maintenance remained and in the early 1990s
7 See the next subsection on the institutional development of the African road sector.
8 Rehabilitation/reconstruction, upgrade to paved, re-gravel, and periodic maintenance.
9 Inter-urban, urban and rural access.
10 Even some such arrangements date back to the 1930s.
Documents de Travail du Centre d'Economie de la Sorbonne - 2013.49
10
development partners and governments of SSA recognized the need to set up new reforms. This was given
concrete expression through the Road Maintenance Initiative (RMI) for SSA countries. The RMI aimed at
increasing road sector’s efficiency through establishing autonomous road agencies with an effective
structure and clearly defined responsibilities, and creating Road Maintenance Funds financed by road
users charges and managed by a Roads Board (with members from both public and private sectors). This
also marked the emergence of the second generation of road funds based on seven design features: (1) a
clear legal basis to protect against political interference11
; (2) creation of road agencies for public works
execution to allow the separation between funding and implementation12
; (3) road user charges in form of
fuel levies13
; (4) funds directly transferred to the road fund to avoid the risk of diverting resources for
financing other public expenditures revenues14
; (5) users represented in the road fund board to ensure
accountability15
; (6) clear rules for the allocation of revenue to reduce discretion16
; (7) independent
auditing and public reporting of road fund activities to insure accountability17
.
Despite these reforms and clear objectives, the progress has been slow; some inefficient practices
still prevail, and a lot of funds are still used for rehabilitation work.
What are the underlying strategies behind roads investments?
Roads investments in Africa are based on two key hypothetical assumptions:
1. Investments in roads always generate traffic and reduce poverty,
2. Roads in good condition produce large economic benefits in any instance.
The ineluctability underlying character of these assumptions biases the vision toward extremely large
expected benefits leading to the idea that road network expansion would be largely compensated by the
created benefits. Consequently, roads infrastructure costs are usually overlooked and there is hardly any
analysis of the fiscal sustainability of the projects.
In terms of preferences, governments tend to favor (without necessarily acknowledging it):
11
60% of countries with a road fund have such legislation. 12
65% of road funds have autonomous roads agencies responsible for project implementation, but the level of
autonomy varies from limited to full responsibility. 13
For 80% of the countries, they vary between $0.03 per liter in Lesotho to $0.16 per liter in Tanzania. 14
Only a little more than 50% of the countries with a road fund channel at least 75% of the fuel levies directly to the
fund without passing through the budget. 15
Only half of roads funds boards are not dominated by a government representation; very few have a chairman
from the private sector. 16
60% of the roads funds have defined explicit rules for allocating funds. 17
Around 80% of the countries with road funds have annual auditing procedures in place but their quality should be
taken with caution.
Documents de Travail du Centre d'Economie de la Sorbonne - 2013.49

11
1. Rehabilitation over maintenance: Gwilliam et al. (2008) highlights what they call a “donor
paradox”: while many reports have demonstrated the importance of maintaining roads in good
condition and road sector reforms have focused on maintenance in Sub-Saharan Africa, this
sector is still dominated by rehabilitation, leaving maintenance as a secondary priority. It is
even more problematic since most countries can hardly afford to maintain their current road
network and worsen the situation by further spending on upgrading and rehabilitation
2. Trunks over rural roads: Despite the fact that rural road network typically accounts for
more than half of the transport network in developing countries, and, despite numerous
political statements, investments in rural roads is marginal compared to trunk roads. This may
be explained by the complexity of those investments and low returns in some cases.18
Furthermore, the strategies behind roads investments can be characterized with (excessive) generalization
by lack of/limited prioritization of investments, uniqueness of technical solutions, and a mismatch
between the needs and the returns on investments due to an equally distributed budget for rural roads
regardless the variations among regions.
The current pattern of road investments excessively relies on assumptions (or beliefs) and is
scarcely based on reality (i.e. data and facts). The following section synthesizes the most common
assumptions on the African roads sector that could be qualified rather as “myths” as most often they do
not hold. For each misperception, we present the common belief, the factual reality and open the
discussion on possible policy recommendations.
4. The Main Possible “Myths”
What happens en route and at borders: transport delay and bribes
The first common belief is that most transport delay happen en route and/or at the borders to the
hinterland. Arvis et al. (2010) demonstrates that for land transport to landlocked countries in SSA over
50% of total transport time from port to hinterland cities are spent in ports. So contrary to what is usually
perceived, delays on roads and at borders are in most cases marginal compared to cargo dwell time in
ports (see Table 4 for the evidence along selected corridors).
18
As it will be demonstrated in the next section, the benefits of rural roads are often expected to be higher than they
really are.
Documents de Travail du Centre d'Economie de la Sorbonne - 2013.49

12
Table 4: Average transport time breakdown between ports and hinterland along selected corridors in 2008
in days Port Trans Dry port Border Transp. Clear. TOTAL
Douala-Ndj 24 4 8 3 39
MSA-Kam 13 4 1 1 2 21
DeS - Kam 17 5 2 1 2 27
Source: Arvis et al. (2010). Note: Douala-Ndj=Douala-N’djaména, MSA-Kam=Mombsa-Kampala, DeS-Kam=Dar-es-Salaam-Kampala. Trans is land
transport time, clearance= clearance time at destination.
However, in Southern Africa, border-crossing time is of critical importance.19
The advocated
solution is the adoption of a one-stop border post (OSBP). Conceptually, this model is based on the idea
that by removing one control, border-crossing time would be halved. However, customs clearance is
scarcely done for exports at the border. Moreover, large investments are scarcely needed. Curtis (2009)
advocated for: (1) simplified and reduced clearance procedures and (2) an effective border management
institution gathering major stakeholders from both sides of the border in order to reduce the number of
controls and agencies involved. Simplifying import clearance procedures is critical because at most,
export controls account for less than a third of total border crossing time and customs account usually for
half of import time20
. Therefore, even though export control time would be divided by half, one sixth of
total time would be gained. Hence, if customs clearance time would be halved, one third of total time
would be gained.
A second belief is that bribes en route mainly explain high transport costs. Teravaninthorn
and Raballand. (2008) demonstrated that the cost of fuel is actually the main source of variable costs (see
Table 5). Rents and bribes to logistics providers are actually much higher than bribes en route but they are
much less visible so that they are not given the same attention (Arvis et al. 2010).
19
In 2008, it took 39 hours for a truck to transit northbound through Chirundu and 14 hours southbound (compared
to 34 hours and 11 hours respectively for Beitbridge). The first OSBP was thus opened at Chirundu (between
Zimbabwe and Zambia) in December 2009. So far it seems relatively premature to assess if this OSBP produced the
expected results, especially in terms of simplified and reduced clearance procedures Still, one-stop border posts are
presently mushrooming in SSA. 20
It is interesting to note that idle time for northbound transit is much higher than might be expected. It is on average
10.9 hours per transit, the main reasons being: (i) not handling documents on arrival, (ii) not crossing the border
when able to do so, (iii) waiting at the border after clearance and before departing for the destination or (iv) carrying
out activities (own business or social) when supposed to be on duty. Southbound delays are much less (ZRA – 5.6
hours, driver idle time – 4.4 hours), but still drivers do waste time (Curtis 2009).
Documents de Travail du Centre d'Economie de la Sorbonne - 2013.49

13
Table 5: Variable costs breakdown in the four sub-regions (in percentage of total variable costs)
Source: Teravaninthorn et al (2008)
Road expansion
The common misperception concerning road coverage is that it is insufficient, especially in rural
areas where there is a need to expand the network so as to ensure connectivity of citizens in these areas at
less than 2 kilometers from a road. In reality, this is a more complex issue.
First, the 2 km buffer (which is the main target for donors in SSA to improve road accessibility of
rural population) does not seem to be an economic threshold. Increased rural road density has a positive
impact on incomes but not the 2 km buffer. Using original household data in three countries, Raballand et
al. (2010) found out that being at more or less than 2 km is not a major determinant for poverty.
Therefore, some minimal road access is needed to impact income generation economically but investing
to have rural population at less than 2 km may be considered as overinvestment.21
Actually, most rural
households are located at less than 5 kilometres from a road (even though they are not necessarily all-
weather). Continent-wide, road access at less than 5 km does exist for a large part of the population:
almost 60% of the population is situated at least at 5 km from a regional or national road when using GIS
data (see Table 6).
21
This finding is consistent with World Bank (2009.2). This research centered on Malawi finds out that the optimal
transport time for higher agricultural growth is 2.2 hours. Assuming walking or bicycle at 4 kilometers per hour, the
optimal transport distance for agricultural production from a road would then be over 8 kilometers (from an
economic point of view).
Corridor Route
Gateway-Destination Fuel Tyres Maintenance Bribes
West Africa Tema/Accra-Ouagadougou 74% 16% 4% 6%
Tema/Accra-Bamako 80% 9% 5% 6%
Central Africa
Douala-N’Djaména 60% 17% 10% 13%
Douala-Bangui 60% 19% 9% 12%
Ngaounderé-N’Djaména 53% 11% 14% 22%
Ngaoundéré-Moundou 38% 12% 23% 27%
East Africa Mombasa-Kampala 79% 13% 6% 2%
Kampala-Kigali 67% 31% 1% 1%
Southern Africa Lusaka-Johannesburg 51% 48% 1% 0%
Lusaka-Dar-es-Salaam 60% 38% 1% 1%
Documents de Travail du Centre d'Economie de la Sorbonne - 2013.49

14
Table 6: Sub-Saharan Africa road coverage
Population covered (in thousands) Percentage of population
Percentage of
covered population
Buffer Urban Rural Total Urban Rural Total Urban Rural
2 km 103,063 30,106 133,169 59.5% 17.2% 38.2% 77.4% 22.6%
5 km 144,074 56,721 200,796 83.1% 32.4% 57.6% 71.8% 28.2%
10 km 160,836 90,004 250,840 92.8% 51.4% 72.0% 64.1% 35.9%
Source: Raballand et al. (2010).
Second, it is usually assumed that despite increased size of roads networks, they remain sustainable as
their expected benefits should exceed their costs. However, many SSA countries already face the issue of
unsustainable road networks and may also explain why maintenance is not ensured for parts of the
network. As an example, the annual cost of maintaining the paved and unpaved networks is estimated at
USD 106.5 million and USD 133.3 million respectively in 2011 prices in Zambia. Maintenance
expenditure should be fully financed from the fuel levy and road user charges. However, despite recent
increases, their combined value was still only equivalent to USD 112 million in 2010, which is barely
sufficient to maintain the paved network and leaves over negligible funds for the unpaved network
(Raballand et al. 2011.2).
Third, road access does not necessarily mean accessing to transport. Raballand et al. (2011) draws
lessons from an original randomized experiment in rural Malawi. They show that without subsidies, a
road even in fair condition may continue to be used by non motorized means of transport. So, the presence
of a road with a relevant level of quality is not the only solution to connectivity, the provision of transport
services must be under scrutiny as well.22
This can partly explain why walking or cycling is so widespread
on most rural roads in Sub-Saharan Africa and why a road in good condition will most probably not lead
to provision of service at an affordable price for the local population.
Finally, because of limited plot size that binds production volumes, most African farmers in rural
areas have only a minimal transport requirement, generally too low to fully load a truck. Intermediate
Means of Transport (IMTs) and the appropriate (not paved) road infrastructure should often be preferred
over truck transport, as the volumes to be transported are generally limited and the distances are relatively
short. For instance, Sieber (1999) demonstrated in Tanzania that adequate IMTs coupled with pathways
could have, in some cases, more economic impact than rehabilitating secondary roads alone. The "last
mile should not be a road for truck" (Raballand et al, 2010).
22
Evidence also exists on the fact that roads do not automatically generate efficient transport services in the case of
international corridors (Teravaninthorn et al, 2008).
Documents de Travail du Centre d'Economie de la Sorbonne - 2013.49

15
Road Condition
The misperception about insufficient road coverage and the related fiscal sustainability issue open
the common belief that road condition in Africa is usually bad (especially on the major corridors), while
improved road condition is believed to cut maintenance costs and user prices.
In reality, road condition on major corridor is not as bad as expected (see Table 7). Road
conditions are worse in Central Africa comparing to the other sub-regions, but they are in a relatively
good condition. This can be explained by massive recurrent investments in SSA along these corridors.
Table 7: Roads condition along the main international corridors in Sub-Saharan Africa
Source: Teravaninthorn et al. (2008).
Moreover, the causal chain from improving road condition to an ineluctable poverty reduction and
increase in trade (see Figure 4) is not that straightforward.
Figure 4: The causal chain of road investments
Source: authors’ representation.
Documents de Travail du Centre d'Economie de la Sorbonne - 2013.49

16
For each of the three links/arrows in the chain, several factors make the relation between road
condition, Vehicle Operating Costs (VOC)23
, transport prices and poverty reduction/growth in the African
context complex.
First, vehicle operating costs are more reduced if trucking fleet is new and when roads are in poor
condition (compared to fair), which means that rehabilitating a corridor in fair condition will probably
have less impact than rehabilitating a corridor in poor condition, a common practice however in some
countries.
Second, reduced transport prices depend mainly on the market structure of the industry. While
transport costs are not necessarily higher in SSA than in many other parts of the world (see Table 8),
transport prices are instead the highest in the world along international transport prices (see Table 9). It
appears clearly that in SSA there is not an issue of costs but rather of profits, due in particular to profit
markups and cartelization.
Also, while the focus has been for decades on improving regional integration to decrease transport
prices through the signing of regional agreements and regional roads investments, without integration of
trucking services24
, reduction of transport prices is not likely to be achieved.
Table 8: Transport costs in several countries/regions of the world (2007)
Source: Teravaninthorn and Raballand (2008).
23
In Sub-Saharan Africa, poor roads are perceived as being the main cause of high variable operating costs, since
they increase fuel consumption, increase maintenance costs by damaging the vehicles, reducing the life of tires,
reducing vehicle utilization because of lower speeds, and reducing the life of trucks. Results from Teravaninthorn
and Raballand (2008) with HDM-4 (Highway Development Model) simulations show a mixed result: in two African
sub-regions (West and Central), where traffic is low and the truck fleets are old, as long as international corridor
routes are paved in a fair condition, road condition does not emerge as a major hindrance to transport efficiency. On
the contrary, in Eastern Africa, on the main trade corridors, improving road condition would have a significant
impact in reducing transport costs, even if the roads are in fair condition. But these cases are limited to a few
corridor routes. 24
See Raballand et al. (2008) for an overview of the various measures important for integration of trucking services.
Documents de Travail du Centre d'Economie de la Sorbonne - 2013.49

17
Table 9: Transport prices in several countries/regions of the world (2007)
Source: Teravaninthorn and Raballand (2008).
Finally, the impact on growth and poverty reduction depends on the share of transport costs and
the role of the transport constraint. If transport accounts for approximately 10% of input costs, reducing
transport prices by 50% may not necessarily create a breakthrough in competitiveness of the products. It
can be different if this ratio is close to 30% (which is more unlikely). Based on more systematic trucking
surveys and data collection, especially along the main international corridors, recent research have
demonstrated that infrastructure is only one factor in the production function of a transporter. Transport
services prices largely depend on market structure/regulation and thickness of markets and therefore, in
many cases in SSA, investments in infrastructure will not lead to reduced transport prices25
.
Governance
The previous subsection underlines the governance issue in the transport market that is
characterized by cartelization. Here we demonstrate that the entire African road sector suffers from
institutional weaknesses in particular its political economy, despite statements and incentives to reform it.
A related misperception concerns the idea that construction costs are the highest in SSA and will
continue to be high because of low volumes and the geography of the continent. Construction costs are
indeed high in SSA26
, compared to work costs in other parts of the world. Even though low volumes,
geography and distance to import construction play a role, governance in the construction sector seem to
also explain the high level of construction costs. In Tanzania the impact is up to 60% (Messick, 2011); the
25
Most developments below are explained in details in Teravanithorn and Raballand (2008). 26
Even though there is no systematic record and publication of such data. This assumption is rather based on
anecdotal evidence.
Documents de Travail du Centre d'Economie de la Sorbonne - 2013.49
18
Kenyan Roads Authority and the Kenyan Anticorruption Commission (Government of Kenya 2007)
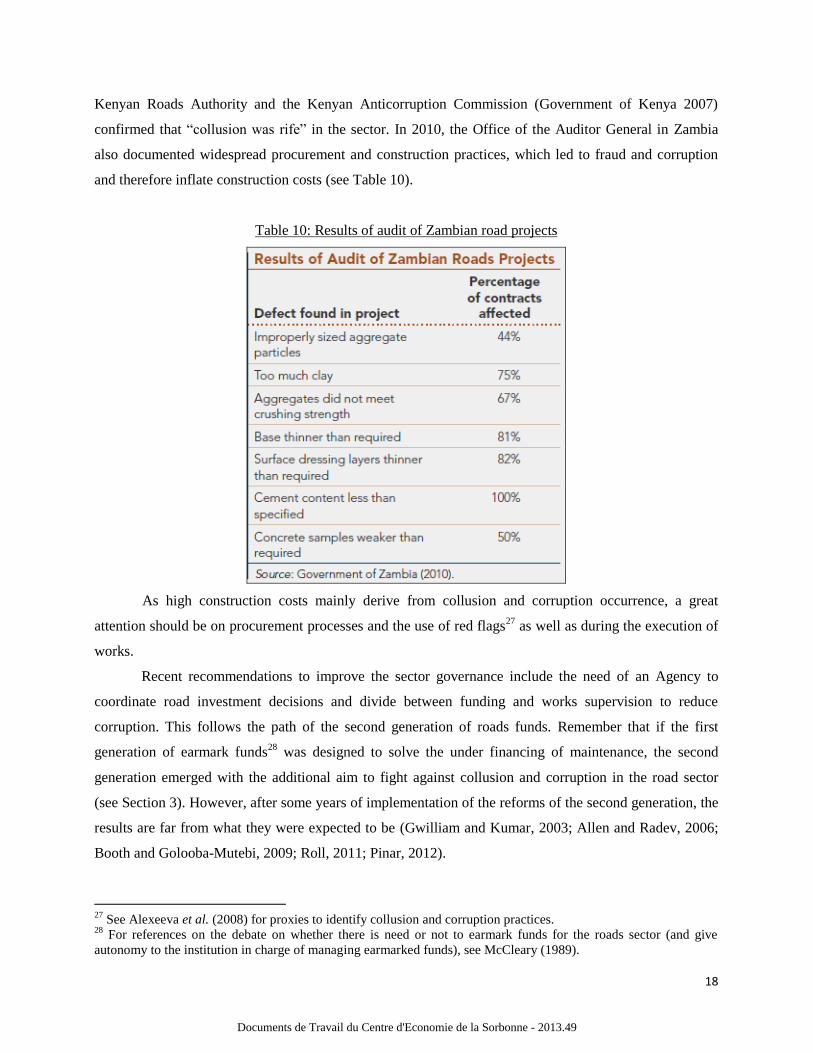
confirmed that “collusion was rife” in the sector. In 2010, the Office of the Auditor General in Zambia
also documented widespread procurement and construction practices, which led to fraud and corruption
and therefore inflate construction costs (see Table 10).
Table 10: Results of audit of Zambian road projects
As high construction costs mainly derive from collusion and corruption occurrence, a great
attention should be on procurement processes and the use of red flags27
as well as during the execution of
works.
Recent recommendations to improve the sector governance include the need of an Agency to
coordinate road investment decisions and divide between funding and works supervision to reduce
corruption. This follows the path of the second generation of roads funds. Remember that if the first
generation of earmark funds28
was designed to solve the under financing of maintenance, the second
generation emerged with the additional aim to fight against collusion and corruption in the road sector
(see Section 3). However, after some years of implementation of the reforms of the second generation, the
results are far from what they were expected to be (Gwilliam and Kumar, 2003; Allen and Radev, 2006;
Booth and Golooba-Mutebi, 2009; Roll, 2011; Pinar, 2012).
27
See Alexeeva et al. (2008) for proxies to identify collusion and corruption practices. 28
For references on the debate on whether there is need or not to earmark funds for the roads sector (and give
autonomy to the institution in charge of managing earmarked funds), see McCleary (1989).
Documents de Travail du Centre d'Economie de la Sorbonne - 2013.49

19
Being an issue of people or not, the managements of these agencies have found difficulties to
work closely together, and this induced coordination costs for projects implementation. More importantly,
boards do not seem to have been able to deter/fight political interference in projects selection or projects
supervision (like pointed out in road audits in Zambia for instance). In a weak capacity environment, there
may not be a large enough pool of talents to manage several different agencies. Finally, one of the most
important shortcomings of this institutional setup seems to have been the increased lack of accountability
of civil servants working in this sector. Due to its potential complexity, it is relatively easy for road fund
staff or road development agency staff to blame the other agency or the Ministry of Works and Supply.
5. What does it mean for the future?
Change strategy to better prioritization
Roads prioritization is usually done by default after having allocated funding to highly visible
projects without taking into account their impact on maintenance and on the sustainability of the network.
However, prioritization should depend on the remaining budget after the difference between the budget
allocation and the maintenance needs. After having estimated the maintenance needs of the main road
network and the sustainability of the current network, the possible allocation for rehabilitation should be
computed (taking into account public investment management and construction costs trends).
Based on that, a level of service for each economic class of roads needs to be defined (and
requires various technological solutions). Due to the fact that some parts of the road network may
probably not be rehabilitated, based on objective criteria (such as traffic volumes), different classes of
roads should be defined.
Moreover, taking into account the service factor it is crucial since the relationship between
infrastructure and transport prices is unlikely to be automatic in most parts of SSA.
With regard to rural roads, the current investment strategies are largely ineffective and do not
consider agriculture potential. Therefore, it is important to redefine the rural access index, focus more on
the missing middle and better coordinate interventions, and finally monitor allocation to road
maintenance. Although social criteria are important for road planning and will continue to play a major
role, economic criteria should be given more weight in order to make investments in road network more
sustainable (see Box 1 for an example of how would look like a revised road planning strategy)29
.
29
In this regard, a ‘hub and spoke’ concept, as defined by Starkey (2007) with conventional trucks transporting on
conventionally engineered all weather roads (to district/secondary towns), and IMTs feeding agricultural surpluses to
collection points on basic access routes.
Documents de Travail du Centre d'Economie de la Sorbonne - 2013.49

20
Box 1: How Could Look Like a Revised Road Planning Strategy Compared to the Current Situation?
Today, road allocation in secondary/rural roads is usually a function of three factors: (i) regional network length, (ii)
the most urgent needs, (iii) political goals (which partially explains why funding is usually spread out and the most
vocal or best connected MPs get the highest allocation in their region). Because of that, there is no strategic road
planning; departments in charge of rural roads act when an emergency occurs or when political pressure become
excessive. A revised road planning strategy would be based on objective data about (i) regional potential and current
agricultural value, (ii) geo-referenced road networks with information on road condition and on problematic spots.
Investment needs would be recomputed at the regional/local level. Based on this, some major investments would be
carried out in priority in the most economically dense regions (mainly on the secondary and tertiary network). Due to
budget constraints, some parts of the network would not be maintained and network expansion would not be sought,
except on exceptional basis. The last mile would be the mandate of the Ministry of Agriculture or of local authorities
and would be designed for IMTs only. This is the approach, which was adopted in Finland with the definition of
level of service targets and a classification of roads per order of priority, per climatic conditions and traffic levels ;
some roads benefiting from virtually 0 allocation and some from massive investments due to their “economic and
strategic” value (see Isotalo 1995 for more details, especially annex 5).
Source: Raballand et al. (2010).
With this end in view, a decision tree on planning decisions in the road sector can be drawn (see Figure
5)30
.
30
There would be a need to research IMT options and costing of animal/animal cart/bicycle trailer/motorcycle trailer
/single axle tractor/two axle tractor/locally assembled small trucks, as these may be low cost options in some areas.
Documents de Travail du Centre d'Economie de la Sorbonne - 2013.49

21
Figure 5: A decision-tree on planning decisions in the road sector
Source: Raballand et al. (2010).
Finally, it is becoming increasingly important to support the use of country-specific trucking data
in the economic analysis and design of road maintenance strategies. Country-specific trucking data are
sparse in SSA. As a result, generic data with many theoretical assumptions are used in model simulations.
Data from trucking surveys could greatly improve the quality of the analysis and lead to more realistic
results. One example is the need to introduce in the models the actual purchase price of the trucks, since in
West and Central Africa these are often bought second-hand, instead of using the price of new trucks.
Using actual data would lead to different results, in particular reducing the possibility of overinvestment
due to overestimation of investment benefits. If the investment analysis were done properly with realistic
data, higher traffic levels might be needed to justify road improvements in some cases.
Also, some research/experiment should be carried out to enable basic access, especially in rural
areas. Indeed, narrow roads or strip roads with either a – earth standard, b – half width paved <1,5m>, c –
full width paved <3.0m> are usually suitable for IMTs and would reduce construction costs (since there is
an economic viability problem in most cases). For instance, a narrow concrete road is sufficient to allow
two loaded motorcycles to pass safely31
; single track routes with off-pavement passing on robust
shoulders for empty vehicles is also another option. Technical options should be much more differentiated
31
Basic access interventions are defined as the least-cost investments which provide a minimum level of all-season
passability. In a majority of cases, this means single-lane, spot-improved earth or gravel roads. In situations where
motorized basic access is not affordable, improvement of the existing path network and the construction of
footbridges may be the only alternative. Therefore the basic access approach should only employ the most
appropriate and cost-effective interventions.
Documents de Travail du Centre d'Economie de la Sorbonne - 2013.49
22
than what happens now since in many cases, there is an overinvestment in some communities and
underinvestment in others.
Reduce unit costs by better monitoring procurement and supervision of works
As emphasized previously, corruption and collusion with contractors has led to increased
construction costs. Therefore, in order to improve value for money of road investment projects, it is high
time to start to reduce corruption occurrence in road projects in SSA. This is obviously a difficult task.
However, several instruments have been recently developed.
The first actual instrument advocated to reduce corruption and collusion is to carry out of
contract disclosure to the public. It is demonstrated that generating information through regular
publication, audits or frequent review of unit costs is important for the public in order to flag some
obvious irregularities related to work projects. This is increasingly strengthened in many SSA countries.
For instance, the Construction Sector Transparency Initiative (COST)32
focuses on the importance of
contract disclosure to the public to strengthen monitoring of road projects procurement. Kenny (2011)
emphasizes that transparency and oversight are potentially powerful tools (and cheap) to reduce the
development impact of corruption and advocates regular publication of contract and implementation
details. This should (i) reduce legal costs of contracting; and (ii) help spread best practices and ease the
process of learning lessons from failed approaches. However, due to legal reasons, it is difficult to provide
the public with all the details regarding bidding prices. Besides, disclosure does not necessarily translate
into better governance, unless a demand for accountability (Castalia, 2009.2). Non-state actors are also
increasingly interested in “procurement watch” initiatives and strive to monitor more closely procurement
processes in countries like Kenya or South Africa.
A second proposition is to develop community monitoring as a sort of compulsory requirement
to improve governance in road contracts implementation. Increasing transparency depends critically on
the community capacity for oversight33
, and the supply-side willingness to redress the problems. But
community cannot be conceived as a substitute for formal, professional audit and inspection functions
(Castalia, 2009.3). The reducing corruption impact of community monitoring has not yet been definitively
quantified (Castalia, 2009.3). The evidence of the Kecamatan Development Program in Indonesia
suggests that its success is very much contingent on contextual factors and a combination of other
32
Http://www.constructiontransparency.org/. Four pilot countries were from SSA: Ethiopia, Malawi, Tanzania and
Zambia. 33
Although oversight can bring many benefits in terms of improving value for money and probity in the construction
industry, it may have some limitations, such as adding costs (the overseer may become another bribe-demanding
agent or may not have enough leeway to operate).
Documents de Travail du Centre d'Economie de la Sorbonne - 2013.49

23
monitoring and audit activities (Olken 2007). These contextual factors may be determined early on in the
project cycle, leaving little scope for a community oversight impact on corruption (Castalia, 2009.3).
Finally, conducting post-evaluation of projects selected randomly should be encouraged as
recommended in Estache et al. (2010).
6. Conclusions and directions for future research
This paper presents data on investments in road infrastructure in Sub-Saharan Africa over the last
decades. It demonstrates how research findings in this area question most of the current countries’
strategies and recommends some changes to improve the developmental impact of roads investments.
Better data collection and updated knowledge in transport in the recent years call for the need to adjust
some of the assumptions (that should be qualified rather as “myths”) on which donor interventions have
been based in SSA for years so that the waste of aid financing is the sector stops.
Despite evidence, several countries do not seem ready to amend their investments strategy mainly
due to the political economy of the sector in favor of status quo. As highlighted by Benitez et al. (2010)
four main power- and money-seeking motivations may explain the inertia in this sector: (i) populism: a
strong eagerness to be reelected, whatever it takes; (ii) patronage: efforts to maintain power by an elite, a
form of “club leadership”; (iii) an overly strong industry-friendliness, for currying future positions in the
industry, for example; and (iv) corruption: the quest for money—personal benefits that the politician
wants to keep secret.
To be comprehensive, donors’ incentive framework should probably be amended: there should be
greater emphasis on projects impact instead of disbursement. In this regard, documenting
failures/successes and demonstrate how current strategies may have a perverse effect is essential.
In any case, suggesting changes is not without challenges since adjustments make more complex
the design and implementation of projects. Yet, if changes are not implemented, in several years from
now, there could be a backlash against infrastructure projects like it happened at the end of the 80’s.
Finally, investigations should be developed in this area addressing several key questions for
which answers are not straightforward, such as:
- How technically is possible to maintain a core network in fair condition?
- Is splitting responsibilities between various agencies (funding and implementation) useful?
- Does an independent road agency insulate from political interference?
- What should be the incentives to differentiate allocation per districts for roads/secondary
network?
Documents de Travail du Centre d'Economie de la Sorbonne - 2013.49

24
Without trying to address these questions, investments in road projects could lead to the same
questioning of projects in the 2010s as in the 1980s when the excepted development impact of road hardly
materialize on the ground despite massive investments.
Documents de Travail du Centre d'Economie de la Sorbonne - 2013.49

25
References
AFBD (2000), AfDB / United Nations Economic Commission for Africa. Review of the
Implementation Status of the Trans-African Highways and the Missing Links. Volume 2.
Alexeeva, V., Padam, G. and Queiroz, C. (2008), “Monitoring Road Works Contracts and Unit
Costs for Enhanced Governance in Sub-Saharan Africa”, World Bank Transport Paper 21, Washington
DC: The World Bank, available at:
http://siteresources.worldbank.org/INTTRANSPORT/Resources/336291-1227561426235/5611053-
1229359963828/tp_21.pdf.
Allen, Richard and Radev, D. (2006), “Managing and Controlling Extrabudgetary Funds”, IMF
WP/06/286, Washington: IMF.
Arvis, Jean-François, Raballand, Gael and Jean-François Marteau (2010), The Cost of Being
Landlocked. Washington, DC: World Bank.
Atack, J., Bateman, F., Haines, M. and R.A. Margo (2009), "Did Railroads Induce or Follow
Economic Growth? Urbanization and Population Growth in the American Midwest, 1850-1860", NBER
Working Papers 14640.
Banerjee, A., Duflo, E. and N. Qian (2012), "On the Road: Access to Transportation
Infrastructure and Economic Growth in China", MIT Department of Economics Working Paper No. 12-
06.
Barrett, C. B., T. Reardon, and P. Webb (2001), "Nonfarm Income Diversification and Household
Livelihood Strategies in Rural Africa: Concepts, Dynamics, and Policy Implications." Food Policy, 26,
315-331.
Benitez, D., Estache, A. and Soreide, T. (2010),”Dealing with Politics for Money and Power in
Infrastructure”, ECARES working paper 2010‐031, Brussels: Université Libre de Bruxelles.
Block, S., and P. Webb (2001), "The dynamics of livelihoods diversification in post-famine
Ethiopia", Food Policy, 26, 333-350.
Booth, David and Golooba-Mutebi, Frederick (2009), “The Political Economy of Roads Reform
in Uganda”, ODI Working Paper 307.
Bruschett, S. (2005), ”Management and Finance of Roads in Africa”, SSATP Discussion Paper
No.4, Road Management and Financing – RMF Series, Washington DC: The World Bank.
Carruthers, R. and R. R. Krishnamani, S. Murray and N. Pushak (2009), “Improving
Connectivity: Investing in Transport Infrastructure in Sub-Saharan Africa”, Background Paper 7, Africa
Infrastructure Country Diagnostic, Washington DC: The World Bank.
Documents de Travail du Centre d'Economie de la Sorbonne - 2013.49

26
Castaing Gachassin, Marie (2013), “Roads and Poverty: A Meta-Analysis of the Micro Relation”,
working paper available at https://sites.google.com/site/mariecastainggachassin/home/papers.
Castalia (2009.1), “Understanding, Measuring, and Stopping Corruption in Construction”,
Working Paper 1, available at: http://www.constructiontransparency.org/view/document.shtml?n52983-
igmvyhb.
Castalia (2009.2), “How Expert Third Party Oversight of Public Construction Projects can
Increase Value for Money and Fight Corruption”, Working Paper 3, available at:
www.constructiontransparency.org/view/document.shtml?s24878-afzlatm.
Castalia (2009.3), “Community Oversight of Construction -- A Review and Toolkit”, Working
Paper 4, available at: www.constructiontransparency.org/view/document.shtml?x67627-zgivxgg.
Curtis, B. (2009), “The Chirundu Border-Post”, SSATP Discussion Paper 10.
Dercon, S., Gilligan, D.O., Hoddinott,J. and T. Woldehanna, (2009), "The Impact of Agricultural
Extension and Roads on Poverty and Consumption growth in 15 Ethiopian Villages", American Journal
Agriculture Economics, 91(4), 1007-1021.
Dercon, S., Hoddinott, J. and T. Woldehanna (2011), "Growth and chronic poverty: Evidence
from rural communities in Ethiopia", CSAE Working Paper WPS/2011 18.
Donaldson, D. (2010), "Railroads of the Raj: Estimating the Impact of Transportation
Infrastructure", MIT Working Papers.
Estache, A. (2010), “A Survey of Impact Evaluations of Infrastructure Projects, Programs and
Policies”, ECARES working paper 2010‐005, Brussels: Université Libre de Bruxelles.
Gannon, C., and Z. Liu. (1997). “Poverty and transport.” TWU discussion paper 30, World Bank,
Washington, DC.
Gibson, J. and S. Rozelle (2003), "Poverty and Access to Roads in Papua New Guinea",
Economic Development and Cultural Change, 52 (1), 159-185.
Gräb, J. and Grimm, M., (2008), “Spatial Inequalities Explained – Evidence from Burkina Faso”,
DIW Discussion Paper 843.
Gollin, D. and R. Rogerson (2010), "Agriculture, Roads, and Economic Development in Uganda,"
NBER Working Papers 15863, National Bureau of Economic Research, Inc.
Government of Kenya - Kenya Anti-Corruption Commission (2007), Examination Report into the
Systems, Policies, Procedures and Practices of the Road Sub-Sector, available at:
http://www.kacc.go.ke/DOCS/ROAD-EXAMINATION-REPORT.pdf
Government of Zambia (2010), Report of the Auditor General on the Road Development Agency
for the period January 2006 to September 2009, Lusaka: OAG, available at:
www.scribd.com/doc/33544699/2006-2009-Auditor-General-Report-on-Roads-Development-Agency
Documents de Travail du Centre d'Economie de la Sorbonne - 2013.49

27
Gwilliam, K. and Kumar, A. (2003), “How Effective are Second-Generation Road Funds? A
Preliminary Appraisal”, The World Bank Research Observer, 18, 1, pp.113-128.
Gwilliam, K., V. Foster, R. Archondo- Callao, C. Briceño-Garmendia, A. Nogales, and K. Sethi.
(2008), “The Burden of Maintenance: Roads in Sub-Saharan Africa.” Background Paper 14, Africa
Infrastructure Country Diagnostic, Washington DC: The World Bank.
Harral, C. G. (1988), "Road Deterioration in Developing Countries: Causes and Remedies", A
World Bank Policy Study 13370, The World Bank, Washington, D.C.
Ianchovichina, E., Estache, A., Foucart, R., Garsous, G. and T. Yepes (2012), "Job creation
through infrastructure investment in the Middle East and North Africa," Policy Research Working Paper
Series 6164, The World Bank.
Jacobs, G.D. and N. Greave. (2003), “Transport in developing and emerging nations.” Transport
Reviews, 23, 133-138.
Jacoby, H. G. and B. Minten (2009), “On measuring the benefits of lower transport costs”,
Journal of Development Economics, 89 (1), 28-38.
Jalan, J. and M.Ravallion (2002), "Geographic Poverty Traps?A Micro Model of Consumption
Growth in Rural China", Journal of Applied Econometrics, 17, 329-346.
Jedwab, R. and A. Moradi (2011), "Revolutionizing Transport: Modern Infrastructue, Agriculture
and Development in Ghana", PSE working paper.
Khandker, S.R., Z. Bakht, and G. B. Koolwal (2009), “The Poverty Impact of Rural Roads:
Evidence from Bangladesh.”, Economic Development and Cultural Change, 57: 685–722.
Khandker, S.R. and G. B. Koolwal (2010), “How Infrastructure and Financial Institutions Affect
Rural Income and Poverty: Evidence from Bangladesh”, Journal of Development Studies, 46:6, 1109-
1137.
Kenny, C., (2011), “Publishing Construction Contracts as a Tool for Efficiency and Good
Governance”, CGD Working Paper 272.
Lanjouw, P., J. Quizon, and R. Sparrow (2001), "Non-agricultural earnings in peri-urban areas of
Tanzania: evidence from household survey data." Food Policy, 26, 385-403.
McCleary, I. (1989), “Earmarking Government Revenues: Does it Work?”, World Bank Policy
Research Working Paper No. 322.
Mu, R., and D. van de Walle (2007), “Rural Roads and Poor Area Development in Vietnam.”
World Bank Policy Research Working Paper 4340, World Bank, Washington, DC.
OECD/ ECMT (2007), Transport Infrastructure Charges and Capacity Choice: Self-Financing
Road Maintenance and Construction, Road Table 135.
Documents de Travail du Centre d'Economie de la Sorbonne - 2013.49

28
Messick, R. (2011), Curbing Fraud, Corruption, and Collusion in the Roads Sector, Integrity
Vice-Presidency, Washington: The World Bank, available at
http://siteresources.worldbank.org/INTDOII/Resources/Roads_Paper_Final.pdf
Olken, B. (2007), “Monitoring Corruption: Evidence from a Field Experiment in Indonesia”,
Journal of Political Economy, v. 115, 2, pp. 200-249.
Pinard, M. (2012), “Progress on Commercialized Road Management in Sub-Saharan Africa”,
SSATP working paper 92, available at:
http://siteresources.worldbank.org/EXTAFRSUBSAHTRA/Resources/1513929-
1262811936256/SSATPWP92-Commercialized-road-management-cover2.pdf.
Raballand, G., Kunaka, C. and Giersing, B. (2008), “The Impact of Regional Liberalization and
Harmonization in Road Transport Services: A Focus on Zambia and Lessons for Landlocked Countries”,
World Bank Policy Research Working Paper No. 4482.
Raballand, G., Macchi, P. and Petracco, C. (2010), Rural Road Investment Efficiency, Washington
DC: The World Bank.
Raballand, G., Thornton, R., Yang, D., Goldberg, J., Keleher, N. and Muller, A. (2011), "Are
rural road investments alone sufficient to generate transport flows ? lessons from a randomized
experiment in rural Malawi and policy implications," World Bank Policy Research Working Paper 5535,
Washington DC: The World Bank.
Raballand, G. and Whitworth, A. (2012), “Transport Policy” in Zambia, Collier, P. and Adam, C
(ed.), Oxford: Oxford University Press (forthcoming).
Roll, M. (2011), “Can ‘Pockets of Effectiveness’ trigger public sector transformation in Africa?”,
Paper presented to the 4th European Conference on African Studies in Uppsala, 15-18 June 2011.
Sieber, N. (1999), “Transporting the Yield: Appropriate Transport for Agricultural Production
and Marketing in Sub-Saharan Africa”, Transport Reviews, 19(3), pp.205-220.
Smith, D.R., A. Gordon, K. Meadows, and K. Zwick (2001), "Livelihood diversification in
Uganda: patterns and determinants of change across two rural districts." Food Polic, 26, 421-435.
Stifel, D. and Minten, B. (2008), "Isolation and Agricultural Productivity," Agricultural
Economics, vol. 39(1), pages 1-15.
Stifel, D., B. Minten, and B. Koro (2012), "Economic Benefits and Returns to Rural Feeder
Roads: Evidence from a Quasi-Experimental Setting in Ethiopia", mimeo at ESSP IFPRI Addis Ababa.
Storeygard, A. (2012), "Farther on down the road: transport costs, trade and urban growth in sub-
Saharan Africa", working paper.
Teravaninthorn, S. and Raballand, G.(2008), Transport prices and cost in Africa: A review of the
Main International Corridors. Washington DC: The World Bank.
Documents de Travail du Centre d'Economie de la Sorbonne - 2013.49

29
Van de Walle, Dominique (2009), “Impact evaluation of rural road projects”, Journal of
Development Effectiveness,1(1), 15 — 36.
World Bank Development Report (1994), Infrastructure for Development, Washington DC: The
World Bank.
World Bank Rural Transport Thematic Group (2003), “Rural Transport in Multi Sectoral and
Community Driven Projects”, Washington DC: The World Bank World Bank.
World Bank (2010), Africa’s Infrastructure: A Time for Transformation, Washington DC: The
World Bank.
Zambia CoST Secretariat (2011), CoST Baseline Study Report.
Zietlow, D. (2007), “Financing and Management of Roads in Sub-Saharan Africa – A Hopeless
Case?”, available at : http://www.zietlow.com/gtz/Africa%20road%20reform.pdf.
Documents de Travail du Centre d'Economie de la Sorbonne - 2013.49
30
Annex 1: DAC members disbursements for road transport (million US$)
Recipient 2002 2003 2004 2005 2006 2007 2008 2009
Angola 0.122 0.003 0.003 0.155 0.004 N/A N/A N/A
Benin 11.956 18.452 13.647 11.248 9.455 20.535 22.179 32.254
Botswana N/A N/A N/A N/A N/A 0.054 0.127 0.180
Burkina Faso 0.818 7.517 0.237 0.551 0.530 0.043 N/A 0.091
Burundi 0.471 N/A N/A N/A 2.197 0.004 0.211 0.665
Cameroon 15.606 14.300 8.332 1.718 0.969 9.523 13.826 2.439
Cape Verde 0.026 0.002 2.071 36.217 20.140 14.793 31.982 33.459
Central Africa Rep 9.825 1.826 1.782 2.243 2.860 0.436 0.181 0.185
Chad 2.207 N/A 1.176 1.496 0.111 N/A N/A N/A
Congo DRC 0.354 0.411 4.324 3.450 4.554 4.694 11.666 29.927
Cote d'Ivoire 1.414 0.002 N/A N/A 0.020 N/A N/A 0.005
Djibouti N/A 0.065 0.077 N/A 0.001 N/A N/A N/A
Eritrea N/A 0.154 0.662 1.788 3.505 0.331 N/A N/A
Ethiopia 28.125 28.867 24.199 16.065 23.943 39.361 18.382 24.375
Gabon 14.033 10.991 15.672 4.764 7.639 4.585 4.264 7.719
Ghana 22.251 32.940 45.760 68.655 56.572 40.122 46.435 56.868
Guinea 0.037 0.005 0.010 0.010 0.116 0.017 0.475 0.062
Guinea-Bissau 0.003 0.001 0.003 0.001 0.041 N/A N/A N/A
Kenya 5.436 9.095 11.245 12.116 23.837 13.104 29.999 30.551
Lesotho 1.873 2.179 2.050 1.084 0.390 N/A 0.010 N/A
Madagascar 0.700 2.497 14.929 8.417 5.114 0.550 N/A 0.060
Malawi 1.387 2.098 2.862 1.969 0.540 0.213 3.569 4.710
Mali 5.682 0.386 0.286 1.155 2.759 5.934 0.151 0.438
Mozambique 15.370 21.992 9.723 36.549 22.136 18.378 18.287 27.729
Namibia 1.164 8.093 15.021 7.812 0.860 5.644 11.828 45.377
Niger 0.043 0.002 N/A 0.015 0.026 N/A 0.018 N/A
Rwanda N/A N/A 0.078 0.298 5.653 3.914 2.466 1.085
Sao Tome & Principe 0.003 0.021 0.996 1.099 0.491 0.420 0.002 N/A
Senegal 0.674 1.671 14.259 7.412 4.596 3.800 5.206 9.859
Sierra Leone N/A 0.380 N/A N/A 0.018 N/A N/A 0.013
South Africa N/A 0.200 N/A N/A N/A 0.067 /A 0.007
Tanzania 11.823 28.740 7.466 6.457 13.603 34.195 47.518 57.710
Togo N/A N/A 0.158 5.513 5.746 N/A 0.115 0.027
Uganda 10.282 2.280 4.016 0.765 1.741 5.019 2.136 1.928
Zambia 30.505 34.542 18.147 14.521 25.556 10.507 12.255 14.591
Zimbabwe 3.256 0.066 0.015 N/A 0.025 0.004 0.007 N/A
Documents de Travail du Centre d'Economie de la Sorbonne - 2013.49
31
Annex 2: EU Institutions disbursements for road transport (million US$)
Recipient 2002 2003 2004 2005 2006 2007 2008 2009
Angola 0.125 0.008 0.362 N/A N/A N/A N/A N/A
Benin 19.429 42.599 41.221 14.664 2.769 17.356 52.997 25.203
Burkina Faso 31.091 26.817 16.629 19.687 38.186 89.624 13.905 11.752
Burundi 0.028 N/A N/A N/A N/A 11.130 24.978 32.667
Cameroon 13.642 15.796 30.926 19.454 32.332 37.086 38.102 28.971
Cape Verde N/A 1.669 3.650 2.498 5.853 6.659 13.256 0.303
Central Africa Rep 0.074 0.099 N/A N/A N/A N/A N/A 0.435
Chad 9.567 17.635 24.343 21.834 18.997 11.264 53.866 37.196
Congo 2.001 0.998 0.651 0.298 6.808 28.941 25.899 17.139
Djibouti N/A 1.200 5.013 2.314 0.262 3.518 2.188 6.355
Eritrea 0.151 N/A N/A 0.024 0.100 N/A 0.956 2.748
Ethiopia 21.348 24.594 19.539 47.230 102.261 94.774 151.088 45.510
Gabon 2.501 2.351 3.118 5.410 2.241 1.522 1.458 1.858
Ghana 0.909 9.825 8.443 29.999 21.246 23.449 33.502 24.177
Guinea 11.784 14.454 7.086 3.039 5.000 6.556 27.258 24.085
Guinea-Bissau 8.293 3.241 5.465 0.242 6.670 15.568 15.357 13.582
Kenya N/A 17.672 31.156 39.058 35.441 23.124 10.890 0.863
Lesotho 6.809 11.085 3.156 1.055 1.818 0.478 6.859 N/A
Madagascar 3.132 25.428 61.147 75.215 77.183 89.578 51.342 7.595
Malawi 14.545 24.795 14.520 11.498 3.241 7.726 27.269 12.956
Mali 20.533 35.493 21.677 35.894 17.413 55.474 23.819 0.180
Mauritania 11.694 8.965 5.716 7.113 9.271 39.378 32.790 16.799
Mozambique 8.975 8.395 11.224 26.335 46.832 31.063 16.258 13.454
Niger 9.944 14.497 10.336 2.890 4.325 43.861 58.227 16.708
Rwanda 3.430 7.189 12.673 21.513 6.653 8.729 32.595 17.556
Sao Tome & Principe 0.008 0.004 1.076 3.110 2.432 3.131 3.560 1.384
Senegal 9.867 7.908 7.960 14.045 17.651 25.892 40.394 53.198
Sierra Leone 1.690 2.589 7.427 16.623 11.978 7.663 11.736 25.391
Tanzania 10.225 12.425 39.200 71.307 56.367 36.322 11.132 3.634
Uganda 2.596 1.811 28.727 9.698 18.409 34.355 95.024 24.918
Zambia 8.634 11.308 9.780 32.949 27.645 1.286 45.806 8.827
Documents de Travail du Centre d'Economie de la Sorbonne - 2013.49

32
Annex 3: IDA disbursements for road transport (million US$)
Recipient 2002 2003 2004 2005 2006 2007 2008 2009
Benin 3.937 2.763 1.221 0.034 2.665 1.084 10.375 4.010
Burkina Faso 0.523 6.664 3.437 6.226 10.898 12.376 10.006 22.479
Burundi 1.913 2.622 5.219 4.856 11.592 11.101 5.631 4.454
Cameroon 7.420 9.012 5.663 8.343 14.677 8.036 19.173 19.993
Cape Verde 0.433 0.451 1.418 1.644 2.147 3.868 4.623 0.945
Central Africa
Rep N/A N/A N/A N/A N/A 0.215 1.361 6.217
Chad N/A N/A N/A 0.744 0.509 0.581 1.214 3.500
Congo DRC 5.404 7.925 2.497 0.451 0.429 9.556 17.472 14.419
Congo N/A 1.679 6.841 3.991 1.834 0.305 1.107 0.876
Cote d'Ivoire 18.345 8.115 9.992 -0.234 N/A N/A 5.543 8.176
Djibouti 3.599 9.122 2.632 0.735 1.086 0.548 1.048 0.094
Eritrea 4.219 3.892 1.455 0.181 N/A N/A N/A N/A
Ethiopia 84.580 53.186 73.914 54.030 54.388 52.920 96.910 129.947
Ghana 16.216 27.174 40.796 50.733 46.686 37.877 13.022 2.598
Guinea 2.349 3.791 3.192 2.191 3.512 2.241 4.849 N/A
Guinea-Bissau N/A N/A N/A N/A N/A 0.219 0.689 0.674
Kenya 4.918 0.890 5.533 0.350 -0.094 21.281 33.284 29.160
Lesotho 4.685 3.416 1.293 N/A N/A 1.535 3.986 5.712
Madagascar 2.825 8.884 32.683 17.338 43.227 41.662 26.698 6.746
Malawi 3.717 0.700 3.322 9.189 4.234 1.673 1.333 1.612
Mali 2.319 1.264 0.469 12.503 13.023 9.301 11.688 21.451
Mauritania 1.589 1.610 3.123 3.332 3.975 4.312 3.547 1.126
Mozambique 13.280 17.900 34.200 49.031 50.240 28.945 19.615 19.138
Niger 5.036 5.111 N/A N/A N/A N/A 1.097 6.718
Nigeria 0.444 2.526 6.076 13.534 10.584 10.835 8.536 17.704
Rwanda 6.125 N/A N/A N/A 1.043 1.512 3.657 0.655
Senegal 2.076 4.836 15.729 25.776 22.099 19.838 10.772 9.278
Sierra Leone 2.534 1.166 1.568 1.263 2.678 1.947 5.949 4.673
Tanzania 11.388 17.073 18.985 6.604 14.676 51.168 53.767 25.270
Togo 6.759 -0.007 0.000 N/A N/A N/A -0.237 0.541
Uganda 15.379 19.999 27.561 25.724 40.621 49.880 59.663 51.139
Zambia 6.932 6.696 20.573 6.442 16.803 10.881 16.999 8.285
Documents de Travail du Centre d'Economie de la Sorbonne - 2013.49