are the dorsa argentea on mars eskers? - core · are the dorsa argentea on mars eskers? ... 2...
TRANSCRIPT
Accepted Manuscript
Are the Dorsa Argentea on Mars eskers?
Frances E.G. Butcher , Susan J. Conway , Neil S. Arnold
PII: S0019-1035(16)30032-XDOI: 10.1016/j.icarus.2016.03.028Reference: YICAR 12003
To appear in: Icarus
Received date: 21 December 2015Revised date: 11 March 2016Accepted date: 31 March 2016
Please cite this article as: Frances E.G. Butcher , Susan J. Conway , Neil S. Arnold , Are the DorsaArgentea on Mars eskers?, Icarus (2016), doi: 10.1016/j.icarus.2016.03.028
This is a PDF file of an unedited manuscript that has been accepted for publication. As a serviceto our customers we are providing this early version of the manuscript. The manuscript will undergocopyediting, typesetting, and review of the resulting proof before it is published in its final form. Pleasenote that during the production process errors may be discovered which could affect the content, andall legal disclaimers that apply to the journal pertain.

ACCEPTED MANUSCRIPT
ACCEPTED MANUSCRIP
T
i
Highlights:
Geometries of the Dorsa Argentea on Mars are statistically similar to >20 000
terrestrial eskers.
Variations in ridge cross-sectional morphology are consistent with terrestrial eskers.
Statistical tests confirm esker-like relationships between ridge height and bed slope.
The ridges may have formed in subglacial conduits terminating in a proglacial lake.
Quantitative characterisations may be useful for modelling putative former ice sheet
hydrology.

ACCEPTED MANUSCRIPT
ACCEPTED MANUSCRIP
T
ii
Are the Dorsa Argentea on Mars eskers?
Frances E.G. Butcher1*, Susan J. Conway1,2, Neil S. Arnold3
1 Department of Physical Sciences, The Open University, Walton Hall, Milton Keynes, MK7
6AA, United Kingdom. Email: [email protected]
2 Laboratoire de Planétologie et Géodynamique de Nantes - UMR CNRS 6112, 2 rue de la
Houssinière - BP 92208, 44322 Nantes Cedex 3, France.
3 Scott Polar Research Institute, University of Cambridge, Lensfield Road, Cambridge, CB2
1ER, United Kingdom.
*Corresponding author
Abstract
The Dorsa Argentea are an extensive assemblage of ridges in the southern high
latitudes of Mars. They have previously been interpreted as eskers formed by deposition of
sediment in subglacial meltwater conduits, implying a formerly more extensive south polar
ice sheet. In this study, we undertake the first large-scale statistical analysis of aspects of
the geometry and morphology of the Dorsa Argentea in comparison with terrestrial eskers in
order to evaluate this hypothesis. The ridges are re-mapped using integrated topographic
(MOLA) and image (CTX/HRSC) data, and their planar geometries compared to recent
characterisations of terrestrial eskers. Quantitative tests for esker-like relationships between
ridge height, crest morphology and topography are then completed for four major Dorsa
Argentea ridges. The following key conclusions are reached: (1) Statistical distributions of
lengths and sinuosities of the Dorsa Argentea are similar to those of terrestrial eskers in

ACCEPTED MANUSCRIPT
ACCEPTED MANUSCRIP
T
iii
Canada. (2) Planar geometries across the Dorsa Argentea support formation of ridges in
conduits extending towards the interior of an ice sheet that thinned towards its northern
margin, perhaps terminating in a proglacial lake. (3) Variations in ridge crest morphology are
consistent with observations of terrestrial eskers. (4) Statistical tests of previously observed
relationships between ridge height and longitudinal bed slope, similar to those explained by
the physics of meltwater flow through subglacial meltwater conduits for terrestrial eskers,
confirm the strength of these relationships for three of four major Dorsa Argentea ridges. (5)
The new quantitative characterisations of the Dorsa Argentea may provide useful constraints
for parameters in modelling studies of a putative former ice sheet in the south polar regions
of Mars, its hydrology, and mechanisms that drove its eventual retreat.
KEYWORDS: Mars; Mars, polar geology; Mars, surface; Geological processes.
1. Introduction
The Dorsa Argentea are an assemblage of ~7000 kilometres of ridges in the
southern high latitudes of Mars (70° - 80°S, 56°W - 6°E). They give their name to the Dorsa
Argentea Formation (DAF, equivalent to the Hesperian polar unit in Tanaka et al. (2014a) in
which they are located (Fig. 1). The Dorsa Argentea are the most extensive of seven
assemblages of ridges distributed throughout the DAF (Kress and Head, 2015). The DAF is
adjacent to the present Amazonian-aged (< 3.2 Ga) (Hartmann, 2005) south polar layered
deposits (SPLD), comprising water and carbon dioxide (CO2) ice deposits (Phillips et al.,
2011). The DAF is distributed in two major lobes centred on the ~0°E and ~290°E longitude
lines (Ghatan and Head, 2004). The Dorsa Argentea trend SE to NW within the ~290°E DAF
lobe which extends to ~65°S, with its northernmost extent reaching ~55°S. Within the most
recent United States Geological Survey (USGS) global map of Mars (Tanaka et al., 2014a),
the DAF is interpreted as remnants of ice-rich deposits emplaced either by cryovolcanic

ACCEPTED MANUSCRIPT
ACCEPTED MANUSCRIP
T
2
flows or atmospheric precipitation and subsequently superposed by a thin, periglacially-
modified mantle deposit. The DAF is believed to range in thickness from a lag-deposit
veneer over the underlying bedrock in the vicinity of the Dorsa Argentea ridges, to a blanket
hundreds of metres thick to the south and east (Ghatan and Head, 2004).
The Dorsa Argentea occur in the headward region of Argentea Planum (Ghatan and
Head, 2004), a broad, NW-trending, ~975 km long basin in the DAF that is topographically
confined by the surrounding cratered highlands (Tanaka et al., 2014a), and enter a narrower
~40 km wide valley at its head. In the central region of their distribution, the ridges generally
trend N-NW, diagonal to the strike of the basin (Fig. 1). Here, they emerge from the deposits,
which superpose several ridges to an increasing degree towards the south (Head, 2000a;
Head and Pratt, 2001), and descend into the basin, before ascending or tracking along the
slopes on its distal side. At the NE margin of Argentea Planum (Fig. 1), several ridges turn
east and enter the narrow ~550 km-long East Argentea Planum (Ghatan and Head, 2004).
Individual ridges have lengths of up to several hundred kilometres (Metzger, 1992) with
heights up to 120 m and widths up to 6 km (Head and Pratt, 2001). They range from stand-
alone ridges to bifurcating and braided networks (Howard, 1981; Kargel and Strom, 1992),
and exhibit evidence of superposition (Head and Hallet, 2001a). Buffered crater counting by
Kress and Head (2015) returns a best-fit age of 3.48 Ga for the Dorsa Argentea ridges,
corresponding to the Early Hesperian period of Mars' geological history.

ACCEPTED MANUSCRIPT
ACCEPTED MANUSCRIP
T
3
Figure 1: Map of the south polar region of Mars showing the major surface units (Tanaka et
al., 2014a) with relevant features labelled, overlain on a hillshade map derived from
460 m/pixel MOLA DEM. The black arrow shows the general trend of the Dorsa Argentea
ridges. Ap is the Amazonian polar unit; Apu is the Amazonian polar undivided unit; Hpe is
the Hesperian polar edifice unit; Hp is the Hesperian polar unit, equivalent to the Dorsa
Argentea Formation (DAF); and IApc is the Late Amazonian polar cap unit. The white box
delineates our study area. Projection is south polar stereographic. Surface units, labels and
contacts between them are modified from Tanaka et al. (2014a).
The Dorsa Argentea have previously been interpreted as lacustrine (Parker et al.,
1986), volcanic (Tanaka and Scott, 1987; Ruff and Greeley, 1990), tectonic (Kargel, 1993),

ACCEPTED MANUSCRIPT
ACCEPTED MANUSCRIP
T
4
aeolian (Ruff and Greeley, 1990), erosional (Ruff and Greeley, 1990; Kargel, 1993; Tanaka
and Kolb, 2001; Tanaka et al., 2014b) or glaciofluvial features (Howard, 1981; Metzger,
1992; Kargel and Strom, 1992; Kargel, 1993; Head, 2000a, 2000b; Head and Hallet, 2001a,
2001b; Head and Pratt, 2001; Tanaka et al., 2014b; Kress and Head, 2015).
Although many of these interpretations have already been excluded due to
morphological inconsistencies with terrestrial analogues (e.g. Head and Pratt, 2001, and
references therein), a description of the Dorsa Argentea as either eskers or inverted fluvial
channels in the most recent USGS geological map of Mars (Tanaka et al., 2014b) highlights
that a consensus on their origin has not yet been reached.
Eskers are ridges formed by deposition of glacial sediment in ice-contact meltwater
channels, and subsequent lowering of this material to, or its exposure at, the ground surface
during deglaciation (e.g., Banerjee and McDonald, 1975; Brennand, 2000; Benn and Evans,
2010). Complex supraglacial, englacial and subglacial drainage within terrestrial ice sheets
gives rise to a diverse range of morphologies and configurations of terrestrial esker systems
(e.g., Banerjee and McDonald, 1975; Brennand, 2000; Perkins et al., 2016). Relationships
between ridge cross-sectional (CS) dimensions and CS crest morphology and the
surrounding topography, similar to those observed for terrestrial eskers, have been identified
for the Dorsa Argentea, and explained using Shreve’s (1972, 1985a) theory on the physics
of meltwater flow through subglacial conduits (Head and Hallet, 2001a, 2001b).
However, no large-scale quantitative tests of these relationships have been presented
for the ridges and photogeologic analysis to date has largely been limited to assessment of
low-resolution (~150 to 300 m/pixel) images from the Viking Orbiters (e.g., Howard, 1981;
Kargel and Strom, 1992; Head, 2000b; Head and Pratt, 2001). Furthermore, no detailed
statistical characterisation of planar geometries of a large sample of the Dorsa Argentea
ridges has previously been presented, perhaps due to a lack of similarly extensive, ice-
sheet-scale datasets for terrestrial esker analogues.
Recent publication of the first large-scale quantitative analysis of planar geometries of
terrestrial eskers (Storrar et al., 2014a), formed during deglaciation of the Laurentide Ice

ACCEPTED MANUSCRIPT
ACCEPTED MANUSCRIP
T
5
Sheet between 13000 and 7000 years ago (Storrar et al., 2014b), gives a new opportunity
for comparison and assessment of the esker hypothesis for the Dorsa Argentea, which we
exploit here.
We present extensive quantitative characterisation of planar geometries of the Dorsa
Argentea in comparison with the large sample of terrestrial eskers analysed by Storrar et al.
(2014a). Additionally, we quantify CS dimensions of four major Dorsa Argentea ridges and
classify their crest morphologies using high-resolution topographic (MOLA) and medium-
resolution image (CTX) datasets, and present the first statistical assessment of esker-like
topographic relationships for the Dorsa Argentea that were previously observed by Head and
Hallet (2001a). We therefore present the first rigorous quantitative statistical tests of the
hypothesis that the Dorsa Argentea are morphologically consistent with terrestrial eskers.
Such assessment is necessary as a growing body of literature uses the interpretation of the
Dorsa Argentea as eskers as a basis for inferences about the character of a putative former
ice sheet thought to have extended into the DAF during Mars’ Hesperian period, and the
nature of its recession (Head, 2000a; Head and Pratt, 2001; Milkovich et al., 2002; Ghatan
and Head, 2004; Fastook et al., 2012; Scanlon and Head, 2015; Kress and Head, 2015).
Similarities have been observed between subparallel curvilinear and isolated linear-
curvilinear ridges within ridge assemblages in the Cavi Angusti and Planum Angustum
sectors of the DAF, and terminal moraines marking the former extents of terrestrial glaciers
and ice sheets (Kress and Head, 2015). If correct, the existence of moraine ridges has
implications for the geomorphic record of the former extent and retreat of a putative former
ice sheet in the DAF. However, Kress and Head (2015) acknowledge that further
investigation of these features is required to test the moraine hypothesis. The quantitative
description of the Dorsa Argentea ridges in the present study may provide useful inputs for
tests for differences in morphology and, by extension, mechanisms of formation between the
Dorsa Argentea and other ridge assemblages in the DAF.
If quantitative and statistical analyses of the Dorsa Argentea and comparison to
planar geometries and topographic relationships observed for terrestrial eskers support the
ACCEPTED MANUSCRIPT
ACCEPTED MANUSCRIP
T
6
hypothesis that the Dorsa Argentea are eskers, the quantitative characterisations contained
within this study may provide useful constraints for parameters in modelling studies of a
putative former ice sheet extending into the DAF, its hydrology, and mechanisms that drove
its eventual retreat. A lack of sufficient constraints upon the terminus position of this putative
ice sheet means that, at present, reconstruction of glacier thickness akin to that performed
by Bernhardt et al. (2013) based on ice-surface slopes derived from putative eskers in
Argyre Planitia, is not possible for the Dorsa Argentea. Identification of a possible terminus
of the putative DAF ice sheet is beyond the scope of the present study, which purely aims to
rigorously test the hypothesis that the Dorsa Argentea are eskers.
Furthermore, possible identification of the first martian esker connected to its parent
glacier in the Phlegra Montes region (Gallagher and Balme, 2015) suggests that eskers may
be widespread geomorphological features diagnostic of glaciated landscapes on Mars
(Kargel and Strom, 1992; Banks et al., 2009; Ivanov et al., 2012; Bernhardt et al., 2013;
Erkeling et al., 2014). It is therefore necessary to begin a quantitative description of the
range of characteristics of putative eskers on Mars to facilitate their identification.
2. Background: Terrestrial eskers
Given the great lengths (>100 km), low degree of fragmentation (Metzger, 1992),
location within potential tunnel valleys (Kargel and Strom, 1992), and lack of morainic
features associated with the Dorsa Argentea ridges on Mars (Howard, 1981), the terrestrial
esker analogues of most interest for the present study are those formed within subglacial
conduits beneath a stagnant or sluggish ice mass that does not override sedimentary
bedforms during retreat (Metzger, 1991, 1992; Scanlon and Head, 2015; Kress and Head,
2015).
2.1. Planar geometry

ACCEPTED MANUSCRIPT
ACCEPTED MANUSCRIP
T
7
Eskers adopt the paths of the conduits in which they form, and therefore have similar
configurations and geometries to drainage networks formed during deglaciation. Storrar et
al. (2014a) present data for the distributions of length, degree of fragmentation and sinuosity
of a large sample (n > 20 000) of eskers in Canada. Individual Canadian eskers with lengths
up to 97.5 km form longer fragmented chains of eskers up to 760 km in length, in which gaps
account for 34.9 % of the total length. Storrar et al. (2014a) attribute these great lengths to
time-transgressive formation in spatially and temporally stable meltwater conduits close to
the retreating margin of the Laurentide Ice Sheet. However, mechanisms allowing
synchronous formation of very long eskers in long, stable conduits extending towards the
interior of former ice sheets and terminating in a standing water body have also been
described in relation to detailed field studies of Canadian eskers (Brennand, 1994; Brennand
and Shaw, 1996; Brennand, 2000). Fragmentation of eskers into shorter segments
separated by gaps can be an outcome of changes in sedimentation conditions in subglacial
conduits (Shreve, 1972; Banerjee and McDonald, 1975; Brennand, 1994, 2000) and/or post-
depositional erosion, including erosion by dynamic ice at a retreating ice margin (Brennand,
2000; Storrar et al., 2014a).
The degree to which eskers diverge from straight paths (sinuosity) may be an outcome
of pressure conditions within the subglacial esker-forming conduits (Storrar et al., 2014a).
Idealised water-filled meltwater conduits at the base of an ice sheet or glacier, crossing a
hard bed, adopt roughly semi-circular cross-sections incised upwards into the overlying ice
(R-channels, Röthlisberger, 1972). At the scale of an ice sheet, the direction of subglacial
water flow through R-channels is thought to be governed by the subglacial hydraulic
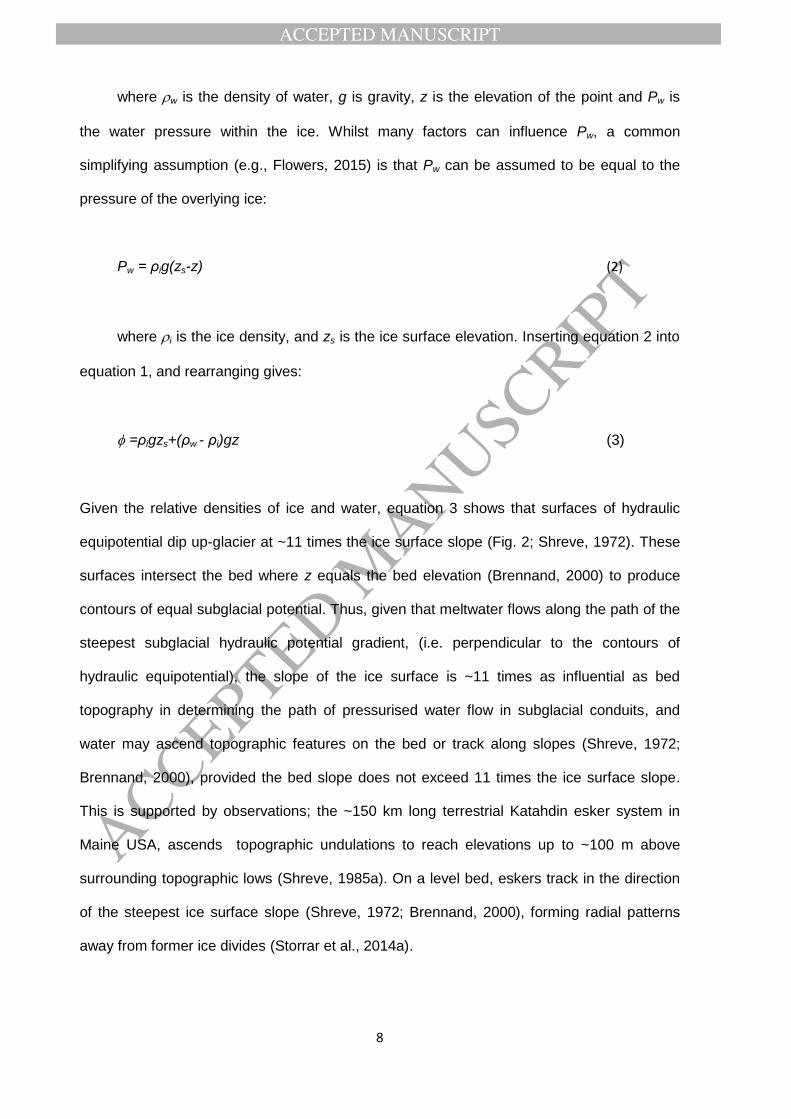
potential (Shreve, 1972). At any given point within an ice sheet, the hydraulic potential () is
a function of the elevation of the point and the water pressure:
= ρwgz + Pw (1)
ACCEPTED MANUSCRIPT
ACCEPTED MANUSCRIP
T
8
where w is the density of water, g is gravity, z is the elevation of the point and Pw is
the water pressure within the ice. Whilst many factors can influence Pw, a common
simplifying assumption (e.g., Flowers, 2015) is that Pw can be assumed to be equal to the
pressure of the overlying ice:
Pw = ρig(zs-z) (2)
where i is the ice density, and zs is the ice surface elevation. Inserting equation 2 into
equation 1, and rearranging gives:
=ρigzs+(ρw - ρi)gz (3)
Given the relative densities of ice and water, equation 3 shows that surfaces of hydraulic
equipotential dip up-glacier at ~11 times the ice surface slope (Fig. 2; Shreve, 1972). These
surfaces intersect the bed where z equals the bed elevation (Brennand, 2000) to produce
contours of equal subglacial potential. Thus, given that meltwater flows along the path of the
steepest subglacial hydraulic potential gradient, (i.e. perpendicular to the contours of
hydraulic equipotential), the slope of the ice surface is ~11 times as influential as bed
topography in determining the path of pressurised water flow in subglacial conduits, and
water may ascend topographic features on the bed or track along slopes (Shreve, 1972;
Brennand, 2000), provided the bed slope does not exceed 11 times the ice surface slope.
This is supported by observations; the ~150 km long terrestrial Katahdin esker system in
Maine USA, ascends topographic undulations to reach elevations up to ~100 m above
surrounding topographic lows (Shreve, 1985a). On a level bed, eskers track in the direction
of the steepest ice surface slope (Shreve, 1972; Brennand, 2000), forming radial patterns
away from former ice divides (Storrar et al., 2014a).

ACCEPTED MANUSCRIPT
ACCEPTED MANUSCRIP
T
9
Figure 2: The relationship between esker crest morphology, dimensions and bed
topography described by Shreve (1985a), based on Figure 5 from Shreve (1985a) and
Figure 8.64 from Anderson and Anderson (2010). Temperature is represented on a gradient
from light blue (cold) through to red (warm). Geometries are not accurate and dimensions
are exaggerated for clarity. The reader is referred to the web-version of this article for
interpretation of the colours in this figure.
2.2 Cross-sectional dimensions, crest morphology and relationships to topography
Eskers adopt the CS dimensions and CS crest morphology of subglacial conduits (R-
channels; Section 2.1) in which they form, assuming they completely fill the conduits
(Banerjee and McDonald, 1975; Shreve, 1985a). Changes in these properties along esker
profiles are related the physics of meltwater flow through water-filled R-channels (Fig. 2)
(Shreve, 1972, 1985a). This theory was developed based on the terrestrial eskers of the
Katahdin esker system in Maine, USA, which have heights of 3-50 m, and typical widths of
150-600 m, but can be up to 2 km-wide (Shreve, 1985a). These dimensions are typical of

ACCEPTED MANUSCRIPT
ACCEPTED MANUSCRIP
T
10
most terrestrial eskers (Clark and Walder, 1994), although eskers can have heights and
widths of less than 10 m (Storrar et al., 2015).
R-channels are maintained in a steady-state when conduit closure by creep of the
surrounding ice is directly opposed by melting of the conduit roof and walls due to viscous
heating by meltwater flow (Röthlisberger, 1972). However, changes in ice thickness and
associated changes in the pressure melting point (PMP) of ice along conduit paths disrupt
steady-state conditions, promoting adjustment of dynamics of conduit wall melting and
changes in conduit CS dimensions (Shreve, 1972, 1985a; Anderson and Anderson, 2010).
Conduits trend down-glacier into thinner ice with correspondingly higher PMP. Viscous heat
produced by frictional interaction of meltwater with the conduit walls must therefore be
partitioned towards warming of water to the temperature of the ice into which it passes
before opposition of conduit creep closure by wall melting can occur.
On Earth, on a level bed, water warming consumes ~30 % of the available heat energy
(Shreve, 1985a) meaning that ~70 % of viscous heat energy is available for wall melting. On
descending bed slopes, down-glacier thinning (and warming) of the ice is mediated,
promoting stronger wall melting than on a level bed. In contrast, on gently ascending slopes
(<~1.7 times the ice surface gradient on Earth) wall melting is weakened as the overlying ice
thins downstream more rapidly than over a level bed. On slopes >~1.7 times the ice surface
gradient, wall melting transitions into a regime of wall freezing as viscous heating cannot
compensate for increases in PMP beneath rapidly thinning ice (Shreve, 1972; Anderson and
Anderson, 2010). Changes in the rate of wall melting with bed slope therefore drive changes
in the CS dimensions of eskers forming within conduits. The conduit roof experiences
greater rates of melting or freezing than the side walls as water in contact with the roof
dissipates energy over a smaller surface area relative to its depth (Shreve, 1985a).
Therefore, conduit height is more sensitive than width to changes in melt dynamics due to
bed topography, resulting in changes in conduit shape (Shreve, 1985a).
Accordingly, as is illustrated in Fig. 2, terrestrial eskers formed on level or gently
descending bed slopes may be characterised by tall, sharp crest morphology approximating

ACCEPTED MANUSCRIPT
ACCEPTED MANUSCRIP
T
11
a triangular shape. In areas ascending <~1.7 times the ice surface slope, weaker roof
melting leads to lower, multiple-crested esker crest morphology, and on steeply ascending
slopes (>~1.7 times the ice surface slope), eskers adopt a lower, broad-crested morphology
(Shreve, 1972, 1985a, 1985b; Anderson and Anderson, 2010).
Depression of surfaces of hydraulic equipotential at the crest of topographic
undulations drives local increases in the capacity for sediment transport by meltwater, and
may result in gaps between related esker segments forming on either side of a topographic
undulation within a continuous conduit (Fig. 2; Shreve, 1972, 1985a; Anderson and
Anderson, 2010). Such systematic variations in ridge CS dimensions and crest morphology
have been observed in an assemblage of potential eskers in Argyre Planitia, Mars (Banks et
al., 2009; Bernhardt et al., 2013).

ACCEPTED MANUSCRIPT
ACCEPTED MANUSCRIP
T
12
3. Methods
3.1 Datasets and mapping
All Mars data were projected in ESRI ArcMap using a south polar stereographic projection.
The latitude of zero distortion (standard parallel) was set to -74.5°S, approximating the
centre of the Dorsa Argentea ridge distribution, reducing the estimated mean linear distortion
error to ±0.6498 % over the study area (see S1 for error derivation). We created an image
mosaic providing complete coverage (Fig. 3) of the Dorsa Argentea using ~6 m/pixel images
in the 500 to 800 nm waveband from the Mars Reconnaissance Orbiter Context Camera
(CTX) (Malin et al., 2007), with ~11-20 m/pixel panchromatic images from the Mars Express
(MEX) High Resolution Stereo Camera (HRSC) (Neukum et al., 2004; Jaumann et al., 2007)
in CTX data gaps (Refer to Table S2 for list of image products). We used the ~230 m/pixel
and ~115 m/pixel-resolution gridded polar MOLA digital elevation model (DEM) products
(Zuber et al., 1992; Som, 2008) to complement the image data. The ~230 m/pixel DEM was
only used to provide coverage of the ridges in the most northerly latitudes of their distribution
(Fig. 3). MOLA shot data (Precision Experiment Data Record, MGS-
M_MOLA_3_PEDR_L1a-V1.0) were downloaded from the PDS Geosciences Node in
shapefile format and overlain on the interpolated DEM to identify interpolated pixels in the
MOLA DEM. Integration of image and topographic datasets improved confidence in mapping
where either the image quality was poor, or where the DEM had been interpolated due to a
low density of raw altimetry points.

ACCEPTED MANUSCRIPT
ACCEPTED MANUSCRIP
T
13
Figure 3: Data coverage map of the study region (extent displayed in Fig. 1) overlain on a
hillshade map derived from the ~460 m/pixel MOLA DEM. The extent of the mapped ridges
is outlined in white. The dashed line indicates the boundary between ~230m/pixel and
~115m/pixel MOLA DEMs. The solid box indicates the approximate study area of Head and
Hallet (2001a). Projection is south polar stereographic. Surface units, labels and contacts
are modified from Tanaka et al (2014a).
Using this basemap, we digitised ridge segments in ArcMap with polylines following
the ridge crest. Segments are defined as individual, unbroken ridges. We conservatively
grouped ridge segments into longer ridge systems, defined as chains of ridge segments,
separated by gaps, judged to be related on the basis of end-to-end proximity, orientation and
visual similarity. Ridge gaps are defined as areas between ridge segments where elevations
are similar to, or lower than the adjacent terrain. Segments that could not be related to
systems >10 km in length (where distance is linearly interpolated across gaps) were
excluded from the map as shorter features were not distinguishable from other 'hills’, which
can have similar aspect ratios. However, this conservative approach inevitably excluded
some of the shortest ridges from the map. Mantled ridges extending northwards from the
gradational contact with the Amazonian polar unit (Fig. 1) were only digitized if they formed
clear continuation of an exposed ridge within the DAF.
ACCEPTED MANUSCRIPT
ACCEPTED MANUSCRIP
T
14
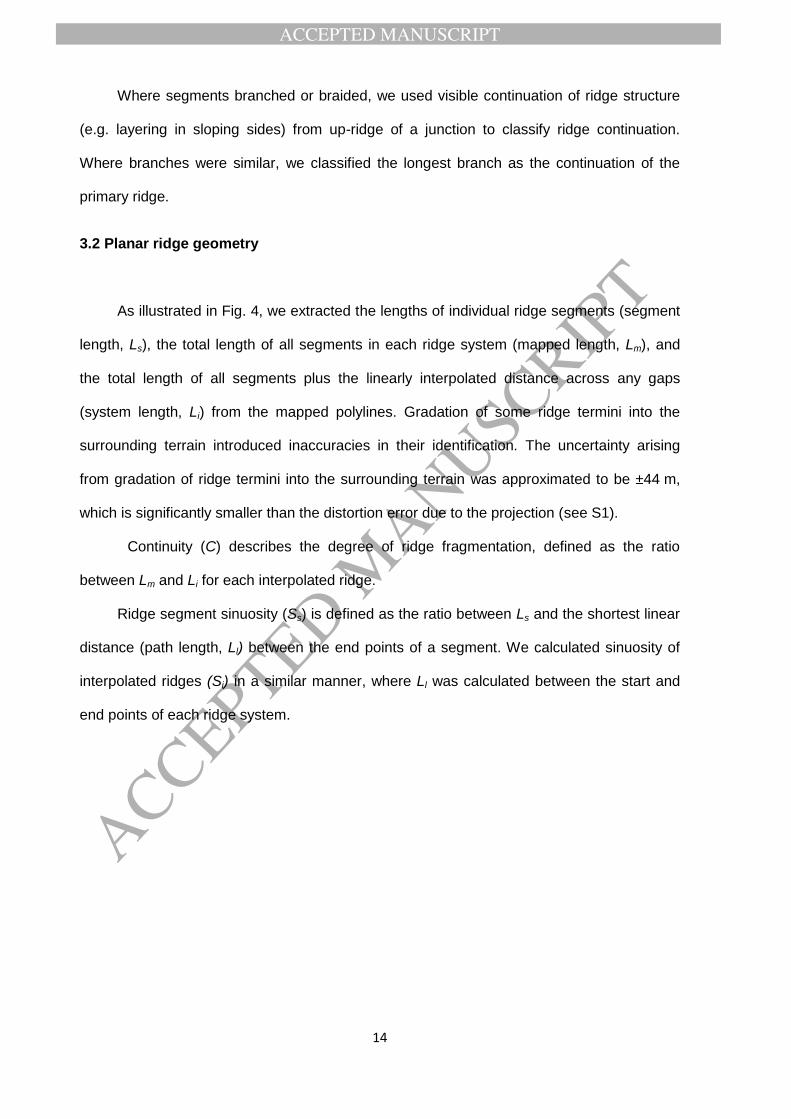
Where segments branched or braided, we used visible continuation of ridge structure
(e.g. layering in sloping sides) from up-ridge of a junction to classify ridge continuation.
Where branches were similar, we classified the longest branch as the continuation of the
primary ridge.
3.2 Planar ridge geometry
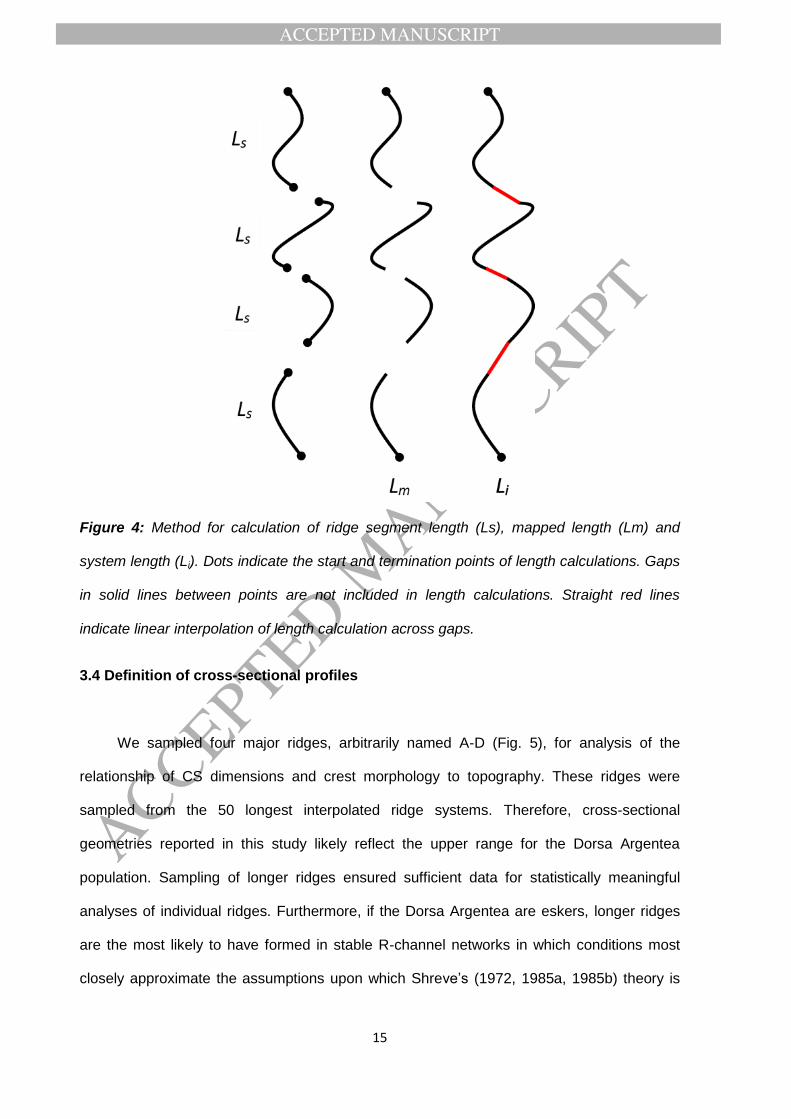
As illustrated in Fig. 4, we extracted the lengths of individual ridge segments (segment
length, Ls), the total length of all segments in each ridge system (mapped length, Lm), and
the total length of all segments plus the linearly interpolated distance across any gaps
(system length, Li) from the mapped polylines. Gradation of some ridge termini into the
surrounding terrain introduced inaccuracies in their identification. The uncertainty arising
from gradation of ridge termini into the surrounding terrain was approximated to be ±44 m,
which is significantly smaller than the distortion error due to the projection (see S1).
Continuity (C) describes the degree of ridge fragmentation, defined as the ratio
between Lm and Li for each interpolated ridge.
Ridge segment sinuosity (Ss) is defined as the ratio between Ls and the shortest linear
distance (path length, Ll) between the end points of a segment. We calculated sinuosity of
interpolated ridges (Si) in a similar manner, where Ll was calculated between the start and
end points of each ridge system.
ACCEPTED MANUSCRIPT
ACCEPTED MANUSCRIP
T
15
Figure 4: Method for calculation of ridge segment length (Ls), mapped length (Lm) and
system length (Li). Dots indicate the start and termination points of length calculations. Gaps
in solid lines between points are not included in length calculations. Straight red lines
indicate linear interpolation of length calculation across gaps.
3.4 Definition of cross-sectional profiles
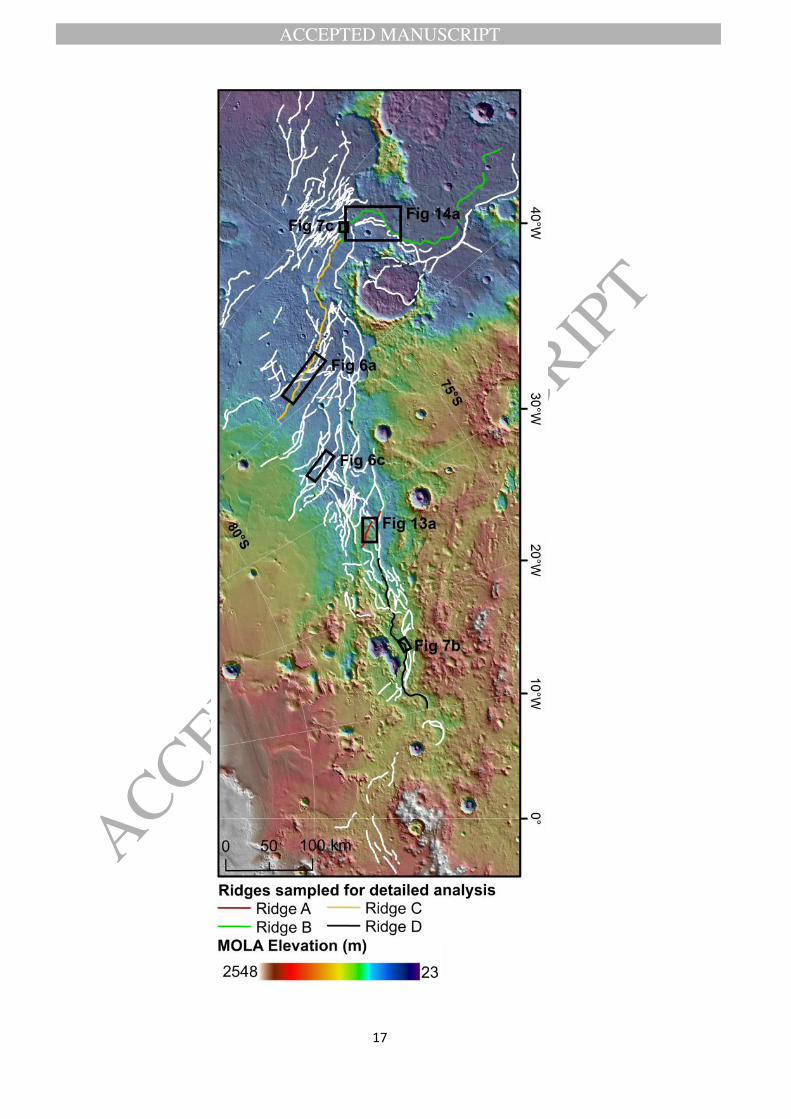
We sampled four major ridges, arbitrarily named A-D (Fig. 5), for analysis of the
relationship of CS dimensions and crest morphology to topography. These ridges were
sampled from the 50 longest interpolated ridge systems. Therefore, cross-sectional
geometries reported in this study likely reflect the upper range for the Dorsa Argentea
population. Sampling of longer ridges ensured sufficient data for statistically meaningful
analyses of individual ridges. Furthermore, if the Dorsa Argentea are eskers, longer ridges
are the most likely to have formed in stable R-channel networks in which conditions most
closely approximate the assumptions upon which Shreve’s (1972, 1985a, 1985b) theory is

ACCEPTED MANUSCRIPT
ACCEPTED MANUSCRIP
T
16
based. Eskers formed in channels where the assumptions of Shreve’s model are not met
may not exhibit the topographic relationships which we sought to test in this study. The
sampled ridges were spatially distributed throughout the DAF, and therefore adequately
represented the whole Dorsa Argentea population.
The image mosaic was unsuitable for accurate identification of the ridge base due to
the gradation of ridges into the surrounding terrain. Therefore, we obtained ~6 km-wide
cross-sectional topographic ridge profiles with point spacing similar to the cell size of the
~115 m/pixel DEM at ~1 km spacing along mapped segments of the sampled ridges for
measurement of CS dimensions, crest morphology and longitudinal bed slope. CS profiles
were not taken within the lower resolution ~230 m/pixel DEM. CS profiles where MOLA shot
point densities were low (fewer than 5 shots intersecting the ridge within 0.5km of the CS
profile) were excluded to minimize the uncertainty from DEM interpolation. CS profiles
superposed on ridge gaps, junctions, or impact craters were also excluded. Elevation values
for points on the CS profiles (Zpoint) were extracted from the MOLA DEM.
3.5 Cross-sectional dimensions and crest morphology
We calculated ridge height (H) and width (W) for each CS profile based on the
geometry of ridge base (Bleft and Bright) and crest points. Gentle gradation of side slopes and
local topography introduced a degree of subjectivity to base point identification. To ensure
consistency, the classification procedure was standardized as follows:
ACCEPTED MANUSCRIPT
ACCEPTED MANUSCRIP
T
17

ACCEPTED MANUSCRIPT
ACCEPTED MANUSCRIP
T
18
Figure 5: Map of the Dorsa Argentea ridges showing the four ridges, A, B, C and D
(highlighted) sampled for detailed analysis of cross-sectional dimensions, crest morphology
and topographic relationships, overlain on a hillshade map derived from ~115 and
~230 m/pixel MOLA DEMs and colourised topography, also from these DEMs. Map extent is
displayed in Fig. 1. Black boxes delineate the extents of subsequent figures. The reader is
referred to the web-version of this article for interpretation of the colours in this figure.
1. CS profile points were overlain on the colourised MOLA DEM and candidate base
points selected.
2. Points were then viewed in profile at fifty-times vertical exaggeration, and additional
candidate base points selected based on breaks in slope.
3. Candidate points identified in (1) and (2) were then evaluated in plan-view on the
integrated basemap, allowing contextualisation of topography and final classification of
Bleft and Bright.
We classified the crest as the highest point between Bleft and Bright. Bed elevation (Zbase)
was approximated as the mean elevation of Bleft (Zl) and Bright (Zr). Ridge height (H) was
calculated as the difference between the elevation of the crest point (Zcrest) and Zbase. Ridge
width (W) was calculated as the distance between Bright and Bleft.
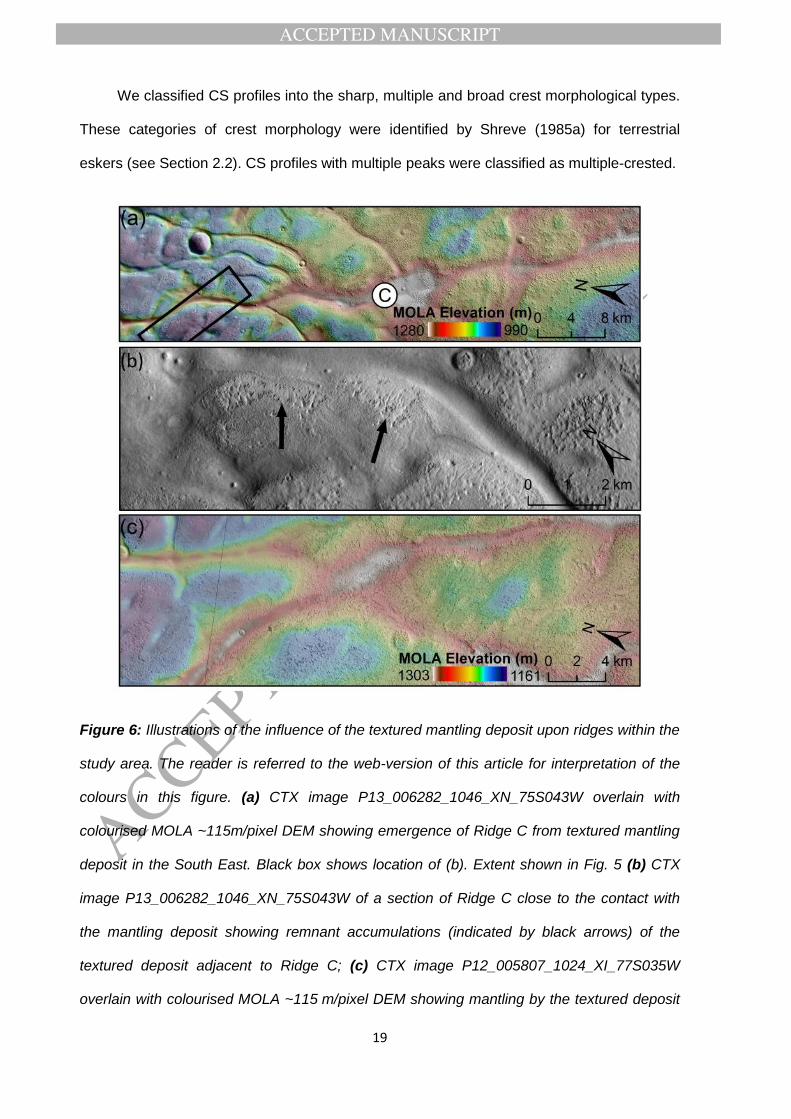
The integrated basemap reveals emergence of Ridge C from a mantling deposit
extending into the DAF from the Amazonian-aged polar unit in the south (Fig. 6a) up to
89 km along its length. Mann-Whitney U tests for difference in sample medians, the results
of which are displayed in Table 1, indicate that mantled ridge sections typically have greater
heights and widths than exposed sections. This indicates that CS dimensions and potentially
crest morphology are modified significantly by the deposit, and justifies exclusion of mantled
sections of Ridge C from analysis. Sections affected by remnant accumulations of the
mantling deposit adjacent to Ridge C near to the contact with the mantle (Fig. 6b) were also
excluded.
ACCEPTED MANUSCRIPT
ACCEPTED MANUSCRIP
T
19
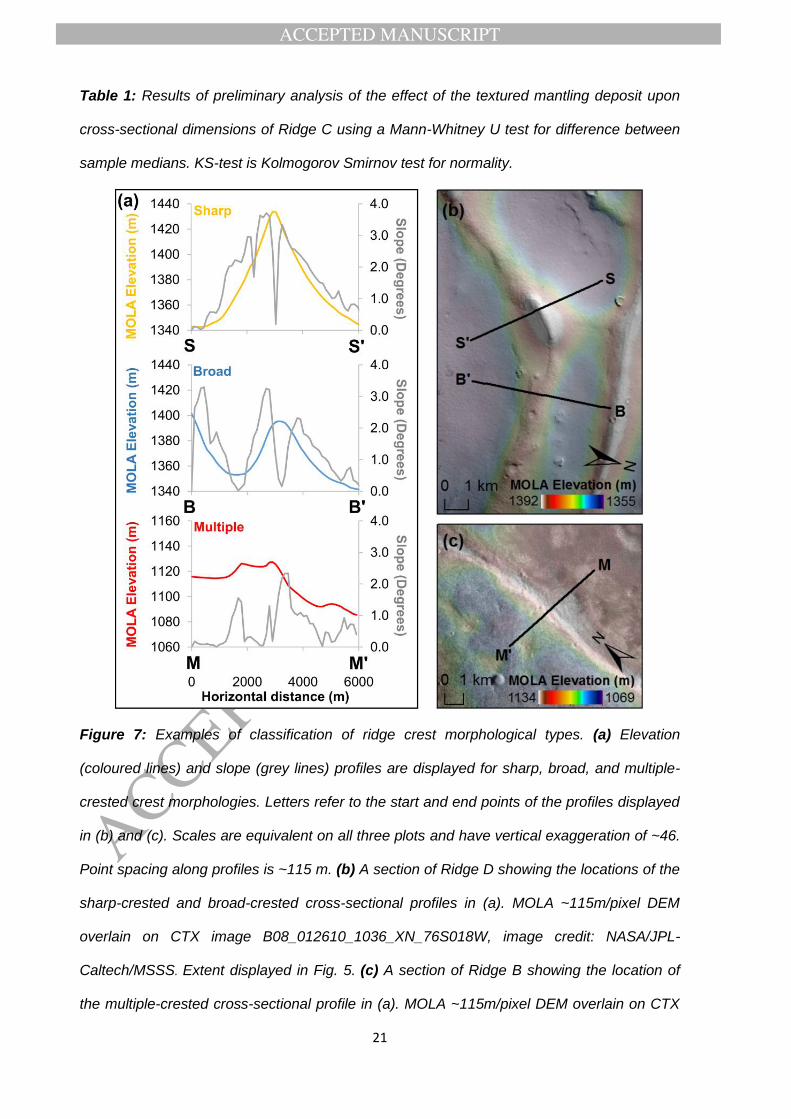
We classified CS profiles into the sharp, multiple and broad crest morphological types.
These categories of crest morphology were identified by Shreve (1985a) for terrestrial
eskers (see Section 2.2). CS profiles with multiple peaks were classified as multiple-crested.
Figure 6: Illustrations of the influence of the textured mantling deposit upon ridges within the
study area. The reader is referred to the web-version of this article for interpretation of the
colours in this figure. (a) CTX image P13_006282_1046_XN_75S043W overlain with
colourised MOLA ~115m/pixel DEM showing emergence of Ridge C from textured mantling
deposit in the South East. Black box shows location of (b). Extent shown in Fig. 5 (b) CTX
image P13_006282_1046_XN_75S043W of a section of Ridge C close to the contact with
the mantling deposit showing remnant accumulations (indicated by black arrows) of the
textured deposit adjacent to Ridge C; (c) CTX image P12_005807_1024_XI_77S035W
overlain with colourised MOLA ~115 m/pixel DEM showing mantling by the textured deposit

ACCEPTED MANUSCRIPT
ACCEPTED MANUSCRIP
T
20
of ridge intersection A referred to in Fig.5 of Head and Hallet (2001a). Extent shown in Fig.
5. CTX image credit: NASA/JPL-Caltech/MSSS.
Sharp and broad crests were distinguished using the criteria of Bernhardt et al. (2013) for
putative eskers in Argyre Planitia, Mars, based on the cross-sectional slope at the crest.
Across-ridge CS slope (θX), in degrees (°), was calculated from the difference in distance
between successive points along the profile (dMx) and the change in elevation between
those points (dZpoint). As illustrated in Fig. 7, CS profiles were classified as broad-crested
where θX was <1° for three or more consecutive points (>~345 m), including the crest point,
accounting for >10% of the average width of the sampled ridges. Single-crested profiles with
crest slopes >1°, were classified as sharp-crested. Profiles of Zpoint viewed alongside θX
profiles (Fig. 7) confirmed effective distinction between visibly different crest morphological
types under this classification scheme. It should be emphasised that these threshold criteria
may not be directly applicable to terrestrial eskers, since differences in variables such as
gravity between Earth and Mars are likely to result in variations in the vertical expression of
the ridge crests, and by extension, the geometry that defines the threshold between ‘sharp-
crested’ and ‘broad-crested’ esker sections. Given that classification of crest morphology in
the present study is not undertaken for the purpose of comparing the raw geometries of
sharp-crested and broad-crested sections to those on Earth, but instead for testing for esker-
like differences in bed slopes occupied by sharp-crested and broad-crested sections of the
Dorsa Argentea, we consider this to be an appropriate approach.
ACCEPTED MANUSCRIPT
ACCEPTED MANUSCRIP
T
21
Table 1: Results of preliminary analysis of the effect of the textured mantling deposit upon
cross-sectional dimensions of Ridge C using a Mann-Whitney U test for difference between
sample medians. KS-test is Kolmogorov Smirnov test for normality.
Figure 7: Examples of classification of ridge crest morphological types. (a) Elevation
(coloured lines) and slope (grey lines) profiles are displayed for sharp, broad, and multiple-
crested crest morphologies. Letters refer to the start and end points of the profiles displayed
in (b) and (c). Scales are equivalent on all three plots and have vertical exaggeration of ~46.
Point spacing along profiles is ~115 m. (b) A section of Ridge D showing the locations of the
sharp-crested and broad-crested cross-sectional profiles in (a). MOLA ~115m/pixel DEM
overlain on CTX image B08_012610_1036_XN_76S018W, image credit: NASA/JPL-
Caltech/MSSS. Extent displayed in Fig. 5. (c) A section of Ridge B showing the location of
the multiple-crested cross-sectional profile in (a). MOLA ~115m/pixel DEM overlain on CTX
ACCEPTED MANUSCRIPT
ACCEPTED MANUSCRIP
T
22
image G13_023371_1065_XN_73S048W, image credit: NASA/JPL-Caltech/MSSS. Extent
displayed in Fig. 5. The reader is referred to the web-version of this article for interpretation
of the colours in this figure.

ACCEPTED MANUSCRIPT
ACCEPTED MANUSCRIP
T
23
3.6 Longitudinal change in ridge height and bed slope
In order to test the relationship between the change in ridge height and longitudinal
bed slope observed by Shreve (1985a) for terrestrial eskers, we calculated the difference
between the height of each CS profile (H1) and the height of the neighbouring up-ridge CS
profile (H0), dH. We did not perform calculations of dH across ridge intersections as changes
in ridge dimensions across esker junctions may be influenced by externally-driven changes
in meltwater discharge at a conduit confluence, potentially reducing the clarity of any
internally-controlled relationship that may exist if the Dorsa Argentea are eskers. We applied
the same exclusion for analysis of relationships of crest morphology to topography.
We calculated longitudinal bed slope (θL), in degrees, between each CS profile and the
preceding (up-ridge) CS profile based on the down-ridge change in Zbase (dZbase) and the
longitudinal distance (dML) between them. Ascending slopes are indicated by positive θL
values and descending slopes by negative values.
The assumption of a consistent bed slope between sampled CS profiles may have
overlooked sub-kilometre-scale variations in bed slope. However, the ~1 km spacing
between profiles, which is small relative to the typical widths of the sampled ridges, is likely
to have captured the basic characteristics of the surrounding topography, which has low
levels of relief.
3.7 Uncertainties
Uncertainties in measured variables arising from known instrument inaccuracies,
experimentally estimated distortion due to the projection, and methodological uncertainties
were calculated based on propagation of errors for the most extreme values in the dataset
and are displayed in Table 2. See Supplementary Material 1 for their derivation.

ACCEPTED MANUSCRIPT
ACCEPTED MANUSCRIP
T
24
Table 2: Estimations of uncertainties for calculated quantities based on propagation of errors
for the most extreme values in the dataset (see S1 for derivation).
4. Results
4.1 Planar ridge geometry
In total, we mapped ~6772 km of ridge segments (n = 720). Descriptive statistics for
segment length (Ls), mapped length (Lm) and system length (Li) are displayed in Table 3.
The distribution of Ls (Fig. 8a) is positively skewed, varying by three orders of
magnitude from ~0.2 km, up to a maximum of ~150 km, with median ~4.8 km and mean
~9.4 km (Standard Error, S.E. = 495 m). Log-transformed Ls values (log10Ls) have a normal
distribution (Kolmogorov-Smirnov, KS-value = 0.03; p-value = 0.05) (Table 3). Segments
less than 10 km in length account for ~27 % of total Lm, whilst those exceeding 50 km in
length account for ~17 %. One mapped segment exceeds 100 km in length (~150 km),
accounting for ~2 % of total Lm.
When considered as fragments of longer ridge systems (n = 206), the mapped ridges
form a total Li of ~7514 km (Table 3). Ridge systems extend up to ~314 km in length. The
minimum recorded length of 10 km is likely an artefact of the 10 km Li threshold for mapping,
although there is little visual evidence for the existence of significantly shorter ridge forms. Li
is strongly positively skewed with median ~22 km and mean ~36 km with S.E. 2764 m.

ACCEPTED MANUSCRIPT
ACCEPTED MANUSCRIP
T
25
Table 3: Descriptive statistics of planar geometry of mapped ridges
A ratio of 0.91 between total Lm and total Li indicates that the Dorsa Argentea have low
degrees of fragmentation, with gaps accounting for ~10 % of Li. On average, each ridge
system is formed of 3.5 (standard deviation, S.D. = 3.2) segments. The distribution of
continuity (C) values for ridge systems (Fig. 8b) is strongly negatively skewed with a median
of 0.94 (Table 3). Ridge systems formed of a single segment (C = 1) account for ~30 % of
mapped ridges. However, some ridge systems have higher degrees of fragmentation, with a
minimum continuity of 0.59.

ACCEPTED MANUSCRIPT
ACCEPTED MANUSCRIP
T
26
Figure 8: Distributions of planar geometries of the Dorsa Argentea: (a) boxplots of segment
length, Ls; and system length, Li, on a log10 x-axis. Boxes indicate the upper and lower
quartiles and vertical lines within boxes are median values; (b) histogram of continuity, C
(bin width is 0.1) for ridge systems (n = 206); (c) boxplots of segment sinuosity, Ss and
system sinuosity, Si, on a linear x-axis. Boxes indicate the upper and lower quartiles and
vertical lines within boxes are median values; (d) scatterplots of segment sinuosity, Ss
versus segment length, Ls and system sinuosity, Si versus system length, Li, (points) overlain
on values for the Canadian eskers (crosses) from (Storrar et al., 2014a).
ACCEPTED MANUSCRIPT
ACCEPTED MANUSCRIP
T
27
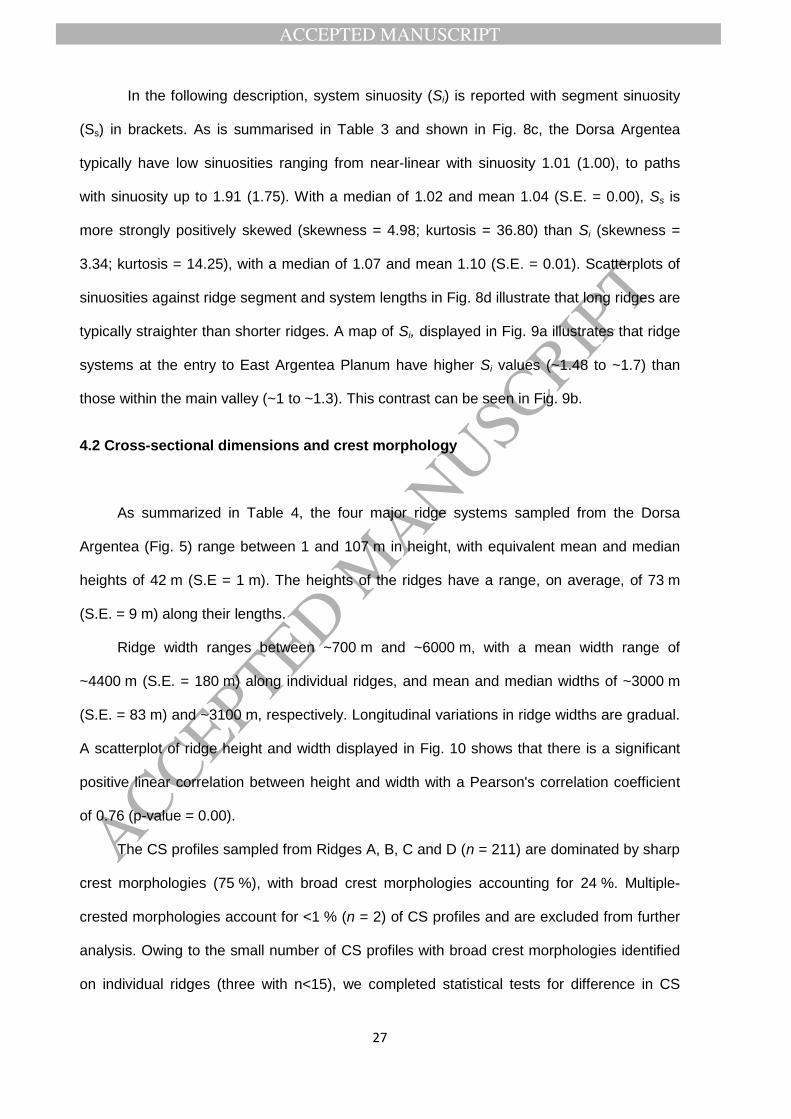
In the following description, system sinuosity (Si) is reported with segment sinuosity
(Ss) in brackets. As is summarised in Table 3 and shown in Fig. 8c, the Dorsa Argentea
typically have low sinuosities ranging from near-linear with sinuosity 1.01 (1.00), to paths
with sinuosity up to 1.91 (1.75). With a median of 1.02 and mean 1.04 (S.E. = 0.00), Ss is
more strongly positively skewed (skewness = 4.98; kurtosis = 36.80) than Si (skewness =
3.34; kurtosis = 14.25), with a median of 1.07 and mean 1.10 (S.E. = 0.01). Scatterplots of
sinuosities against ridge segment and system lengths in Fig. 8d illustrate that long ridges are
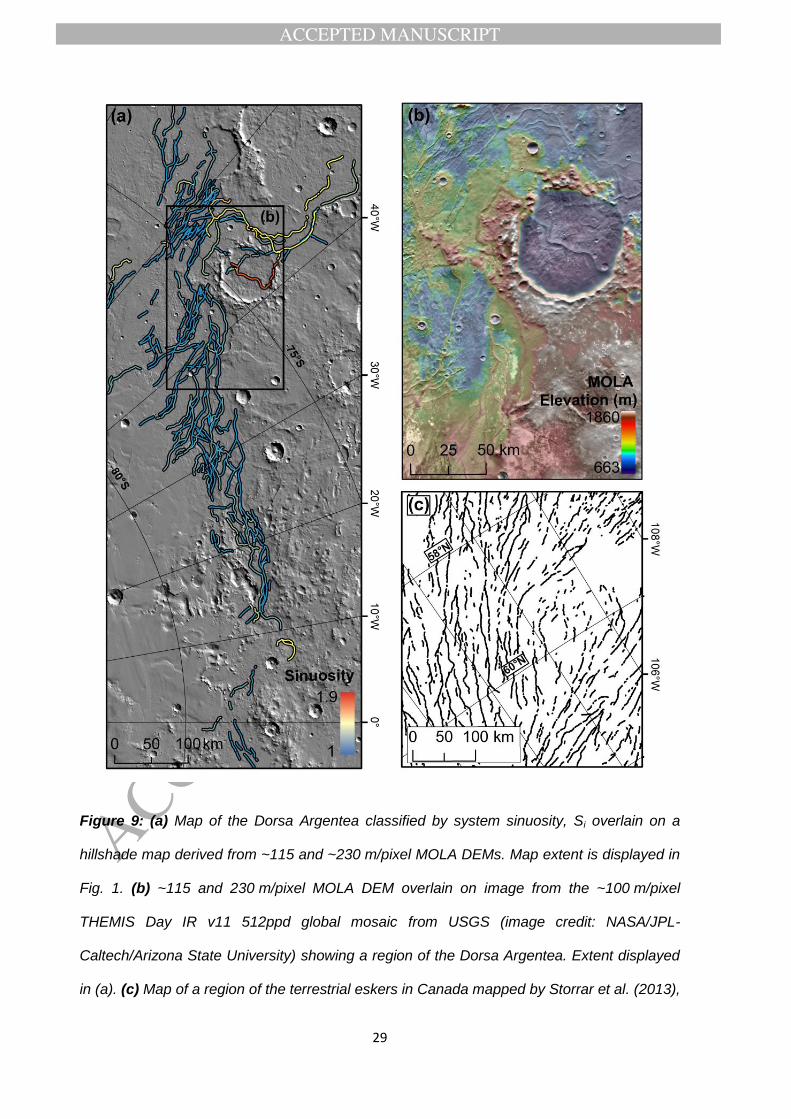
typically straighter than shorter ridges. A map of Si, displayed in Fig. 9a illustrates that ridge
systems at the entry to East Argentea Planum have higher Si values (~1.48 to ~1.7) than
those within the main valley (~1 to ~1.3). This contrast can be seen in Fig. 9b.
4.2 Cross-sectional dimensions and crest morphology
As summarized in Table 4, the four major ridge systems sampled from the Dorsa
Argentea (Fig. 5) range between 1 and 107 m in height, with equivalent mean and median
heights of 42 m (S.E = 1 m). The heights of the ridges have a range, on average, of 73 m
(S.E. = 9 m) along their lengths.
Ridge width ranges between ~700 m and ~6000 m, with a mean width range of
~4400 m (S.E. = 180 m) along individual ridges, and mean and median widths of ~3000 m
(S.E. = 83 m) and ~3100 m, respectively. Longitudinal variations in ridge widths are gradual.
A scatterplot of ridge height and width displayed in Fig. 10 shows that there is a significant
positive linear correlation between height and width with a Pearson's correlation coefficient
of 0.76 (p-value = 0.00).
The CS profiles sampled from Ridges A, B, C and D (n = 211) are dominated by sharp
crest morphologies (75 %), with broad crest morphologies accounting for 24 %. Multiple-
crested morphologies account for <1 % (n = 2) of CS profiles and are excluded from further
analysis. Owing to the small number of CS profiles with broad crest morphologies identified
on individual ridges (three with n<15), we completed statistical tests for difference in CS
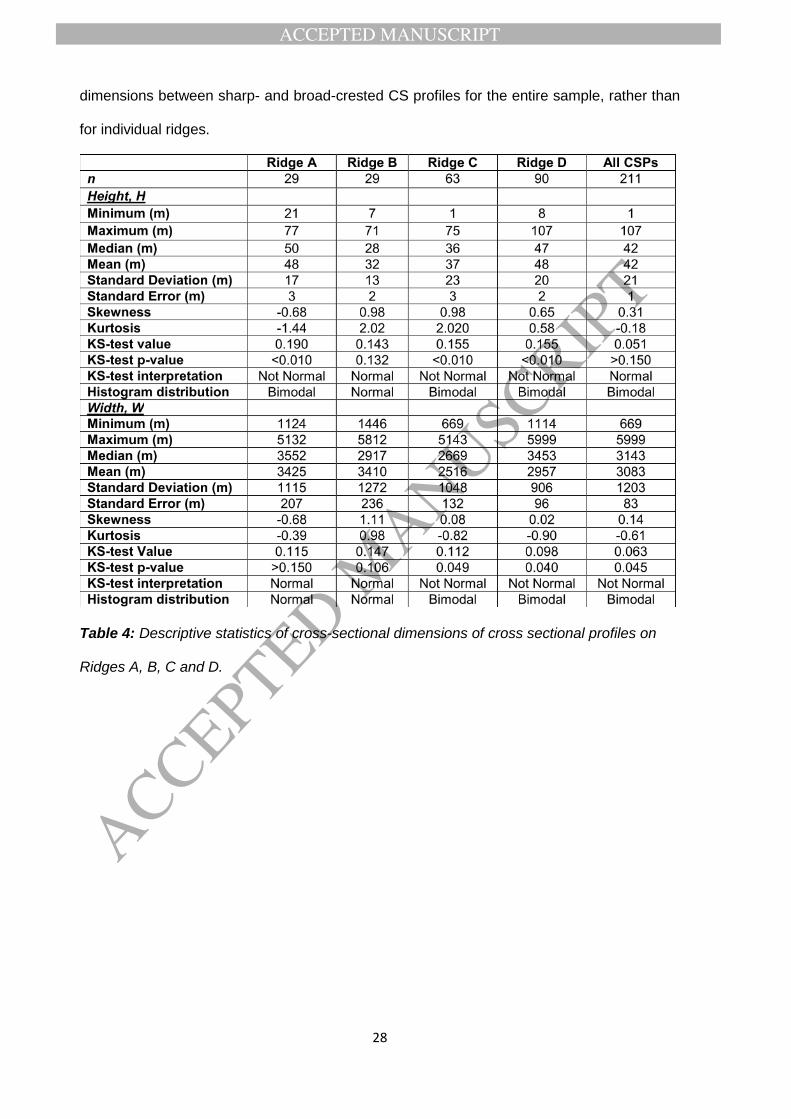
ACCEPTED MANUSCRIPT
ACCEPTED MANUSCRIP
T
28
dimensions between sharp- and broad-crested CS profiles for the entire sample, rather than
for individual ridges.
Table 4: Descriptive statistics of cross-sectional dimensions of cross sectional profiles on
Ridges A, B, C and D.
ACCEPTED MANUSCRIPT
ACCEPTED MANUSCRIP
T
29
Figure 9: (a) Map of the Dorsa Argentea classified by system sinuosity, Si overlain on a
hillshade map derived from ~115 and ~230 m/pixel MOLA DEMs. Map extent is displayed in
Fig. 1. (b) ~115 and 230 m/pixel MOLA DEM overlain on image from the ~100 m/pixel
THEMIS Day IR v11 512ppd global mosaic from USGS (image credit: NASA/JPL-
Caltech/Arizona State University) showing a region of the Dorsa Argentea. Extent displayed
in (a). (c) Map of a region of the terrestrial eskers in Canada mapped by Storrar et al. (2013),

ACCEPTED MANUSCRIPT
ACCEPTED MANUSCRIP
T
30
to which the Dorsa Argentea are compared in this study. The scale is similar to that in (a).
The reader is referred to the web-version of this article for interpretation of the colours in this
figure.
A one-tailed Mann-Whitney U test for difference in median heights (48 m and 30 m for
sharp and broad crest morphologies, respectively) (Table 5) indicates that sharp crest
morphologies typically have greater heights than broad crest morphologies, returning a
Wilcoxon value of 18552 (p-value = 0.00).
In contrast, a two-tailed t-test (unequal variances) for normally-distributed widths
indicates no significant difference in width between sharp (mean = ~3200 m; S.E. = 93 m)
and broad (mean = ~2800 m; S.E. = 183 m) crest morphologies, returning a t-value of 1.51
which is insignificant at the 95 % level (p-value = 0.134) (Table 5).
These differences in dimensions are illustrated in Fig. 10 which indicates that sharp-
crested ridge sections are generally taller relative to their widths than broad-crested
sections, with differences in width-height ratios (Table 5) primarily arising from differences in
height between crest morphological types. Significant difference in dimensions between
sharp and broad crest morphologies, illustrated in Fig. 10, confirms the classification criteria
made a meaningful distinction between crest morphological types.

ACCEPTED MANUSCRIPT
ACCEPTED MANUSCRIP
T
31
Figure 10: Scatterplot of height, H against width, W, for ridge cross-sectional profiles,
classified by crest morphological type. Error bars display uncertainties from Table 2.
ACCEPTED MANUSCRIPT
ACCEPTED MANUSCRIP
T
32
Table 5: Descriptive statistics, and Mann-Whitney U tests for difference between sample
medians, in ridge Height, H, Width, W and Width-Height Ratio between sharp and broad
crest morphological types on Ridges A, B, C and D.
4.3 Topographic relationships
The ridges commonly ascend topographic undulations up to ~100 m high (e.g. Ridge
D, Fig. 11). Fig. 11 shows that increases in bed elevation along the ridge profile are
generally associated with decreases in ridge height and vice versa, as noted by Head and
Hallet (2001a).
Simple bivariate plots of dH and θL are displayed in Fig. 12 and Pearson's correlation
coefficients of -0.691 (p-value = 0.000) and -0.770 (p-value = 0.000) for Ridges A and B,
respectively, indicate that these ridges strongly adhere to the negative correlation predicted
by Shreve (1972, 1985a) for terrestrial eskers, with increases in ridge height on downhill
slopes and decreases on uphill slopes. Ridges C and D exhibit weaker negative correlations
with Pearson’s correlation coefficients of -0.427 (p-value = 0.001) and -0.324 (p-value =
0.003) respectively.
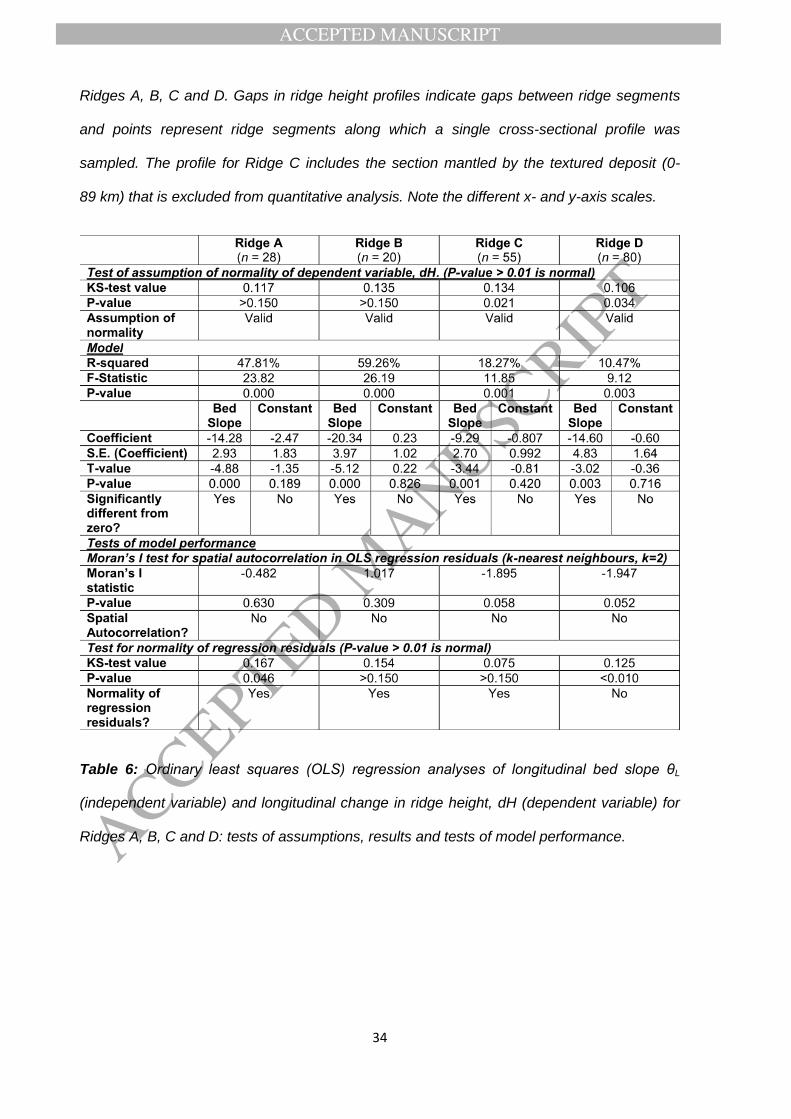
We completed univariate ordinary least squares (OLS) regression analyses of θL
(independent variable) and dH (dependent variable) for each of the ridges; the results are
displayed in Table 6. θL explains 47.81 % (p-value-value = 0.000) and 59.26 % (p-value-
value = 0.000) of the variance in dH along ridges A and B, respectively. θL is a relatively
weak predictor of dH along ridges C and D, explaining 18.27 % (p-value = 0.001) and
10.47 % (p-value = 0.003) of its variance, respectively. Regression models were evaluated
using the Moran's I statistical test for spatial autocorrelation, and a KS-test for normality, in
regression residuals (Table 6). We computed spatial weights matrices for the Moran's I test
on the basis of the euclidean distance to the centroids of the two nearest neighbouring CS
profiles. Ridges A, B, C and D do not have statistically significant spatial autocorrelation and
exhibit normality in their residuals, indicating robust model performance. Non-normality in

ACCEPTED MANUSCRIPT
ACCEPTED MANUSCRIP
T
33
Figure 11: Longitudinal plots of ridge height, H (coloured lines and points) and base
elevation, Zbase (grey lines) derived from systematically sampled cross-sectional profiles on
ACCEPTED MANUSCRIPT
ACCEPTED MANUSCRIP
T
34
Ridges A, B, C and D. Gaps in ridge height profiles indicate gaps between ridge segments
and points represent ridge segments along which a single cross-sectional profile was
sampled. The profile for Ridge C includes the section mantled by the textured deposit (0-
89 km) that is excluded from quantitative analysis. Note the different x- and y-axis scales.
Table 6: Ordinary least squares (OLS) regression analyses of longitudinal bed slope θL
(independent variable) and longitudinal change in ridge height, dH (dependent variable) for
Ridges A, B, C and D: tests of assumptions, results and tests of model performance.

ACCEPTED MANUSCRIPT
ACCEPTED MANUSCRIP
T
35
Figure 12: Scatterplots of longitudinal change in ridge height (dH) against bed slope (θL) for
cross-sectional profiles on Ridges A (n = 28), B (n = 20), C (n = 55) and D (n = 80), with
linear trend lines. Upper left quadrants represent descending slopes and increasing ridge
heights, and lower right quadrants represent ascending slopes and decreasing ridge height.
Error bars display uncertainties from Table 2.

ACCEPTED MANUSCRIPT
ACCEPTED MANUSCRIP
T
36
regression residuals for Ridge D invalidates this model, indicating that other unidentified
variables are required to explain variance in dH for this ridge. The relatively strong
topographic relationships observed for Ridges A and B justify closer assessment of the
character of these ridges.
Ridge A (Li = ~47 km) passes northwest through an infilled (~10 km diameter) crater,
traversing topographic lows in the degraded crater rim, as shown in Fig. 13a. The
topographic profile of the crest of the crater rim in Fig. 13b intersects the ridge between
sampled CS profiles at ~8 km, on the NW rim, and indicates that the ridge may have a gap
that was undetected in the systematic CS profile sample, reducing to a negligible height as it
passes over the crest. The ridge is well developed (H ≈ 50 m) over the more subdued
topography of the SE rim (~22 km along profile). Infilling of small (sub-kilometre-scale)
craters in CTX images indicate possible mantling of the ridge by a deposit (Fig. 13a) which
may distort the true dimensions and topographic relationships of the underlying ridge.
However, surface manifestation of the rims of small infilled craters indicates that this deposit
is thinner than that mantling ridges in the south (Section 3.5, Fig 6) and may therefore have
a more limited effect upon the dimensions of the underlying ridge.
Ridge B is the longest of the mapped ridge systems of the Dorsa Argentea (Li =
314 km) and appears to be unaffected by the deposit that mantles Ridge A. It is the primary
ridge passing into East Argentea Planum from the main valley, NW of Joly Crater, and has
two major tributary ridge systems, forming a branching network (Fig. 14a). Close to the entry
to East Argentea Planum, a pedestal feature, shown in Fig. 14a, extends laterally from an
outer bend in the ridge. CTX images reveal layering in the sloping sides of some ridge
sections (Fig. 14b), which may be continuous over distances of kilometres.
Equivalent medians of -0.03° in distributions of bed slopes occupied by sharp and
broad crest morphologies indicate no discernible difference in bed slopes occupied by sharp

ACCEPTED MANUSCRIPT
ACCEPTED MANUSCRIP
T
37
and broad crest morphological types. This is confirmed by a two-tailed Mann-Whitney U test,
(Table 7) which returns a statistically insignificant Wilcoxon value of 13254 (p-value = 0.964).
Figure 13 (a) Passage of Ridge A through an infilled crater (CTX images
B12_014_285_1025_XN_77S026W and B12_014351_1024_XN_77S028W, image credit:
NASA/JPL-Caltech/MSSS). Image extent is displayed in Fig. 5. (b) Topographic profile of the
crater rim derived from the ~115m/pixel MOLA DEM, passing anticlockwise from the point
marked in (a). Points on the profile that intersect Ridge A are indicated with vertical arrows.

ACCEPTED MANUSCRIPT
ACCEPTED MANUSCRIP
T
38
Figure 14: (a) Image from ~100 m/pixel THEMIS Day IR v11 512ppd global mosaic from
USGS (image credit: NASA/JPL-Caltech/Arizona State University) of a section of Ridge B
(extent displayed in Fig. 5.) showing the lateral pedestal feature (outlined). Black arrows
indicate entry of Ridge B into East Argentea Planum. The black box shows the extent of (b).
The reader is referred to the web-version of this article for interpretation of the colours in this
figure. (b) Evidence of layering structures in the side slopes of Ridge B (CTX image
G13_023371_1065_XN_73S048W, image credit: NASA/JPL-Caltech/MSSS).

ACCEPTED MANUSCRIPT
ACCEPTED MANUSCRIP
T
39
Table 7: Descriptive statistics for, and tests for difference between, longitudinal bed slopes
occupied by sharp and broad crest morphologies.
5. Analysis
5.1 Comparison to previous studies of the Dorsa Argentea
The lengths of the longest ridge systems mapped in the present study are consistent
with the upper length range (hundreds of kilometres) identified for the Dorsa Argentea by
previous workers (Howard, 1981; Metzger, 1992; Head and Pratt, 2001). Whereas previous
assessments of planar geometries of the Dorsa Argentea have primarily been dependent
upon low-resolution (~150-300 m/pixel) Viking Orbiter images, the inclusion of higher-
resolution CTX images in the integrated basemap employed within the present study allows
greater insight into the influence of shorter ridge systems upon the statistical distribution of
ridge lengths. The mean interpolated length of ridge systems in the Dorsa Argentea from the
present study (~37 km) is shorter than the lower-bounding length (~50 km) of the shortest
ridges identified by Head and Pratt (2001) and significantly shorter than the mean length of
153 km stated by Metzger (1992) for the Dorsa Argentea and putative eskers in Argyre
Planitia, combined.
The high continuity (mean = 0.91, S.E. = 0.01) of the ridge systems mapped in the
present study is similar, though slightly lower, than the average continuity of 0.97 measured
by Metzger (1992) using ~150 - 300 m/pixel Viking images. This may be attributed to the
higher resolution of images employed in the present study, which allowed better
identification of ridge gaps. Mean system sinuosity (1.10, S.E. = 0.01) is consistent with the
value of 1.2 obtained by Metzger (1992). Although Kress and Head (2015) do not define
whether their calculations of ridge sinuosity, which are based on higher-resolution data than
those of Metzger (1992), are based on ridge segments or interpolated ridge systems, their
value of mean sinuosity (~1.06) falls between those values (1.04 and 1.10, respectively)
calculated in the present study, improving confidence in the results. However, whereas

ACCEPTED MANUSCRIPT
ACCEPTED MANUSCRIP
T
40
Kress and Head (2015) assert that, on average, longer ridges in the Dorsa Argentea have
higher sinuosity, plots of ridge segment sinuosity and ridge system sinuosity against ridge
length in the present study (Fig. 8d) indicate that longer ridges generally have lower
sinuosity than shorter ridges.
The ridges sampled in the present study have heights up to 107 m and widths up to
~6 km, towards the upper range of dimensions identified by previous workers (Head and
Hallet, 2001b; Head and Pratt, 2001). Due to sampling of the longest ridges, CS dimensions
presented here (Table 4) likely represent the upper range for the Dorsa Argentea population.
Previous work has shown that the Dorsa Argentea do not consistently follow the
steepest topographic slope. Instead, they track along slopes and occasionally ascend
topographic undulations (Howard, 1981; Head and Hallet, 2001a, 2001b). In a brief
conference abstract that focussed on the relatively small region of the Dorsa Argentea
demarcated in Fig 3, Head and Hallet (2001a) identified tendencies for increases in ridge
height on descending slopes and decreases in ridge height on ascending slopes, consistent
with formation in pressurised subglacial conduits (Shreve, 1985a; Head and Hallet, 2001b).
OLS regression models of percentage longitudinal change in ridge height and bed slope for
two of the sampled ridges (Table 6) provide quantitative statistical support for these
observations. Sharp, multiple and broad crest morphological types identified within the
present study are consistent with the type 1, 2 and 3 ridge morphological types identified by
Head and Hallet (2001a) for the Dorsa Argentea. However, preferential occurrence of
multiple and broad crest morphologies on ascending slopes, compared to sharp crest
morphologies in regions of low regional slope, as identified by Head and Hallet (2001a), is
not supported by the quantitative analysis presented here. No discernible difference is found
between bed slopes occupied by ridge sections with sharp and broad crest morphologies.
The difference between our findings, and those of Head and Hallet (2001a) may be caused
by the threshold criteria selected in this study to distinguish between sharp and broad crest
morphologies. It could also show that the relationship is weaker than that study suggests.
CTX images reveal a textured deposit which extends from the gradational boundary of the
ACCEPTED MANUSCRIPT
ACCEPTED MANUSCRIP
T
41
Amazonian polar undivided unit (Tanaka et al., 2014a) and mantles the specific ridge
sections to which Head and Hallet (2001a) refer (Fig. 6c). This mantle significantly alters the
dimensions of the ridges (Table 1) and may also affect their crest morphology. Draping of
this mantle over underlying topography may broaden the surface expression of the
underlying ridge as it passes over a topographic obstacle, particularly if that topographic
obstacle is oriented perpendicular to the path of the ridge, as in the example used by Head
and Hallet (2001a) (Fig. 6c). This suggests the relationship between ridge crest morphology
and bed topography for the Dorsa Argentea may not be as strong as previously suggested.
5.2 Previous comparisons to terrestrial esker analogues
Comparisons of planar geometries of the Dorsa Argentea to terrestrial esker
analogues have previously been limited by a paucity of quantitative data for a large (ice-
sheet-scale) sample of terrestrial eskers. As a result, previous studies have been limited to
comparison of geometries of the Dorsa Argentea to simple descriptions of planar geometries
of relatively small esker assemblages such as an assemblage of 130 eskers in New York
State, USA (Metzger, 1992, 1991; Kargel and Strom, 1992), and the Katahdin esker system
in Maine, USA (Kargel and Strom, 1992; Head, 2000a; Head and Hallet, 2001a, 2001b;
Head and Pratt, 2001; Kress and Head, 2015), which comprises one major esker with five
tributaries (Shreve, 1985a).
Metzger (1991, 1992) identified similarities in sinuosity between terrestrial eskers in
New York State, USA and the Dorsa Argentea. These similarities have more recently been
corroborated by Kress and Head (2015). However, Metzger (1991, 1992) acknowledge that
the lower average length (~8.2 km) and continuity (~64 %) of these terrestrial eskers, relative
to the Dorsa Argentea, limits their applicability as analogues.
In a comparison to morphological descriptions by Brennand (2000) of eskers formed
beneath the Laurentide Ice Sheet, Kress and Head (2015) support similarities in planform
map patterns, dimensions and sinuosity between long, sinuous and continuous ridges of the
ACCEPTED MANUSCRIPT
ACCEPTED MANUSCRIP
T
42
Dorsa Argentea and terrestrial eskers formed in efficient channelised subglacial drainage
conduits (R-channels, see Section 2.1).
However, they also distinguish a second population of ridges in the Dorsa Argentea
which are shorter (kilometres to tens of kilometres in length) and more polygonal in their
configuration than the long, sinuous and continuous ridges, and occur in regions between
them. They propose that these ridges were formed by deposition in less efficient, ‘slow’
drainage systems (Fountain and Walder, 1998) in inter-R-channel areas of the bed. In ‘slow’,
or ‘distributed’ drainage networks, water flows along narrow orifices between linked basal
cavities which form as a result of glacial flow over topographic irregularities in the bed
(Kamb, 1987). Terrestrial analogues for eskers formed in distributed systems do not exist,
since eskers, by definition, form in channelised drainage systems rather than distributed
systems. The most similar terrestrial eskers to which Kress and Head (2015) refer are short
and deranged type III eskers as classified by Brennand (2000). The drainage systems in
which these eskers form are characterised by short R-channels draining into interior lakes or
channels incised into the bed (Brennand, 2000), and are therefore different to the distributed
networks in which Kress and Head (2015) propose the shorter, polygonal ridges of the Dorsa
Argentea formed.
The recent survey by Storrar et al. (2014a) of >20 000 terrestrial eskers in Canada
provides the most extensive and detailed quantitative characterisation of terrestrial eskers to
date. This provides a new opportunity for more detailed quantitative comparison of planar
geometries of the Dorsa Argentea to terrestrial esker analogues. Although it is possible that
the ice-sheet scale survey presented by Storrar et al. (2014a) may comprise eskers formed
in heterogeneous drainage configurations over the bed of the Laurentide Ice Sheet, no such
distinctions were made. Therefore, in absence of a terrestrial analogue to eskers formed in
distributed networks, the present study does not distinguish between the long, sinuous and
continuous, and short polygonal ridge populations described by Kress and Head (2015). The
10 km threshold for mapping means that the sample of Dorsa Argentea ridges is likely to be
dominated by the population of longer ridges. The Dorsa Argentea may represent a single

ACCEPTED MANUSCRIPT
ACCEPTED MANUSCRIP
T
43
sector of a formerly more extensive south polar ice sheet on Mars beneath which several
populations of putative eskers formed (Kress and Head, 2015), whereas the data for the
Canadian eskers represents the population at the scale of an entire ice sheet. Therefore, if
processes of formation of the Canadian eskers and the Dorsa Argentea are similar, the
planar geometries of the Dorsa Argentea may be expected to fall within the range of
geometries represented by the Canadian eskers.
No large-scale quantitative characterisation similar to that of Storrar et al. (2014a) has
yet been completed for cross-sectional characteristics of a large sample of terrestrial eskers.
Therefore, comparison of quantitative characterisations of CS dimensions and crest
morphology of the Dorsa Argentea to terrestrial analogues remains limited to relatively
simple descriptions provided in smaller-scale terrestrial studies such as that of Shreve,
(1985a) for the Katahdin esker system in Maine. Whilst the heights of the Dorsa Argentea
are of the order of those of the Katahdin esker system, the Dorsa Argentea typically have
widths an order of magnitude greater (1000s metres) and therefore significantly lower CS
slopes, limiting its applicability for direct comparison of ridge cross-sectional dimensions.
However, given that Shreve (1985a) explains topographic relationships for esker CS
dimensions and crest morphology of the Katahdin esker system in terms of glacier physics,
the Katahdin esker system remains as a suitable analogue with which to compare tests of
these relationships for the Dorsa Argentea, assuming that the physics of meltwater flow in
glaciers can be translated to Mars. Therefore, while quantitative characterisations of CS
dimensions and crest morphology may provide useful comparison to large-scale analyses of
CS-dimensions and crest morphologies of terrestrial eskers in the future, their primary
contribution to the present study is in tests for esker-like longitudinal changes in ridge CS
dimensions and crest morphology with bed slope.
ACCEPTED MANUSCRIPT
ACCEPTED MANUSCRIP
T
44
5.3 Comparison to terrestrial analogues
Planar geometry statistics for the Dorsa Argentea are compared with those of
>20 000 terrestrial eskers in Canada (Table 8, Fig. 9c). Whilst segment lengths of Dorsa
Argentea are typically two to three times those of the Canadian eskers, the interpolated
length of the longest ridge system of the Dorsa Argentea (Li ~314 km) is less than half that of
the longest Canadian esker system (760 km).
Lengths of individual ridge segments of the Dorsa Argentea have a similar log-normal
distribution to that of Canadian esker segments, which Storrar et al. (2014a) attribute to
fragmentation of esker systems into shorter segments. The weaker positive skew of the
distribution of segment lengths for the Dorsa Argentea may result from the difference in
continuity between the Dorsa Argentea (0.91) and the Canadian eskers (0.65). The
similarities in statistical distributions of ridge length indicate that the ice-sheet scale data for
the Canadian eskers can be appropriately compared to possible ice-sheet-sector scale data
in tests of the esker hypothesis for the Dorsa Argentea.
Mean sinuosity of ridge segments in the Dorsa Argentea (1.04, S.E. = 0.00) is similar
to that of Canadian eskers (1.06) (Storrar et al., 2014a). Interpolated ridges of the Dorsa
Argentea also have similar mean sinuosity (1.10, S.E. = 0.01) to the Canadian eskers (1.08).
The small difference between these values may reflect the lower proportion of the length of
the Dorsa Argentea that is accounted for by linearly interpolated gaps, owing to their higher
continuity. Lower sinuosity of ridge segments relative to interpolated ridges is an outcome of
fragmentation of more sinuous ridges into shorter, straighter segments (Storrar et al.,
2014a). The maximum sinuosity observed for the Dorsa Argentea (1.91) falls within the
upper bound of sinuosity recorded for the Canadian eskers (2.45, Table 8).

ACCEPTED MANUSCRIPT
ACCEPTED MANUSCRIP
T
45
Table 8 Comparison of planar geometry statistics for the Dorsa Argentea with those
published by Storrar et al. (2014a) for terrestrial eskers in Canada. Data in column 1 is from
Storrar et al. (2014a).
Plots of sinuosity and ridge length for the Dorsa Argentea are more consistent with
those presented by Storrar et al. (2014a) for the Canadian eskers (Fig. 8d) than with the
assertion of Kress and Head (2015) that longer (>50 km) ridges of the Dorsa Argentea are
more sinuous than shorter ridges.
The mean height (42 m, S.E = 1 m) for the sampled ridges is similar to heights of the
largest terrestrial eskers (Shreve, 1985a; Clark and Walder, 1994). The positive correlation
between ridge height and ridge width (Fig. 10) is similar to that observed by Storrar et al.
(2015) for eskers on the foreland of Breiðamerjökull in Iceland, although width-height ratios
are greater for the Dorsa Argentea. Although their mean width (3083 m, S.E = 83 m) is an
order of magnitude greater than widths of typical terrestrial eskers (Shreve, 1985a; Clark and
Walder, 1994), kilometre-scale widths have been observed for some terrestrial eskers
(Banerjee and McDonald, 1975). Paleo-eskers in Mauritania have widths up to 1.5 km and
heights between 100 and 150 m (Mangold, 2000). Many terrestrial eskers have significantly
lower width-height ratios and, by extension, steeper side slopes than those observed for the

ACCEPTED MANUSCRIPT
ACCEPTED MANUSCRIP
T
46
Dorsa Argentea. For example, eskers with mean lengths of tens of metres on the foreland of
Breiðamerjökull in Iceland typically have widths only five times greater than their heights,
both of which are typically <10 m, yielding average side slopes of ~11° (Storrar et al., 2015).
However, given that the maximum length of these eskers (684 m) is significantly shorter than
the lengths and widths of the Dorsa Argentea ridges sampled in the present study, they may
not serve as suitable analogues. Furthermore, some terrestrial eskers have side slopes of a
similar magnitude (<4°) to those observed for the Dorsa Argentea (Fig. 7a). According to
Shreve (1985a), broad-crested eskers in eastern Maine have typical widths of ~600 m and
heights of ~10 m. This yields an average side slope of ~1.9° which is within the range of side
slopes observed for the Dorsa Argentea (Fig. 7a). The Peterborough esker in Canada has a
maximum width of 1 km and a maximum height of 20m (Banerjee and McDonald, 1975),
yielding a maximum average side slope of 2.3° at the widest point. As highlighted by Shreve
(1985a), such ridge sections may not be distinguishable on the ground from other positive-
relief landforms with low slopes, such as fans and deltas.
Statistical tests indicate that three of four of the Dorsa Argentea ridges exhibit
statistically significant decreases in ridge height on ascending bed slopes and increases in
ridge height on descending bed slopes, akin to the relationship described by Shreve (1985a)
for the Katahdin esker system. The observed reduction to near-negligible height of Ridge A
as it traverses the crest of a degraded crater rim (Fig. 13b), is consistent with observations of
the Katahdin esker system as it passes over topographic obstacles (Shreve, 1985a).
Similarly to the terrestrial Katahdin esker system (Shreve, 1985a), sharp crest
morphologies dominate the ridge systems sampled from the Dorsa Argentea. Significant
differences in height between ridge sections characterised by sharp and broad crest
morphologies are similar to those observed for terrestrial eskers. However unlike in the
Katahdin system, no significant difference is found in the present study between bed slopes
occupied by sharp- and broad-crested sections of the Dorsa Argentea ridges.

ACCEPTED MANUSCRIPT
ACCEPTED MANUSCRIP
T
47
6. Discussion
6.1 Planar ridge geometry
The considerably higher continuity of the Dorsa Argentea relative to the Canadian
eskers has several possible explanations. The lower resolution of the ~15 to ~30 m Landsat
7 Enhanced Thematic Mapper + (ETM+) images used by Storrar et al. (2013) to map the
Canadian eskers may have resulted in exclusion of small esker segments in ridge gaps,
thereby resulting in lower continuity values. However, it is unlikely that this provides the
primary explanation for the great difference in continuity between the two ridge populations.
The very low erosion rates of 0.02-0.03 nanometres per year that have prevailed on Mars
since the formation of the Dorsa Argentea are several orders of magnitude lower than
terrestrial erosion rates (Carr and Head, 2010), thereby potentially limiting the degree of
post-formation fragmentation that may have occurred relative to the more fragmented eskers
in Canada. A third explanation may be differences in their mechanism of formation, as will
now be discussed.
The spatio-temporal nature of esker formation is a topic of ongoing debate within the
terrestrial literature (e.g., Banerjee and McDonald, 1975; Brennand, 1994; Brennand and
Shaw, 1996; Punkari, 1997; Brennand, 2000; Mäkinen, 2003; Hooke and Fastook, 2007;
Storrar et al., 2014a). Explaining the formation of terrestrial eskers by synchronous
deposition in long, continuous R-channels is complicated by a tendency for instability of
these conduits beneath thick ice towards the interior of a glacier or ice sheet, which may
preclude long-term sediment accumulation (Röthlisberger, 1972; Hooke and Fastook, 2007).
Reduced discharge through subglacial R-channels, for example due to winter cessation of
meltwater production, may cause periodic shutdown of R-channels extending towards the
ice interior as opposition to ice creep closure by conduit water pressure is weakened
(Hubbard and Nienow, 1997; Benn and Evans, 2010). Furthermore, negative temperature
gradients between pressurised and geothermally-heated ice at the bed, and the surface of
non-temperate ice masses, are steepened by the vertical growth of meltwater conduits at the
ACCEPTED MANUSCRIPT
ACCEPTED MANUSCRIP
T
48
bed. This may result in more rapid conduction of heat to the overlying ice from the roof of the
conduit, which exists at the pressure-melting point, thereby damping roof melting. Unless a
critical threshold of viscous heat production (which is proportional to discharge) is reached at
the conduit roof, formation of R-channels beneath thick ice may be inhibited (Hooke and
Fastook, 2007). However, as the overlying ice thins towards the terminus, the temperature
gradient between the base of the ice and its surface approaches zero and the damping of
conduit growth theorised by Hooke and Fastook (2007) reduces, allowing growth of R-
channels and sedimentation to occur, forming eskers. Therefore, many authors (e.g.,
Banerjee and McDonald, 1975; Punkari, 1997; Mäkinen, 2003; Hooke and Fastook, 2007;
Storrar et al., 2014a) argue that long eskers may form by a time-transgressive mechanism,
whereby eskers progressively extend up glacier as the thin terminal zone of an ice sheet
retreats across the landscape. Eskers are most likely to form during periods of relative
stability in the position of the ice terminus. During periods of more rapid retreat, the time
available for esker sedimentation at the margin is more limited, resulting in gaps between
esker segments (Storrar et al., 2014a).
Storrar et al. (2014a) support time-transgressive formation in temporally and spatially
stable conduits at the retreating ice margin of an active ice sheet as the most likely
explanation for the great length (>100 km) of many Canadian eskers. They suggest that the
relationship between ridge length and sinuosity observed for the Canadian eskers (Fig. 8d)
provides support for this formation mechanism. They theorise that pressurised water in long
conduits extending into the interior of an ice sheet tends to follow straighter paths than water
closer to atmospheric pressure in shorter conduits at a receding ice margin, where ice is
thinner and bed topography exerts a stronger control over water flow (Storrar et al. 2014a).
If this theorised relationship is correct, the similar relationship between sinuosity and
ridge segment and system lengths observed for the Dorsa Argentea (Fig. 8d) may therefore
support time-transgressive formation at a retreating ice margin (Storrar et al., 2014a). Hooke
and Fastook (2007) presented a theoretical mechanism by which segments of eskers formed
ACCEPTED MANUSCRIPT
ACCEPTED MANUSCRIP
T
49
during sequential stages of ice retreat may align and potentially form continuous unbroken
ridges. However, the continuity of the Dorsa Argentea ridges is extremely high and may be
inconsistent with formation at a mobile ice margin, the position of which may fluctuate and
result in post-depositional fragmentation of esker sediments (Brennand, 2000; Storrar et al.,
2014a). As is argued by Kress and Head (2015), the high continuity may be more consistent
with type 1 terrestrial eskers described by Brennand (2000), formed synchronously in long,
stable R-channels extending from the interior of a former, likely stagnant, ice sheet and
terminating in a standing water body at its margin. Maintenance of high conduit water
pressures through hydraulic damming from a proglacial water body, downstream blockage
by localised sediment damming or channel shutdown, or maintenance of discharge
exceeding the threshold for conduit collapse may provide mechanisms promoting long-term
stability of long, esker-forming R-channels beneath thick ice. Ice surface slopes of ~0.06°
reconstructed from the paths of the Dorsa Argentea by Scanlon and Head (2015),
geomorphological evidence for a paleolake in Argentea Planum (Head and Pratt, 2001), and
evidence for fan-forms at the termini of ridges entering this region (Scanlon and Head, 2015)
are consistent with this mode of formation. Furthermore, no moraine-like ridges representing
the locations of successive still-stands of the terminus of an ice sheet have been identified
within the Dorsa Argentea, suggesting that ice may not have retreated across the region of
the Dorsa Argentea while wet-based conditions existed that may have been capable of
mobilising moraine-forming sediments. We observe consistently low sinuosity of both long
and short ridges in the main basin (Fig. 9a), and higher sinuosity of the northernmost ridges
(including Ridge B) at the entry to East Argentea Planum (Fig. 9a, Fig. 9b). We suggest that
this may indicate that ridges in the main basin formed beneath thick ice towards the interior
of a former DAF ice sheet and that the northernmost ridges may have formed closer to a
stable former ice margin, supported by their proximity to a putative proglacial paleolake in
Argentea Planum (Head and Pratt, 2001). Ridge B is similar in length to the >300 km-long
type 1 (Brennand, 2000) “Haricana interlobate moraine”, or “Abitibi esker”, in Quebec
(Brennand and Shaw, 1996). Although Ridge B does not terminate in the region of the

ACCEPTED MANUSCRIPT
ACCEPTED MANUSCRIP
T
50
putative paleolake (Head and Pratt, 2001), ponding of meltwater in the basin of East
Argentea Planum where it does terminate, is viable. A valley at the distal end of East
Argentea Planum may provide evidence for drainage of large volumes of water from this
basin, although the existence of this valley-feature is contested (Tanaka and Kolb, 2001;
Head and Pratt, 2001; Ghatan and Head, 2004; Fastook et al., 2012; Tanaka et al., 2014a).
Meltwater discharges of the order of 103-105 m3s-1 reconstructed from ridge geometry by
Scanlon and Head (2015) are within the range observed for ice sheet flood discharges on
Earth (Lewis et al., 2006) and, if sustained, could allow channel persistence even in the
absence of a proglacial water body. Stagnation of the overlying ice and mass-loss by
subsequent downwasting, as suggested by previous workers who interpret the Dorsa
Argentea as eskers (Metzger, 1991; Head and Pratt, 2001; Scanlon and Head, 2015), could
provide a further explanation for stability of long esker-forming R-channels (Brennand,
2000). Emergence of very well-preserved eskers from stagnant, downwasting ice has been
observed at Malaspina Glacier in Alaska (Gustavson and Boothroyd, 1987).
However, despite detailed investigations of the geomorphology and sedimentology of
terrestrial eskers (e.g., Brennand, 1994; Brennand and Shaw, 1996; Brennand, 2000;
Mäkinen, 2003), great uncertainty remains over the nature of sedimentation of long
terrestrial eskers. The present inability to investigate the internal structure of the Dorsa
Argentea means that we cannot conclude with certainty that, if the Dorsa Argentea are
eskers, they formed either by synchronous or time-transgressive deposition. However, the
evidence obtained in this and previous studies of the Dorsa Argentea suggests synchronous
deposition may be more likely.
Shorter ridge segments between and adjacent to longer, often braided or branching
ridges (Fig. 5) of the Dorsa Argentea could be remnants of shorter drainage pathways from
which water was scavenged along hydraulic potential gradients towards longer, lower-
pressure conduits nearby during development of the drainage network (Shreve, 1972;
Storrar et al., 2014a). Testing of the hypothesis proposed by Kress and Head (2015) that this

ACCEPTED MANUSCRIPT
ACCEPTED MANUSCRIP
T
51
adjacent network was akin to distributed glacier drainage systems on Earth is beyond the
scope of the present study, considering the lack of terrestrial analogues of ridges of
sediment formed in such systems.
6.2 Cross-sectional dimensions and crest morphology
The significant difference in height between sharp-crested (mean = 46 m; S.E. = 2 m)
and broad-crested (mean = 30 m; S.E. = 3 m) sections of the Dorsa Argentea indicates that
variation in crest morphology along ridge profiles likely reflects original features of the ridges.
Post-depositional erosion, which on Earth causes rounding of terrestrial inverted channels
and can result in similar morphology to terrestrial eskers (Burr et al., 2009) may only account
for ~<1 m of the observed height difference between broad- and sharp-crested sections of
the Dorsa Argentea, given typical rates of erosion that have prevailed since the time of their
formation (Carr and Head, 2010). Lower aspect ratios of sharp- relative to broad-crested
sections are largely an outcome of differences in ridge height. According to Shreve’s (1985a)
theory of esker formation, greater sensitivity of roofs of subglacial conduits to changes in the
energy available for melt leads to higher rates of melting and freezing than at the conduit
walls. This differential sensitivity to melt may explain the differences in aspect ratio between
sections of the Dorsa Argentea with sharp and broad crest morphologies.
6.3 Topographic Relationships
Melt regimes in terrestrial subglacial conduits are predicted to change to regimes of
wall freezing on bed slopes ~1.7 times the ice surface slope (Shreve, 1972, 1985a). Under
an ice surface slope of ~0.06 ° reconstructed by Scanlon and Head (2015) for the Dorsa
Argentea, this transition would be expected to occur on bed slopes of ~0.01°, assuming this
relationship holds on Mars. Statistically insignificant t-values for the constants of the
regression models (Table 6) confirm that the transition between increases and decreases in
height occurs on approximately level bed slopes around the origin of the scatterplots in Fig.
12. Such a low critical threshold of transition between melting and freezing regimes could
explain the low proportion of CS profiles with multiple-crested CS morphologies (<1 %).
ACCEPTED MANUSCRIPT
ACCEPTED MANUSCRIP
T
52
Reduction to near-negligible height of Ridge A as it traverses the crest of a degraded crater
rim (Fig. 13b) may be explained by a combination of weakening of conduit roof melting, and
increases in sediment transport capacity in an esker-forming conduit at the crest of the crater
rim due to depression of contours of hydraulic equipotential (Fig. 2) (Shreve, 1972, 1985a).
The lack of discernible difference in bed slopes occupied by sharp and broad crest
types may be an outcome of gradual (as opposed to immediate) transitions between crest
morphological types when bed slope reaches the critical slope for morphological transition of
the ridge crest under the esker hypothesis. Given the low topographic slopes over which the
Dorsa Argentea pass, and the significant difference in height between ridge sections with
sharp and broad crest morphologies, this explanation is not inconceivable. However,
alteration of ridge dimensions (and potentially morphology) by a mantle which drapes certain
ridge sections (excluded from the present study) upon which Head and Hallet (2001a) based
their assertion of a relationship between bed topography and ridge crest morphology (Fig.
6c), highlights the requirement for further tests for this relationship.
Further assessment of the processes responsible for formation of different crest
morphologies along the ridges may be possible with improvements in the coverage of high-
resolution (~0.3-1.25 m/pixel) images and High-resolution Imaging Science Experiment
(HiRISE) or CTX DEM products. Strong stratification of sediments in terrestrial eskers with
sharp crest morphologies contrasts with well sorted, massive deposits typical of broad-
crested sections. This has been related to changes in deposition conditions in response to
topography (Shreve, 1972, 1985a; Brennand, 2000). Well-developed kilometre-scale
layering structures in the sloping sides of Ridge B therefore provide potential for tests for
differences in formation conditions between sharp-crested and broad-crested sections of the
Dorsa Argentea in future assessment of the esker hypothesis.

ACCEPTED MANUSCRIPT
ACCEPTED MANUSCRIP
T
53
6.4. Lateral Pedestal Feature
The lateral pedestal feature identified on the outer bend of a section of Ridge B (Fig.
14.) may be considered as evidence to support the alternative hypothesis that the Dorsa
Argentea are inverted channels (Tanaka and Kolb, 2001; Tanaka et al., 2014b).
Inverted channels are ridges formed by differential erosion between resistant deposits
infilling fluvial channels and more erodible material in the surrounding region. Resistant
channel infill may consist of chemically cemented sediments, coarse-grained fluvial lag
deposits or lava flows (Williams et al., 2007; Burr et al., 2009). Terrestrial inverted channels
such as those in Utah, USA (Williams et al., 2007) have diverse crest morphologies, ranging
from flat-topped plateaus with steep side escarpments, to multilevel ridge configurations
where the inverted channel sits atop a broader exhumed pedestal ridge (Burr et al., 2009,
Fig. 13). In inverted fluvial systems, such pedestals may form as an outcome of a differential
in resistance to erosion between channel infill and finer overbank deposits. The
interpretation of the Dorsa Argentea as inverted channels (Tanaka and Kolb, 2001; Tanaka
et al., 2014b), which is a modification of the lava-flow hypothesis of Tanaka and Scott (1987)
is based upon interpretation of lobate fronts at the margins of the DAF as evidence of its
formation by flows of fluidised regolith. Flows could have been mobilised by expulsion of
subsurface accumulations of water and CO2, triggered by impact events, or seismic or
intrusive magmatic activity (Tanaka and Kolb, 2001; Ghatan and Head, 2004) during the
Hesperian period, which was characterised by extensive resurfacing by volcanic activity
(Carr and Head, 2010; Tanaka et al., 2014b). The shield and cone structures of the
Hesperian polar edifice unit, which exists in several outcrops within the DAF, (Fig. 1)
(Tanaka et al., 2014a) may represent vent sources for this cryovolcanic material (Tanaka
and Kolb, 2001; Ghatan and Head, 2004; Tanaka et al., 2014b).
Tanaka and Kolb (2001) suggest that the Dorsa Argentea formed as '…smaller
eruptions of volatile-rich material … resulted in narrow, sinuous channel deposits within
aggrading fine-grained unconsolidated material perhaps produced by gaseous discharge of
subsurface volatiles' (Tanaka and Kolb, 2001, p. 3) which subsequently underwent erosion

ACCEPTED MANUSCRIPT
ACCEPTED MANUSCRIP
T
54
at a greater rate than the more resistant channel infill, leading to inversion of the channel
topography. Tanaka and Kolb's (2001) study employs images from the Mars Orbiter Camera
at ~1.5-12m/pixel., which is the highest resolution dataset used to date in analysis of the
Dorsa Argentea.
Distinction between the inverted channel and glacial esker hypotheses for the origin of
the Dorsa Argentea is limited by the fact that, over time, erosional rounding of the ridge form
(Williams et al., 2007) introduces difficulties in distinguishing between inverted fluvial
channels and eskers on the basis of visual assessment alone (Burr et al., 2009). However,
when considered alongside previous studies that weaken the inverted channel hypothesis
(e.g., Howard, 1981; Ruff and Greeley, 1990; Head, 2000a; Head and Pratt, 2001) we argue
that the rigorous statistical testing of planar geometry, morphology and topographic
relationships for the Dorsa Argentea presented in the present study strengthens the
hypothesis that the Dorsa Argentea are eskers. Therefore, it is proposed that the lateral
pedestal feature identified on Ridge B (Fig. 14) may be analogous to lateral fans occurring
predominantly on the outer bends of eskers in south-central Ontario (Brennand, 1994). As
the major ridge passing into East Argentea Planum (Fig. 5), Ridge B may represent the main
drainage pathway funnelling meltwater from the Argentea Planum catchment of a former
DAF ice sheet. Intrusion of water into cavities in the surrounding basal ice as water pressure
exceeded ice overburden under high discharges (Brennand, 1994) on this major drainage
pathway is tentatively proposed as an explanation for the pedestal. HiRISE data would allow
assessment of the sedimentary properties and stratigraphic relationships of this pedestal
feature in order to further test this hypothesis.
6.5 Implications
A growing body of literature uses the esker interpretation as a basis for inferences
about the character of a putative former ice sheet thought to have extended into the region
of the Dorsa Argentea during Mars’ Hesperian period (~2.7-~3.55 Ga), despite a lack of
detailed quantitative comparison with a large sample of terrestrial eskers or rigorous

ACCEPTED MANUSCRIPT
ACCEPTED MANUSCRIP
T
55
statistical tests for esker-like topographic relationships (e.g., Howard, 1981; Kargel and
Strom, 1992; Kargel, 1993; Head, 2000a, 2000b; Head and Pratt, 2001; Ghatan and Head,
2004; Scanlon and Head, 2015; Kress and Head, 2015). The more rigorous quantitative and
statistical analysis of the Dorsa Argentea presented here, and comparison with a large
sample of terrestrial eskers, improves confidence that the Dorsa Argentea are eskers formed
by deposition of sediment in subglacial meltwater conduits. In the present day, as throughout
most of the present Amazonian period on Mars, mean annual south polar surface
temperatures of -100°C preclude basal melting of the cold-based polar ice deposits that
remain (Fastook et al., 2012). Evidence for drainage beneath a former ice sheet therefore
provides insight into the history of glaciation and its response to climate changes on Mars,
thought to be associated with variations in planetary obliquity (Souness and Hubbard, 2012).
The implications of evidence for a formerly more extensive south polar ice sheet for past
environmental changes on Mars are discussed in detail by Head and Pratt (2001), Fastook
et al. (2012), Scanlon and Head (2015) and Kress and Head (2015). The new quantitative
characterisations of the Dorsa Argentea contained within this study may provide useful
constraints for parameters in modelling studies of this putative former ice sheet, its
hydrology, and mechanisms that drove its eventual retreat.
Subglacial meltwater production supports the potential for former habitability of glacial
environments on Mars. Glaciofluvial deposits may represent ancient fossilization
environments, providing a focus for targeted exploration for evidence of life on Mars (Head
and Pratt, 2001).
7. Conclusion
This study supports the hypothesis that the Dorsa Argentea are eskers formed by
deposition in subglacial meltwater channels beneath a former DAF ice sheet.
Statistical distributions of lengths and sinuosities of the Dorsa Argentea are similar to
those recently quantified by Storrar et al. (2014a) for terrestrial eskers formed during

ACCEPTED MANUSCRIPT
ACCEPTED MANUSCRIP
T
56
deglaciation of the Laurentide Ice Sheet. Small deviations in the similarities for the two
populations may be (at least partially) accounted for by differences in their degree of
fragmentation arising from different regimes of erosion between Earth and Mars. Low levels
of fragmentation and higher ridge sinuosity of the northernmost ridges in the DAF may
support synchronous formation of the ridges in subglacial conduits extending towards the
interior of an ice sheet that thinned towards its northern margin, perhaps terminating in a
proglacial lake. This contrasts with the time-transgressive mode of formation proposed by
Storrar et al. (2014a) for the Canadian eskers. However, debate over time-transgressive and
synchronous deposition mechanisms for the formation of terrestrial eskers is ongoing and
detailed sedimentological analyses of internal structure of the ridges would be required to
corroborate arguments in support of either of these mechanisms for formation of the Dorsa
Argentea.
Significant differences in cross-sectional dimensions of ridge sections with sharp and
broad crest morphologies provide support for differences in conditions of formation along the
lengths of individual ridges. Rigorous quantitative tests of previously observed relationships
between ridge height and longitudinal bed slope, similar to those explained by the physics of
meltwater flow through subglacial meltwater conduits for terrestrial eskers (Shreve, 1972,
1985b; Head and Hallet, 2001a), confirm the statistical significance of these relationships for
three of four major Dorsa Argentea ridges.
The new quantitative characterisations of the Dorsa Argentea contained within this
study may provide useful constraints for parameters in modelling studies of this putative
former ice sheet, its hydrology, and mechanisms that drove its eventual retreat.
8. Acknowledgements
FEGB is funded by STFC grant ST/N50421X/1 and is grateful for bursaries provided
by The Open University, The Ogden Trust and the British Society for Geomorphology. SJC

ACCEPTED MANUSCRIPT
ACCEPTED MANUSCRIP
T
57
was funded by a Leverhulme Trust Grant RPG-397. We would like to thank Peter Fawdon
for his technical advice. We are grateful to RD Storrar for providing raw data for the
Canadian eskers, and to both RD Storrar and H Bernhardt for their insightful reviews of the
manuscript.
References
Anderson, R.S., Anderson, S.P., 2010. Geomorphology: the mechanics and chemistry of landscapes. Cambridge University Press, Cambridge.
Banerjee, I., McDonald, B.C., 1975. Nature of Esker Sedimentation. Glacifluvial Glacilacustrine Sediment. Soc. Econ. Paleontol. Mineral. Spec. Publ. 23, 304–320.
Banks, M.E., Lang, N.P., Kargel, J.S., McEwen, A.S., Baker, V.R., Grant, J.A., Pelletier, J.D., Strom, R.G., 2009. An analysis of sinuous ridges in the southern Argyre Planitia, Mars using HiRISE and CTX images and MOLA data. J. Geophys. Res. Planets 114, E09003. doi:10.1029/2008JE003244
Benn, D.I., Evans, D.J.A., 2010. Glaciers & Glaciation, Second. ed. Hodder Education, London. Bernhardt, H., Hiesinger, H., Reiss, D., Ivanov, M., Erkeling, G., 2013. Putative eskers and new insights
into glacio-fluvial depositional settings in southern Argyre Planitia, Mars. Planet. Space Sci. 85, 261–278. doi:10.1016/j.pss.2013.06.022
Brennand, T.A., 2000. Deglacial meltwater drainage and glaciodynamics: inferences from Laurentide eskers, Canada. Geomorphology 32, 263–293. doi:10.1016/S0169-555X(99)00100-2
Brennand, T.A., 1994. Macroforms, large bedforms and rhythmic sedimentary sequences in subglacial eskers, south-central Ontario: implications for esker genesis and meltwater regime. Sediment. Geol. 91, 9–55. doi:10.1016/0037-0738(94)90122-8
Brennand, T.A., Shaw, J., 1996. The Harricana glaciofluvial complex, Abitibi region, Quebec: its genesis and implications for meltwater regime and ice-sheet dynamics. Sediment. Geol. 102, 221–262. doi:10.1016/0037-0738(95)00069-0
Burr, D.M., Enga, M.-T., Williams, R.M.E., Zimbelman, J.R., Howard, A.D., Brennand, T.A., 2009. Pervasive aqueous paleoflow features in the Aeolis/Zephyria Plana region, Mars. Icarus 200, 52–76. doi:10.1016/j.icarus.2008.10.014
Carr, M.H., Head, J.W., III, 2010. Geologic history of Mars. Earth Planet. Sci. Lett., Mars Express after 6 Years in Orbit: Mars Geology from Three-Dimensional Mapping by the High Resolution Stereo Camera (HRSC) Experiment 294, 185–203. doi:10.1016/j.epsl.2009.06.042
Clark, P.U., Walder, J.S., 1994. Subglacial drainage, eskers, and deforming beds beneath the Laurentide and Eurasian ice sheets. Geol. Soc. Am. Bull. 106, 304–314.
Erkeling, G., Reiss, D., Hiesinger, H., Ivanov, M.A., Hauber, E., Bernhardt, H., 2014. Landscape formation at the Deuteronilus contact in southern Isidis Planitia, Mars: Implications for an Isidis Sea? Icarus 242, 329–351. doi:10.1016/j.icarus.2014.08.015
Fastook, J.L., Head, J.W., Marchant, D.R., Forget, F., Madeleine, J.-B., 2012. Early Mars climate near the Noachian–Hesperian boundary: Independent evidence for cold conditions from basal melting of the south polar ice sheet (Dorsa Argentea Formation) and implications for valley network formation. Icarus 219, 25–40. doi:10.1016/j.icarus.2012.02.013
Flowers, G.E., 2015. Modelling water flow under glaciers and ice sheets. Proc. R. Soc. Math. Phys. Eng. Sci. 471, 20140907. doi:10.1098/rspa.2014.0907
Fountain, A.G., Walder, J.S., 1998. Water flow through temperate glaciers. Rev. Geophys. 36, 299–328. doi:10.1029/97RG03579

ACCEPTED MANUSCRIPT
ACCEPTED MANUSCRIP
T
58
Gallagher, C., Balme, M., 2015. Eskers in a complete, wet-based glacial system in the Phlegra Montes region, Mars. Earth Planet. Sci. Lett. 431, 96–109. doi:10.1016/j.epsl.2015.09.023
Ghatan, G.J., Head, J.W., III, 2004. Regional drainage of meltwater beneath a Hesperian-aged south circumpolar ice sheet on Mars. J. Geophys. Res. 109. doi:10.1029/2003JE002196
Gustavson, T.C., Boothroyd, J.C., 1987. A depositional model for outwash, sediment sources, and hydrologic characteristics, Malaspina Glacier, Alaska: A modern analog of the southeastern margin of the Laurentide Ice Sheet. Geol. Soc. Am. Bull. 99, 187–200. doi:10.1130/0016-7606(1987)99<187:ADMFOS>2.0.CO;2
Hartmann, W.K., 2005. Martian cratering 8: Isochron refinement and the chronology of Mars. Icarus, Mars Polar Science III 174, 294–320. doi:10.1016/j.icarus.2004.11.023
Head, J.W., III, 2000a. Tests for Ancient Polar Deposits on Mars: Origin of Esker-like Sinuous Ridges (Dorsa Argentea) Using MOLA Data. Lunar Planet. Sci. Conf. XXXI Abstract #1116.
Head, J.W., III, 2000b. Tests for Ancient Polar Deposits on Mars: Morphology and Topographic Relationships of Esker-like Sinuous Ridges (Dorsa Argentea) Using MOLA Data. Lunar Planet. Sci. Conf. XXXI Abstract #1117.
Head, J.W., III, Hallet, B., 2001a. Origin of Sinuous Ridges in the Dorsa Argentea Formation: New Observations and Tests of the Esker Hypothesis. Lunar Planet. Sci. Conf. XXXII Abstract #1373.
Head, J.W., III, Hallet, B., 2001b. Origin of Sinuous Ridges in the Dorsa Argentea Formation: Additional Criteria for Tests of the Esker Hypothesis. Lunar Planet. Sci. Conf. XXXII Abstract #1366.
Head, J.W., Pratt, S., 2001. Extensive Hesperian-aged south polar ice sheet on Mars: Evidence for massive melting and retreat, and lateral flow and ponding of meltwater. J. Geophys. Res. Planets 106, 12275–12299. doi:10.1029/2000JE001359
Hooke, R., LeB, Fastook, J., 2007. Thermal conditions at the bed of the Laurentide ice sheet in Maine during deglaciation: implications for esker formation. J. Glaciol. 53, 646–658. doi:10.3189/002214307784409243
Howard, A.D., 1981. Etched plains and braided ridges of the south polar region of Mars: Features produced by basal melting of ground ice? Rep. Planet. Geol. Program 1981 Natl. Aeronaut. Space Adm. Tech. Memo. 84211, 286–288.
Hubbard, B., Nienow, P., 1997. Alpine subglacial hydrology. Quat. Sci. Rev. 16, 939–955. doi:10.1016/S0277-3791(97)00031-0
Ivanov, M.A., Hiesinger, H., Erkeling, G., Hielscher, F.J., Reiss, D., 2012. Major episodes of geologic history of Isidis Planitia on Mars. Icarus 218, 24–46. doi:10.1016/j.icarus.2011.11.029
Jaumann, R., Neukum, G., Behnke, T., Duxbury, T.C., Eichentopf, K., Flohrer, J., Gasselt, S. v., Giese, B., Gwinner, K., Hauber, E., Hoffmann, H., Hoffmeister, A., Köhler, U., Matz, K.-D., McCord, T.B., Mertens, V., Oberst, J., Pischel, R., Reiss, D., Ress, E., Roatsch, T., Saiger, P., Scholten, F., Schwarz, G., Stephan, K., Wählisch, M., 2007. The high-resolution stereo camera (HRSC) experiment on Mars Express: Instrument aspects and experiment conduct from interplanetary cruise through the nominal mission. Planet. Space Sci. 55, 928–952. doi:10.1016/j.pss.2006.12.003
Kamb, B., 1987. Glacier surge mechanism based on linked cavity configuration of the basal water conduit system. J. Geophys. Res. Solid Earth 92, 9083–9100. doi:10.1029/JB092iB09p09083
Kargel, J.S., 1993. Geomorphic processes in the Argyre-Dorsa Argentea region of Mars. Lunar Planet. Sci. Conf. XXIV Abstract #1378.
Kargel, J.S., Strom, R.G., 1992. Ancient glaciation on Mars. Geology 20, 3–7. doi:10.1130/0091-7613(1992)020<0003:AGOM>2.3.CO;2
Kress, A.M., Head, J.W., 2015. Late Noachian and early Hesperian ridge systems in the south circumpolar Dorsa Argentea Formation, Mars: Evidence for two stages of melting of an extensive late Noachian ice sheet. Planet. Space Sci. 109–110, 1–20. doi:10.1016/j.pss.2014.11.025

ACCEPTED MANUSCRIPT
ACCEPTED MANUSCRIP
T
59
Lewis, A.R., Marchant, D.R., Kowalewski, D.E., Baldwin, S.L., Webb, L.E., 2006. The age and origin of the Labyrinth, western Dry Valleys, Antarctica: Evidence for extensive middle Miocene subglacial floods and freshwater discharge to the Southern Ocean. Geology 34, 513–516. doi:10.1130/G22145.1
Mäkinen, J., 2003. Time-transgressive deposits of repeated depositional sequences within interlobate glaciofluvial (esker) sediments in Köyliö, SW Finland. Sedimentology 50, 327–360. doi:10.1046/j.1365-3091.2003.00557.x
Malin, M.C., Bell, J.F., Cantor, B.A., Caplinger, M.A., Calvin, W.M., Clancy, R.T., Edgett, K.S., Edwards, L., Haberle, R.M., James, P.B., Lee, S.W., Ravine, M.A., Thomas, P.C., Wolff, M.J., 2007. Context Camera Investigation on board the Mars Reconnaissance Orbiter. J. Geophys. Res. 112. doi:10.1029/2006JE002808
Mangold, N., 2000. Giant Paleo-eskers of Mauritania: Analogs for Martian Esker-Like Landforms. Second Int. Conf. Mars Polar Sci. Explor. Abstract #4031.
Metzger, S.M., 1992. The Eskers of New York State: Formation Process Implications and Esker-like Features on the Planet Mars. Lunar Planet. Sci. Conf. XXIII Abstract #1448.
Metzger, S.M., 1991. A survey of esker morphometries, the connection to New York state glaciation and criteria for subglacial melt-water channel deposits on the planet Mars. Lunar Planet. Sci. Conf. XXII Abstract #1444.
Milkovich, S.M., Head, J.W., Pratt, S., 2002. Meltback of Hesperian-aged ice-rich deposits near the south pole of Mars: Evidence for drainage channels and lakes. J. Geophys. Res. Planets 107, 10–1. doi:10.1029/2001JE001802
Neukum, G., Jaumann, R., the HRSC Co-Investigator and Experiment Team, 2004. HRSC: The high resolution stereo camera of Mars Express, in: Wilson, A. (Ed.), Mars Express: The Scientific Payload, European Space Agency Special Publication 1240. pp. 17–35.
Parker, T.J., Pieri, D.C., Saunders, R.S., 1986. Morphology and distribution of sinuous ridges in central and southern Argyre. Natl. Aeronaut. Space Adm. Tech. Memo. 88383, 468–470.
Perkins, A.J., Brennand, T.A., Burke, M.J., 2016. Towards a morphogenetic classification of eskers: Implications for modelling ice sheet hydrology. Quat. Sci. Rev. 134, 19–38. doi:10.1016/j.quascirev.2015.12.015
Phillips, R.J., Davis, B.J., Tanaka, K.L., Byrne, S., Mellon, M.T., Putzig, N.E., Haberle, R.M., Kahre, M.A., Campbell, B.A., Carter, L.M., Smith, I.B., Holt, J.W., Smrekar, S.E., Nunes, D.C., Plaut, J.J., Egan, A.F., Titus, T.N., Seu, R., 2011. Massive CO2 Ice Deposits Sequestered in the South Polar Layered Deposits of Mars. Science 332, 838–841. doi:10.1126/science.1203091
Punkari, M., 1997. Glacial and glaciofluvial deposits in the interlobate areas of the Scandinavian ice sheet. Quat. Sci. Rev., Ice-Contact Sedimentation: Processes and Deposits 16, 741–753. doi:10.1016/S0277-3791(97)00020-6
Röthlisberger, H., 1972. Water pressure in intra- and subglacial channels. J. Glaciol. 11, 117–203. Ruff, S.W., Greeley, R., 1990. Sinuous Ridges of the South Polar Region, Mars: Possible Origins. Lunar
Planet. Sci. Conf. XXI Abstract #1532. Scanlon, K.E., Head, J.W., 2015. The recession of the Dorsa Argentea Formation ice sheet: geologic
evidence and climate simulations. Lunar Planet. Sci. Conf. XLVI Abstract #2247. Shreve, R.L., 1985a. Esker characteristics in terms of glacier physics, Katahdin esker system, Maine.
Geol. Soc. Am. Bull. 96, 639. doi:10.1130/0016-7606(1985)96<639:ECITOG>2.0.CO;2 Shreve, R.L., 1985b. Late Wisconsin ice-surface profile calculated from esker paths and types,
Katahdin esker system, maine. Quat. Res. 23, 27–37. doi:10.1016/0033-5894(85)90069-9 Shreve, R.L., 1972. Movement of water in glaciers. J. Glaciol. 11, 205–214. Som, 2008. The Mars Orbiter Laser Altimeter dataset: Limitations and improvements. Mars J. 4, 14–
26. doi:10.1555/mars.2008.0002 Souness, C., Hubbard, B., 2012. Mid-latitude glaciation on Mars. Prog. Phys. Geogr. 36, 238–261.
doi:10.1177/0309133312436570
ACCEPTED MANUSCRIPT
ACCEPTED MANUSCRIP
T
60
Storrar, R.D., Evans, D.J.A., Stokes, C.R., Ewertowski, M., 2015. Controls on the location, morphology and evolution of complex esker systems at decadal timescales, Breiðamerkurjökull, southeast Iceland. Earth Surf. Process. Landf. 40, 1421–1438. doi:10.1002/esp.3725
Storrar, R.D., Stokes, C.R., Evans, D.J.A., 2014a. Morphometry and pattern of a large sample (>20,000) of Canadian eskers and implications for subglacial drainage beneath ice sheets. Quat. Sci. Rev. 105, 1–25. doi:10.1016/j.quascirev.2014.09.013
Storrar, R.D., Stokes, C.R., Evans, D.J.A., 2014b. Increased channelization of subglacial drainage during deglaciation of the Laurentide Ice Sheet. Geology 42, 239–242. doi:10.1130/G35092.1
Storrar, R.D., Stokes, C.R., Evans, D.J.A., 2013. A map of large Canadian eskers from Landsat satellite imagery. J. Maps 9, 456–473. doi:10.1080/17445647.2013.815591
Tanaka, K.L., Kolb, E.J., 2001. Geologic History of the Polar Regions of Mars Based on Mars Global Surveyor Data I. Noachian and Hesperian Periods. Icarus 154, 3–21. doi:10.1006/icar.2001.6675
Tanaka, K.L., Scott, D.H., 1987. Geologic map of the polar regions of Mars. U.S Geological Survey Miscellaneous Investigations Series Map 1-1802-C.
Tanaka, K.L., Skinner, J.A., Dohm, J.M., Irwin III, R.P., Kolb, E.J., Fortezzo, C.M., Platz, T., Michael, G.G., Hare, T., 2014a. Geologic Map of Mars. USGS Scientific Investigations Map 3292.
Tanaka, K.L., Skinner, J.A., Dohm, J.M., Irwin III, R.P., Kolb, E.J., Fortezzo, C.M., Platz, T., Michael, G.G., Hare, T., 2014b. Geologic map of Mars, Pamphlet to accompany Scientific Investigations Map 3292. US Geological Survey.
Williams, R.M., Chidsey Jr, T.C., Eby, D.E., 2007. Exhumed paleochannels in central Utah—Analogs for raised curvilinear features on Mars, in: Hylland, M.D., Clark, D.L., Chidsey, T.C. (Eds.), Central Utah - Diverse Geology of a Dynamic Landscape, Utah Geological Association Publication.
Zuber, M.T., Smith, D.E., Solomon, S.C., Muhleman, D.O., Head, J.W., Garvin, J.B., Abshire, J.B., Bufton, J.L., 1992. The Mars Observer Laser Altimeter Investigation. J. Geophys. Res. 97, 7781–7797.