are neighbourhoods crime prone in different ways? · pdf fileare neighbourhoods crime prone in...
TRANSCRIPT
Dr Robin Fitzgerald
School of Social Science
University of Queensland
Are neighbourhoods crime prone in different
ways?
Toward a typology
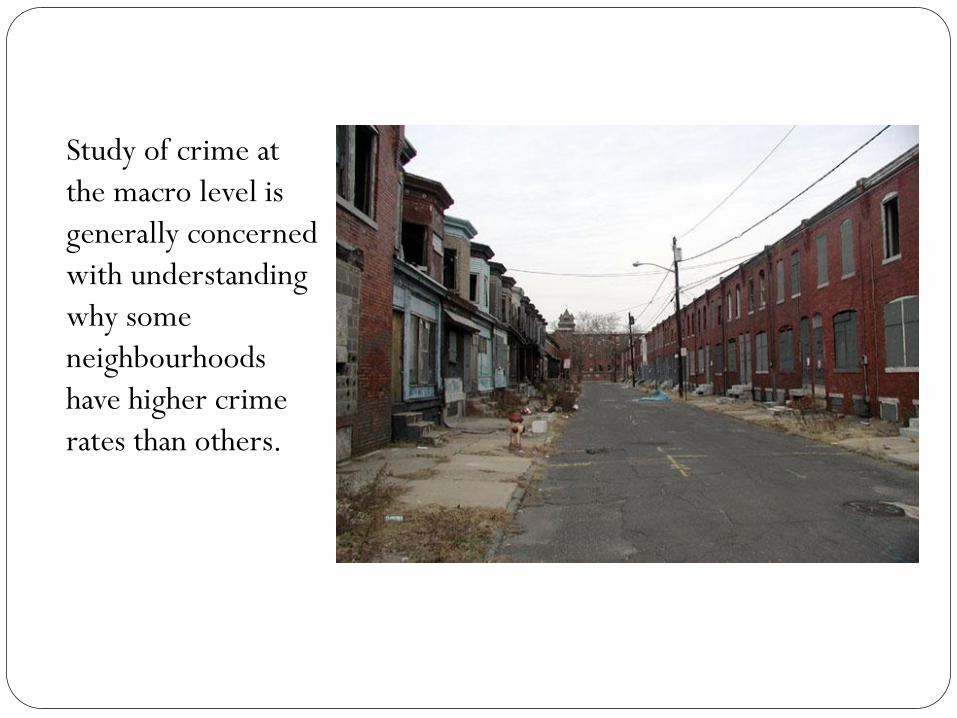
Study of crime at
the macro level is
generally concerned
with understanding
why some
neighbourhoods
have higher crime
rates than others.

The surprising gap
‘Whereas there is extensive literature on crime rates at the
neighborhood level, little of it directly bears on the extent to
which some neighborhoods favor particular crime types over
others’ (Schreck et al 2009)
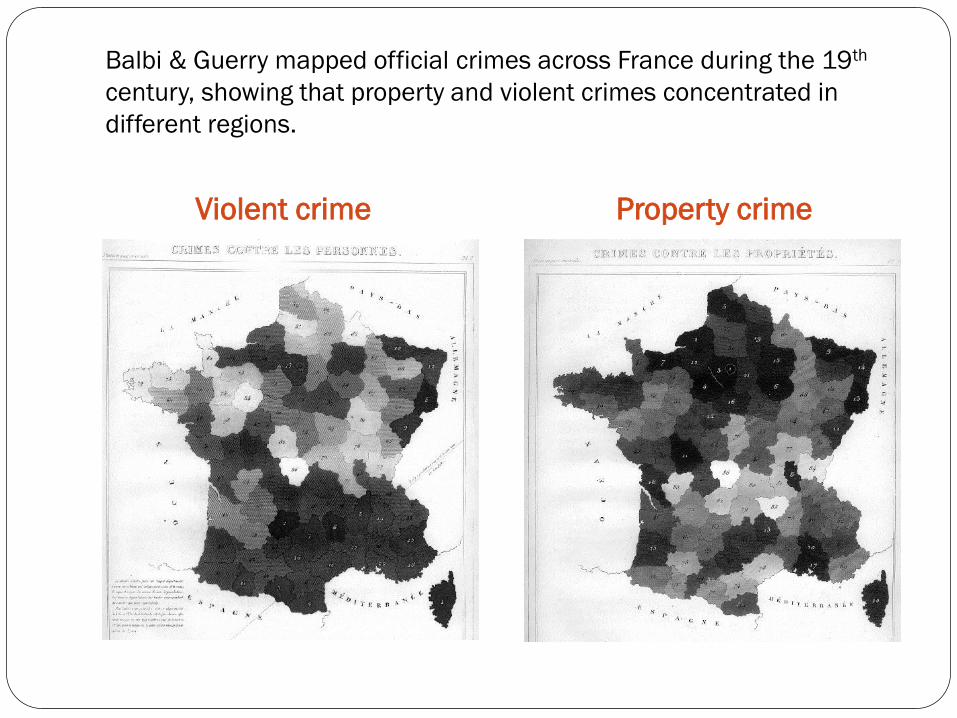
Balbi & Guerry mapped official crimes across France during the 19th
century, showing that property and violent crimes concentrated in
different regions.
Violent crime Property crime
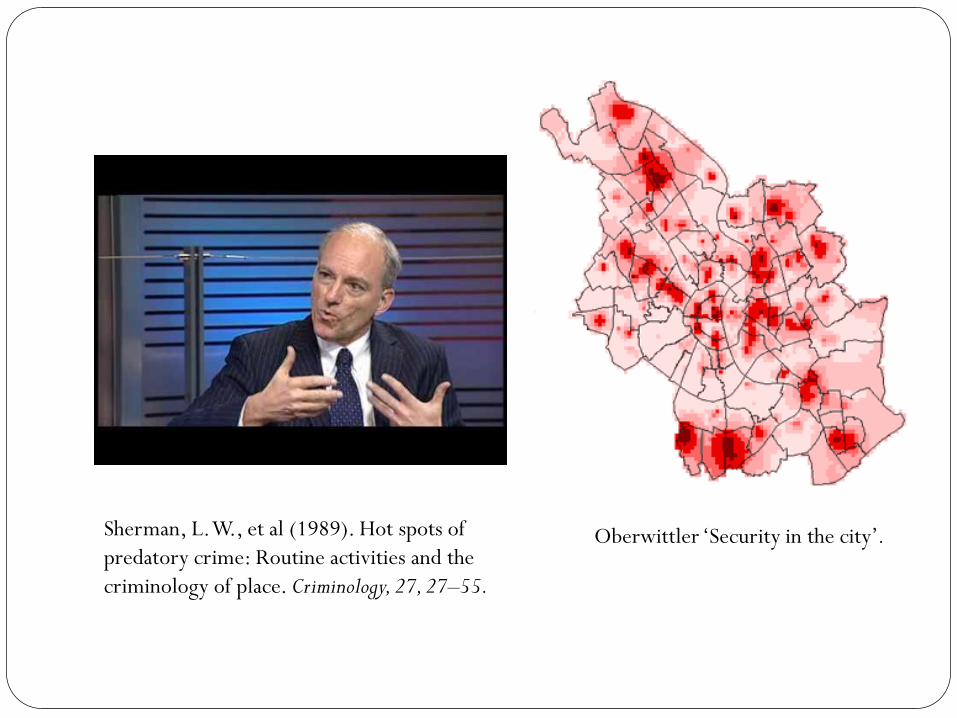
Sherman, L. W., et al (1989). Hot spots of
predatory crime: Routine activities and the
criminology of place. Criminology, 27, 27–55.
Oberwittler ‘Security in the city’.
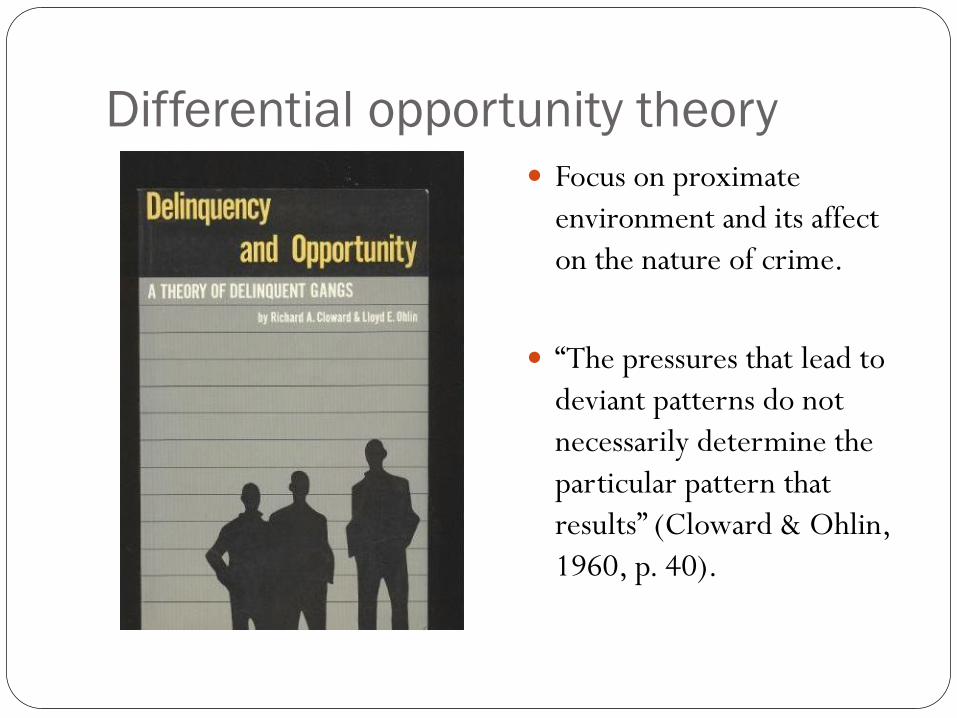
Differential opportunity theory
Focus on proximate
environment and its affect
on the nature of crime.
“The pressures that lead to
deviant patterns do not
necessarily determine the
particular pattern that
results” (Cloward & Ohlin,
1960, p. 40).
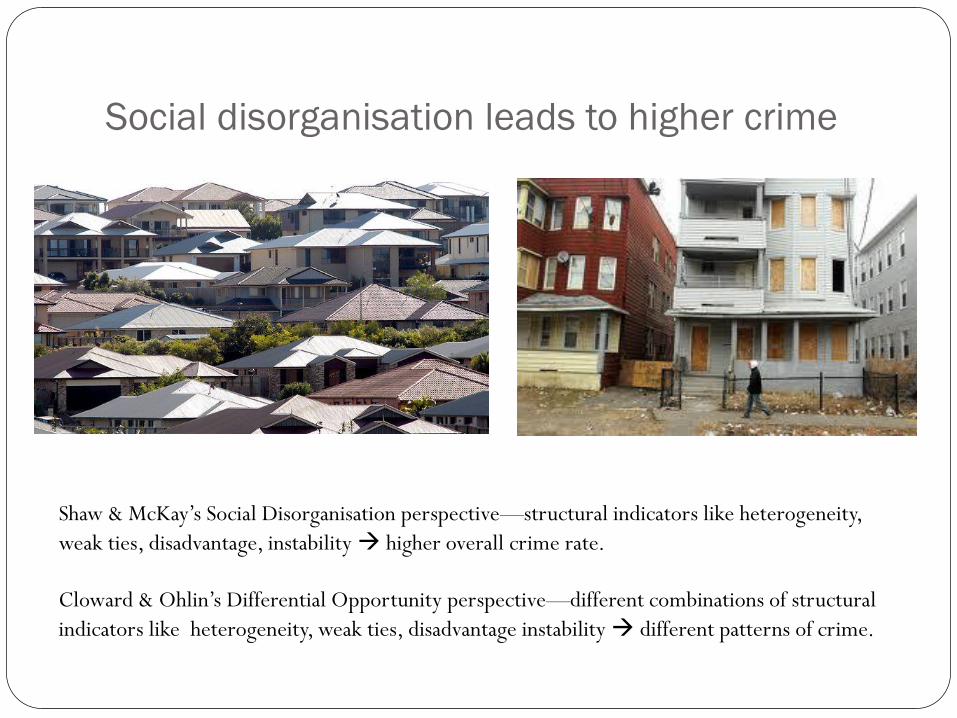
Social disorganisation leads to higher crime
Shaw & McKay’s Social Disorganisation perspective—structural indicators like heterogeneity,
weak ties, disadvantage, instability higher overall crime rate.
Cloward & Ohlin’s Differential Opportunity perspective—different combinations of structural
indicators like heterogeneity, weak ties, disadvantage instability different patterns of crime.
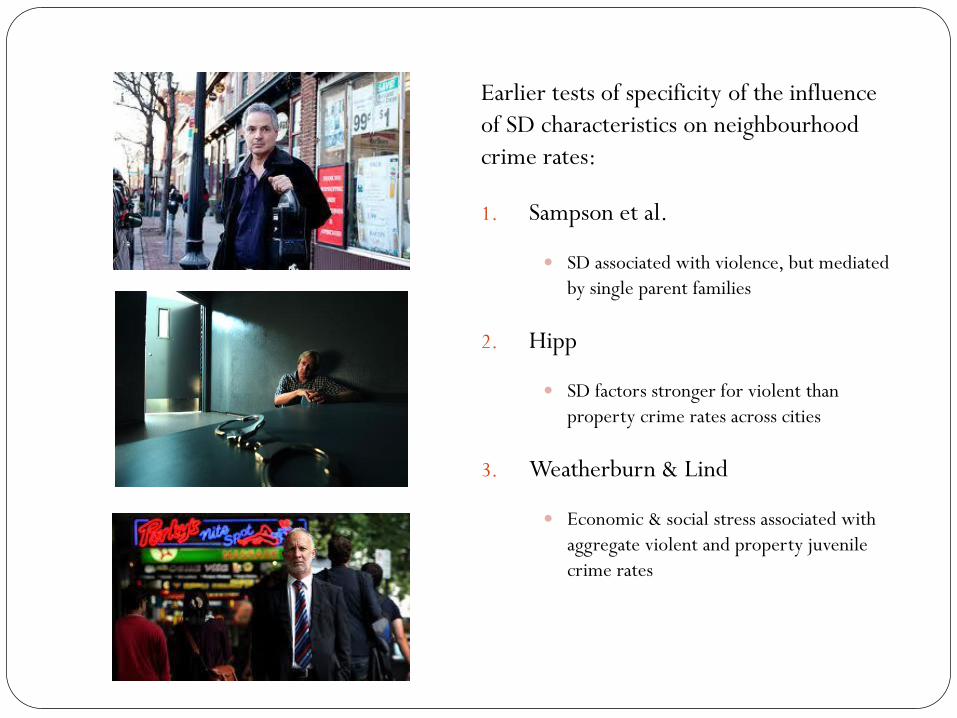
Earlier tests of specificity of the influence
of SD characteristics on neighbourhood
crime rates:
1. Sampson et al.
SD associated with violence, but mediated
by single parent families
2. Hipp
SD factors stronger for violent than
property crime rates across cities
3. Weatherburn & Lind
Economic & social stress associated with
aggregate violent and property juvenile
crime rates
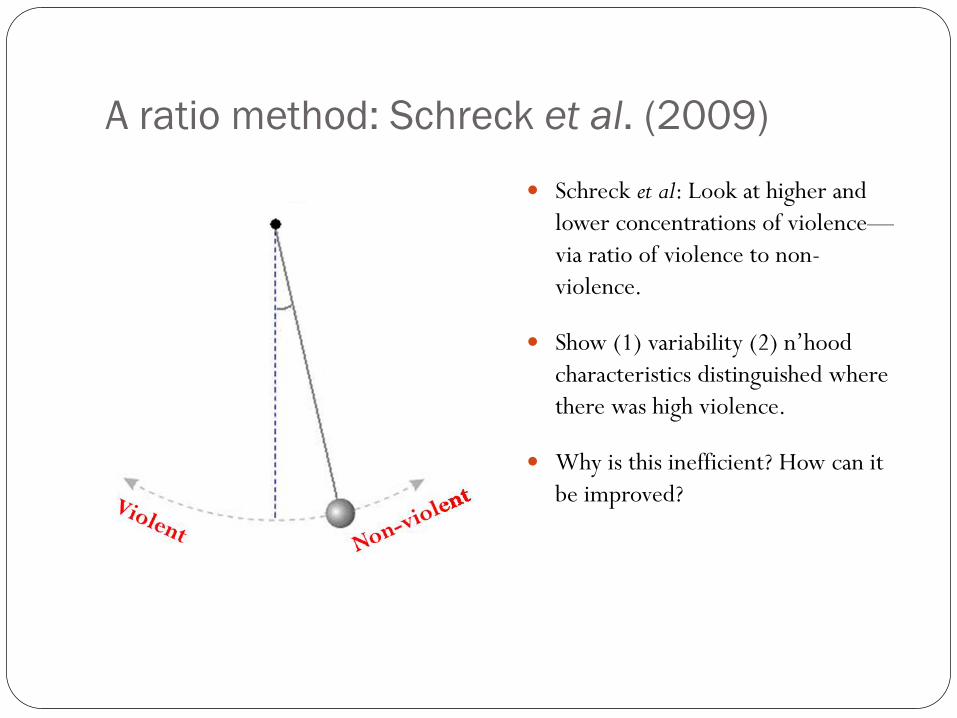
A ratio method: Schreck et al. (2009)
Schreck et al: Look at higher and
lower concentrations of violence—
via ratio of violence to non-
violence.
Show (1) variability (2) n’hood
characteristics distinguished where
there was high violence.
Why is this inefficient? How can it
be improved?
Another way… Is the picture more complex than a simple violent:non-violent
ratio?
Can we use a ‘person-oriented’ latent variable approach to arrive
at a typology of ‘neighbourhood’ crime?
How might traditional neighbourhood characteristics associated
with crime differently explain neighbourhood subgroup
membership?
Is there support for Cloward & Ohlin’s differential opportunity
theory to the extent that SD characteristics will equate differently
to unique crime profiles?
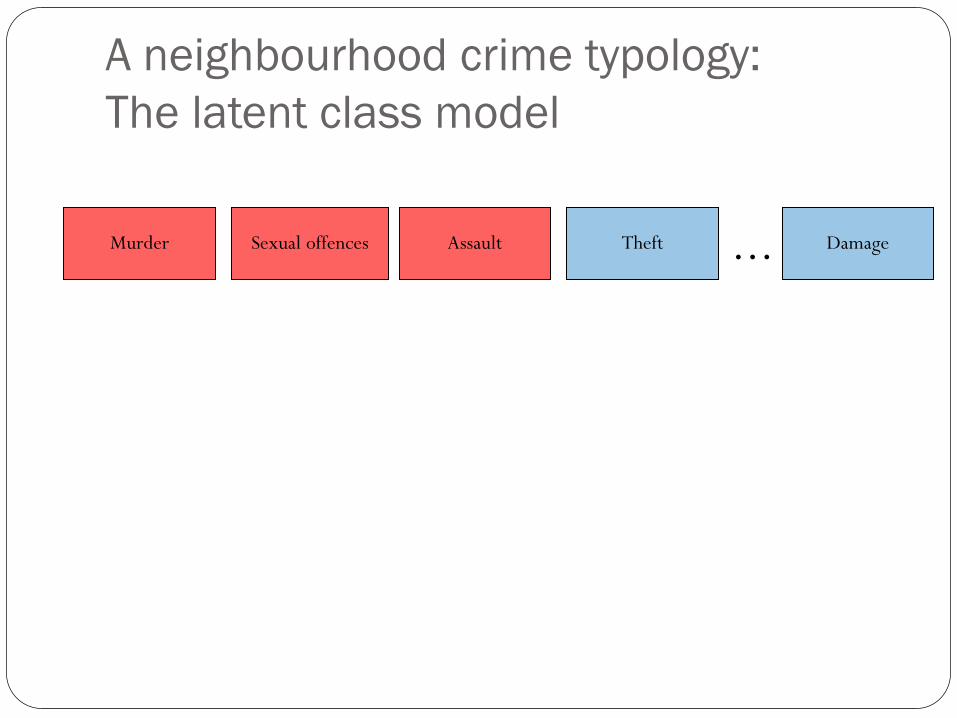
A neighbourhood crime typology:
The latent class model
Murder Sexual offences Assault Theft Damage . . .
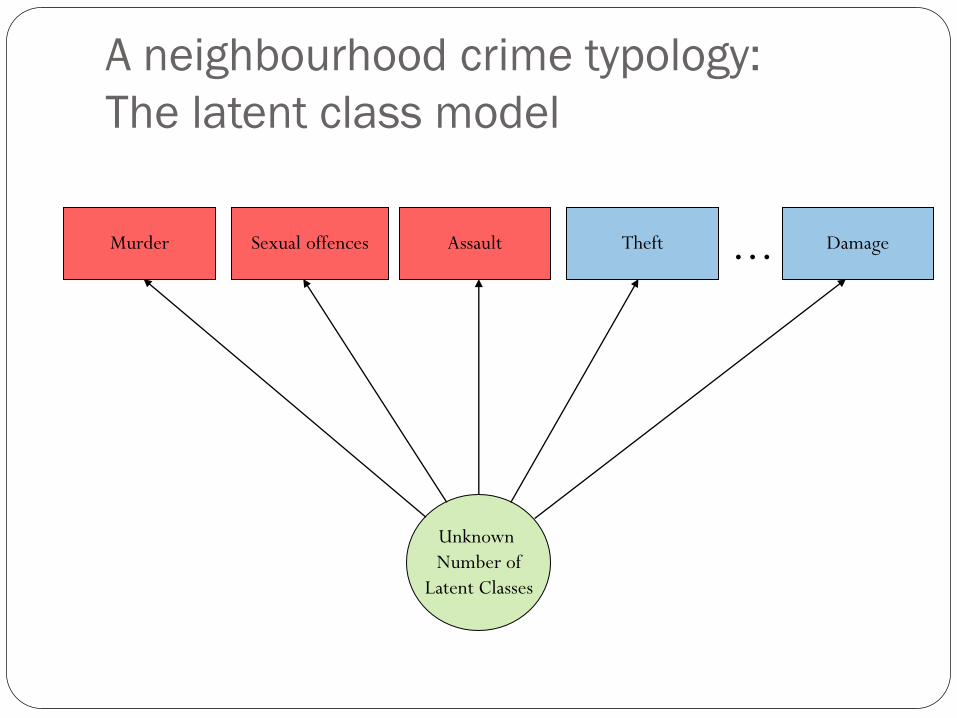
A neighbourhood crime typology:
The latent class model
Murder Sexual offences Assault Theft Damage . . .
Unknown
Number of
Latent Classes
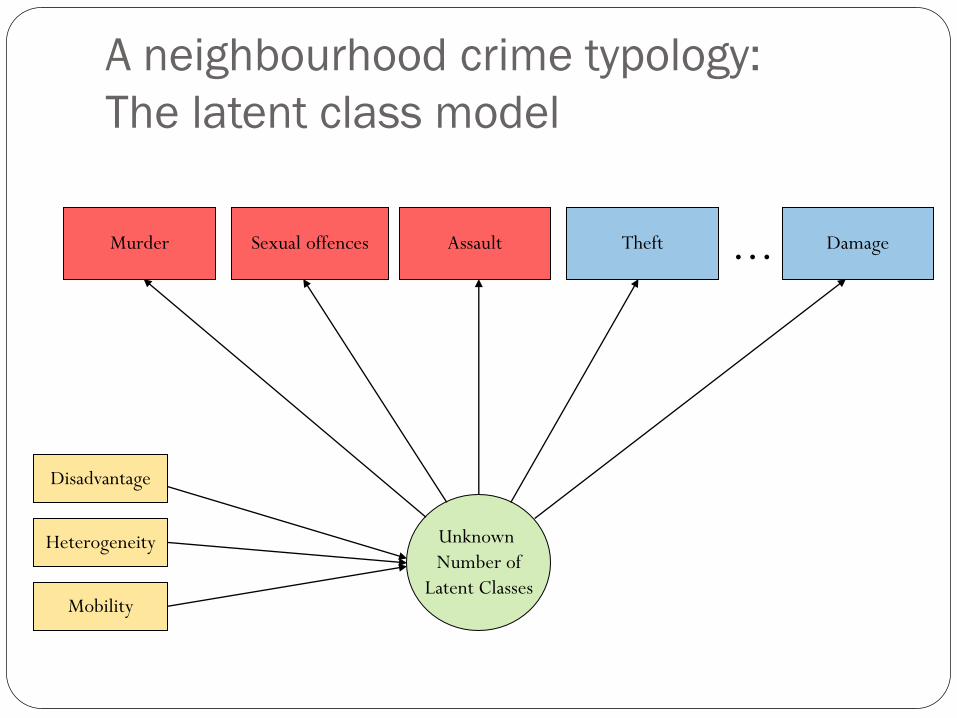
A neighbourhood crime typology:
The latent class model
Murder Sexual offences Assault Theft Damage . . .
Disadvantage
Heterogeneity
Mobility
Unknown
Number of
Latent Classes
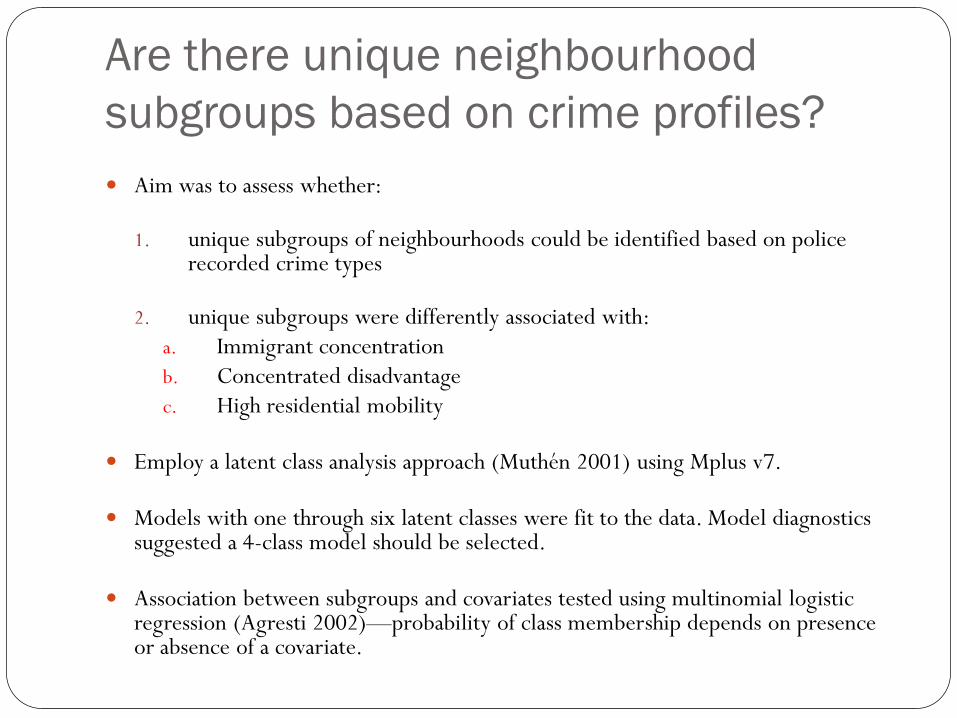
Are there unique neighbourhood
subgroups based on crime profiles?
Aim was to assess whether:
1. unique subgroups of neighbourhoods could be identified based on police recorded crime types
2. unique subgroups were differently associated with:
a. Immigrant concentration
b. Concentrated disadvantage
c. High residential mobility
Employ a latent class analysis approach (Muthén 2001) using Mplus v7.
Models with one through six latent classes were fit to the data. Model diagnostics suggested a 4-class model should be selected.
Association between subgroups and covariates tested using multinomial logistic regression (Agresti 2002)—probability of class membership depends on presence or absence of a covariate.
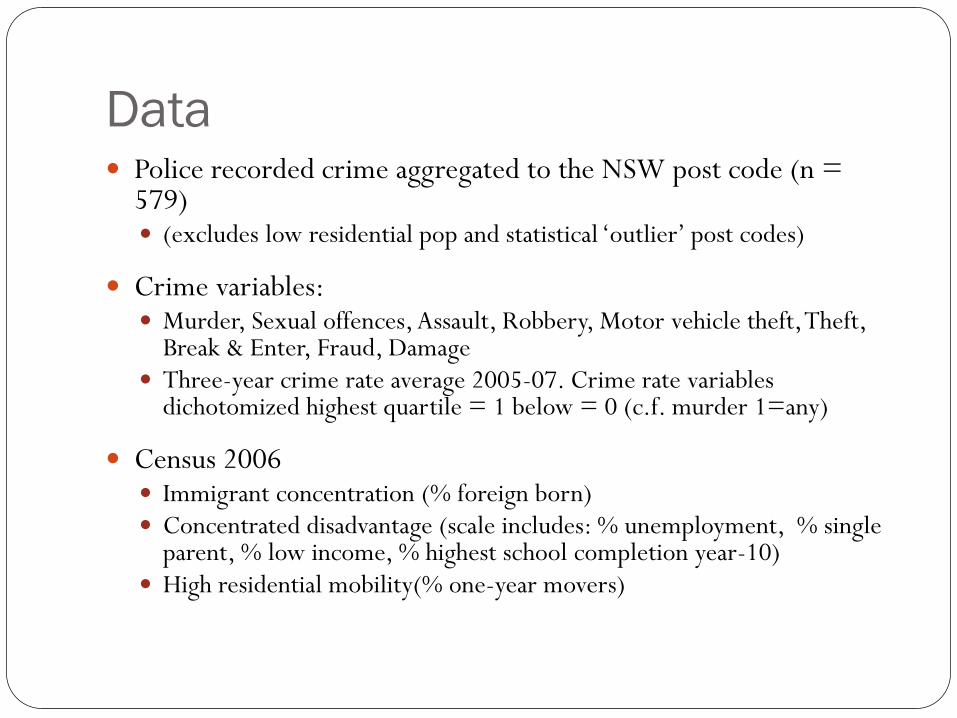
Data Police recorded crime aggregated to the NSW post code (n =
579) (excludes low residential pop and statistical ‘outlier’ post codes)
Crime variables: Murder, Sexual offences, Assault, Robbery, Motor vehicle theft, Theft,
Break & Enter, Fraud, Damage Three-year crime rate average 2005-07. Crime rate variables
dichotomized highest quartile = 1 below = 0 (c.f. murder 1=any)
Census 2006 Immigrant concentration (% foreign born) Concentrated disadvantage (scale includes: % unemployment, % single
parent, % low income, % highest school completion year-10) High residential mobility(% one-year movers)
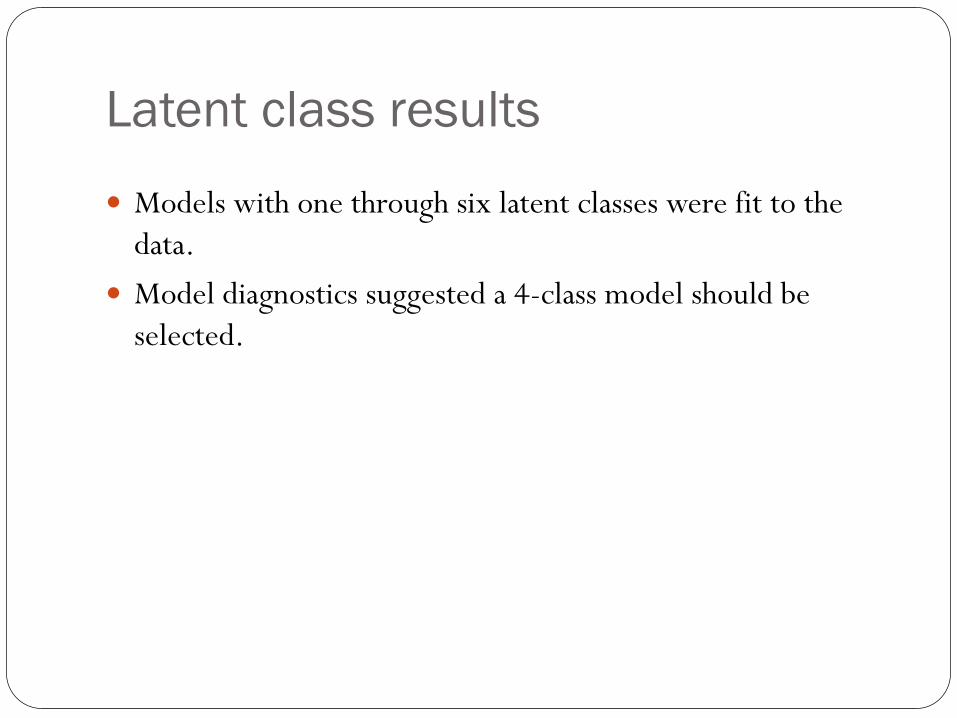
Latent class results
Models with one through six latent classes were fit to the
data.
Model diagnostics suggested a 4-class model should be
selected.
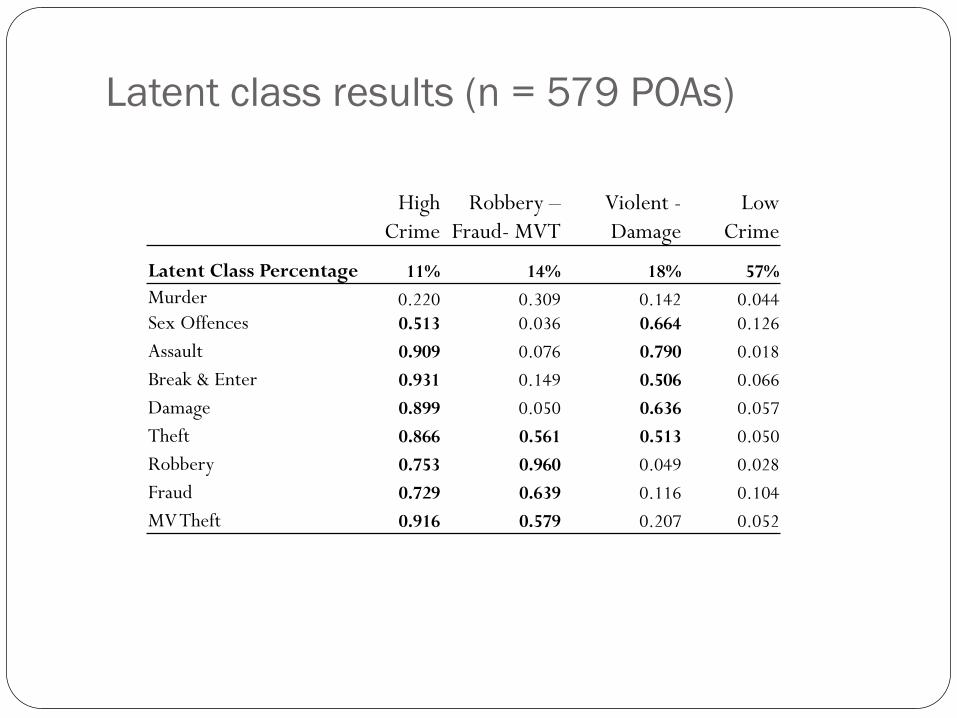
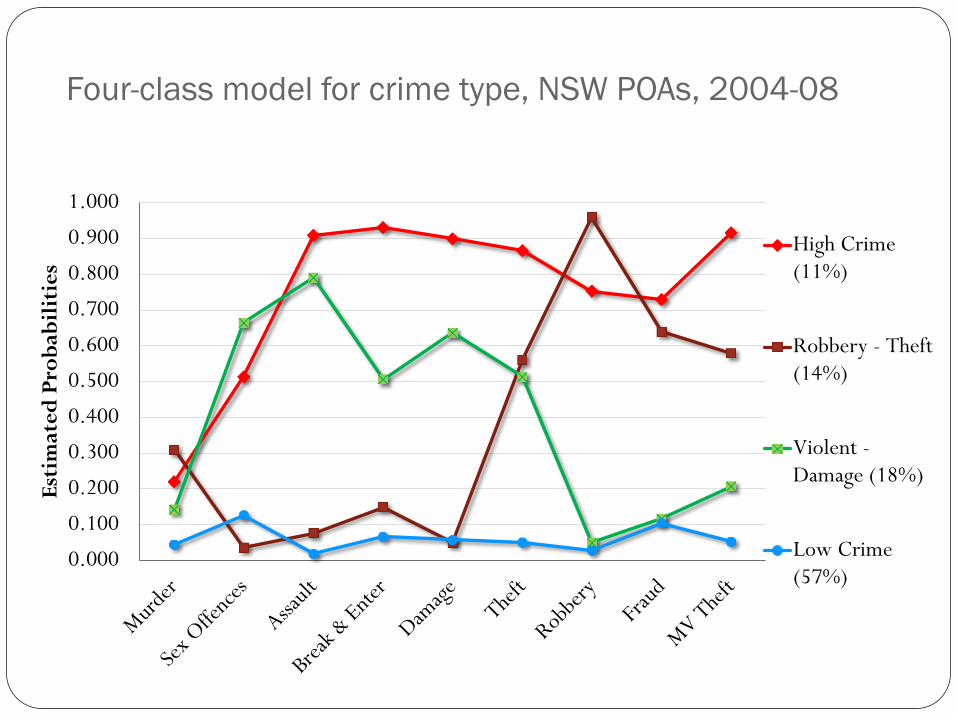
Latent class results (n = 579 POAs)
High
Crime
Robbery –
Fraud- MVT
Violent -
Damage
Low
Crime
Latent Class Percentage 11% 14% 18% 57%
Murder
Sex Offences 0.220
0.513
0.309
0.036
0.142
0.664
0.044
0.126
Assault 0.909 0.076 0.790 0.018
Break & Enter 0.931 0.149 0.506 0.066
Damage 0.899 0.050 0.636 0.057
Theft 0.866 0.561 0.513 0.050
Robbery 0.753 0.960 0.049 0.028
Fraud 0.729 0.639 0.116 0.104
MV Theft 0.916 0.579 0.207 0.052
Four-class model for crime type, NSW POAs, 2004-08
0
0.1
0.2
0.3
0.4
0.5
0.6
0.7
0.8
0.9
1
Est
imat
ed
Pro
bab
ilit
ies
Low (57%)
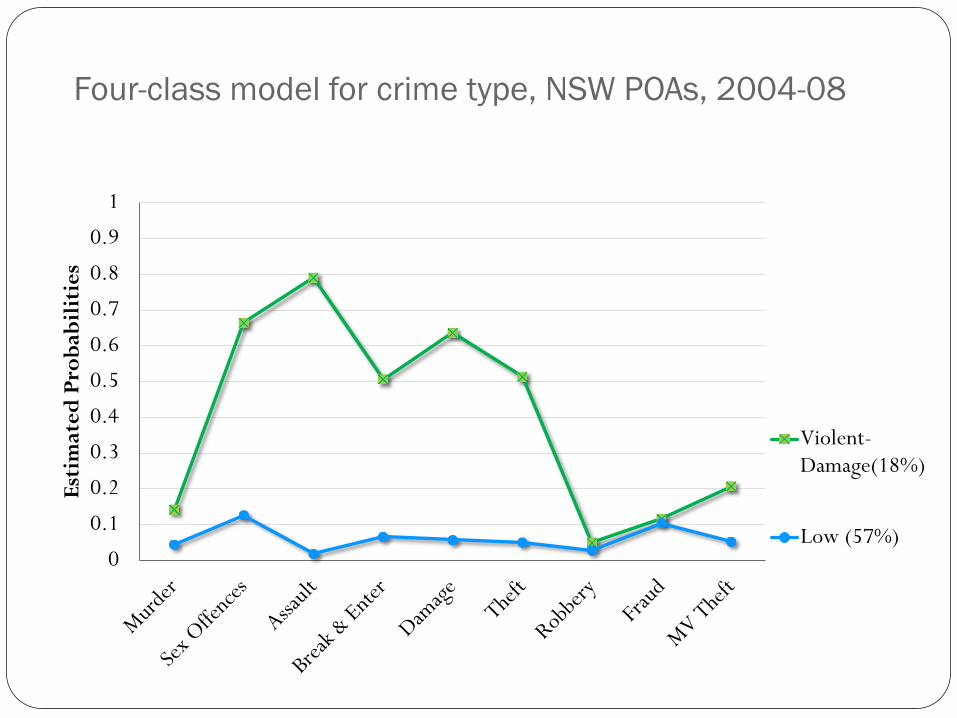
Four-class model for crime type, NSW POAs, 2004-08
0
0.1
0.2
0.3
0.4
0.5
0.6
0.7
0.8
0.9
1
Est
imat
ed
Pro
bab
ilit
ies
Violent-Damage(18%)
Low (57%)
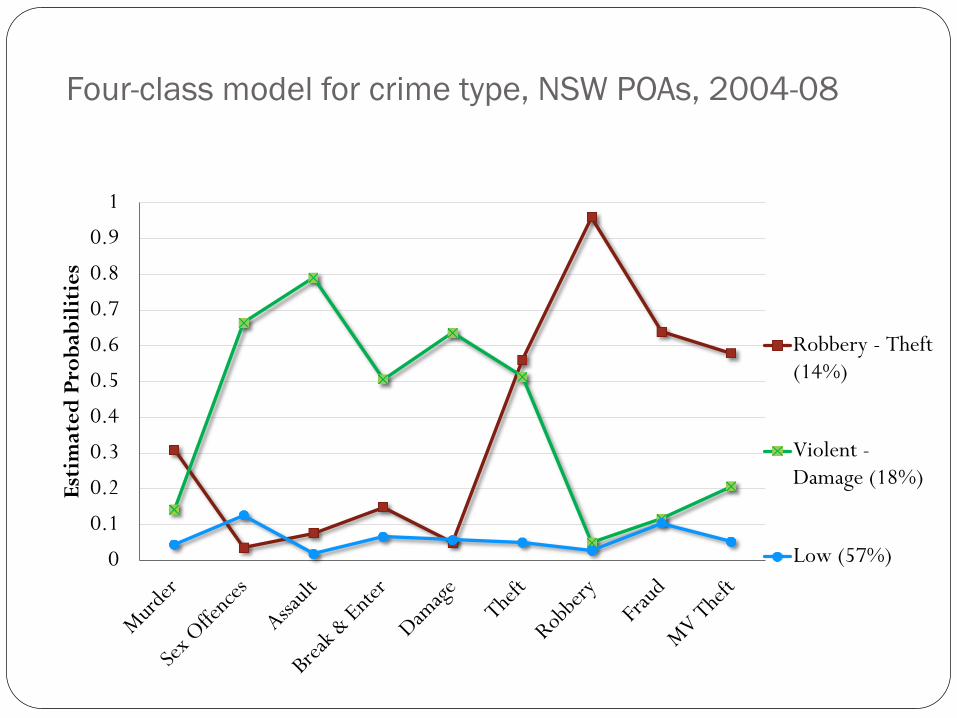
Four-class model for crime type, NSW POAs, 2004-08
0
0.1
0.2
0.3
0.4
0.5
0.6
0.7
0.8
0.9
1
Est
imat
ed
Pro
bab
ilit
ies
Robbery - Theft(14%)
Violent -Damage (18%)
Low (57%)
Four-class model for crime type, NSW POAs, 2004-08
0.000
0.100
0.200
0.300
0.400
0.500
0.600
0.700
0.800
0.900
1.000
Est
imat
ed
Pro
bab
ilit
ies
High Crime(11%)
Robbery - Theft(14%)
Violent -Damage (18%)
Low Crime(57%)
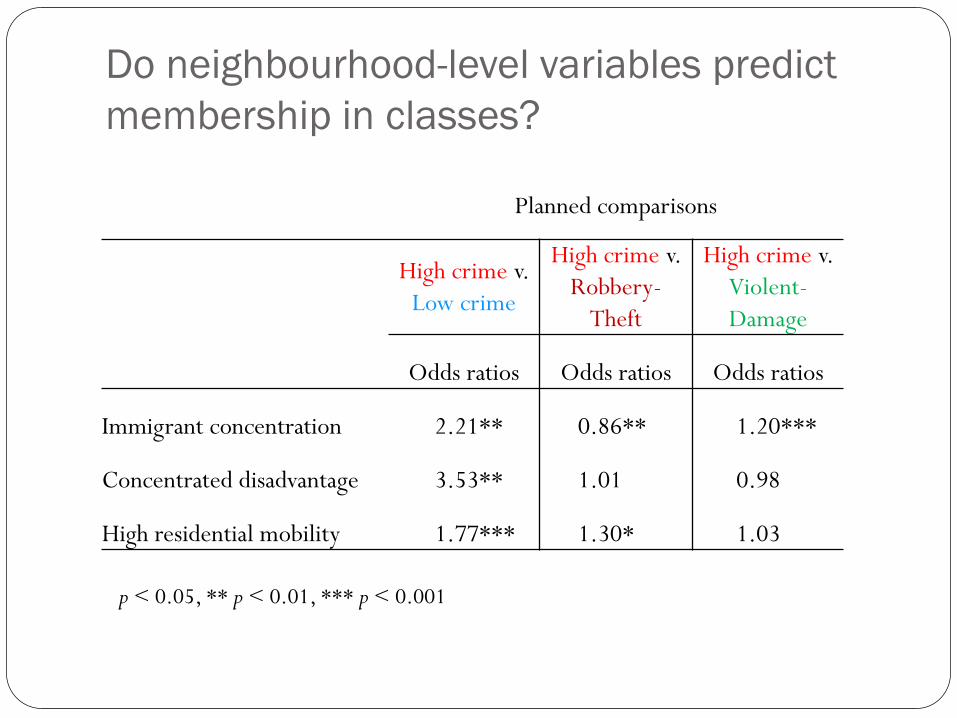
Do neighbourhood-level variables predict
membership in classes?
Planned comparisons
High crime v.
Low crime
High crime v.
Robbery-
Theft
High crime v.
Violent-
Damage
Odds ratios Odds ratios Odds ratios
Immigrant concentration 2.21 ** 0.86 ** 1.20 ***
Concentrated disadvantage 3.53 ** 1.01 0.98
High residential mobility 1.77 *** 1.30 * 1.03
p < 0.05, ** p < 0.01, *** p < 0.001
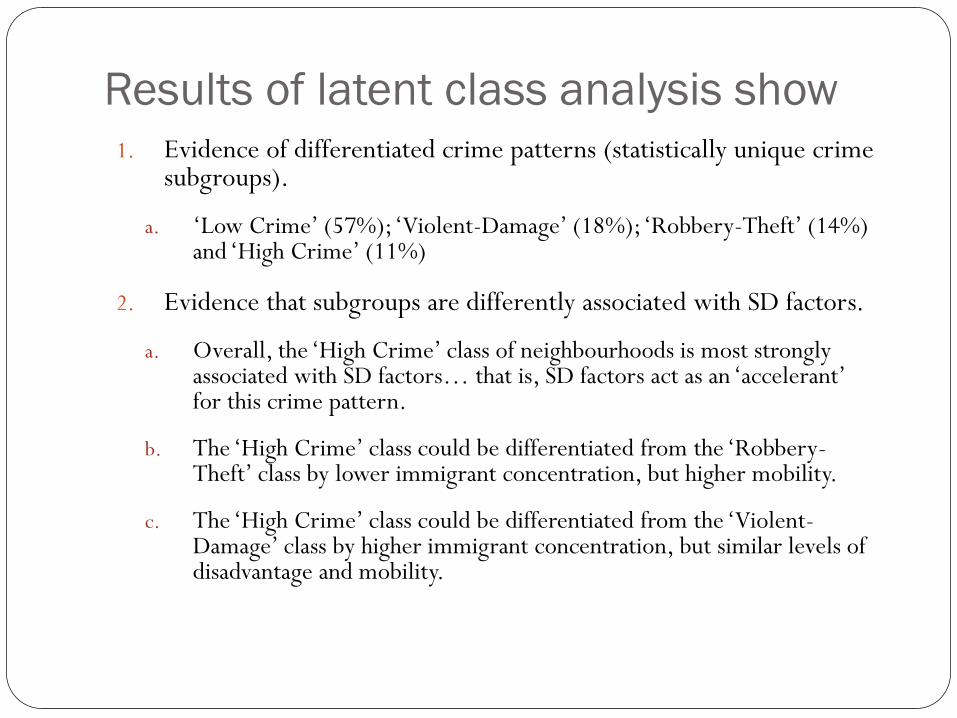
Results of latent class analysis show 1. Evidence of differentiated crime patterns (statistically unique crime
subgroups).
a. ‘Low Crime’ (57%); ‘Violent-Damage’ (18%); ‘Robbery-Theft’ (14%) and ‘High Crime’ (11%)
2. Evidence that subgroups are differently associated with SD factors.
a. Overall, the ‘High Crime’ class of neighbourhoods is most strongly associated with SD factors… that is, SD factors act as an ‘accelerant’ for this crime pattern.
b. The ‘High Crime’ class could be differentiated from the ‘Robbery-Theft’ class by lower immigrant concentration, but higher mobility.
c. The ‘High Crime’ class could be differentiated from the ‘Violent-Damage’ class by higher immigrant concentration, but similar levels of disadvantage and mobility.
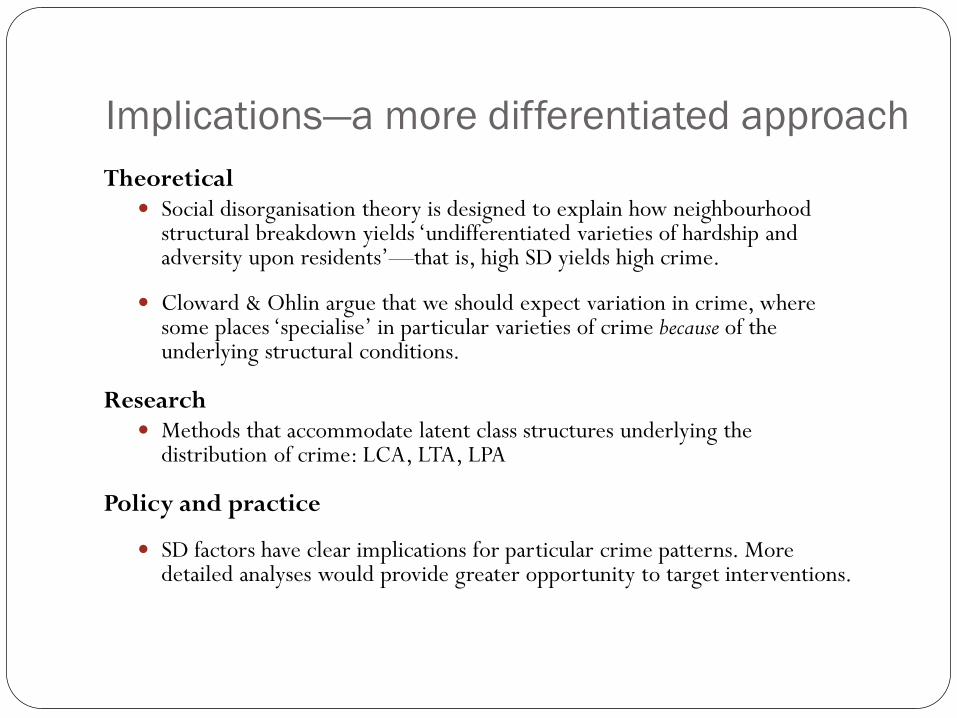
Implications—a more differentiated approach
Theoretical Social disorganisation theory is designed to explain how neighbourhood
structural breakdown yields ‘undifferentiated varieties of hardship and adversity upon residents’—that is, high SD yields high crime.
Cloward & Ohlin argue that we should expect variation in crime, where some places ‘specialise’ in particular varieties of crime because of the underlying structural conditions.
Research Methods that accommodate latent class structures underlying the
distribution of crime: LCA, LTA, LPA
Policy and practice
SD factors have clear implications for particular crime patterns. More detailed analyses would provide greater opportunity to target interventions.