architecture and evaluation of an automatic gnss
TRANSCRIPT

International Global Navigation Satellite Systems Association IGNSS Symposium 2018
Colombo Theatres, Kensington Campus, UNSW Australia
7 – 9 February 2018
Architecture and evaluation of an automatic GNSS embankment deformation monitoring system
Jun Wang Land Solution Australia Pty Ltd/Australia
(+61) 7 33663525 [email protected]
Lee Hellen Land Solution Australia Pty Ltd/Australia
(+61) 7 33663525 [email protected]
Shane Frischkorn Land Solution Australia Pty Ltd/Australia
(+61) 7 33663525 [email protected]
ABSTRACT
Road embankment deformation surveys are required to be undertaken
periodically on hazardous areas to improve risk management, including loss
of life and property. Deformation monitoring with global navigation satellite
systems (GNSS) technology has been proved to be a very efficient and
reliable method for measuring surface deformations. A fully automatic
GNSS embankment deformation monitoring system (AGEDMS) has been
designed and implemented for monitoring the stability of the surrounding
area. The system was designed to automatically alert key project
stakeholders when the movement exceeds a predefined threshold. The
system consists of 5 GNSS monitoring stations and 2 base reference stations.
Measurements from all 7 stations were recorded over about 3 weeks at a 15
second sampling rate. The system architecture and fundamentals are
discussed, including data acquisition, transmission, processing, analysis and
alarm configuration. In this study, both real-time solutions and post-
processing methods are compared and investigated. A real movement
detection example is presented which shows that the system can perform
well to detect 5 mm movement in near real time for alerting purposes. As the
multipath effects vary within different environments, a Survey Uncertainty
(SU) method has been developed to provide an appropriate threshold limit
for different cases.
KEYWORDS: GNSS, Road Embankment, Automatic Deformation
Monitoring, Survey Uncertainty

1. INTRODUCTION
The monitoring of embankment deformation is a critically significant issue for minimising the
risk of loss of life and damaging of property, infrastructure and environment, for example,
when road embankments are constructed on soft foundations (Hsi and MacGregor, 1999). In
Southeast Queensland, a trial embankment constructed with and without stone columns has
been undertaken to assess the behaviour of soft clay when subject to embankment loading (Oh
et al, 2007). It is a great challenge for engineers to realise a tight performance criterion in Post
Construction Settlements (PCS) term (Xie and Kok, 2015).
Both geotechnical and geodetic monitoring techniques, particularly GNSS deformation
monitoring applications, have been extensively studied to monitor and predict landslide
motions or dam deformation to improve the risk management. A continuously operating GPS
deformation monitoring system, so-called CODMS, has been developed that achieved ±2mm
position accuracy (Hartinger and Brunner, 1999). In the largest earthfill dam project in
America, a fully automatic Dam Deformation Monitoring (DDM) system has been developed,
which uses GNSS measurements to provide geodetic information (Whitaker and
Chrzanowski, 2000). The minimum norm quadratic unbiased estimation (MINQUE) method
has been applied to calculate the GPS measurement accuracy in an embankment dam
deformation analysis (Gökalp and Taşçı, 2009). A Continuously Operating Reference Station
(CORS) network has been widely used in monitoring ground movement, deformation and
subsidence due to its high reliability and cost-effective infrastructure. Zhang et al (2005) have
investigated the feasibility using a regional CORS network data in deformation monitoring
and analysed the precision and stability of the CORS network.
In this paper the authors present the design and architecture of an Automatic GNSS
Embankment Deformation Monitoring System (AGEDMS). The results of a field example
including the detailed data processing strategies and achievable accuracy are analysed and
compared in terms of real-time data processing and post data processing situations. In
addition, the performance of different data processing strategies for a real movement case
study is discussed. In the last section, we conclude our study with the key findings and future
suggestions.
2. SYSTEM ARCHITECTURE
To achieve the required accuracy at a reasonable cost, the developed AGEDMS comprises
five types of components, including a data processing centre, reference stations, monitoring
stations, user applications and a communication system. In an experiment described below,
the user applications mainly involve data analysis/management and producing monitoring
reports. The on-site field communications modules use GSM modems to send GNSS data to a
data processing centre server which is a Trimble Pivot platform (Drummond 2010). Figure 1
shows the AGEDMS schematic diagram.

Figure 1. AGEDMS schematic diagram
2.1 Hardware
The characteristic features of the AGEDMS hardware are as follows.
1) Reference stations: Two base stations are used. One base station is a SPS855 GNSS
Modular Receiver with a Zephyr 3 geodetic antenna. The other is a Trimble NetR9
with a Leica AT 504 GG Choke Ring antenna.
2) Monitoring stations: Five Trimble NetR9 Ti-M receivers with AG25 antennas.
3) Communications modules: Five data loggers convert the received GNSS data into
TCP/IP format and send it back to the server with 4G modems.
4) Solar panels: Five solar panels and batteries lasting for 120 hours.
5) Observation pillars: Five concrete filled galvanised pipe observation pillars of 1m
height.
Figure 2 shows the designed AGEDMS monitoring station. In general, access to the road
embankment site is highly restricted due to the proximity of heavy plant in the area and the
substantial risk of collapse or failure of the embankment. The equipment shown in Figure 2
can be installed within 1 hour per station by experienced staff.

Figure 2. An AGEDMS monitoring station
2.2 Software
The Trimble 4D (T4D) Control software (Version 4.6.2) is installed on the data processing
centre to provide multiple real-time GNSS processing engines for different monitoring tasks.
It is the core of AGEDMS which controls the measurement, processes the data and provides
scheduled reports or early warning messages.
In AGEDMS configuration, seven modules are applied in this application as follows (Trimble
Navigation Limited 2016).
1) Device Manager: To configure and view the monitoring data from reference GNSS
stations’ receivers.
2) GNSS Receiver: To control the connected GNSS receiver data, analyse the
consistency of multi-frequency data and detect the receiver errors.
3) Ephemeris Manager: To collect GNSS satellites orbit information and provide it to
other modules.
4) Synchronizer: To collect and pass on data from Device Manager module and send it to
the Processing Engines within the same epoch of data.
5) RTK Engine: To take the receiver observations and processes either baseline or station
positions to determine and pass on high quality coordinates for a given set of stations
within the monitoring network in real-time.
6) Post Processing Engine: To process stored raw GNSS receiver data and automatically
estimate positions from baseline combinations with overlapping time sequences either
in static mode or in kinematic mode.

7) Integrity Monitoring:
a. To process position adjustment and update position over time;
b. Data visualization and output position into the database;
c. Alarm generation.
2.3 Observation Network Design
The purpose of the AGEDMS monitoring network is to mitigate risk and provide a continuity
of monitoring throughout the life of the road embankment remedial works. The AGEDMS
monitoring network should meet the following requirements (Kuang 1991; Blachowski et al,
2010):
• The distribution of monitoring stations must correspond to road embankment potential
movement area;
• The reference stations have to be located outside the expected deformation area;
• Considering construction operation plans and budget limit;
• Physical constraints, e.g., the multipath influence and obstructions.
2.4 Alarms and Reports
The AGEDMS software platform can provide continuous data processing results in real-time
and ‘on-time’ warnings of impending danger. The precision of the solutions need to satisfy
sub-centimetre horizontal displacement detection requirements with 95% confidence.
Depending on the severity and type of the alarms, the AGEDMS automatically sends SMS or
e-mail messages to specific stakeholders, so users can log in at any time and determine the
legitimacy or severity of the alarm. To avoid gross errors or false alarms occurring frequently,
the alarm definition is configured as,
• More than two monitoring stations exceeding a trigger limit, or
• One monitoring station exceeding a trigger limit more than 30 minutes.
Table 1 lists the AGEDMS monitoring alarm and response action plan as follows,
Trigger Trigger Level Response action
NORMAL
Horizontal solution ≤5mm and
Vertical solution ≤ 10mm
• AGEDMS automatically sends scheduled
normal report of previous monitoring results
to all nominated stakeholders.
WARNING
Horizontal solution >5mm or
Vertical solution >10mm either in one
monitoring station lasting 30 minutes
or occurring simultaneously in more
than 2 monitoring stations
• AGEDMS sends email and SMS alert to all
nominated stakeholders alerting of the type
and magnitude of the monitoring results.
• AGEDMS continues monitoring and
increase frequency of report.
ALARM
Horizontal solution >10mm or
Vertical solution >20mm either in one
monitoring station lasting 30 minutes
or occurring simultaneously in more
than 2 monitoring stations
• AGEDMS sends email and SMS alert to all
nominated stakeholders alerting of the type
and magnitude of notification.
• AGEDMS continues monitoring and
increase frequency of report.
• Perform a visible inspection
Table 1. AGEDMS monitoring alarm and response action plan

As the response plan mentioned, a scheduled report including customised measurement
plots/graphs/tables are sent to recipients. Figure 3 shows an example of daily monitoring
report settings which help stakeholders to check the road embankment deformation
information at the end of the workday.
Figure 3. AGEDMS report settings
3. PRACTICAL EXAMPLE
An experiment road embankment about 100m length is selected in Queensland, which
comprised of several hundred thousand cubic metres of fill on an existing slope. The
AGEDMS was designed which included 2 reference stations and 5 monitoring stations.
Additionally, one of the monitoring stations inside the deformation monitoring area served as
an extra base station for internal quality check purposes with 50m baseline lengths.
Figure 4-1 shows the proximity of two reference stations which were applied in this
experiment:
• Base 1: A construction base station (Tier 3) transferring data via TCP/IP client with a
4G modem, the distance to deformation monitoring area is about 1.5km.
• CORS 1: A Regulation 13 Certificated base station (Tier 2) through NTRIP
broadcaster service, the distance to deformation monitoring area is about 4.8km.

Figure 4-2 shows the extra ‘base station’ situated approximately in the centre of deformation
area.
Figure 4-1. Reference stations distribution Figure 4-2. Monitoring stations distribution
3.1 Description of experiment processing strategy
The AGEDMS measurements were processed in two modes: real-time (RT) and post-process
(PP) solutions. The real-time positioning result is used to automatically alert nominated staff
in this experiment when the location or position of the road embankment changes exceeded
predefined limits, while the post-processing scheme is executed to verify and analyse the real-
time results.
To remove outliers and smooth the position estimates, several filtering methods with user-
specified settings are applied as follows,
• Outlier filtering using the median, which takes 5 epochs to remove outliers from raw
data.
• Weight Mean (WM), which uses a specified period of processed data and computes a
weighted mean from the set of data and forwards only this average to the follow-on
modules. A 2-hour sliding time window is applied in this experiment.
• Kalman Filter (KF) with four design assumptions: 1) No motion expected; 2) Highest
accuracy; 3) Comparatively large delay of reaction to position changes; 4) The filter
output converges.
In the experiment, the median filter will be applied before other data smoothing methods,
such as the Weighted Mean or the Kalman Filter. Table 2 lists different data processing
configurations in this experiment.
Analysis Name Time delay (hrs)
RT-Internal Displacement Check Real time
RT-BASE1-KF-Static Real time
RT-CORS1-KF-Static Real time
PP- BASE1-24Hour 24
PP- CORS1-24 Hour 24
Table 2. Different data processing configurations in the experiment
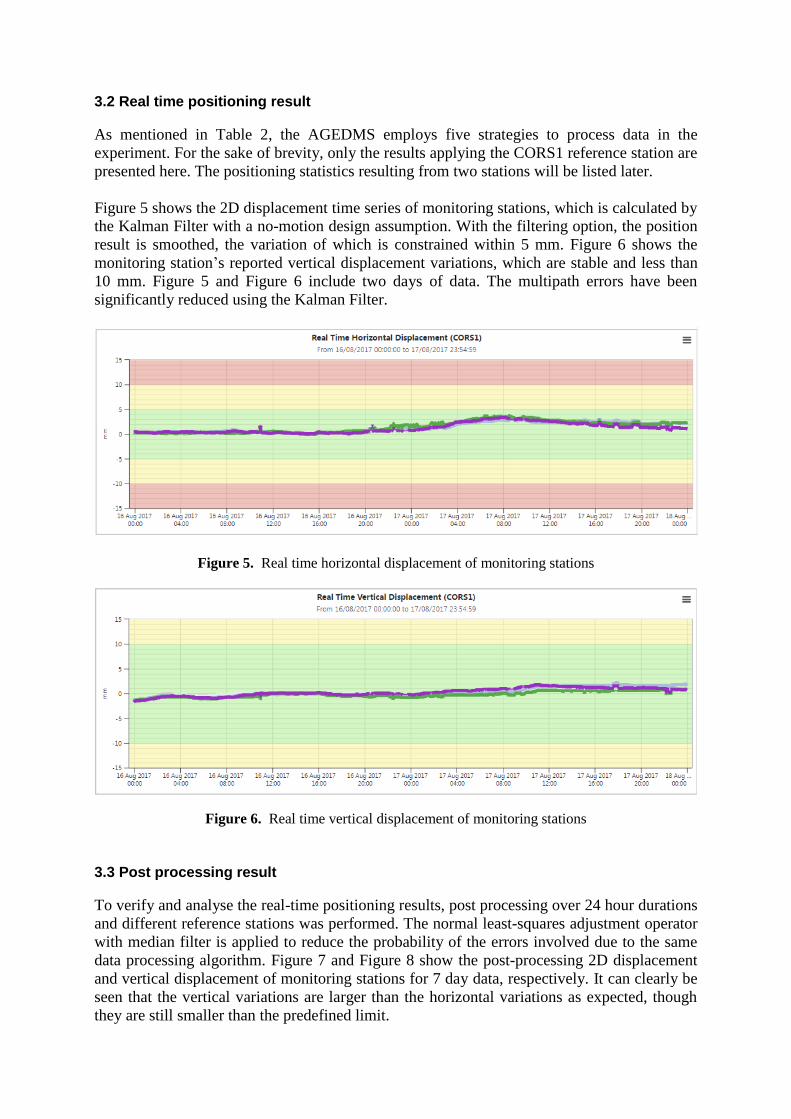
3.2 Real time positioning result
As mentioned in Table 2, the AGEDMS employs five strategies to process data in the
experiment. For the sake of brevity, only the results applying the CORS1 reference station are
presented here. The positioning statistics resulting from two stations will be listed later.
Figure 5 shows the 2D displacement time series of monitoring stations, which is calculated by
the Kalman Filter with a no-motion design assumption. With the filtering option, the position
result is smoothed, the variation of which is constrained within 5 mm. Figure 6 shows the
monitoring station’s reported vertical displacement variations, which are stable and less than
10 mm. Figure 5 and Figure 6 include two days of data. The multipath errors have been
significantly reduced using the Kalman Filter.
Figure 5. Real time horizontal displacement of monitoring stations
Figure 6. Real time vertical displacement of monitoring stations
3.3 Post processing result
To verify and analyse the real-time positioning results, post processing over 24 hour durations
and different reference stations was performed. The normal least-squares adjustment operator
with median filter is applied to reduce the probability of the errors involved due to the same
data processing algorithm. Figure 7 and Figure 8 show the post-processing 2D displacement
and vertical displacement of monitoring stations for 7 day data, respectively. It can clearly be
seen that the vertical variations are larger than the horizontal variations as expected, though
they are still smaller than the predefined limit.

Figure 7. Post processing horizontal displacement of monitoring stations
Figure 8. Post processing vertical displacement of monitoring stations
3.4 Movement detection
Figure 9 shows the reported northing displacement of GNSS receiver R9 0117 exceeded 5
mm on 18 August 2017 and remained over 5 mm since. All the baselines are less than 100
meters shown in Figure 4-2. Figure 10 and Figure 11 show the relative easting and vertical
displacement reported by the other 4 GNSS receivers with R9 1360.
Figure 9. Real time northing displacement of monitoring stations

Figure 10. Real time northing displacement of monitoring stations
Figure 11. Real time northing displacement of monitoring stations
Table 3 summarises the statistical information in the experiment. The tabulated information is
calculated from all the data recorded during the experiment, while the previous figures in this
paper only show part of the results due to paper-length restrictions.
Analysis Name
3σ Northing (mm)
3σ Easting (mm)
3σ Height (mm)
Internal Check 3 3 6
RT-BASE1-KF-Static 2 2 7
RT-CORS1-KF-Static 1 1 6
PP- BASE1-24Hour 2 2 10
PP- CORS1-24 Hour 1 1 3
Table 3. Statistic information of different configurations in this experiment
4. CONCLUSIONS
Road embankments in Queensland have experienced large settlements since construction.
Conventional geodetic techniques, e.g., Total Station measurement which require extensive
manual work and much time, also increase the construction overhead. The AGEDMS has
been developed to enhance safety alerting and risk management during the road embankment
construction. The system performance has been evaluated in a real experiment area. The

experiment has demonstrated several key learnings for monitoring sudden and gradual
deformation of embankments, which are summarised in the following.
• Employing geodetic or monitoring-grade GNSS antennas and receivers in base
stations. It is also important to select a clear line of sight site and low multipath
environments for reference stations. Applying high grade GNSS receivers and
antennas in good observation environment and longer baseline length can outperform
lower grade receivers and antennas even with shorter baselines.
• Optimal stable base station location close to the monitoring site. Establishing the base
station as close to but outside of the deformation area can improve the position
solution accuracy in both real-time and post processing modes. The base station
should have a solid pillar foundation and a prescribed height with minimal thermal
expansion properties and multipath interference.
• High precision monitoring solutions can be achieved. A horizontal SU of 3mm and
vertical SU of 6mm can be achieved in real time when the baseline lengths don’t
exceed 200m. In terms of post processing, results are shown herein that indicate
horizontal SU of 2mm and vertical SU of 4mm can be achieved for observation
periods of 24 hours.
• Multiple base stations improve results accuracy and reliability. The presence of
multiple base stations not only improves the positional accuracy, but also and more
importantly enhances the AGEDMS reliability and integrity.
Previous AGEDMS systems employ high-grade dual-frequency receivers as monitoring
stations. Herein, the authors have developed a more recent version of an AGEDMS that
employs single-frequency receivers to achieve sub-centimetre position monitoring accuracy.
Thus, this recent version of AGEDMS significantly reduces the total cost and can satisfy
many other similar applications, e.g., landslide and structural health monitoring.
ACKNOWLEDGEMENTS
The authors would like to thank Brent Dawson and Roderick Yann of Ultimate Positioning
Group Pty Ltd for their assistance of this experiment.
REFERENCES
Blachowski, J., Milczarek, W., & CACOŃ, S. (2010). Project of a rock mass surface deformation
monitoring system in the Walbrzych coal basin. Acta Geodynamica et Geomaterialia, 7(3), 349-
354.
Drummond, P. (2010). Combining CORS networks, automated observations and processing for
network RTK integrity analysis and deformation monitoring. Paper presented at the FIG
Congress 2010, Sydney, Australia.
Gökalp, E., & Taşçı, L. (2009). Deformation monitoring by GPS at embankment dams and
deformation analysis. Survey Review, 41(311), 86-102.
Hartinger, H., & Brunner, F. K. (1999, September). Development of a monitoring system of landslide
motions using GPS. In 9th FIG Symp. on Deformation Monitoring (pp. 29-38).
Hsi, J. P., & MacGregor, J. P. (1999). Prediction and Monitoring of Embankment Performance. In
Proceedings 8th Australia New Zealand Conference on Geomechanics: Consolidating
Knowledge (p. 259). Australian Geomechanics Society.

Kuang, S. L. (1991). Optimization and design of deformation monitoring scheme. Ph. D. dissertation,
Dept. of Surveying Engineering, 179.
Meng, X., Roberts, G. W., Dodson, A. H., Ince, S., & Waugh, S. (2006). GNSS for structural
deformation and deflection monitoring: implementation and data analysis. Spectrum.
Oh, E. Y. N., Balasubramaniam, A. S., Surarak, C., Bolton, M., Chai, G. W. K., Huang, M., & Braund,
M. (2007). Behaviour of a highway embankment on stone columns improved estuarine clay. In
Proc., 16th Southeast Asian Geotechnical Conf (Vol. 1, pp. 567-572).
Pesci, A., Loddo, F., Teza, G., Cenni, N., & Casula, G. (2008). Analyzing Virtual Reference Station
for GPS surveying experiments and applications in a test site of the northern Apennine (Italy).
Annals of Geophysics.
Trimble Navigation Limited. (2016). Trimble 4D Control Server Help Document. Accessed on: 21
Nov. 17. [Online]. Available: http://help.web.t4d.trimble.com/version4.6/server/indexpage.htm
Whitaker, C., & Chrzanowski, A. (2000). Design of an Automated Dam Deformation Monitoring
System: A Case Study. Journal of Geospatial Engineering, 2(1), 23-34.
Xie, J., & KoK, B. W. C. (2015) Long term performance prediction of road embankment on estuarine
deposits: a case study in Southeast Queensland. Fifth International Conference on
Geotechnique, Construction Materials and Environment, Osaka, Japan, N
Zhang, K., Hu, Y., Liu, G., Wu, F., & Deakin, R. (2005). Deformation monitoring and analysis using
Victorian regional CORS data. Positioning, 1(09), 0