aravind naragund, 4kv13ecd01
TRANSCRIPT

VISVESVARAYA TECHNOLOGICAL UNIVERSITY
BELAGAVI- 590018, Karnataka
A PROJECT REPORT
ON
POWER QUALITY IMPROVEMENT IN DC DRIVES BY
SUPPRESSING HARMONICS
A Dissertation work submitted in partial fulfillment for the award of the degree of
MASTER OF TECHNOLOGY
IN
COMPUTER APPLICATION IN INDUSTRIAL DRIVES
Submitted by
ARAVIND NARAGUND
USN: 4KV13ECD01
Under the Guidance of
Prof. K.V. DEVADAS. B.E.,M.Tech.,MISTE
Professor & HOD
Department of E & E Engineering
DEPARTMENT OF ELECTRICAL AND ELECTRONICS ENGINEERING
K.V.G. COLLEGE OF ENGINEERING SULLIA, D.K., PIN-574 327, KARNATAKA
2014-2015


ABSTRACT
The vast majority of the electromagnetic contamination issues made in power system are
because of the non-linear attributes of load and fast switching of power electronic
devices gadgets which are utilized as a part of converter circuits. The diode bridge
rectifiers/converters which are used in electrical DC drives system, produces significant
harmonic voltages and currents.The diode bridge rectifiers are also considered as a major
contributor to the power system harmonics that are the major power quality issues. These
harmonics causes various detrimental effects such as increasing the copper loss, iron
loss, dielectric loss, thermal stress and hence reduces the efficiency of power system
equipments.
This project presents various techniques like passive filter, shunt active filter,
sinusoidal pulse width modulation and multipulse converters for harmonics reduction.
The power quality parameters such as “Total Harmonic Distortion of voltage” (THDV)
and “Total Harmonic Distortion of current” (THDI) has determined in each case of
above said techniques for different ratings of DC motor and also extended the work to
higher pulse converters (up to 96 pulse).
By using MATLAB/Simulink for simulation, the clear comparison of power
quality parameters has made between before and after application of above discussed
techniques. Simulation results obtained shows that there is reduction in total harmonic
distortion (THD) with application of power quality improvement techniques.
ACKNOWLEDGEMENT
A dissertation work of this nature with the co-ordination and support from many, for its
successful completion and I am fortunate enough in this direction. It gives me great
pleasure to acknowledge and express my deep sense of gratitude to those who have
helped me throughout this work.
I would like to articulate my profound gratitude and indebtedness to my project
guide Prof. K.V. DEVADAS, who is also Head of the Department of Electrical and
Electronics Engineering, KVG College of Engineering, Sullia for his excellent guidance,
encouragement and support throughout the course. I consider it to be an honour for
working under him.
I extend my heartfelt gratitude to Mr. KIRAN B.V., Assistant Professor and
Project coordinator, Department of Electrical and Electronics Engineering KVG College
of Engineering, Sullia, who has been a great source of inspiration and for his help &
encouragement.
I am also thankful to Dr. N.A. JNANESH, Principal, KVG College of
Engineering, Sullia, for providing an opportunity to study in this great Institution.
I am indebted to Late Dr. KURUNJI VENKATRAMANA GOWDA and
Dr. RENUKA PRASAD K.V., General Secretary of A.O.L.E for providing an
environment with all facilities that helped me in completing my project.
I sincerely thank faculty members of the Department of Electrical and Electronics
Engineering, KVG College of Engineering, Sullia, for helping me in completing this
dissertation work successfully.
Most importantly, I would like to express my deepest thanks to my family for
giving me a life of opportunities and their care, support, encouragement, and inspiration
all along in my academic endeavors.
Last but not the least, My sincere thanks to all of my friends who have patiently
extended all sorts of help for accomplishing this undertaking.

CONTENTS
CHAPTER No. TITLE PAGE No.
LIST OF FIGURES i
LIST OF TABLES iv
NOMENCLATURE v
1 INTRODUCTION 1
1.1 Literature Survey 2
1.2 Scope and Objective of the Present Work 4
1.3 Organization of the Dissertation Report 4
2 POWER QUALITY IMPROVEMENT
TECHNIQUES
5
2.1 Passive Filters 5
2.2 Active Filters 6
2.2.1 Shunt Active Filter 6
2.3 Pulse Width Modulation 8
2.4 Multipulse Converters 10
2.4.1 12-Pulse Converter 11
2.4.2 24, 36, 48 and 96-Pulse converters 12
3 MATHEMATICAL MODELING 13
3.1 Separately Excited DC Motor 13
3.2 Modeling of Separately Excited DC Motor 14
4 DEVELOPMENT OF MATLAB/SIMULINK
MODELS
16
4.1
4.2
Simulation Tools
MATLAB/Simulink Models of Proposed Work
16
16
5 SIMULATION RESULTS AND DISCUSSIONS 27
5.1 Simulated Results before Application of Filters 27
5.2 Simulated Results with Application of Passive Filter 28
5.3 Simulated Results with Application of Shunt Active
Filter
29
5.4 Simulated Results before Application of PWM Signals 30
5.5 Simulated Results with Application of PWM Signals 31

5.6 Simulated Results of Multipulse Converters 32
5.6.1 4-Pulse Converter 32
5.6.2 12-Pulse Converter 33
5.6.3 24-Pulse Converter 34
5.6.4 36-Pulse Converter 35
5.6.5 48-Pulse Converter 36
5.6.6 96-Pulse Converter 37
5.6.7 Comparison of THDI and THDV for Multipulse
Converters with Different Ratings of DC Motor
38
5.7 Discussions 40
6 CONCLUSION AND SCOPE FOR FUTURE
WORK
41
6.1 Conclusion 41
6.2 Scope for Future Work 41
BIBLIOGRAPHY
APPENDIX
PROJECT OUTCOME
LIST OF FIGURES
FIGURE No. TITLE PAGE No.
1.1 Three phase bridge rectifier supplying a separately
excited DC motor
1
1.2 Source Current Waveform 1
2.1 Diode bridge rectifier 5
2.2 Line voltage and Output voltage 6
2.3 Block diagram for shunt active filter 7
2.4 Waveforms showing operation of shunt active filter 7
2.5 Voltage source converter topology for active filters 8
2.6 Schematic diagram of three phase controlled rectifier 9
2.7 Sinusoidal Pulse Width Modulation 10
2.8 Schematic diagram of 12-pulse converter 12
3.1 Separately excited DC motor 13
3.2 Equivalent circuit of separately excited DC motor 14
4.1 Simulation model of 6-pulse diode bridge rectifier
supplying aseparately excited DC motor
17
4.2 Simulation model of 6-pulse diode bridge rectifier
supplying a separately excitedDC motor with passive
filter
17
4.3 Simulation model of 6-pulse diode bridge rectifier
supplying a separately excitedDC motor with application
of shunt active filter
18
4.4 Simulation model of 6-pulse controlled rectifier
supplying a separately excitedDC motor before
application of PWM signals.
19
4.5 Simulation model of 6-pulse controlled rectifier
supplying a separately excitedDC motor with application
of PWM signals.
20
4.6 Simulation model of 4-pulse diode bridge rectifier
supplying a separately excitedDC motor
21
4.7 Simulation model of 12-pulse diode bridge rectifier
supplying a separately excitedDC motor.
22
4.8 Simulation model of 24-pulse diode bridge rectifier
supplying a separately excitedDC motor
23
4.9 Simulation model of 36-pulse diode bridge rectifier
supplying a separately excitedDC motor
24
4.10 Simulation model of 48-pulse diode bridge rectifier
supplying a separately excitedDC motor
25
4.11 Simulation model of 96-pulse diode bridge rectifier
supplying a separately excitedDC motor
26
5.1 Source current of 6-pulse diode bridge rectifier 27
5.2 FFT analysis for source current of 6-pulse diode bridge
rectifier (THDI=15.27%)
27
5.3 Source current of 6-pulse diode bridge rectifier with
passive filter
28
5.4 FFT analysis for source current of 6-pulse diode bridge
rectifier with passive filter (THDI=4.16%)
28
5.5 Source current of 6-pulse diode bridge rectifier with
application of shunt active filter
29
5.6 FFT analysis for source current of 6-pulse diode bridge
rectifier with application of shunt active filter
(THDI=0.91%)
29
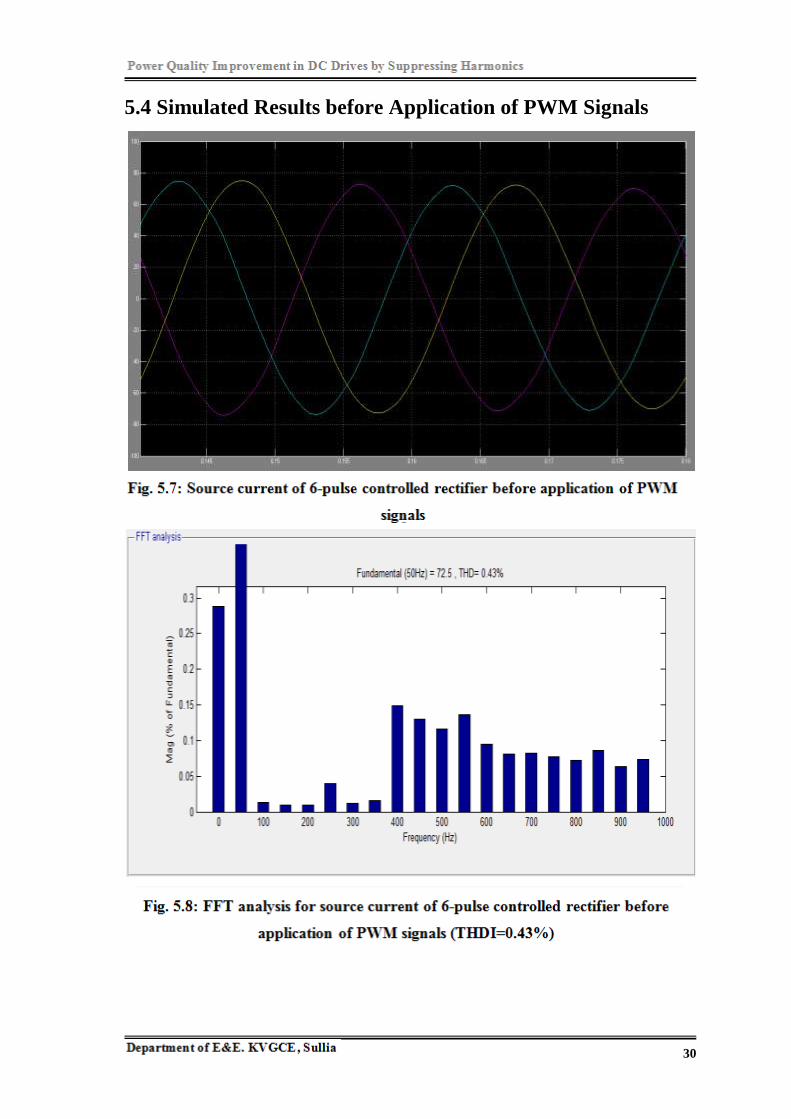
5.7 Source current of 6-pulse controlled rectifier before
application of PWM signals
30
5.8 FFT analysis for source current of 6-pulse controlled
rectifier before application of PWM signals
(THDI=0.43%)
30
5.9 Source current of 6-pulse controlled rectifier with
application of PWM signals
31
5.10 FFT analysis for source current of 6-pulse controlled
rectifier with application of PWM signals
(THDI=0.20%)
31
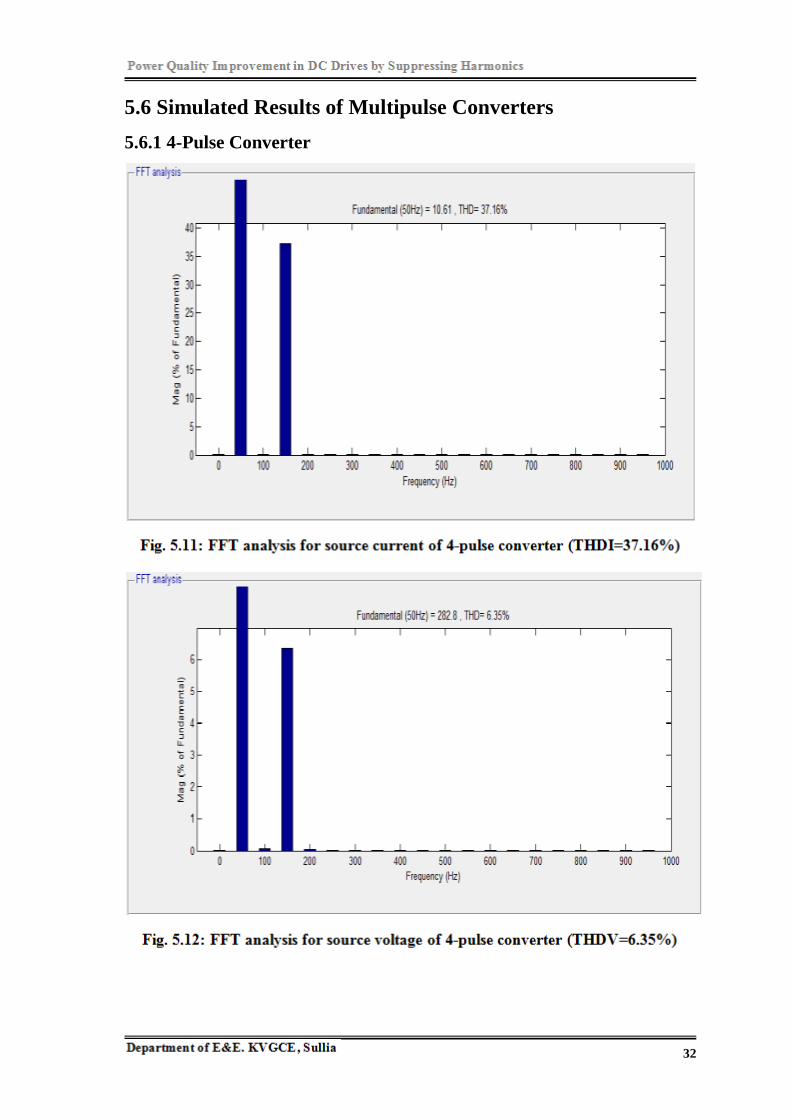
5.11 FFT analysis for source current of 4-pulse converter
(THDI=37.16%)
32
5.12 FFT analysis for source voltage of 4-pulse converter
(THDV=6.35%)
32
5.13 FFT analysis for source current of 12-pulse converter
(THDI=10.04%)
33
5.14 FFT analysis for source voltage of 12-pulse converter
(THDV=6.04%)
33
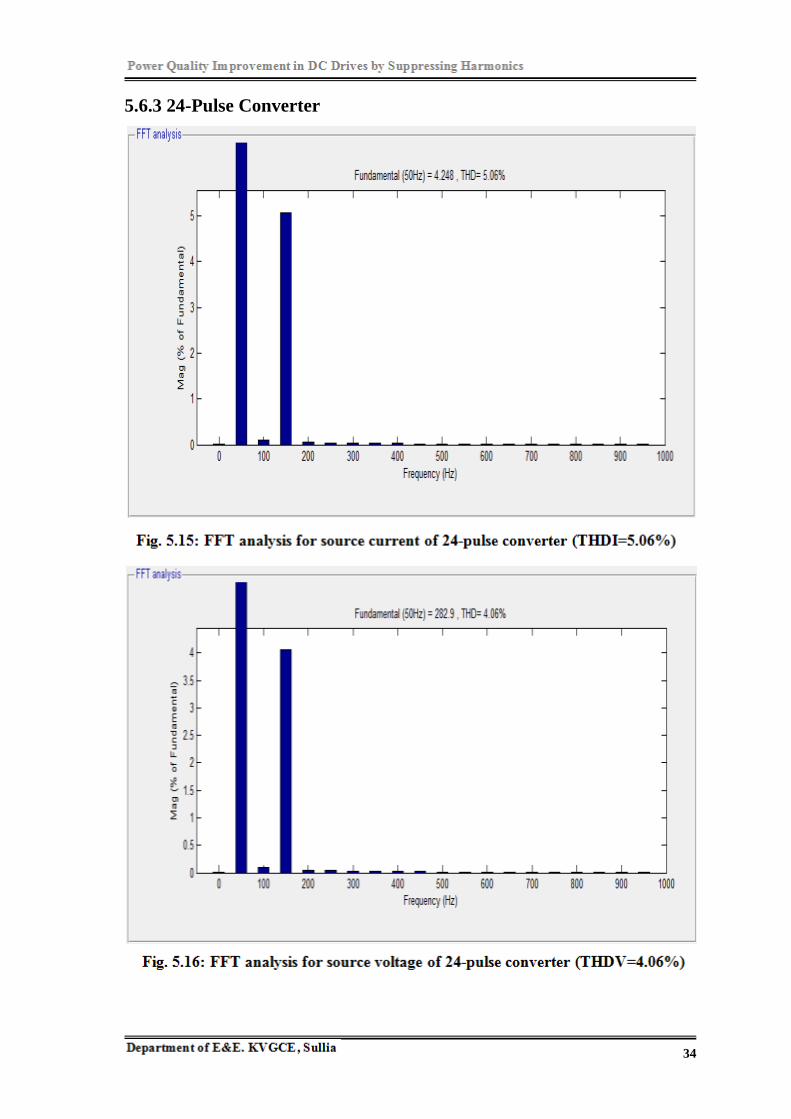
5.15 FFT analysis for source current of 24-pulse converter
(THDI=5.06%)
34
5.16 FFT analysis for source voltage of 24-pulse converter
(THDV=4.06%)
34
5.17 FFT analysis for source current of 36-pulse converter
(THDI=4.10%)
35
5.18 FFT analysis for source voltage of 36-pulse converter
(THDV=2.10%)
35
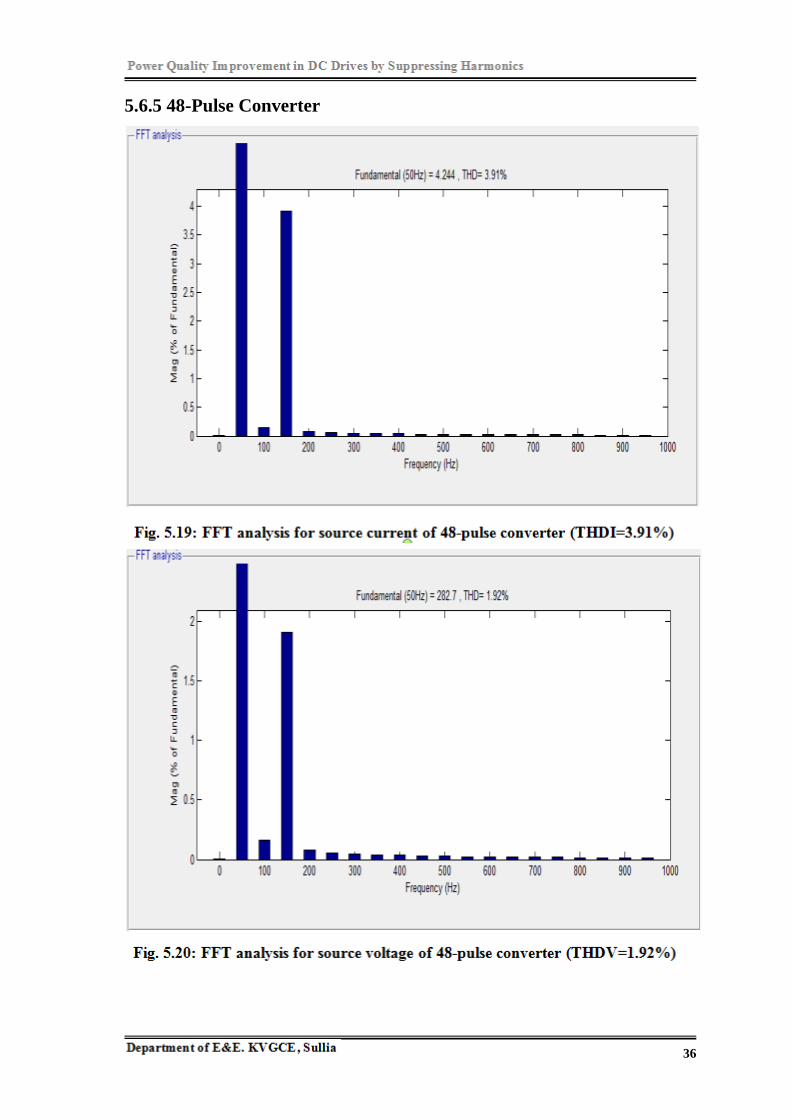
5.19 FFT analysis for source current of 48-pulse converter
(THDI=3.91%)
36
5.20 FFT analysis for source voltage of 48-pulse converter
(THDV=1.92%)
36
5.21 FFT analysis for source current of 96-pulse converter
(THDI=2.40%)
37
5.22 FFT analysis for source voltage of 96-pulse converter
(THDV=1.14%)
37
5.23 Comparison of %THDI for Multipulse Converters 38
5.24 Comparison of %THDV for Multipulse Converters 39

LIST OF TABLES
TABLE No. TITLE PAGE No.
2.1 Harmonics present in 6, 12, 24, 36, 48, and 96-pulse
converters
11
5.1 Comparison of THDI for Multipulse Converters 38
5.2 Comparison of THDV for Multipulse Converters 39

NOMENCLATURES
Symbols Definition
: Back EMF of the motor
: Armature current
: Field current
: Armature inductance
: Armature resistance
: Load torque
: Applied terminal voltage to the DC motor
Ac : Amplitude of carrier voltage
Ar : Amplitude of reference voltage
Cf : Filter capacitor
h : Harmonics order
Ic : Harmonics compensating current
IL : Load current
ILH : Harmonic part of the load current
ILR : Real part of the load current
Is : Supply current
p : Pulse number
V : AC supply voltage
Vc : Carrier voltage
VL : Load voltage
Vr : Reference voltage
: Viscous friction of motor
: Rotational inertia of motor
: Internaltorque of the motor
: Motor speed
1
CHAPTER 1
INTRODUCTION
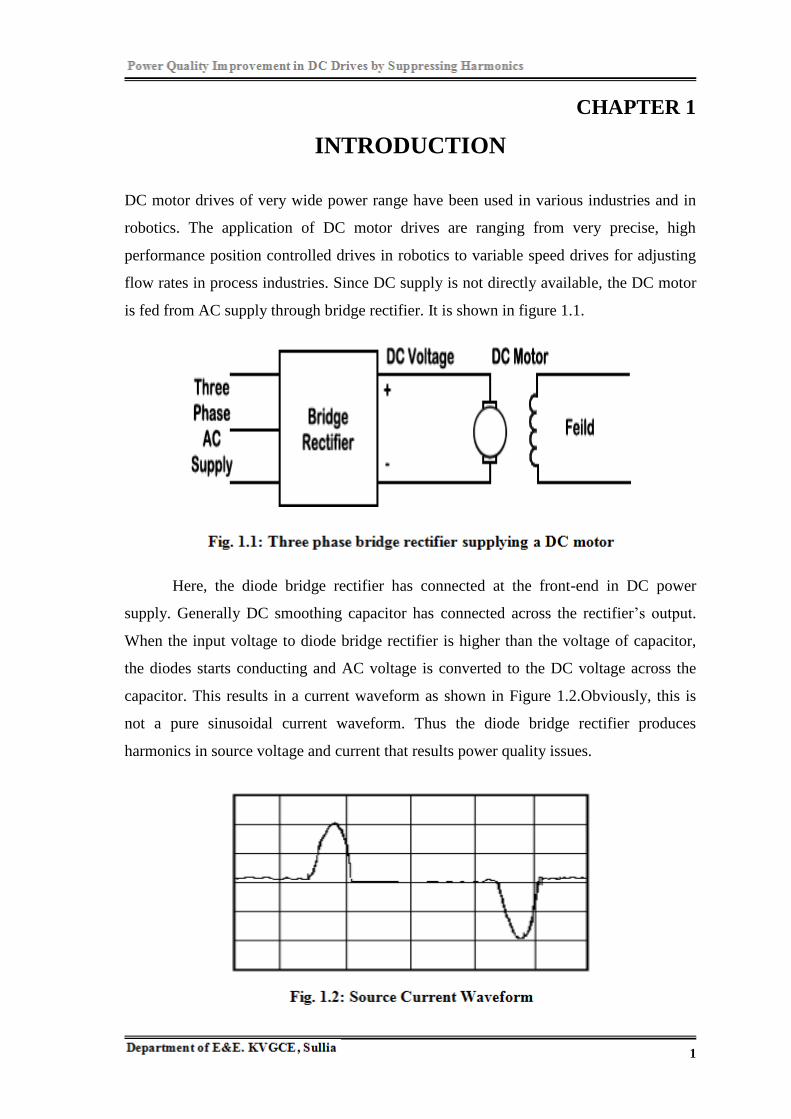
DC motor drives of very wide power range have been used in various industries and in
robotics. The application of DC motor drives are ranging from very precise, high
performance position controlled drives in robotics to variable speed drives for adjusting
flow rates in process industries. Since DC supply is not directly available, the DC motor
is fed from AC supply through bridge rectifier. It is shown in figure 1.1.
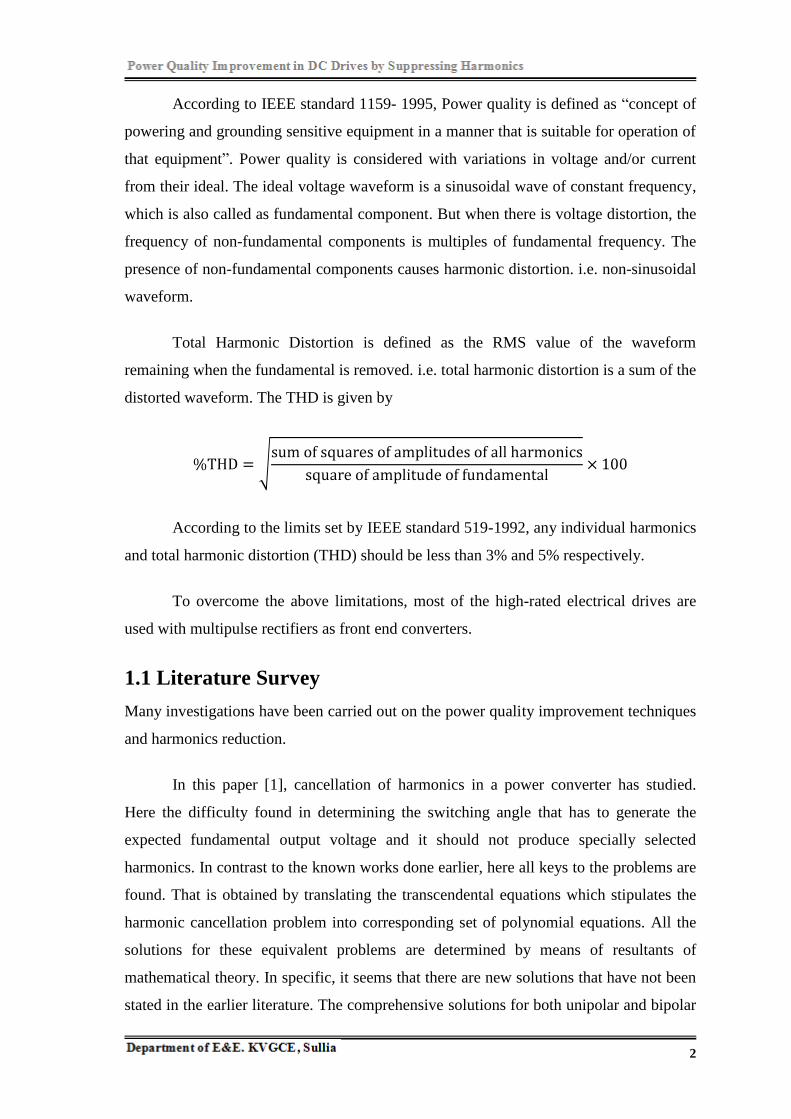
Here, the diode bridge rectifier has connected at the front-end in DC power
supply. Generally DC smoothing capacitor has connected across the rectifier‟s output.
When the input voltage to diode bridge rectifier is higher than the voltage of capacitor,
the diodes starts conducting and AC voltage is converted to the DC voltage across the
capacitor. This results in a current waveform as shown in Figure 1.2.Obviously, this is
not a pure sinusoidal current waveform. Thus the diode bridge rectifier produces
harmonics in source voltage and current that results power quality issues.
2
According to IEEE standard 1159- 1995, Power quality is defined as “concept of
powering and grounding sensitive equipment in a manner that is suitable for operation of
that equipment”. Power quality is considered with variations in voltage and/or current
from their ideal. The ideal voltage waveform is a sinusoidal wave of constant frequency,
which is also called as fundamental component. But when there is voltage distortion, the
frequency of non-fundamental components is multiples of fundamental frequency. The
presence of non-fundamental components causes harmonic distortion. i.e. non-sinusoidal
waveform.
Total Harmonic Distortion is defined as the RMS value of the waveform
remaining when the fundamental is removed. i.e. total harmonic distortion is a sum of the
distorted waveform. The THD is given by
According to the limits set by IEEE standard 519-1992, any individual harmonics
and total harmonic distortion (THD) should be less than 3% and 5% respectively.
To overcome the above limitations, most of the high-rated electrical drives are
used with multipulse rectifiers as front end converters.
1.1 Literature Survey
Many investigations have been carried out on the power quality improvement techniques
and harmonics reduction.
In this paper [1], cancellation of harmonics in a power converter has studied.
Here the difficulty found in determining the switching angle that has to generate the
expected fundamental output voltage and it should not produce specially selected
harmonics. In contrast to the known works done earlier, here all keys to the problems are
found. That is obtained by translating the transcendental equations which stipulates the
harmonic cancellation problem into corresponding set of polynomial equations. All the
solutions for these equivalent problems are determined by means of resultants of
mathematical theory. In specific, it seems that there are new solutions that have not been
stated in the earlier literature. The comprehensive solutions for both unipolar and bipolar
3
switching configuration to cancel the fifth and seventh harmonics are specified. Lastly,
the unipolar situation is again considered where the fifth, seventh, eleventh, and
thirteenth harmonics are eliminated along with confirmatory experimental results [1].
This paper [2] presents harmonic phenomenon. The fourier series is the tool for
harmonics studies in order to understand waveforms behavior owing to nonlinear loads.
The harmonic concepts, definition of harmonic quantities, associated harmonics
difficulties in power distribution systems are described. Moreover, filter applications
such as passive filter in overcoming harmonic problems are discussed. This paper also
investigate the recent developments for active power filter uses power electronic
switching to generate harmonic currents from nonlinear load is then described [2].
This paper [3] presents simplicity in defining the PCC and proposes a method by
which IEEE Std 519 can be connected at the planning step when the exact interest
current is obscure. IEEE Std 519 was initially acquainted in 1981 to deliver direction on
dealing with harmonics injected by power converters and other nonlinear loads so that of
power quality difficulties are avoided. It is being applied by referring engineers and
imposed by utilities more often in current years as the use of adjustable frequency drives
and other nonlinear loads has developed. Two of the more difficult parts of applying
IEEE Std are (i) defining an proper point of common coupling (PCC) and (ii) building up
an interest current at the planning step. This is for the reason that the standard don't
convey a brief importance of the PCC and the proposed significance of interest current is
an esteem that must be controlled by estimations taken after establishment. This paper
presents the writer‟s-best interpretation of IEEE Std 519. It efforts to deliver simplicity
in the determination of the PCC and suggestions a methods by which IEEE Std 519 can
be connected at the planning step when the accurate interest current is obscure [3].

4
1.2 Scope and Objective of the Present Work
The main aim of this project work is to reduce the harmonics in AC supply voltages and
currents of DC drives system fed from three phase AC supply through diode bridge
rectifier.
The objectives of the proposed project work are
1. To develop simulation models for the power quality improvement techniques like
passive filter, shunt active filter, sinusoidal pulse width modulation, and
multipulse converters
2. To carry out the comparative study of all the power quality improvement
techniques on the basis of simulation results.
1.3 Organization of the Dissertation Report
Chapter 1 Discusses electrical DC drives system and how it introduces harmonics in AC
supply voltages and currents. It also presents literature survey, „Scope and Objective of
the present work‟.
Chapter 2 presents various power quality improvement techniques used for
harmonics reduction in DC drives system and also discussed in detail.
Chapter 3 presents the mathematical modeling of separately excited DC shunt
motor in detail.
Chapter 4 presents introduction about the simulation tools. The development of
MATLAB/Simulink models of the proposed work is shown and explained clearly.
Chapter 5 presents the simulated results of proposed work, and comparison of
results for multipulse converters.
Chapter 6 consists of conclusion and scope for future work.

5
CHAPTER 2
POWER QUALITY IMPROVEMENT TECHNIQUES
Power quality can be improved by mitigation of harmonics. The harmonic mitigation
techniques can be classified into precautionary (preventive) solutions and corrective
(remedial) solutions. Phase cancellation or harmonic control in power converters, and
usage of low distortion loads are preventive solutions. Usage of harmonic filters for
compensation of harmonics, reactive power and unbalance are corrective solutions. The
best solutions for harmonic present in the system are filters. The following are types of
the filters generally used for harmonics reduction.
1. Passive filters and
2. Active filters
Apart from application of filters, other techniques used for harmonics reduction are
1. Pulse Width Modulation (PWM) and
2. Multipulse converters
2.1 Passive Filters
In Passive filters, only passive elements are used in addition to the diode bridge rectifier,
to improve the shape of the line current. Obviously, the output voltage is not
controllable.
Figure2.1 shows the diode bridge rectifier that is having non-sinusoidal input AC
line current due to high capacitance value of the capacitor Cf which is used to reduce
ripple in the supply voltage VL of the load. Consequently, the diodes of the rectifier are
conducting for short period of time intervals and hence the input AC line current is
having narrow pulses with harmonic content.

6
Without adding additional components, shape of the line current can be improved
by using low capacitance value for output capacitor Cf. When capacitor of low
capacitance is used, the diodes of rectifiers are conducted for long period of time
intervals and hence ripple in the output DC voltage is more. This solution can be applied
if the load accepts a largely pulsating DC supply voltage.
In the figure 2.2, the output voltage waveforms for two different values of
capacitors highlight the above concept.
The method discussed above do not decrease the harmonics in AC line current
and ripple in the output DC voltage completely. However, another alternative to decrease
harmonics is “Active filter” in order to overcome the above limitations.
2.2 Active Filters
For active filters, active switches are used in conjunction with reactive elements in order
to increase the effectiveness of the line current shaping and to obtain controllable output
voltage. Based on the functions to be performed at different applications to solve
different problems, the active power filters are classified as follows.
1. Shunt Active Filter
2. Series Active Filter and
3. Shunt-Series Active Filter (combination of shunt and series active filters)
2.2.1 Shunt Active Filter
The shunt active filter acts as source of current to provide compensating current for
harmonics in the load current. The harmonics in the load current are cancelled by
introducing the equal and opposite harmonic compensating current provided by the shunt
active filter.

7
1. Basic Operating Principle
Figure 2.3 shows the block diagram of shunt active filter. The shunt active filter is
connected in parallel with the AC supply lines. It consists of PWM inverter with
capacitor (C) at the DC bus. The PWM inverter converts DC into harmonics
compensating current (IC) which is then injected into AC supply lines. Thus it prevents
the harmonic currents flowing from non-linear load into the AC supply.
The current (IL) drawn by non-linear load can be decomposed as
IL = ILR + ILH……………… 2.1
Where, ILR is real part of the load current and ILH is the harmonic part of the load
current. The function of the shunt active filter is to introduce the compensating current IC.
The compensating current IC eliminates the harmonic part of the load current. That is
given by
IC = ILH……………… 2.2
Figure 2.4 shows the waveforms of AC supply voltage (V), current (IL) drawn by
non-linear load, desired supply current (IS) and the compensating current (IC) injected by
the active filter containing all the harmonics, to make supply current sinusoidal.
8
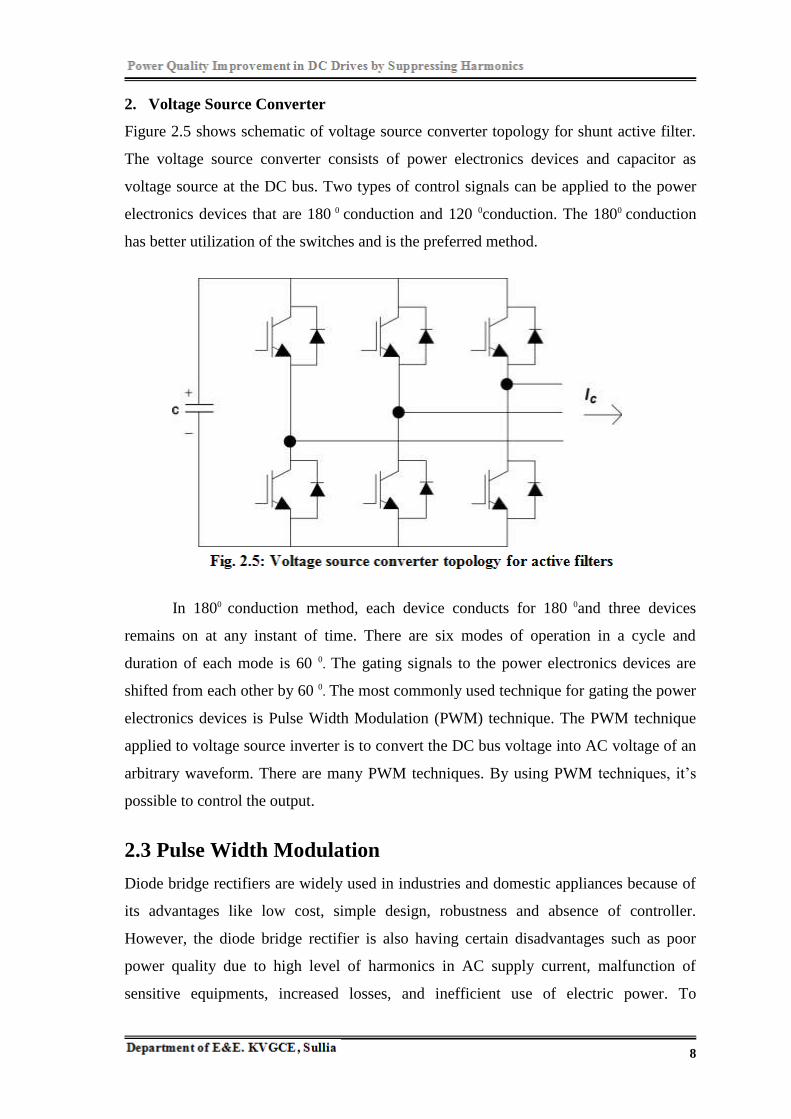
2. Voltage Source Converter
Figure 2.5 shows schematic of voltage source converter topology for shunt active filter.
The voltage source converter consists of power electronics devices and capacitor as
voltage source at the DC bus. Two types of control signals can be applied to the power
electronics devices that are 180 0 conduction and 120 0conduction. The 1800 conduction
has better utilization of the switches and is the preferred method.
In 1800 conduction method, each device conducts for 180 0and three devices
remains on at any instant of time. There are six modes of operation in a cycle and
duration of each mode is 60 0. The gating signals to the power electronics devices are
shifted from each other by 60 0. The most commonly used technique for gating the power
electronics devices is Pulse Width Modulation (PWM) technique. The PWM technique
applied to voltage source inverter is to convert the DC bus voltage into AC voltage of an
arbitrary waveform. There are many PWM techniques. By using PWM techniques, it‟s
possible to control the output.
2.3 Pulse Width Modulation
Diode bridge rectifiers are widely used in industries and domestic appliances because of
its advantages like low cost, simple design, robustness and absence of controller.
However, the diode bridge rectifier is also having certain disadvantages such as poor
power quality due to high level of harmonics in AC supply current, malfunction of
sensitive equipments, increased losses, and inefficient use of electric power. To

9
overcome these problems, many techniques have been proposed for diode bridge
rectifiers. Apart from techniques like passive filters and active filters, the best technique
is pulse width modulation for controlled rectifiers.
Figure 2.6 shows the schematic diagram of three phase controlled rectifier
consisting of six IGBT devices on three legs of the rectifier. The input of rectifier is
connected to the three phase AC source and DC motor is connected to the output of
rectifier. The gating signals for IGBT devices are generated from pulse width modulation
technique.
By using PWM technique, the switching devices (IGBT) are made on and off
many times in a half cycle and also by changing the pulse width, the output has
controlled. There are different methods of varying the widths of pulses and the most
common one is the sinusoidal pulse width modulation (SPWM) shown in fig.2.7. In
SPWM method, the triangular carrier voltage Vc is compared with the sinusoidal
reference voltage Vr to generate pulse widths. The Ac and Ar are the amplitudes of carrier
voltage and reference voltage respectively. The widths of the pulses are varied by
changing the amplitude Ac of carrier voltage or the modulation index (M) from 0 to 1.
The modulation index is defined as,

10
In SPWM technique, pulse widths are varied that is suitable for elimination or
reduction of harmonics.
2.4 Multipulse Converters
In power electronics terminology, multipulse converter can be defined as a converter
operating in a three phase system is having more than six pulses. Generally the pulse
number is a multiple of six, i.e. the multipulse converter consists of several three phase
diode bridge rectifiers connected either in series or parallel on the output side. So 12, 18,
24-pulse converters etc. are possible.
When several diode bridge rectifiers are connected in series or parallel with
proper degree of phase shift between them, the harmonics cancellation takes place such
that the line currents drawn by a p-pulse converter has a harmonics of order h is given by
Where, k=1, 2, 3 …….
11
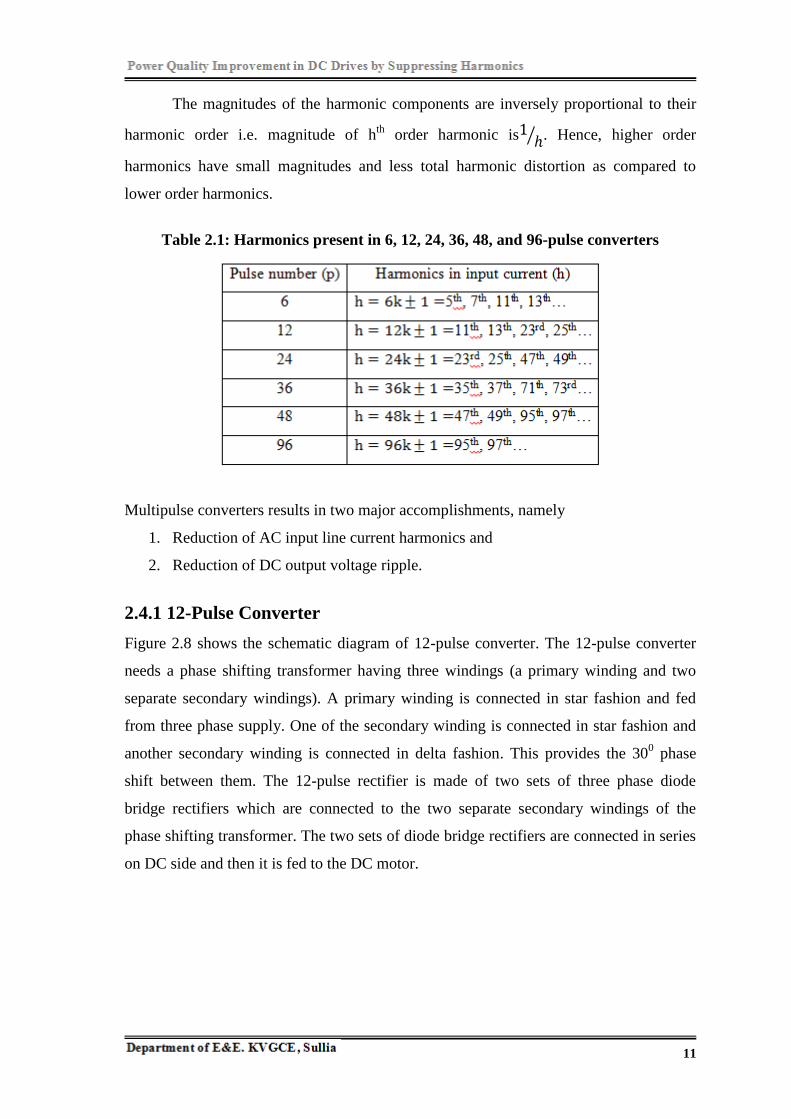
The magnitudes of the harmonic components are inversely proportional to their
harmonic order i.e. magnitude of hth
order harmonic is . Hence, higher order
harmonics have small magnitudes and less total harmonic distortion as compared to
lower order harmonics.
Table 2.1: Harmonics present in 6, 12, 24, 36, 48, and 96-pulse converters
Multipulse converters results in two major accomplishments, namely
1. Reduction of AC input line current harmonics and
2. Reduction of DC output voltage ripple.
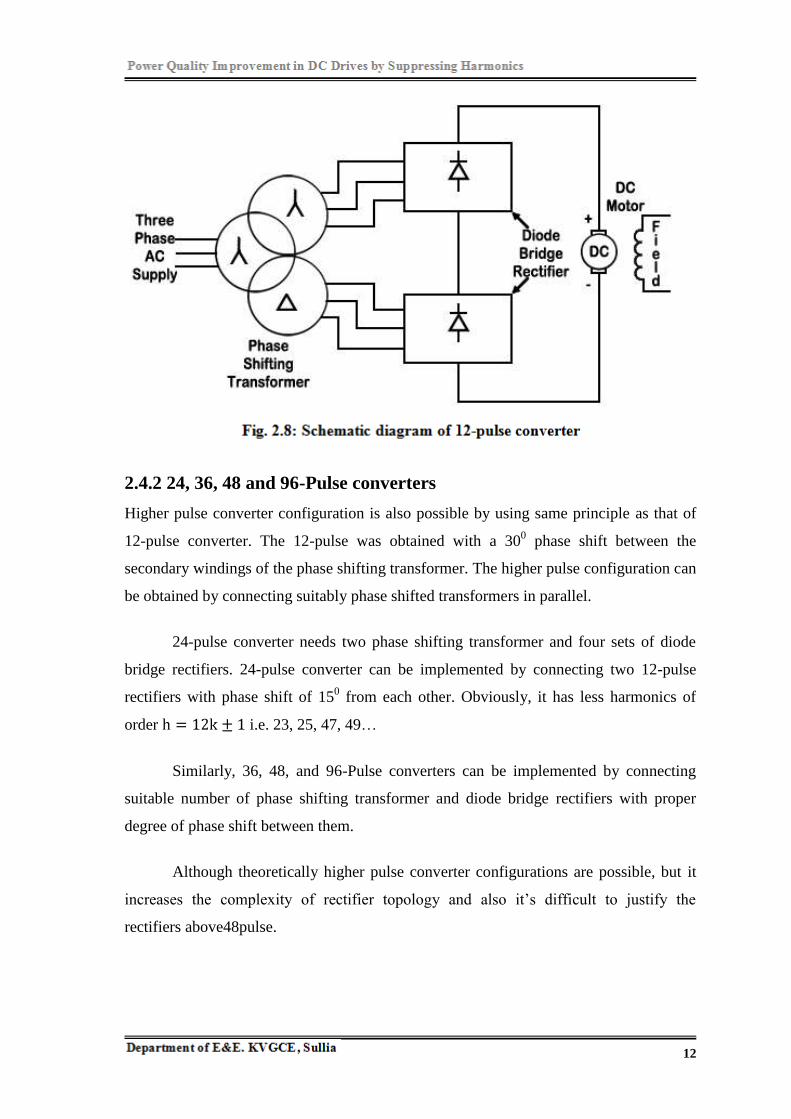
2.4.1 12-Pulse Converter
Figure 2.8 shows the schematic diagram of 12-pulse converter. The 12-pulse converter
needs a phase shifting transformer having three windings (a primary winding and two
separate secondary windings). A primary winding is connected in star fashion and fed
from three phase supply. One of the secondary winding is connected in star fashion and
another secondary winding is connected in delta fashion. This provides the 300 phase
shift between them. The 12-pulse rectifier is made of two sets of three phase diode
bridge rectifiers which are connected to the two separate secondary windings of the
phase shifting transformer. The two sets of diode bridge rectifiers are connected in series
on DC side and then it is fed to the DC motor.
12
2.4.2 24, 36, 48 and 96-Pulse converters
Higher pulse converter configuration is also possible by using same principle as that of
12-pulse converter. The 12-pulse was obtained with a 300 phase shift between the
secondary windings of the phase shifting transformer. The higher pulse configuration can
be obtained by connecting suitably phase shifted transformers in parallel.
24-pulse converter needs two phase shifting transformer and four sets of diode
bridge rectifiers. 24-pulse converter can be implemented by connecting two 12-pulse
rectifiers with phase shift of 150 from each other. Obviously, it has less harmonics of
order i.e. 23, 25, 47, 49…
Similarly, 36, 48, and 96-Pulse converters can be implemented by connecting
suitable number of phase shifting transformer and diode bridge rectifiers with proper
degree of phase shift between them.
Although theoretically higher pulse converter configurations are possible, but it
increases the complexity of rectifier topology and also it‟s difficult to justify the
rectifiers above48pulse.
13
CHAPTER 3
MATHEMATICAL MODELING
This chapter deals with the separately excited DC motor and its mathematical modeling.
The DC motors are used in various applications such as defence, industries,
robotics etc. The preferences are because of their simplicity, high starting torque, near
linear operation and ease of speed control. DC drives are less complex with a single
power conversion from AC to DC. DC motors have a long tradition used as adjustable
speed machines and a wide range of options have evolved for this purpose. DC motors
have armature and field circuits, both of which carry direct current. The mutual electric
connections between these circuits give rise to different types of DC motors, they are,
1. Separately excited DC motor and
2. Self-excited DC motor
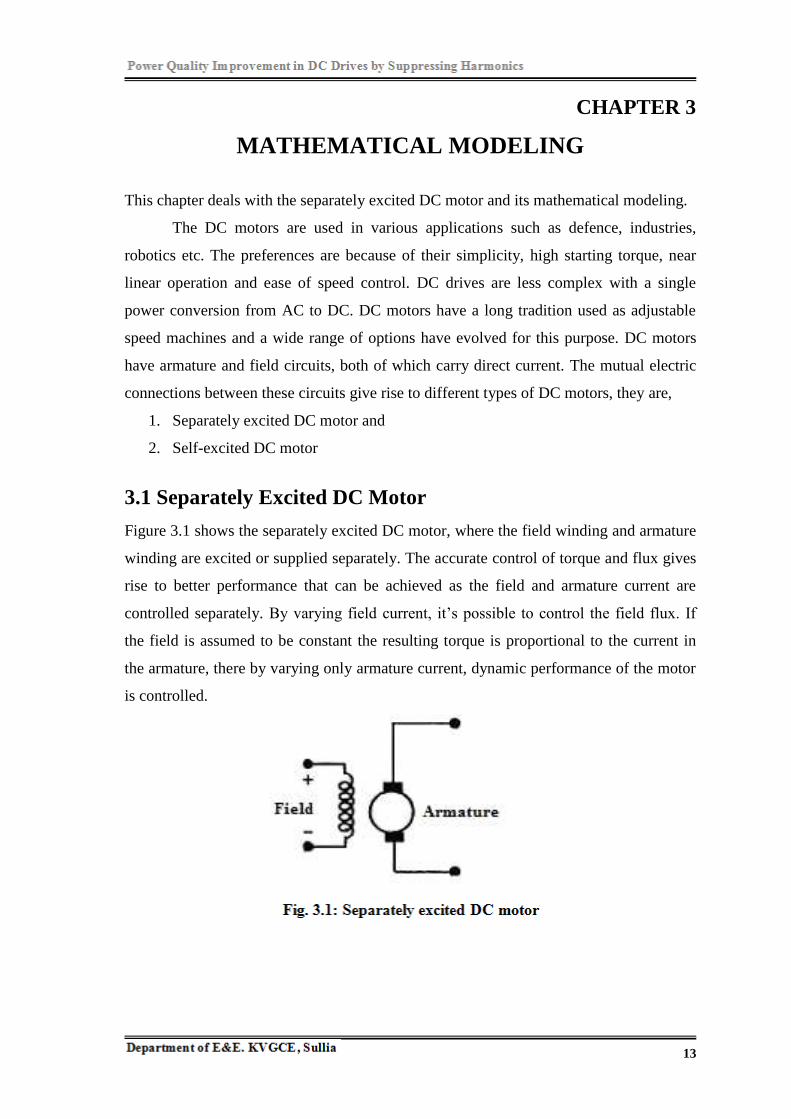
3.1 Separately Excited DC Motor
Figure 3.1 shows the separately excited DC motor, where the field winding and armature
winding are excited or supplied separately. The accurate control of torque and flux gives
rise to better performance that can be achieved as the field and armature current are
controlled separately. By varying field current, it‟s possible to control the field flux. If
the field is assumed to be constant the resulting torque is proportional to the current in
the armature, there by varying only armature current, dynamic performance of the motor
is controlled.
14
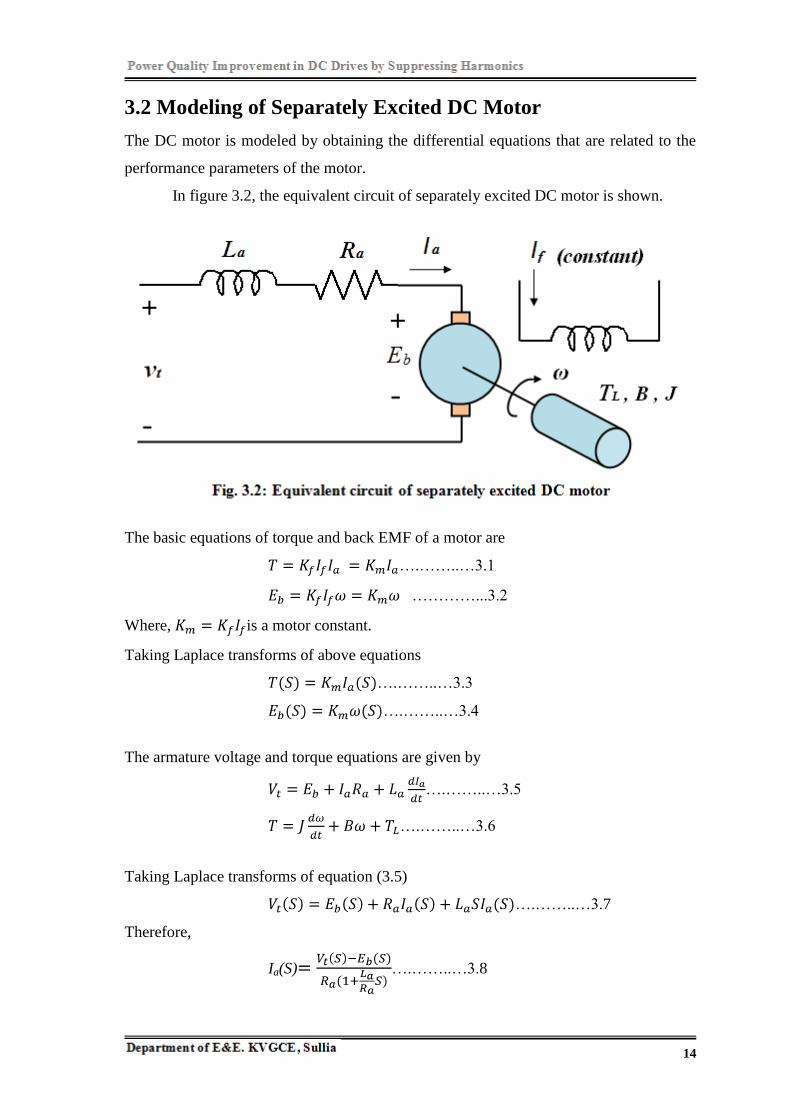
3.2 Modeling of Separately Excited DC Motor
The DC motor is modeled by obtaining the differential equations that are related to the
performance parameters of the motor.
In figure 3.2, the equivalent circuit of separately excited DC motor is shown.
The basic equations of torque and back EMF of a motor are
….……..…3.1
…………...3.2
Where, is a motor constant.
Taking Laplace transforms of above equations
….……..…3.3
….……..…3.4
The armature voltage and torque equations are given by
….……..…3.5
….……..…3.6
Taking Laplace transforms of equation (3.5)
….……..…3.7
Therefore,
Ia(S) ….……..…3.8

15
Substituting equation (4) in (8),
Ia(S) ….……..…3.9
Where, is the electrical time constant of the armature.
Taking laplace transforms of equation (3.6)
….……..…3.10
Therefore,
(S) ….……..…3.11
Substituting equation (3) in (11),
(S) ….……..…3.12
Where, is the mechanicaltime constant of the system.

16
CHAPTER 4
DEVELOPMENT OF MATLAB/SIMULINK
MODELS
This chapter presents introduction about simulation tools. The development of
MATLAB/Simulink models of the proposed work are shown and explained clearly.
4.1 Simulation Tools
Simulation is an easy way to minimize the time required for developing the models and it
also confirms the correct and fulfillment of serious steps. At presence there are some
simulation tools are available but all are not working with different systems in the same
integrated environment. Here, MATLAB/Simulink and SimPowerSystem are used which
works with electrical, power electronics and control systems in the same integrated
environment.
4.2 MATLAB/Simulink Models of Proposed Work
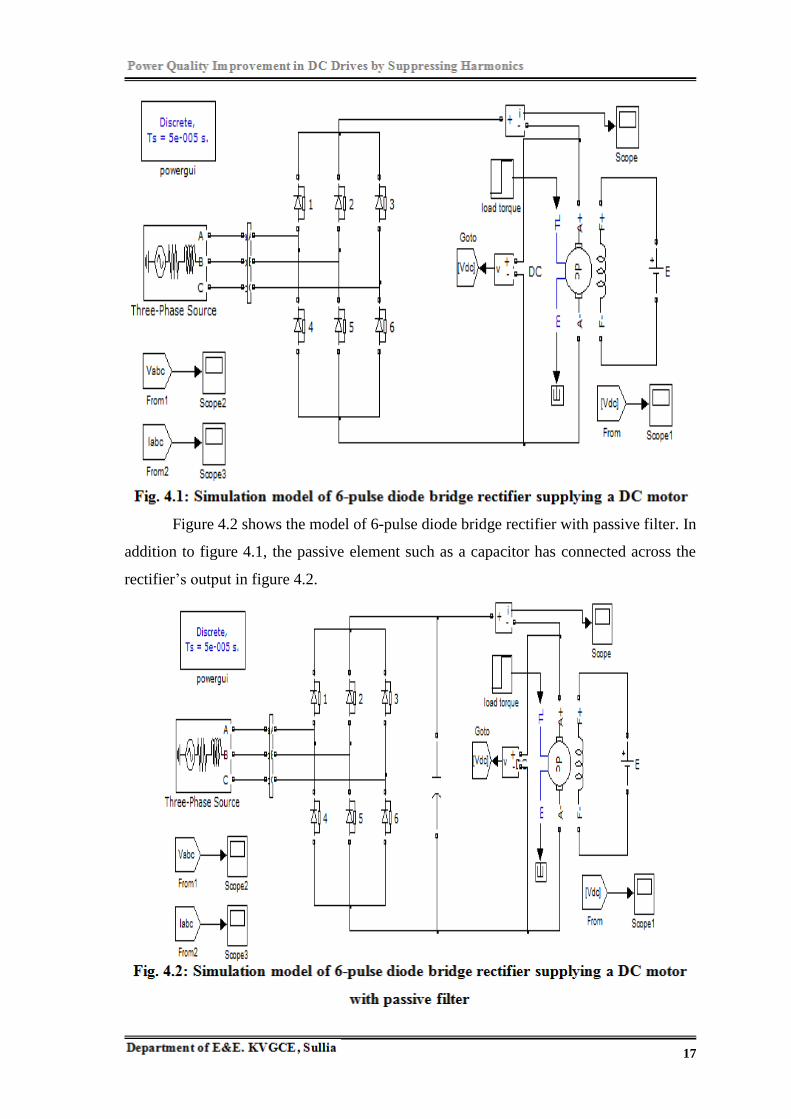
Figure 4.1 shows the MATLAB/Simulink model of 6-pulse diode bridge rectifier. The
diode bridge rectifier is fed from the three phase source through a three phase V-I
measurement block. The scope2 and scope3 blocks show the source voltage and current
waveforms. The armature of the DC motor is connected to the rectifier output. The scope
connected to the current measurement block shows the rectifier output current. The
voltage measurement block connected across the rectifier output shows the DC voltage
in scope1. The field of the DC motor is connected to the DC voltage source block.
17
Figure 4.2 shows the model of 6-pulse diode bridge rectifier with passive filter. In
addition to figure 4.1, the passive element such as a capacitor has connected across the
rectifier‟s output in figure 4.2.
18
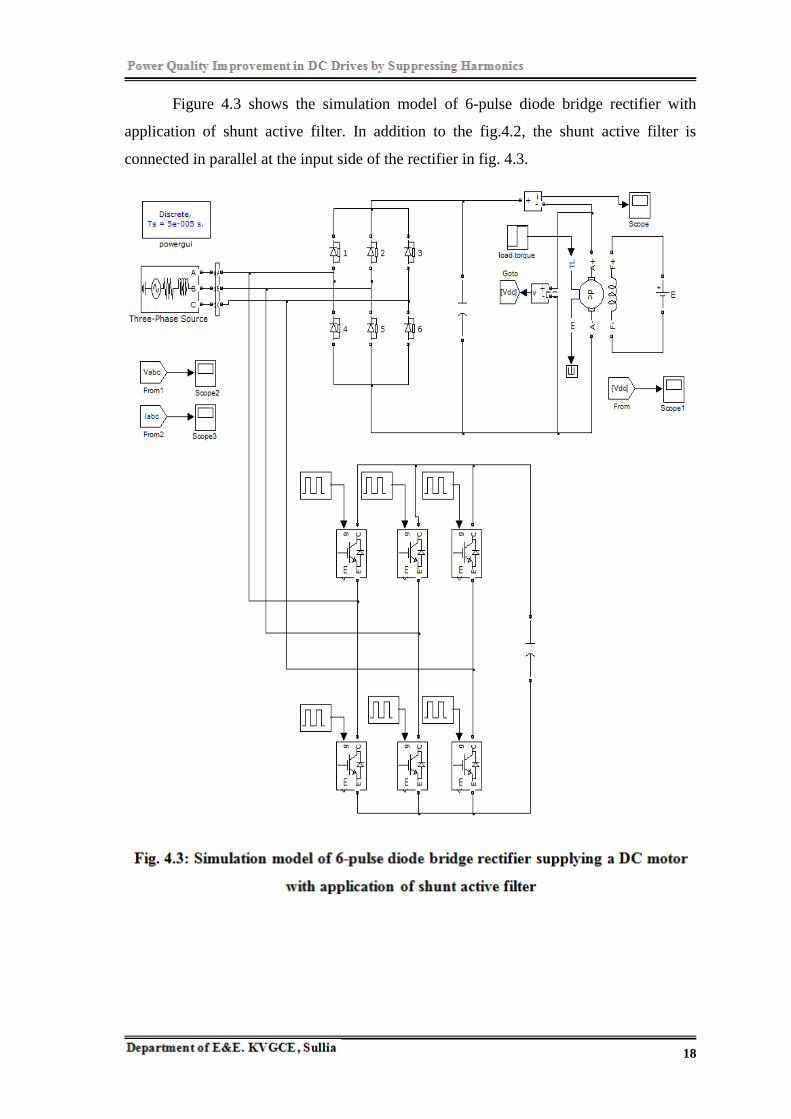
Figure 4.3 shows the simulation model of 6-pulse diode bridge rectifier with
application of shunt active filter. In addition to the fig.4.2, the shunt active filter is
connected in parallel at the input side of the rectifier in fig. 4.3.

19
Figure 4.4 shows the 6-pulse controlled rectifier. Here, six IGBT/diode switches
are used in rectifier bridge instead of diodes as in the fig.4.5. The gating signals of these
six switches are generated from six separate pulse generator blocks.
20
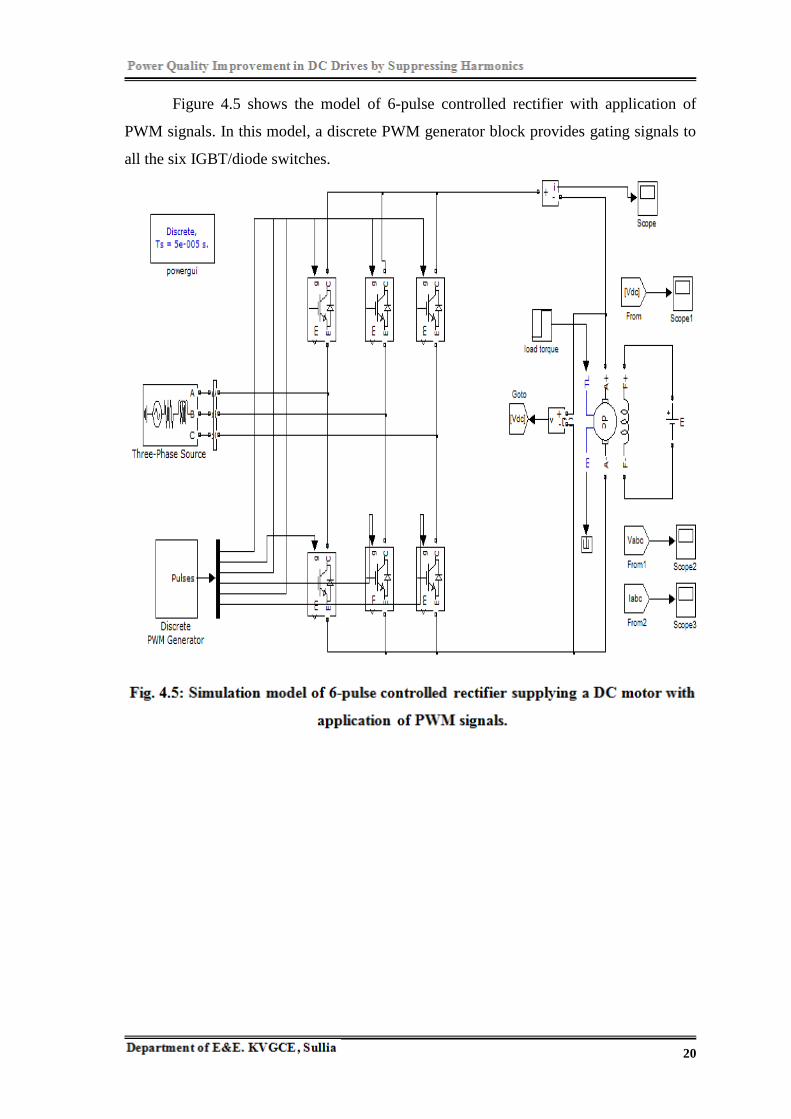
Figure 4.5 shows the model of 6-pulse controlled rectifier with application of
PWM signals. In this model, a discrete PWM generator block provides gating signals to
all the six IGBT/diode switches.

21
Figure 4.6 shows the MATLAB/Simulink model of 4-pulse diode bridge rectifier.
The 4-pulse diode bridge rectifier is fed from the two phases of the three phase source
block. The armature of the DC motor has connected to the rectifier‟s output and field of
the motor is supplied by the DC voltage source block.
22
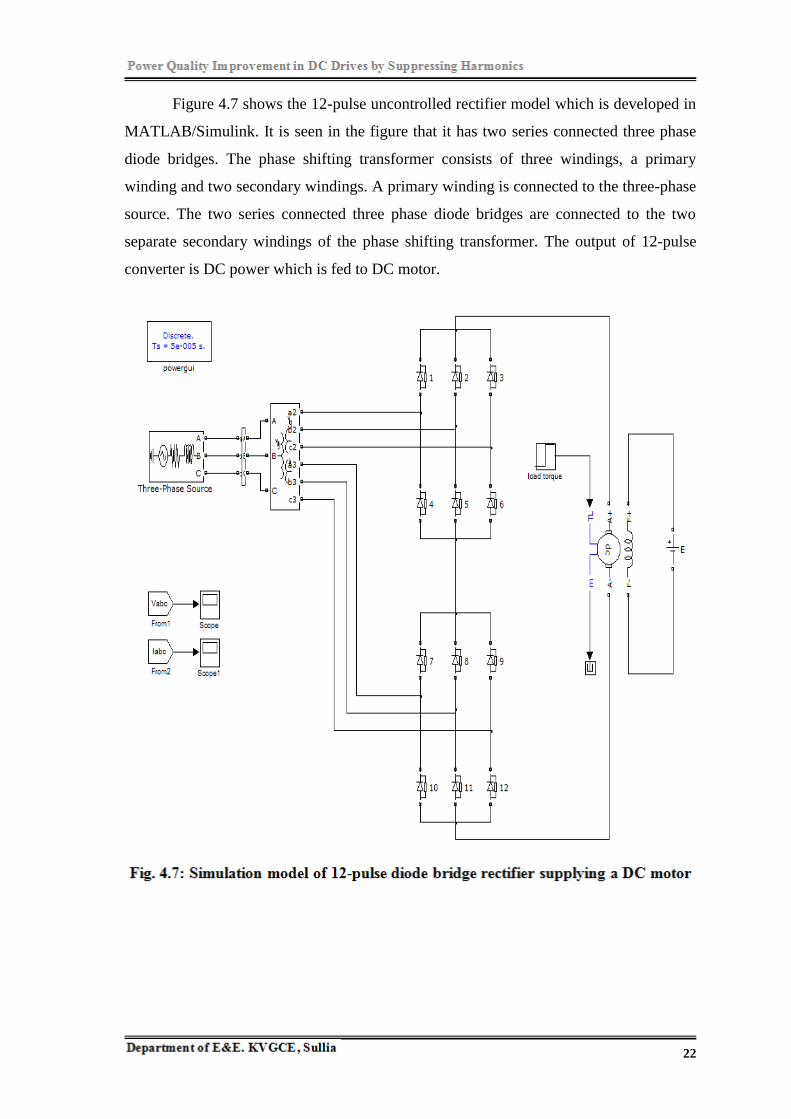
Figure 4.7 shows the 12-pulse uncontrolled rectifier model which is developed in
MATLAB/Simulink. It is seen in the figure that it has two series connected three phase
diode bridges. The phase shifting transformer consists of three windings, a primary
winding and two secondary windings. A primary winding is connected to the three-phase
source. The two series connected three phase diode bridges are connected to the two
separate secondary windings of the phase shifting transformer. The output of 12-pulse
converter is DC power which is fed to DC motor.

23
Figure 4.8 shows the MATLAB/Simulink model of the 24-pulse converter, where
two 12-pulse converters are connected in series on the DC side to form 24-pulse
converter. The two 12-pulse converters are connected to the two separate three phase
transformers (each transformer has three windings) with a 15 degree phase shift between
them. The two three phase transformers are fed from the same three phase source.
24
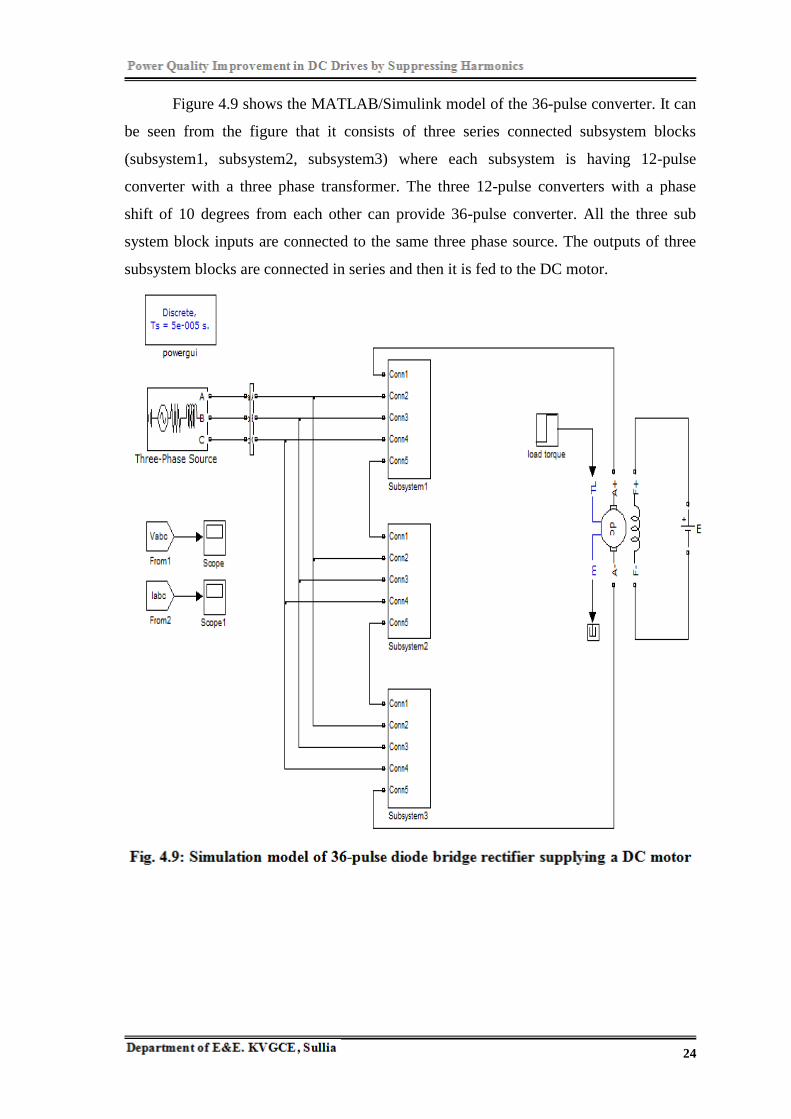
Figure 4.9 shows the MATLAB/Simulink model of the 36-pulse converter. It can
be seen from the figure that it consists of three series connected subsystem blocks
(subsystem1, subsystem2, subsystem3) where each subsystem is having 12-pulse
converter with a three phase transformer. The three 12-pulse converters with a phase
shift of 10 degrees from each other can provide 36-pulse converter. All the three sub
system block inputs are connected to the same three phase source. The outputs of three
subsystem blocks are connected in series and then it is fed to the DC motor.
25
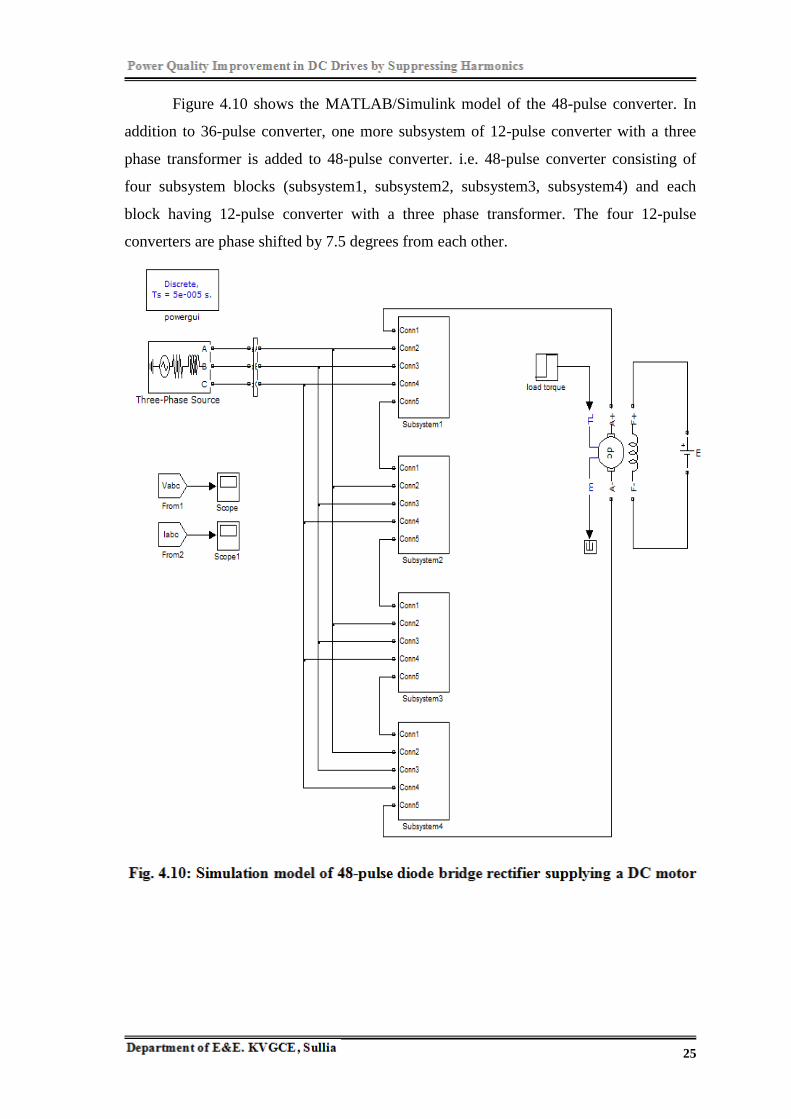
Figure 4.10 shows the MATLAB/Simulink model of the 48-pulse converter. In
addition to 36-pulse converter, one more subsystem of 12-pulse converter with a three
phase transformer is added to 48-pulse converter. i.e. 48-pulse converter consisting of
four subsystem blocks (subsystem1, subsystem2, subsystem3, subsystem4) and each
block having 12-pulse converter with a three phase transformer. The four 12-pulse
converters are phase shifted by 7.5 degrees from each other.
26
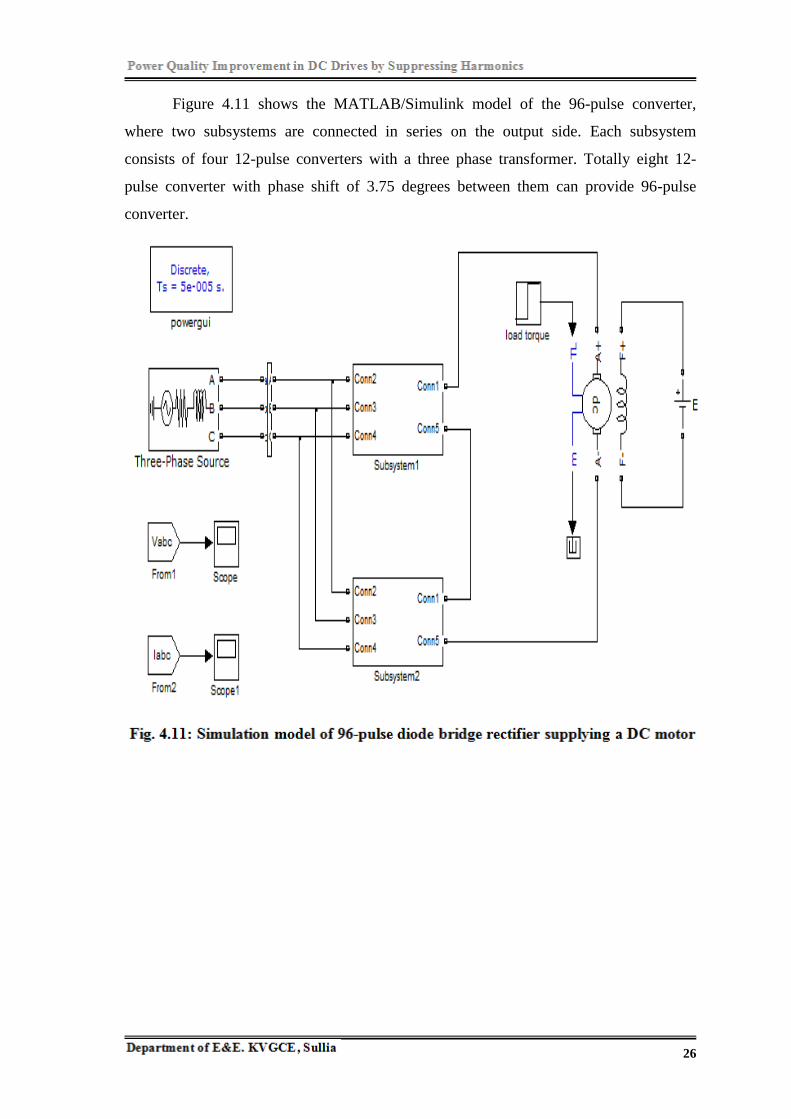
Figure 4.11 shows the MATLAB/Simulink model of the 96-pulse converter,
where two subsystems are connected in series on the output side. Each subsystem
consists of four 12-pulse converters with a three phase transformer. Totally eight 12-
pulse converter with phase shift of 3.75 degrees between them can provide 96-pulse
converter.

27
CHAPTER 5
SIMULATION RESULTS AND DISCUSSIONS
In this chapter, the simulated results of proposed work are shown and discussions are
made on it.
5.1 Simulated Results before Application of Filters

28
5.2 Simulated Results with Application of Passive Filter

29
5.3 Simulated Results with Application of Shunt Active Filter
30
5.4 Simulated Results before Application of PWM Signals

31
5.5 Simulated Results with Application of PWM Signals
32
5.6 Simulated Results of Multipulse Converters
5.6.1 4-Pulse Converter

33
5.6.2 12-Pulse Converter
34
5.6.3 24-Pulse Converter

35
5.6.4 36-Pulse Converter
36
5.6.5 48-Pulse Converter

37
5.6.6 96-Pulse Converter
38
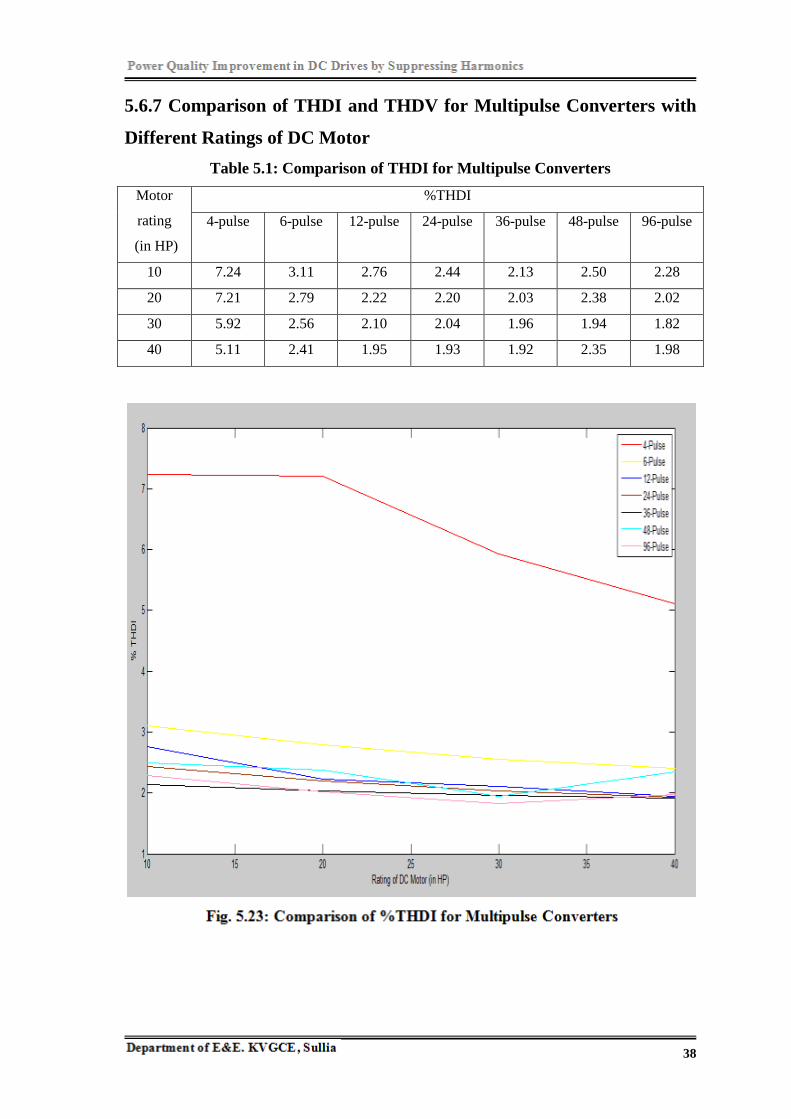
5.6.7 Comparison of THDI and THDV for Multipulse Converters with
Different Ratings of DC Motor
Table 5.1: Comparison of THDI for Multipulse Converters
Motor
rating
(in HP)
%THDI
4-pulse 6-pulse 12-pulse 24-pulse 36-pulse 48-pulse 96-pulse
10 7.24 3.11 2.76 2.44 2.13 2.50 2.28
20 7.21 2.79 2.22 2.20 2.03 2.38 2.02
30 5.92 2.56 2.10 2.04 1.96 1.94 1.82
40 5.11 2.41 1.95 1.93 1.92 2.35 1.98
39
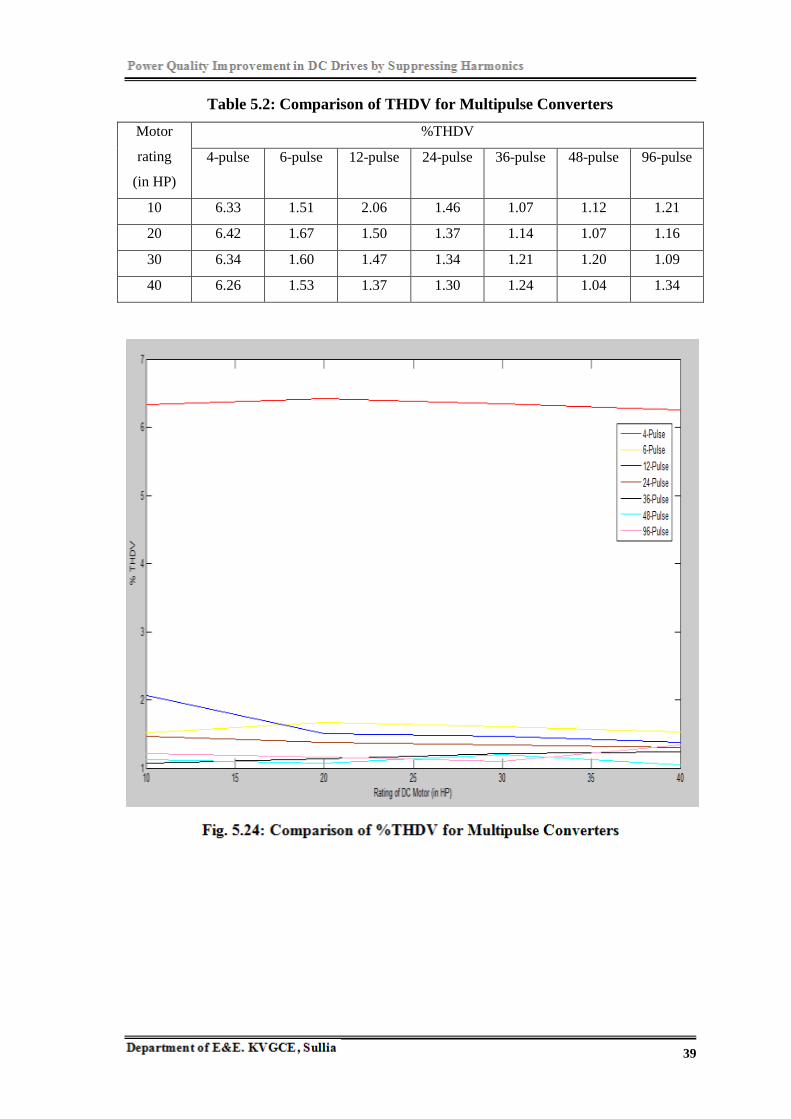
Table 5.2: Comparison of THDV for Multipulse Converters
Motor
rating
(in HP)
%THDV
4-pulse 6-pulse 12-pulse 24-pulse 36-pulse 48-pulse 96-pulse
10 6.33 1.51 2.06 1.46 1.07 1.12 1.21
20 6.42 1.67 1.50 1.37 1.14 1.07 1.16
30 6.34 1.60 1.47 1.34 1.21 1.20 1.09
40 6.26 1.53 1.37 1.30 1.24 1.04 1.34

40
5.7 Discussions
Figure 5.1 to 5.22 show the simulated results of 5-HP DC motor. The block parameters
of common components and devices in all the simulation models are same. These
parameters are shown in the appendix.
Figure 5.1 shows the source current of 6-pulse diode bridge rectifier before
application of filters. It can be seen from the figure that the waveforms of three phase
source currents are distorted and they are not pure sinusoidal. THD for source currents is
calculated by FFT analysis which is shown in figure 5.2. The THD obtained is 15.27%.
It is seen in the figure 5.3 that the source currents of diode bridge rectifier with
passive filter are less distorted as compared to figure 5.1. Figure 5.4 shows the FFT
analysis of source current of 6-pulse diode bridge rectifier with passive filter. With the
application of passive filter, the THD is reduced from 15.27% to 4.16%.
With the application of shunt active filter to diode bridge rectifier has further
improved the shape of source current waveforms which are shown in figure 5.5. The
THD is further reduced to 0.91% that is shown in figure 5.6.
Figure 5.7 shows the source current of 6-pulse controlled rectifier before
application of PWM signals. For the source current of controlled rectifier, the THD
obtained is 0.43% that is shown in figure 5.8.
It is seen in the figure 5.9 that the source current waveforms became almost pure
sinusoidal. With the application of PWM signals to controlled rectifier, the THD is
reduced to 0.20% that is shown in figure 5.10
Figure 5.11 to 5.22 show the THD of source current and voltage for multipulse
converters. It is seen from table 5.1 and 5.2 that as the number of pulses increases the
THD decreases, which is also graphically represented in figure 5.23 and 5.24.

41
CHAPTER 6
CONCLUSION AND SCOPE FOR FUTURE WORK
6.1 Conclusion
Power quality related issues and different harmonic suppression techniques are discussed
in detail. The harmonic reduction techniques such as passive filter shunt active filter,
pulse width modulation and multipulse converters models are developed and simulated
in MATLAB/Simulink environment. The simulation results obtained are analyzed and it
is proved that with application of filters the THD has reduced. For controlled rectifiers, it
has shown the effectiveness of PWM technique for harmonic elimination in distorted
source current. The performance comparison of multipulse converters has been carried
out on the basis of simulation results obtained for different ratings of motor. It is found
that as the number of pulses increased the THD decreases remarkably. Thus the power
quality has improved.
6.2 Scope for Future Work
Experimental investigations can be done on simulated models of all power quality
improvement techniques which have been presented in the present work by developing a
prototype model in the laboratory to verify the simulation results.
In this project work, only the series connection of multiple rectifiers is considered
to increase the pulse number. With the series connection, the output voltage of the
multipulse converter is the sum of the individual output voltages of each rectifier,
whereas with parallel connection, the output current of the multipulse converter is the
sum of individual output currents of each rectifier. However, connecting rectifiers in
parallel is more complex due to fluctuations in DC voltage which cause circulating
currents to flow. To remedy this, these types of multipulse converters typically require
the use of an interphase transformer which absorbs the difference in the DC voltage
between individual rectifiers.
42
BIBLIOGRAPHY
[1] John N. Chiasson, Leon M. Tolbert, Keith J. McKenzie, Zhong Du, “A Complete
Solution to the Harmonic Elimination Problem”, IEEE Transactions on
PowerElectronics, vol. 19, no.2, march 2004 (491-499).
[2] M.Izhar, C.M. Hadzer,S.Masri and S.Idris, “A Study of the Fundamental
Principles to Power System Harmonic”, National Power and Energy Conference
2003 Proceedings, Bangi Malaysia. (Page no: 225-231).
[3] Tony Hoevenaars, Kurt LeDoux, Matt Colosino, “Interpreting IEEE Std 519 and
Meeting its Harmonic Limits in VFD Applications”, Paper No. PCIC-2003-15.
[4] Math H J Bollen, “Understanding Power Quality Problems; Voltage sags and
interruptions”, Wiley India, 2011.
[5] MATLAB: High-Performance Numeric Computation and Visualization Software
– Reference Guide, TheMathWorks Inc., April 1993.
[6] SIMULINK: The Dynamic System Simulation Software-User‟s Guide, Math
Works Inc., April 1993.
[7] F. Z. Peng, H. Akagi, and A. Nabae, “Study of active power filters using quad
series voltage source PWM converters for harmonic compensation”,IEEE
Transactions on Power Electronics, vol. 5, no. 1, Jan. 1990, pp. 9–15.
[8] B. Singh, A. Chandra, and K. Al-Haddad, “Computer-aided modeling and
simulation of active power filters”, Electrical Machines and Power Systems, vol.
27, 1999, pp. 1227–1241.
[9] D.A.Paice, “Power Electronic Converter Harmonics- Multipulse Methods for
Clean Power”. New York: IEEE Press, 1996.

43
APPENDIX
Details of different ratings of DC motor used for simulating the present work are given
below. Table A.1 shows the machine parameters for different ratings of DC motor.
Details of different ratings of DC motor
1. 5-HP: 240V, 1750RPM, Field 150V
2. 10-HP: 240V, 1750RPM, Field 300V
3. 20-HP: 240V, 1750RPM, Field 300V
4. 30-HP: 240V, 1750RPM, Field 300V
5. 40-HP: 240V, 1750RPM, Field 300V
Table A.1: Machines parameters
Motor
rating
(in
HP)
Ra
(Ω)
La
(H)
Rf
(Ω)
Lf
(H)
Laf
(H)
J
(kg.m2)
B
(N.m.s)
Tf
(N.m)
5 0.78 0.016 150 112.5 1.234 0.05 0.01 0
10 1.086 0.01216 180 71.47 0.6458 0.04251 0.003406 1.046
20 0.4114 0.004895 105.9 27.65 0.4038 0.08321 0.004313 2.105
30 0.2275 0.002866 102.3 20.82 0.401 0.1239 0.005219 3.164
40 0.1514 0.002012 92.78 16.32 0.369 0.1646 0.006126 4.223
Where,
Ra :Armature resistance
La : Armature Inductance
Rf : Field Resistance
Lf : Field Inductance
Laf : Field – Armature Mutual Inductance
J : Total Inertia
B : Viscous Friction Coefficient
Tf : Coloumb Friction Torque

44
PROJECT OUTCOME
This paper “POWER QUALITY IMPROVEMENT IN DC DRIVES BY
SUPPRESSING HARMONICS” was presented in TEQIP II funded National
Conference on Advances in Electrical Engineering (NCAEE-2015) at NMAM Institute
of Technology Nitte.
45