aqis quarantine operations risk return acera 1001...
TRANSCRIPT
AQIS Quarantine Operations Risk Return
ACERA 1001 Study J
Imported Plant-Product Pathways
Final Report
Andrew Robinson, ACERA
Jessica Bell, DAFF
Brendan Woolcott, DAFF
Enrico Perotti, DAFFAQIS Import Clearance Review
Report Cover Page
ACERA Project
0804
Title
AQIS Import Clearance Review
Author(s) / Address (es)
A. Robinson, Department of Mathematics and Statistics, University of Melbourne, M. Burgman, ACERA, University of Melbourne, W. Atkinson, AQIS, R. Cannon, AQIS, C. Miller, AQIS, H. Immonen, AQIS.
Material Type and Status (Internal draft, Final Technical or Project report, Manuscript, Manual, Software)
Final Project report
Summary
This report outlines a system that will assist AQIS managers to allocate effort among
inspection activities. It provides a means of guaranteeing a specified degree of reliability in
detection that takes into account the underlying risk, and that also provides information and
a degree of deterrence for less risky pathways. The system is provided within a wider
framework that will assist managers to feed back improved knowledge on risk to those who
set policy, as information accumulates over time.
Received By: Date:
ACERA / AMSI SAC Approval: Date: ACERA Use only
DAFF Endorsement: ( ) Yes ( ) No Date:
June 1, 2012
Acknowledgments
This report is a product of the Australian Centre of Excellence for Risk Analysis (ACERA). Inpreparing this report, the authors acknowledge the financial and other support provided by theDepartment of Agriculture, Fisheries and Forestry (DAFF), and the University of Melbourne.
The authors thank the following people who have provided invaluable advice and input:Mark Burgman, Rob Cannon, Damien Carthew, Jean Chesson, Michael Peattie, Robert Savage,Louise Van Meurs, James Young, and Sam Zhao.
2
Contents
Acknowledgments 2
Table of Contents 3
Table of Definitions 4
1 Executive Summary 61.1 Background . . . . . . . . . . . . . . . . . . . . . . . . . . . . . . . . . . . . . . . 61.2 Methods . . . . . . . . . . . . . . . . . . . . . . . . . . . . . . . . . . . . . . . . . 61.3 Results . . . . . . . . . . . . . . . . . . . . . . . . . . . . . . . . . . . . . . . . . . 71.4 Other Recommendations . . . . . . . . . . . . . . . . . . . . . . . . . . . . . . . . 9
2 Introduction 10
3 Inspection Regime 113.1 Introduction . . . . . . . . . . . . . . . . . . . . . . . . . . . . . . . . . . . . . . . 113.2 Candidate Sampling Plans . . . . . . . . . . . . . . . . . . . . . . . . . . . . . . . 113.3 Recommendation: CSP–3 . . . . . . . . . . . . . . . . . . . . . . . . . . . . . . . 133.4 Implementation . . . . . . . . . . . . . . . . . . . . . . . . . . . . . . . . . . . . . 143.5 Why not IRIS? . . . . . . . . . . . . . . . . . . . . . . . . . . . . . . . . . . . . . 15
4 Data Preparation 16
5 Simulation Experiment 185.1 Introduction . . . . . . . . . . . . . . . . . . . . . . . . . . . . . . . . . . . . . . . 185.2 Design . . . . . . . . . . . . . . . . . . . . . . . . . . . . . . . . . . . . . . . . . . 185.3 Assumptions . . . . . . . . . . . . . . . . . . . . . . . . . . . . . . . . . . . . . . 195.4 A Caveat . . . . . . . . . . . . . . . . . . . . . . . . . . . . . . . . . . . . . . . . 20
6 A Case Study 226.1 Dried Apricots . . . . . . . . . . . . . . . . . . . . . . . . . . . . . . . . . . . . . 22
7 Recommendations 29
Bibliography 33
A Starting Surveillance 34A.1 Snapshot Survey . . . . . . . . . . . . . . . . . . . . . . . . . . . . . . . . . . . . 34A.2 CSP Without Data . . . . . . . . . . . . . . . . . . . . . . . . . . . . . . . . . . . 36
B Leakage Survey Sample Size 37
C Post-Intervention Compliance (PIC) 38
3
AQIS Risk–Return: Plant-Product Pathways Final Report
D Other Case Studies 40D.1 Baby Corn . . . . . . . . . . . . . . . . . . . . . . . . . . . . . . . . . . . . . . . 40D.2 Blueberries exported from Country A . . . . . . . . . . . . . . . . . . . . . . . . 47D.3 Coir Peat . . . . . . . . . . . . . . . . . . . . . . . . . . . . . . . . . . . . . . . . 53D.4 Dried Dates . . . . . . . . . . . . . . . . . . . . . . . . . . . . . . . . . . . . . . . 59D.5 Dried Seaweed . . . . . . . . . . . . . . . . . . . . . . . . . . . . . . . . . . . . . 65D.6 Fresh Garlic . . . . . . . . . . . . . . . . . . . . . . . . . . . . . . . . . . . . . . . 71D.7 Green Coffee Beans . . . . . . . . . . . . . . . . . . . . . . . . . . . . . . . . . . . 78D.8 Hulled Sesame Seeds . . . . . . . . . . . . . . . . . . . . . . . . . . . . . . . . . . 85D.9 Mangosteen exported from Country B . . . . . . . . . . . . . . . . . . . . . . . . 91
E List of Tables and Figures 96Tables . . . . . . . . . . . . . . . . . . . . . . . . . . . . . . . . . . . . . . . . . . . . . 96Figures . . . . . . . . . . . . . . . . . . . . . . . . . . . . . . . . . . . . . . . . . . . . 98
4
AQIS Risk–Return: Plant-Product Pathways Final Report
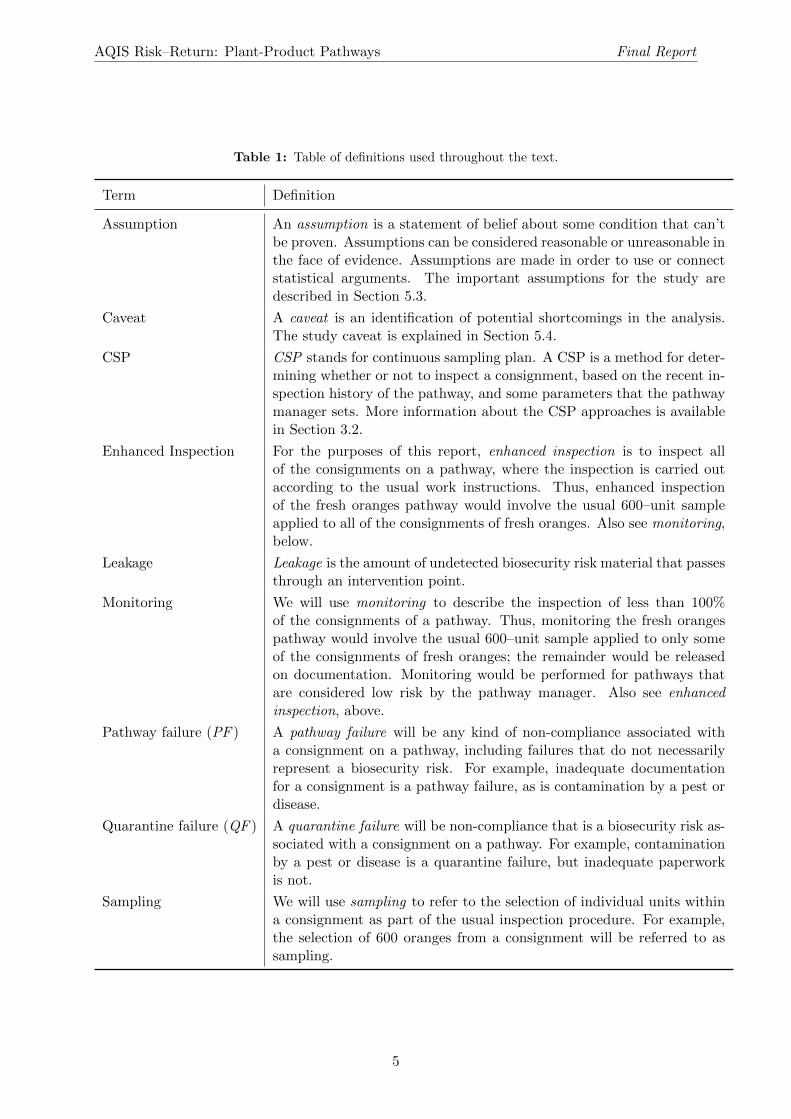
Table 1: Table of definitions used throughout the text.
Term Definition
Assumption An assumption is a statement of belief about some condition that can’tbe proven. Assumptions can be considered reasonable or unreasonable inthe face of evidence. Assumptions are made in order to use or connectstatistical arguments. The important assumptions for the study aredescribed in Section 5.3.
Caveat A caveat is an identification of potential shortcomings in the analysis.The study caveat is explained in Section 5.4.
CSP CSP stands for continuous sampling plan. A CSP is a method for deter-mining whether or not to inspect a consignment, based on the recent in-spection history of the pathway, and some parameters that the pathwaymanager sets. More information about the CSP approaches is availablein Section 3.2.
Enhanced Inspection For the purposes of this report, enhanced inspection is to inspect allof the consignments on a pathway, where the inspection is carried outaccording to the usual work instructions. Thus, enhanced inspectionof the fresh oranges pathway would involve the usual 600–unit sampleapplied to all of the consignments of fresh oranges. Also see monitoring,below.
Leakage Leakage is the amount of undetected biosecurity risk material that passesthrough an intervention point.
Monitoring We will use monitoring to describe the inspection of less than 100%of the consignments of a pathway. Thus, monitoring the fresh orangespathway would involve the usual 600–unit sample applied to only someof the consignments of fresh oranges; the remainder would be releasedon documentation. Monitoring would be performed for pathways thatare considered low risk by the pathway manager. Also see enhancedinspection, above.
Pathway failure (PF ) A pathway failure will be any kind of non-compliance associated witha consignment on a pathway, including failures that do not necessarilyrepresent a biosecurity risk. For example, inadequate documentationfor a consignment is a pathway failure, as is contamination by a pest ordisease.
Quarantine failure (QF ) A quarantine failure will be non-compliance that is a biosecurity risk as-sociated with a consignment on a pathway. For example, contaminationby a pest or disease is a quarantine failure, but inadequate paperworkis not.
Sampling We will use sampling to refer to the selection of individual units withina consignment as part of the usual inspection procedure. For example,the selection of 600 oranges from a consignment will be referred to assampling.
5
1
Executive Summary
1.1 Background
Quarantine inspection assists in safeguarding Australia’s biosecurity status by monitoring importpathways for contamination. Once identified, contaminated pathways can be mitigated. Usinginspection history to analyse intercepted biosecurity risk is an important process in ensuringthat inspection regimes and resourcing match a commodity’s risk profile and pathway failurerate.
This project, by the Australian Centre for Excellence in Risk Analysis (ACERA) and PlantQuarantine staff, reviewed the risk–return potential of imported-plant product pathways tooptimize the allocation of Department of Agriculture, Fisheries and Forestry (DAFF) inspectionresources. Specifically, our goal was to find a way to reduce the amount of inspection withoutunduly increasing the leakage, defined as the amount of quarantine contamination that passesundetected. This report summarizes the results of a statistical risk analysis of inspection datafor plant-product pathways.
The target of risk return for imported-plant product pathways is to implement reducedmonitoring rates for identified low-risk pathways while still maintaining an acceptably low levelof risk of new quarantine incursions, and to allocate the ensuing resources to managing high-riskpathways. Of the 10 pathways examined, 7 were found to be low risk. The resources used tosample these at the border can be partially reallocated to pathways of greater risk. Overall,compliant suppliers will be rewarded and risky pathways will be more adequately addressed.The project team used an evidence-based risk approach, as recommended by Beale et al. (2008),to determine high and low risk based on the inspection failure rate and end use of each pathway.
This report documents ACERA project 1001J, which is a pre-cursor to a future project,ACERA Project 1101C, Quarantine Inspection and Auditing Across the Biosecurity Continuum.
1.2 Methods
The data used for this project were sourced from two DAFF databases: AIMS and Incidents.We used AIMS data to determine the pathway volume, namely the number of consignments, foreach pathway and sub-pathway. We determined the failure status of each consignment using acombination of AIMS and Incidents data. Each consignment either (i) passed inspection, or (ii)returned a pathway failure that was not a quarantine failure, or (iii) returned a pathway failurethat was also a quarantine failure. A description of the exact steps can be found in Section 4.0.2.
In order to use the volume data to compare the inspection algorithms, it was necessary tomake the following assumption.
1. The inspection data are assumed to be representative of all commercial consignments thatare in scope for each pathway.
6
AQIS Risk–Return: Plant-Product Pathways Final Report
Also, we used a combination of AIMS and Incidents data to determine the failure status ofeach consignment. In order to use the interception data to compare the inspection algorithms,the following extra assumptions were made.
2. The approach rate of contamination in the future will not differ substantially from that ofthe last two years of the data.
3. The temporal patterns of contamination in the future will not differ substantially fromthat of the last two years of the data.
Finally, in order to estimate inspectorate performance, we needed to assume that
4. Inspection effectiveness was 90%.
More information is given in Section 5.3.
1.3 Results
Ten imported-plant product pathways were selected based on regional officer advice, and in-spection of AIMS and Incidents data, as case studies for statistical analysis for this project.Simulation experiments were carried out on the inspection history for each pathway.
Based on the findings of the imported-plant product pathways case studies, the pathwayscan be categorized into three groups:
1. low pathway failure rates and high supplier-specific compliance, therefore suitable for tar-geted inspection reductions (Dried apricots, dried dates, hulled sesame seeds, coir peat,and green coffee beans);
2. acceptable pathway failure rates but no motivation for targeted reductions (dried seaweed,baby corn); and
3. unacceptably high pathway failure rates that suggest further intervention would be useful(mangosteen, blueberries, and fresh garlic).
Following these results, the project team has identified a number of risk–return initiativesthat can be implemented by the department.
1. An effective statistical tool called Continuous Sampling Plan 3 (CSP–3) has been identifiedthat provides a recipe for allocating inspection resources in a way that responds flexibly todifferences in contamination rates between pathways and changes in contamination rateswithin pathways.
The following five commodities have demonstrated low pathway failure rates and a levelof supplier specific compliance that make them suitable for a supplier-targeted reductionto inspection rates: dried apricots, dried dates, hulled sesame seeds, coir peat, and greencoffee beans.
It is recommended that a continuous sampling plan be employed for these five commodities,using a system of Customs Integrated Cargo System (ICS) profiles and quarantine rulerswithin the AQIS Import Management System (AIMS) to enable practical implementationof random sampling. Recommended CSP–3 parameters for the five pathways are presentedin Table 1.1, which summarizes the outcomes of this report (See Section 5 for details).
2. It is strongly recommended that the CSP–3 algorithm be deployed as an analysis tool inconjunction with simulation and inspection data to assist in determining statistically justi-fied inspection regimes for imported-plant product pathways. Supplier-targeted inspectionregimes were developed for each of the five suitable pathways using simulation experiments
7
AQIS Risk–Return: Plant-Product Pathways Final Report
on past inspection history to identify the parameters required to deploy such a continuoussampling plan.
Briefly, using CSP–3 will result in the following inspection regime for each supplier :
(a) start in enhanced inspection mode, or enhanced mode, which means inspecting allconsignments, until a defined number (called the clearance number, CN in Table 1.1,for example, 10) of successive compliant consignments have been observed. Then,
(b) switch to a reduced sampling regime, called monitoring mode, which involves fullyinspecting a reduced number of consignments (the proportion of consignments in-spected is called the monitoring fraction, MF in Table 1.1, for example, 10%) until aquarantine non-compliance is detected.
Following a non-compliance, the next four consecutive consignments must be in-spected, after which monitoring is again used if all four are clean. If any subsequentnon-compliance occurs within a specific number (for example, 10, usually the sameas CN) of inspections of a previous non-compliance, then the supplier’s inspectionregime is switched back to the above enhanced mode.
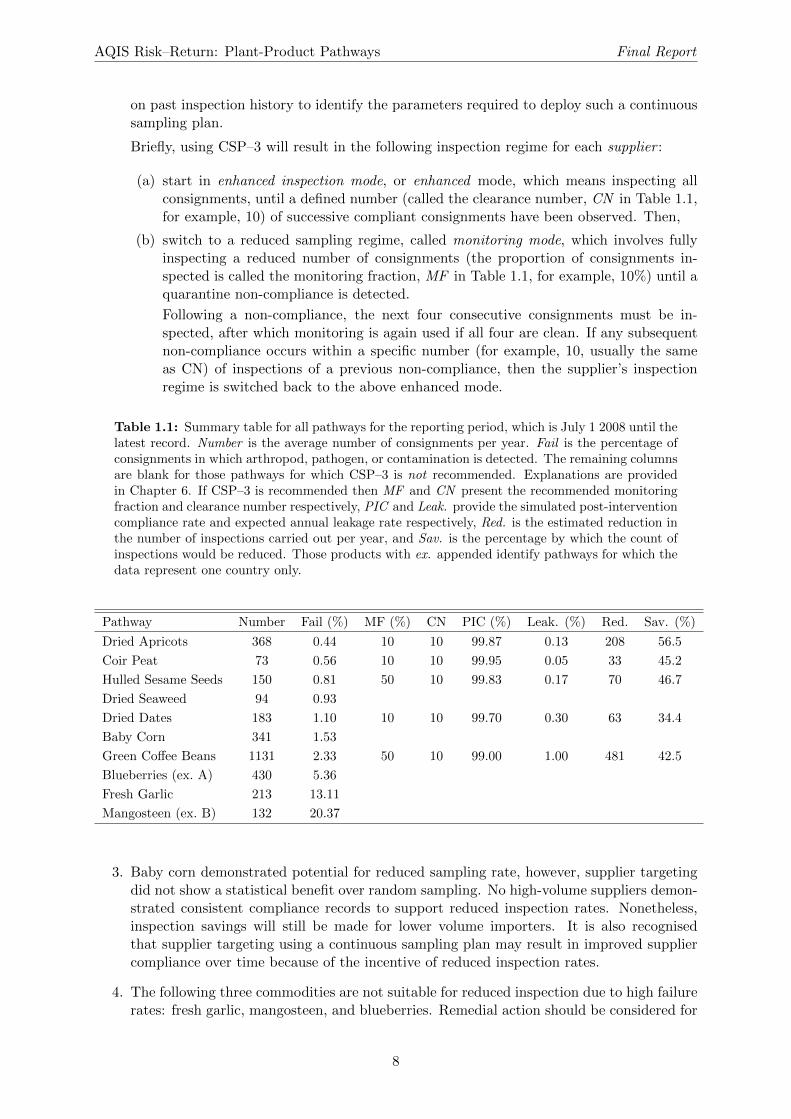
Table 1.1: Summary table for all pathways for the reporting period, which is July 1 2008 until thelatest record. Number is the average number of consignments per year. Fail is the percentage ofconsignments in which arthropod, pathogen, or contamination is detected. The remaining columnsare blank for those pathways for which CSP–3 is not recommended. Explanations are providedin Chapter 6. If CSP–3 is recommended then MF and CN present the recommended monitoringfraction and clearance number respectively, PIC and Leak. provide the simulated post-interventioncompliance rate and expected annual leakage rate respectively, Red. is the estimated reduction inthe number of inspections carried out per year, and Sav. is the percentage by which the count ofinspections would be reduced. Those products with ex. appended identify pathways for which thedata represent one country only.
Pathway Number Fail (%) MF (%) CN PIC (%) Leak. (%) Red. Sav. (%)
Dried Apricots 368 0.44 10 10 99.87 0.13 208 56.5
Coir Peat 73 0.56 10 10 99.95 0.05 33 45.2
Hulled Sesame Seeds 150 0.81 50 10 99.83 0.17 70 46.7
Dried Seaweed 94 0.93
Dried Dates 183 1.10 10 10 99.70 0.30 63 34.4
Baby Corn 341 1.53
Green Coffee Beans 1131 2.33 50 10 99.00 1.00 481 42.5
Blueberries (ex. A) 430 5.36
Fresh Garlic 213 13.11
Mangosteen (ex. B) 132 20.37
3. Baby corn demonstrated potential for reduced sampling rate, however, supplier targetingdid not show a statistical benefit over random sampling. No high-volume suppliers demon-strated consistent compliance records to support reduced inspection rates. Nonetheless,inspection savings will still be made for lower volume importers. It is also recognisedthat supplier targeting using a continuous sampling plan may result in improved suppliercompliance over time because of the incentive of reduced inspection rates.
4. The following three commodities are not suitable for reduced inspection due to high failurerates: fresh garlic, mangosteen, and blueberries. Remedial action should be considered for
8
AQIS Risk–Return: Plant-Product Pathways Final Report
these horticultural pathways to improve pathway cleanliness and compliance with pestfreedom conditions.
5. Dried seaweed as a pathway already has a reduced sampling rate applied, because inspec-tion is mandatory only if treatment documentation is unavailable. The available data cannot necessarily be considered to be a representative sample of the pathway. Temporarilysetting that concern aside, the results indicated that this is a very low failure rate pathway.The simulation results suggest that implementing a further CSP-style sampling regime willnot be of benefit, and current system should be maintained and reviewed at a later date.
6. Analytical exercises such as this one allow the identification of low-risk pathways usingstatistical tools and historical inspection data. The inspectorate can use CSP–3 or a similarinspection algorithm to judiciously reduce inspection effort in these low-risk pathways,which will free up inspection time for higher-risk pathways. The advantage of using CSP–3 for the reduction is that low-risk pathways are monitored, and increases in the risk statuscan be detected reasonably quickly, and increasing the intervention is automatic upon thatdetection.
1.4 Other Recommendations
A number of data collection and electronic system constraints where identified as severely ham-pering the ability to undertake this form of commodity specific analysis on a routine and acrosspathway basis. An Information and Communication Technology (ICT) reform process has com-menced within DAFF and the following recommendations are provided to inform this reformprocess of system improvements required for future ICT systems to support risk-return inspec-tion regimes for more plant and commodity based pathways. See Chapter 7 for more detail.
1. Support the incorporation of supplier-targeted inspection regimes into the entry manage-ment system for appropriate risk–return pathways by enabling the automated review of asuppliers compliance history.
2. Incorporate leakage surveys in reduced inspection regimes to verify the estimation of in-spection effectiveness, used for analysis of each import pathway.
3. Ensure the quarantine risk of an interception is recorded within the AIMS database withactionable or non-actionable quarantine status recorded to streamline statistical analysisof quarantine failure rates.
4. Identify at least a sample of the intercepted pests down to species in a systematic wayto enable informed evaluation of pathway risk (see ACERA Project 1101E, Sampling forInvasives).
5. Develop a system to support the simultaneous analysis of multiple pathways (see ACERAProject 1101C, Quarantine Inspection and Auditing Across the Biosecurity Continuum).
6. Develop in-house expertise to sustain and build on the ACERA 1001J progress that isdocumented within this report, (see ACERA Project 1101C, Quarantine Inspection andAuditing Across the Biosecurity Continuum).
7. Be prepared to alter the algorithm in ad-hoc ways to allow for local knowledge or seasonalpatterns in volume.
9
2
Introduction
The projected biosecurity risks associated with specific import pathways for plant commoditiesare documented in the AQIS Import Conditions (ICON) database, Import Risk Analyses and/orRisk Assessments, however the connection between the assessed risk and the inspection frequencyhave not been adequately addressed. Previous ACERA projects have focused on non-commoditypathways to develop tools that can be used to support the allocation of quarantine inspectionresources. To date these tools have not been applied to pathways of known, variable biosecurityrisk such as imported plant products.
Imported-plant product pathways are subject to inspection procedures at the pre-borderand border parts of the biosecurity continuum. Plant Quarantine Operations use inspectionprocedures to verify that Australia’s plant import quarantine requirements are being met. Thefrequency and rate of inspection need to be determined for each commodity based on the quar-antine risk assessed.
This report suggests some sampling plans that permit the flexible and automatic allocationof inspection resources towards pathways that have higher contamination rates, discusses theadvantages and disadvantages of these sampling plans, and evaluates the sampling plans on tenplant-product pathways using inspection data.
10
3
Inspection Regime
3.1 Introduction
An effective risk-return focused inspection regime for plant commodity pathways requires theflexibility to respond to and protect against emerging patterns of non-compliance while notover-investing effort in sub-pathways that are essentially clean and therefore low risk. Thistrade-off of inspection resources will ideally involve reducing inspection rates to a monitoringrole for the essentially clean sub-pathways and using inspecting all consignments from the morecontaminated sub-pathways.
The term sampling is widely used in the quarantine context to refer to the randomly-selectedportion of a consignment for inspection. However, sampling can also refer to the random selectionof consignments from a pathway for inspection. To avoid confusion within this report we usethe term monitoring to refer to the random selection of consignments for inspection.
The ability to detect patterns of non-compliance within the inspection history of an importpathway is crucial to determining accurate inspection rates based on pathway risk. Mediumand long-term shifts in non-compliance are particularly important. Short-term shifts, ie. spikesrepresenting once-off pathway failures, can only reliably be captured when the entire pathwayis inspected, or sampled with sufficient frequency that a spike of sufficient duration will bedetected. By adopting a risk-return strategy for the pathway, the inspectorate acknowledgesthat undetected spikes are possible, and decides that the risk of undetected spikes is acceptableand inspection resources are better directed towards higher risk inspection needs.
We emphasise that the only condition under which the pathway should be monitored, asopposed to fully inspected, is when it is deemed acceptable that there be some residual leakagefrom the pathway. Monitoring regimes will most likely be applied because of the low-risk natureof the commodity, for example, due to the specified end use or identification of intercepted pestsas non-actionable and not of quarantine concern.
3.2 Candidate Sampling Plans
3.2.1 CSP Family
The effective review of an inspection regime requires employment of a monitoring technique.Here we introduce the continuous sampling plan (CSP) family of algorithms as the recom-mended pathway monitoring technique for imported-plant product pathways. The original CSPalgorithm of Dodge (1943) is now called CSP–1. CSP–3, which we advocate here, was introducedby Dodge and Torrey (1951), along with CSP–2.
The basic premise of each of the CSP inspection designs that we reviewed is that a pathwayis either being monitored or undergoing enhanced inspection at any given time, and the decision
11
AQIS Risk–Return: Plant-Product Pathways Final Report
that the inspectorate must make is: how to use the inspection history of the pathway. Typically,the inspection regime will adopt the following very general pattern:
1. start in enhanced inspection mode,
• inspect all consignments until the inspection history reaches a given condition, sayC,
2. switch to monitoring mode:
• inspect at a specific monitoring rate f until the inspection history reaches a differentgiven condition, say, M , then switch back to enhanced inspection mode.
We now briefly review two of the simpler inspection algorithms, CSP–1 and CSP–2, beforeproviding a review of the recommended approach, CSP–3.
CSP–1
CSP–1 is the simplest of the three algorithms. Referring to the pattern immediately above,
• C is satisfied by the observation of i successive compliant consignments.
• M is satisfied by any observation of non-compliance while the pathway is in the monitoringmode.
CSP–2
CSP–2 is the same as CSP–1, except
• M is satisfied by two observations of non-compliance within k successive consignmentswhile the pathway is in the monitoring mode. It is usual to take k = i.
CSP–3
For CSP–3, the inspection algorithm is as follows,
• C is satisfied by the observation of i successive compliant consignments.
• M is satisfied by two observations of non-compliance that are within k inspections of oneanother. Usually, k = i.
Note that in addition to the above prescription, when any non-compliance is detected, thenext four consignments will all be inspected, i.e., the monitoring process will be replaced byinspecting each of the next four consignments. The choice of four is arbitrary, but standard forCSP–3. This shift is temporary and is done regardless of whether the non-compliance is the firstor subsequent failure detected in any number of consignments.
To summarize CSP–3, if the system is in monitoring mode, then the consignments are beingrandomly selected for inspection at rate f . If a non-compliant consignment is intercepted, thenthe next four consignments are inspected, and if they are all compliant, the system returns tomonitoring. If another non-compliant consignment is found within i inspections of the previousnon-compliance, then the system switches to enhanced inspection mode.
3.2.2 Other Approaches
During the development of this project we included other approaches in our simulation exper-iments, for example, the CUSUM approach of Bourke (2002), however, they did not performas well as the CSP family in the experiments that we ran, and their structure suggested thatimplementation could be more complicated.
12
AQIS Risk–Return: Plant-Product Pathways Final Report
3.3 Recommendation: CSP–3
We recommend the deployment of a continuous sampling plan, CSP–3, on a supplier-specificbasis for the import pathways documented herein. The basis of this recommendation is theoutcome of a large number of simulation experiments performed using approximately 5.5 yearsof historical inspection data from 2005–2011.
It is important to note that for a number of the case study pathways the simulation ex-periments provided only modest evidence for the superiority of CSP-3 over alternatives such asCSP-1. However, the interpretation of the results of the simulation experiment has to be tem-pered by a recognition that the historical inspection data cover only a few years of interactionto support the pathway picture.
The reason that we recommend CSP–3 ahead of CSP–1 is that CSP–3 allows for the pos-sibility of isolated leakage incidents, or random once-off non-compliance, without shifting im-mediately to an enhanced inspection mode and penalizing suppliers with concomitant 100%inspection rates. Deploying a monitoring regime in a pathway can only be acceptable whensome small amount of leakage is acceptable. Pathways in which leakage is unacceptable shouldbe inspected at 100%. Given that trace levels of leakage are accepted, CSP–3 tries to identifysystematic shifts in the quarantine failure rate, and respond to those.
The reason that CSP–3 is chosen ahead of CSP–2 is that the former provides temporaryincreased scrutiny of the pathway to see if a leakage incident seems likely to be part of a trend,and not simply an isolated failure. Therefore CSP–3 represents a compromise between themeasured approach of CSP–2, which allows for some leakage, and the focused approach of CSP–1, which keeps watch for upward shifts of the failure rate.
The reason that we recommend that CSP–3 be deployed by supplier, as opposed to by coun-try, or both, is due to the results of the simulation experiments discussed in Chapter 5. Theresults of the simulation experiments often showed strong support for supplier-specific applica-tion. Also, it is preferable for pathway management that if a quarantine failure is observed thenthe supplier of the consignment should receive greater scrutiny. Therefore the recommendationis based on a combination of simulation results, prudence, and knowledge about the pathway.
The entire algorithm is specified in terms of just two parameters: i and f . The trade-offbetween the parameters i and f can be interpreted as follows. A high i means that once apathway is in enhanced inspection mode, it will take a larger number of compliant consignmentsin order to achieve monitoring mode. Consequently, we can think of i as being the amountof evidence that we need for concluding that a non-compliant supplier has cleaned up theirpathway, or equally, a penalty upon the supplier for a non-conformity. A high f means that weare more likely to detect changes in the underlying rate.
3.3.1 Choosing CSP–3 Parameters
We used a set of simulation experiments to develop a recommendation for values to use forthe monitoring fraction1 f and the clearance number i. These experiments are documented inChapter 5, and the results are detailed for one pathway (dried apricots) in Chapter 6 and thebalance of the pathways in Appendix D.
Our general goal was to use the simulation experiment to determine the combination of CSPalgorithm, sub-pathways, and CSP parameters that would deliver a post-intervention compliance(defined herein) of 99% or better. We were also interested in determining whether there wasevidence that using the CSP algorithms was better than random sampling. Based on the results,the pathways can be categorized into three groups:
1We use the label “monitoring fraction” instead of “sampling fraction”, which is ingrained in the motivatingstatistical literature.
13
AQIS Risk–Return: Plant-Product Pathways Final Report
1. low pathway failure rates and high supplier-specific compliance, therefore suitable for tar-geted inspection reductions (Dried apricots, dried dates, hulled sesame seeds, coir peat,and green coffee beans);
2. acceptable pathway failure rates but no motivation for targeted reductions (dried seaweed,baby corn); and
3. unacceptably high pathway failure rates that suggest further intervention would be useful(mangosteen, blueberries, and fresh garlic).
The sets of parameters provided in Table 1.1 seem tentatively suitable, based on the results ofthe simulation experiments detailed in Chapter 6 and Appendix D.
3.4 Implementation
Implementation of the recommended monitoring system may be challenging. In order to monitoreach supplier using CSP–3, it will be necessary to keep a record of the suppliers’ inspection his-tories. Specifically, it will be necessary to develop a data table that records for each combinationof supplier and tariff the following information:
1. the current compliance status (monitor / enhanced / temporarily enhanced), and
2. the number of inspections since the last fail.
Three obvious strategies are: (a) embed the inspection algorithm within AIMS and automatethe switching rules; (b) regularly extract AIMS data for manual analysis, and feed back theprescribed states into the parameter rules; or (c) identify a subset of high-volume, compliantsuppliers using AIMS profiles, and run the CSP algorithm for those suppliers only, using aspreadsheet that is maintained by the Biosecurity Plant Division.
3.4.1 Embedding within AIMS
The first strategy would require that extra fields be made available in AIMS records to permitthe automated assessment of the compliance history of a supplier’s past consignments, and thatthere be some way of storing supplier and/or country-specific status flags (monitor/enhanced)for each commodity for which the algorithm is used. This strategy has the advantage of beingautomated and relatively easily generalized without the need to employee additional resourcesor training to undertake each consignment assessment, and can be applied to additional importpathways as analysis becomes more regular. The full automation of compliance analysis via use ofa Quarantine Ruler system is the most preferable option for implementing risk return inspectionregimes. However initiating this level of upgrade within the current IT infrastructure would becostly and lengthy to develop and is not feasible considering an ICT upgrade is currently beingplanned for the future. The interim solution will involve the external handling of inspection datato ensure the suggested risk return strategies advocated within this report can be implementedin the immediate future.
3.4.2 Regular Data Extraction
The second strategy might work for a small handful of pathways but would rapidly becomeoverwhelming. It is to be avoided at all extents.
14
AQIS Risk–Return: Plant-Product Pathways Final Report
3.4.3 External Handling
Discussions with the Cargo Targeting and Effectiveness Program, and Electronic Systems Tac-tical Enhancements Program, have identified the following method of employing a continuoussampling plan.
Using dried apricots as an example, continue current 100% mandatory referral profile toAIMS from ICS for the commodity tariff code. All commodity consignments would continueto be referred from the ICS to AIMS. 100% of consignments would have their commercialdocumentation reviewed by AQIS staff. A quarantine ruler applied to this tariff code wouldauto-direct entry officers, via the AIMS profile light system and an automated AIMS documentdirection, to check the plant quarantine web-based dashboard to determine the required samplingrate.
The plant quarantine dashboard created by Electronic System will be accessible by a hy-perlink. Officers will enter the supplier code and commodity tariff code. The dashboard willpull real time data from AIMS to populate the supplier’s compliance history. Advice on therequired sampling rate for each commodity will be required to ensure the system is effectivelyimplemented, and can be provided to entry management via training and instructional material.Training of regional entry management officers will be required to ensure this is effectively used.
3.5 Why not IRIS?
Previous ACERA work in the area of the allocation of inspection resources has used the IRIStool (see, e.g., Robinson et al., 2009). The IRIS tool works best for pathways that have verylarge volumes — for example, multiple thousands of units — and that have only a small numberof sub-pathways, for example, regions. We tried to use the IRIS tool for the pathways consideredin this report but it proved to be unhelpful, compared with the simulation experiments. Thiswas because there were too few inspections available in the history of each pathway, with thepossible exception of green coffee beans.
15
4
Data Preparation
4.0.1 Extraction
The data used during this analysis were retrieved from two AQIS databases: AIMS and Incidents.Approximately five and a half years of inspection data for each pathway were retrieved, usingtariff codes and importer descriptions as search terms. Consignment information was sourcedfrom AIMS, and the corresponding insect or pathogen interceptions recorded were derived fromthe Incidents database.
The majority of commercial consignment data in AIMS is electronically referred from theCustoms Integrated Cargo System (ICS). The ICS data are collected for Customs purposes and,based on tariff codes and importer responses to quarantine and imported food declarations,are transferred to AIMS when quarantine conditions are required. There is a risk that a smallproportion of consignments relevant to the analysis have not been identified due to incorrecttariff codes or description fields. The project team has worked with the assumption that themajority of commercial consignment details have been entered correctly and incorporated intoeach pathway analysis. AIMS records are not static; changes made in ICS or broker records fortax or other purposes will affect AIMS records.
4.0.2 Data Cleaning
Following data extraction, manual filtering was required to remove any consignment entriesthat were incorrectly included and convert the raw data into a consistent format for analysis.During this process an issue was identified with the lack of standardised recording of shipmentquantities. ICS records quantities using a free-text system and importers can record shipmentsize in a number of units, including kilograms, pounds, cartons, or tonnes; prior to analysis thisdata needs to be standardised into a single measurement unit.
After manipulation and standardisation, the AIMS dataset was merged with the incidentsdataset to form one comprehensive datasheet for analysis. The incidents and pathway failuredata used were sourced from both the Incidents database and from the AIMS negative inspectionresults. A pathway failure was recorded for consignments with a negative inspection record dueto document or non-commodity specific failures with the consignment, such as packaging. Aquarantine failure was recorded within this review for consignments with a recorded detectionof quarantine concern, such as a live arthropod, pathogen, or contamination such as seed or soil.Pathway failure and quarantine failure are represented as PF and QF respectively throughoutthe case study figures and tables.
Determining the quarantine risk of pathway failures was a significant issue for the projectteam because the Incidents database is primarily used by the Operational Science Program(OSP) to record identified invertebrate or pathogenic interceptions. However, for a range ofreasons, identification of specimens to a species level is not always undertaken. Hence, theIncidents database does not consistently contain species identification information, which pre-
16
AQIS Risk–Return: Plant-Product Pathways Final Report
vented the reviewing of the biosecurity risk of the reviewed imported plant-product pathways.Therefore any pest or disease intercepted during inspection was deemed a quarantine failure forthe pathway. Pathway failures that were not directed to OSP for identification, such as plantmaterial contamination or insects that were unable to be collected, are generally not recordedin the database. The Incidents database cannot be used as the only source of inspection failureinformation. To ensure an accurate representation of quarantine failure for each pathway, allfailed AIMS entries were manually reviewed and failures added to the manipulated data, alongwith information from the Incidents database. Adding negative inspections required the manualsearching of AIMS comment fields.
The data preparation was a painstaking process. Overall, an average of 3–4 days was requiredto complete each individual commodity dataset.
4.0.3 Analytic Timespan
The available data comprised inspections over the last 5.5 years. Due to a change in the AIMSrecording system, the 2005 data consisted of only two and a half months, and data for 2011 werenecessarily incomplete.
The simulation experiment was performed on all of the data, however, only the inspectionscorresponding to the most recent 2.5 years were reported against. The two reasons are (a)that the early performance of the inspection algorithm is discarded, and (b) that the resultsreflect the current status of the pathway as much as possible. Discarding the early performanceof the inspection algorithm is useful because including it will distort the long-term results.The distortion occurs because the algorithm always starts with all pathways under enhancedinspection, that is, being completely inspected, for a set number of inspections. So it is possibleto think of the first three years of the simulation as being a ’burn-in’ period, during which thealgorithm establishes a pattern.
Also, this temporal window was selected as providing a reasonable compromise betweentimeliness, that is, not including any data that were too old, and having enough data availablefor the comparisons to be valid.
17
5
Simulation Experiment
5.1 Introduction
This chapter presents the design of simulation experiments that have been run on past inspectiondata for each commodity pathway. The simulation experiments were undertaken to provideinsight into the validity and suitability of different inspection regimes.
AQIS has a large volume of interception data. It comprises plant pests classified to varioustaxonomic levels from pathways. These data provide a valuable risk profile for commoditiescoming from specific origins and therefore a basis for comparing the likely utility of differentsample designs.
Theoretical considerations are useful when nothing is known about the properties of theprocess. If suitable historical inspection data are available, then simulations of the algorithmsshould be undertaken to replace the theoretical assumptions made during model development.Simulations run using real data will provide the most accurate picture of the validity of therequired inspection regime. For example, the theoretical performance of the CSP family can bespecified if we assume that the underlying approach rate is always the same. This assumptiondoes not sit comfortably with operational experience, nor with our analyses of the inspectionhistories of the pathways, which show shifts in approach rates (see, for example, Figure D.26).By using historical inspection data, we allow for the demonstrated propensity of a pathway tohave such shifts in approach rates.
5.2 Design
The simulation experiments are designed as follows. We nominated a range of different inspectiondesigns, as outlined above, and for each selected a range of control parameters.
• CSP–1, CSP–2, and CSP–3: all combinations of monitoring fraction f = 0.1, 0.25, 0.33,and 0.5, and clearance number i = 5, 10, 20, and 40; repeated 100 times for each combi-nation.
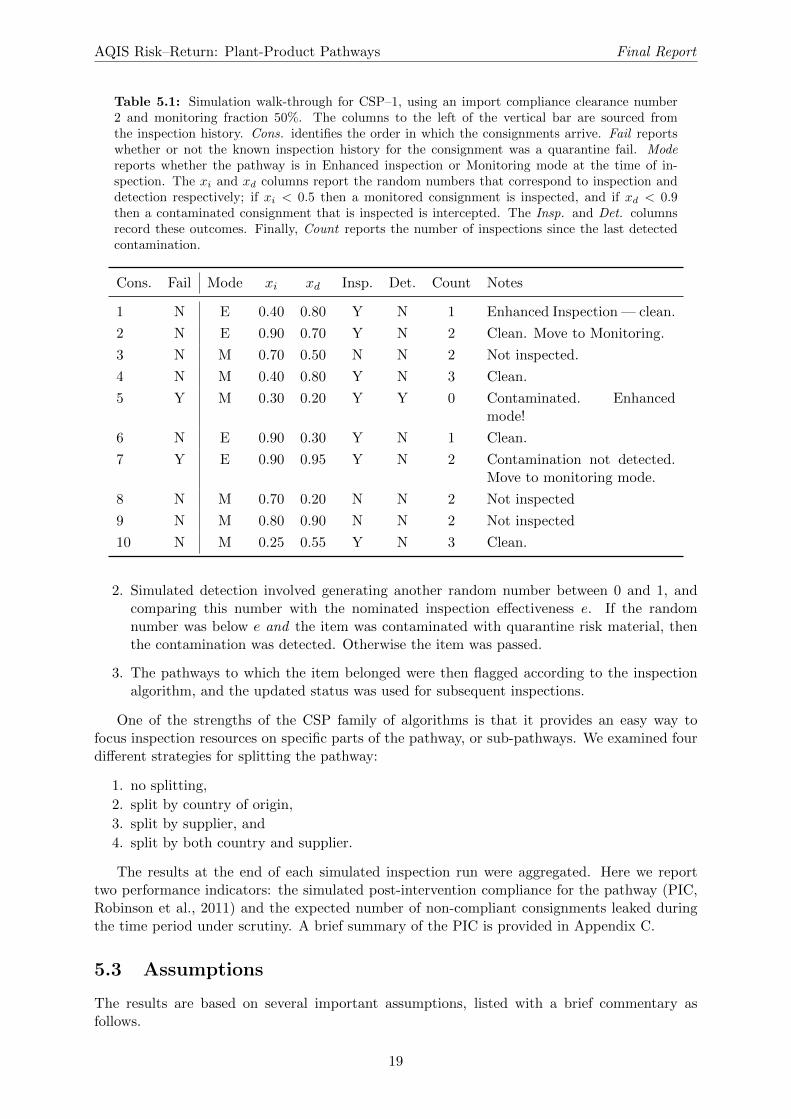
We looped through the inspection history of the product in the following way. See Table 5.1for a row-by-row example of the process.
1. For each line, we determined whether or not the pathway(s) that the line belonged to wereflagged for enhanced inspection or monitoring. If any pathway was flagged for enhancedinspection, then the line was inspected. If not, then the line was inspected with probabilityequal to the monitoring fraction. That is, for each line that was flagged for monitoring,a random number between 0 and 1 was generated, and compared with the nominatedmonitoring fraction f . If the random number was below f , then the item was ‘inspected’,otherwise it was released.
18
AQIS Risk–Return: Plant-Product Pathways Final Report
Table 5.1: Simulation walk-through for CSP–1, using an import compliance clearance number2 and monitoring fraction 50%. The columns to the left of the vertical bar are sourced fromthe inspection history. Cons. identifies the order in which the consignments arrive. Fail reportswhether or not the known inspection history for the consignment was a quarantine fail. Modereports whether the pathway is in Enhanced inspection or Monitoring mode at the time of in-spection. The xi and xd columns report the random numbers that correspond to inspection anddetection respectively; if xi < 0.5 then a monitored consignment is inspected, and if xd < 0.9then a contaminated consignment that is inspected is intercepted. The Insp. and Det. columnsrecord these outcomes. Finally, Count reports the number of inspections since the last detectedcontamination.
Cons. Fail Mode xi xd Insp. Det. Count Notes
1 N E 0.40 0.80 Y N 1 Enhanced Inspection — clean.
2 N E 0.90 0.70 Y N 2 Clean. Move to Monitoring.
3 N M 0.70 0.50 N N 2 Not inspected.
4 N M 0.40 0.80 Y N 3 Clean.
5 Y M 0.30 0.20 Y Y 0 Contaminated. Enhancedmode!
6 N E 0.90 0.30 Y N 1 Clean.
7 Y E 0.90 0.95 Y N 2 Contamination not detected.Move to monitoring mode.
8 N M 0.70 0.20 N N 2 Not inspected
9 N M 0.80 0.90 N N 2 Not inspected
10 N M 0.25 0.55 Y N 3 Clean.
2. Simulated detection involved generating another random number between 0 and 1, andcomparing this number with the nominated inspection effectiveness e. If the randomnumber was below e and the item was contaminated with quarantine risk material, thenthe contamination was detected. Otherwise the item was passed.
3. The pathways to which the item belonged were then flagged according to the inspectionalgorithm, and the updated status was used for subsequent inspections.
One of the strengths of the CSP family of algorithms is that it provides an easy way tofocus inspection resources on specific parts of the pathway, or sub-pathways. We examined fourdifferent strategies for splitting the pathway:
1. no splitting,
2. split by country of origin,
3. split by supplier, and
4. split by both country and supplier.
The results at the end of each simulated inspection run were aggregated. Here we reporttwo performance indicators: the simulated post-intervention compliance for the pathway (PIC,Robinson et al., 2011) and the expected number of non-compliant consignments leaked duringthe time period under scrutiny. A brief summary of the PIC is provided in Appendix C.
5.3 Assumptions
The results are based on several important assumptions, listed with a brief commentary asfollows.
19
AQIS Risk–Return: Plant-Product Pathways Final Report
• Inspection effectiveness is assumed to be 90%. This assumption was made based on dis-cussions with the pathway managers. Leakage surveys that could be used to estimateinspection effectiveness are not available on this pathway. It is possible that the inspectioneffectiveness may vary by consignment characteristics; for example consignment size. It iscertain that effectiveness is depends on within-consignment prevalence.
This assumption is important because without assuming some value for inspection effec-tiveness, we would have been unable to estimate the pathway leakage or compliance, andtherefore unable to compare the different inspection algorithms. If this assumption of90% effectiveness is wrong then the estimated leakage rates and compliance rates will beinaccurate.
• The data are assumed to be representative of commercial consignments for each pathway.In fact, we only have access to the data for the entries that were recorded in AIMS. Theremay be relevant consignments in the Self-Assessed Clearance (SAC) pathway, which donot necessarily appear in AIMS, but these are likely to be small, as the upper limit fordeclared SAC value is $1000. Also, there may be other consignments of the same productbut with incorrect tariff codes.
This assumption is important because it allows us to draw conclusions about the wholeplant product pathway from the available inspection data. If this assumption is wrongthen there will be consignments that should be counted that are not. Note that SACentries that fail inspection are upgraded to AIMS, and therefore will appear in our data.
• We assume for the simulations that the approach rate of contamination in the future willnot differ substantially from that of the last two years of the data.
This assumption is important because it enables us to make some comment about thefuture performance of the inspection algorithms that we are comparing based on theirperformance using historical data. If this assumption is wrong then it should rapidlybecome obvious in the inspection data; the proposed monitoring regime is designed todetect changes in the approach rate with high probability.
• We assume for the simulations that the temporal patterns of contamination in the futurewill not differ substantially from that of the last two years of the data. That is, we assumethat the inspection history represents the full range of patterns of non-compliance that arerelevant to the question at hand.
This assumption is important because our inspection algorithm is designed to respond topatterns of non-compliance, and if future patterns of non-compliance are different fromhistorical patterns then the simulation results will not represent future conditions.
The simulation results are reported only for the period July 1 2008 until the newest entry,although the algorithm was applied to the full dataset (starting at 12 October 2005) as a burn-instrategy. That is, the simulation was performed on the entire inspection history, but we reportonly the results of the inspections that were undertaken since July 1 2008. This temporal windowwas selected as providing a reasonable compromise between timeliness, that is, not including anydata that were too old, and having enough data available for the comparisons to be valid. SeeSection 4.0.3.
The analysis can be repeated with more up-to-date data as they become available. The fullsuite of simulations takes a few hours on a Sun SunFire X4600M2, with eight AMD Quadcore2.3GHz CPUs and 64GB memory, running Red Hat Enterprise Linux Server 5.6 (RHEL 5.6).
5.4 A Caveat
In addition to the assumptions outlined above, it is important to note that we have only beenable to perform the simulation experiments using the available inspection data. Many of the
20
AQIS Risk–Return: Plant-Product Pathways Final Report
smaller suppliers will not have had sufficient time to reach the clearance number and moveto a monitoring regime. Hence if the pathway is largely clear, as we would require becausewe recommend implementation of CSP-3 only on imported-plant product pathways that haveacceptably low approach rates, then we can expect that the realized inspection rate will decreasewith time, as the smaller importers build the compliance history necessary to qualify for thereduced inspection regime. From this point of view, the results of the simulation experimentare conservative: in time, the same levels of compliance will be able to be maintained with lesseffort.
21
6
A Case Study
Here we present one of the case studies: dried apricots. Details of the others are available inAppendix D.
6.1 Dried Apricots
For this analysis, ‘dried apricots’ refers to dried Prunus armeniaca without seeds. The driedapricots pathway is an excellent candidate for CSP–3 monitoring by supplier; the high-volumesuppliers all have excellent importation records in terms of quarantine compliance, and the veryfew instances of contamination detected on this pathway have been in consignments that weresent by low-volume suppliers.
6.1.1 Import Conditions
Dried fruit generally represent a lower quarantine risk than similar fresh commodities. However,dried commodities can pose serious quarantine risks because the process of drying is insufficientto eliminate disease agents. In some cases, dried fruit will contain viable seeds which may beof a quarantine concern, such as Prunus spp. which can carry seed-borne diseases such as PlumPox Virus. All dried fruit may potentially introduce exotic insect pests and are considered ahigh risk of introducing khapra beetle if originating from a host country.
An Import Permit is not required. Phytosanitary certificates are required for all Full Con-tainer Load (FCL) consignments. Non-FCL consignments do not require a phyto cert. Driedfruits are required to be commercially produced and packed. “Exposed” (exposed to insect in-festation) produce are to be subject to mandatory fumigation with methyl bromide. Prior toentry, all consignments must pass an AQIS quarantine inspection on arrival to verify that theshipment is free of soil, live insects, rice hulls, contamination with restricted and prohibited seedand other material of quarantine concern (e.g. leaf or stem material, faeces, animal remainsetc.) and packed in new, clean bags.
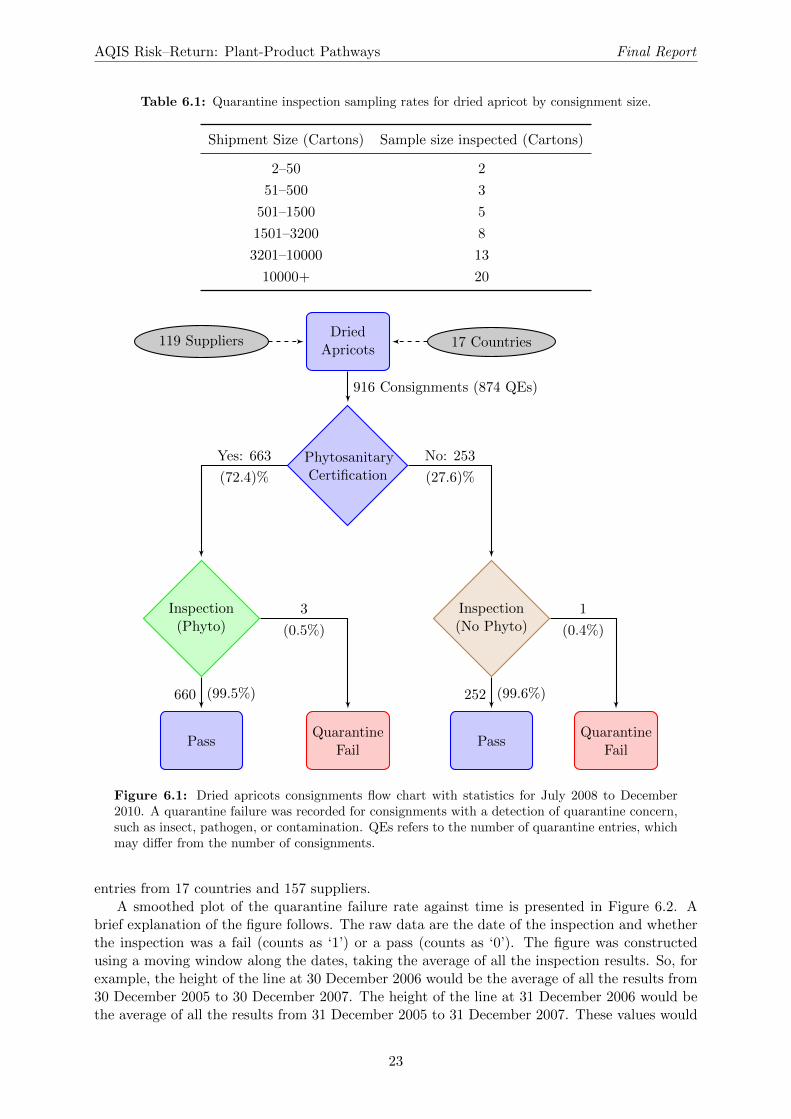
Consignments are inspected by selecting sample cartons at random for inspection. Samplesare collected from the consignment at the rates outlined in Table 6.1.
No formal import risk assessment has been undertaken for dried apricots.
6.1.2 Pathway Summary
A flowchart of the pathway is presented in Figure 6.1.
6.1.3 Analysis
This section provides a statistical overview of the data. The full dataset comprises 1661 consign-ments with record creation dates ranging from October 2005 to December 2010, and comprises
22
AQIS Risk–Return: Plant-Product Pathways Final Report
Table 6.1: Quarantine inspection sampling rates for dried apricot by consignment size.
Shipment Size (Cartons) Sample size inspected (Cartons)
2–50 2
51–500 3
501–1500 5
1501–3200 8
3201–10000 13
10000+ 20
119 SuppliersDried
Apricots17 Countries
PhytosanitaryCertification
Inspection(Phyto)
Inspection(No Phyto)
PassQuarantine
FailPass
QuarantineFail
916 Consignments (874 QEs)
660 (99.5%)
3
(0.5%)
252 (99.6%)
1
(0.4%)
Yes: 663
(72.4)%
No: 253
(27.6)%
Figure 6.1: Dried apricots consignments flow chart with statistics for July 2008 to December2010. A quarantine failure was recorded for consignments with a detection of quarantine concern,such as insect, pathogen, or contamination. QEs refers to the number of quarantine entries, whichmay differ from the number of consignments.
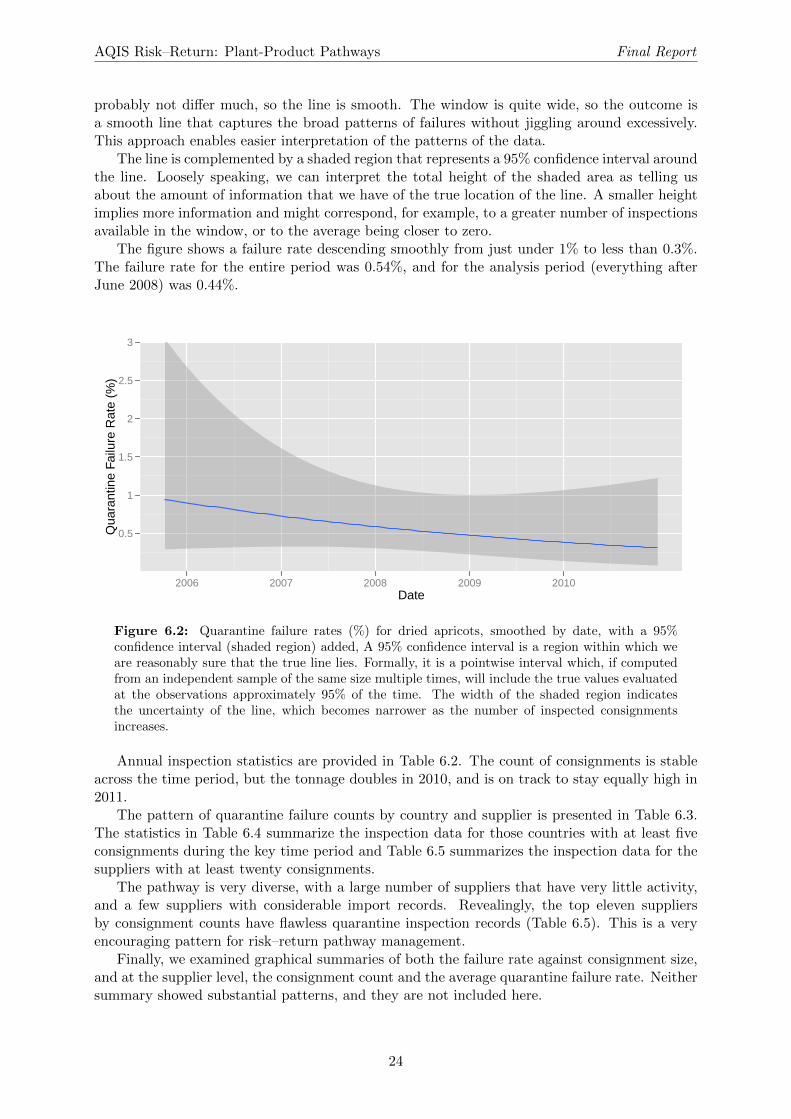
entries from 17 countries and 157 suppliers.A smoothed plot of the quarantine failure rate against time is presented in Figure 6.2. A
brief explanation of the figure follows. The raw data are the date of the inspection and whetherthe inspection was a fail (counts as ‘1’) or a pass (counts as ‘0’). The figure was constructedusing a moving window along the dates, taking the average of all the inspection results. So, forexample, the height of the line at 30 December 2006 would be the average of all the results from30 December 2005 to 30 December 2007. The height of the line at 31 December 2006 would bethe average of all the results from 31 December 2005 to 31 December 2007. These values would
23
AQIS Risk–Return: Plant-Product Pathways Final Report
probably not differ much, so the line is smooth. The window is quite wide, so the outcome isa smooth line that captures the broad patterns of failures without jiggling around excessively.This approach enables easier interpretation of the patterns of the data.
The line is complemented by a shaded region that represents a 95% confidence interval aroundthe line. Loosely speaking, we can interpret the total height of the shaded area as telling usabout the amount of information that we have of the true location of the line. A smaller heightimplies more information and might correspond, for example, to a greater number of inspectionsavailable in the window, or to the average being closer to zero.
The figure shows a failure rate descending smoothly from just under 1% to less than 0.3%.The failure rate for the entire period was 0.54%, and for the analysis period (everything afterJune 2008) was 0.44%.
0.5
1
1.5
2
2.5
3
2006 2007 2008 2009 2010Date
Qua
rant
ine
Failu
re R
ate
(%)
Figure 6.2: Quarantine failure rates (%) for dried apricots, smoothed by date, with a 95%confidence interval (shaded region) added, A 95% confidence interval is a region within which weare reasonably sure that the true line lies. Formally, it is a pointwise interval which, if computedfrom an independent sample of the same size multiple times, will include the true values evaluatedat the observations approximately 95% of the time. The width of the shaded region indicatesthe uncertainty of the line, which becomes narrower as the number of inspected consignmentsincreases.
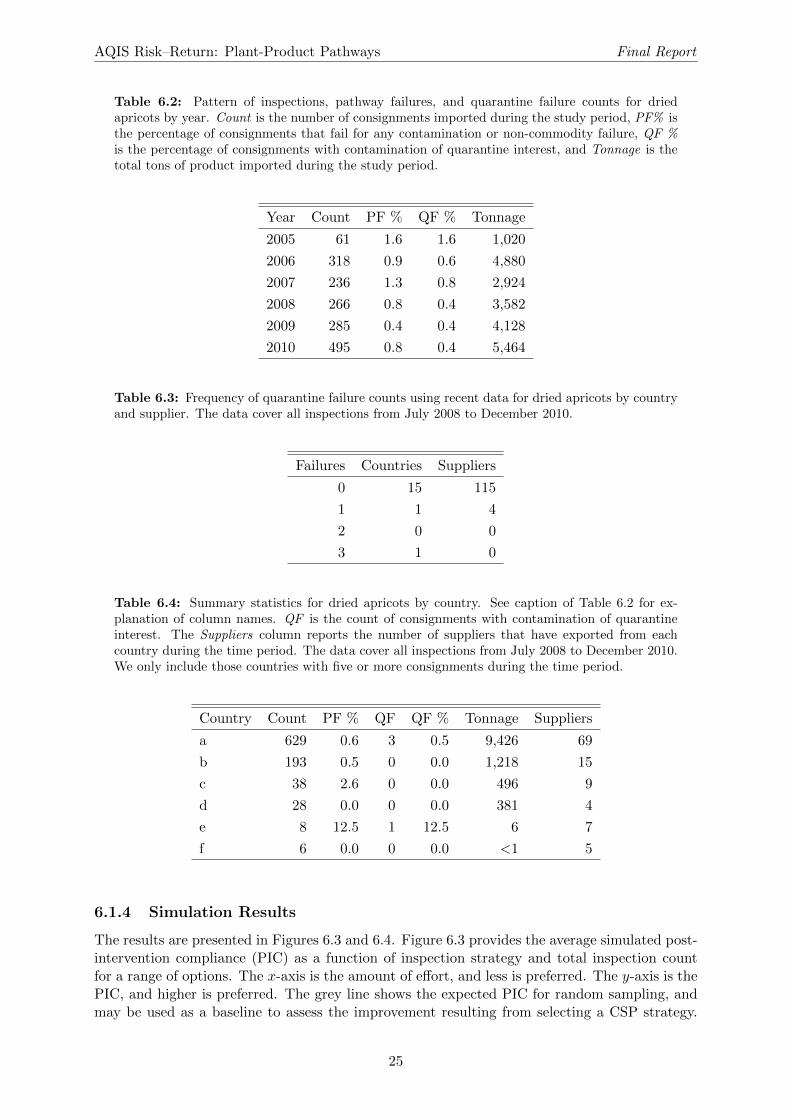
Annual inspection statistics are provided in Table 6.2. The count of consignments is stableacross the time period, but the tonnage doubles in 2010, and is on track to stay equally high in2011.
The pattern of quarantine failure counts by country and supplier is presented in Table 6.3.The statistics in Table 6.4 summarize the inspection data for those countries with at least fiveconsignments during the key time period and Table 6.5 summarizes the inspection data for thesuppliers with at least twenty consignments.
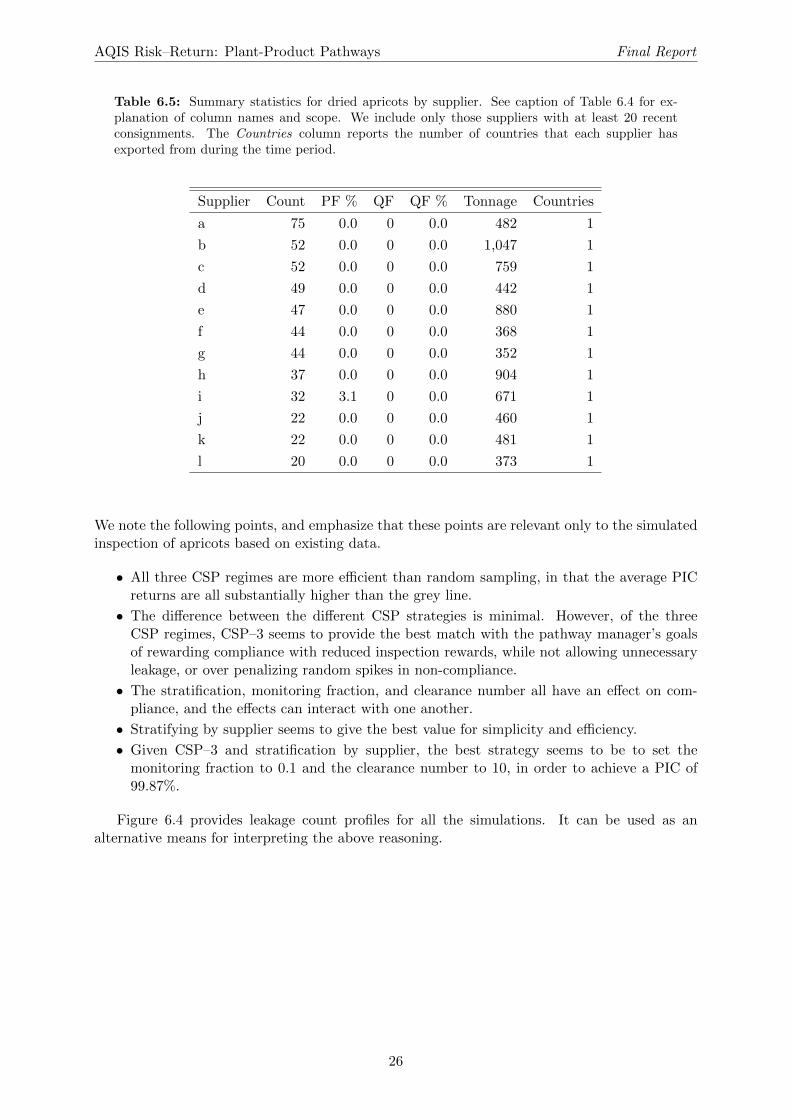
The pathway is very diverse, with a large number of suppliers that have very little activity,and a few suppliers with considerable import records. Revealingly, the top eleven suppliersby consignment counts have flawless quarantine inspection records (Table 6.5). This is a veryencouraging pattern for risk–return pathway management.
Finally, we examined graphical summaries of both the failure rate against consignment size,and at the supplier level, the consignment count and the average quarantine failure rate. Neithersummary showed substantial patterns, and they are not included here.
24
AQIS Risk–Return: Plant-Product Pathways Final Report
Table 6.2: Pattern of inspections, pathway failures, and quarantine failure counts for driedapricots by year. Count is the number of consignments imported during the study period, PF% isthe percentage of consignments that fail for any contamination or non-commodity failure, QF %is the percentage of consignments with contamination of quarantine interest, and Tonnage is thetotal tons of product imported during the study period.
Year Count PF % QF % Tonnage
2005 61 1.6 1.6 1,020
2006 318 0.9 0.6 4,880
2007 236 1.3 0.8 2,924
2008 266 0.8 0.4 3,582
2009 285 0.4 0.4 4,128
2010 495 0.8 0.4 5,464
Table 6.3: Frequency of quarantine failure counts using recent data for dried apricots by countryand supplier. The data cover all inspections from July 2008 to December 2010.
Failures Countries Suppliers
0 15 115
1 1 4
2 0 0
3 1 0
Table 6.4: Summary statistics for dried apricots by country. See caption of Table 6.2 for ex-planation of column names. QF is the count of consignments with contamination of quarantineinterest. The Suppliers column reports the number of suppliers that have exported from eachcountry during the time period. The data cover all inspections from July 2008 to December 2010.We only include those countries with five or more consignments during the time period.
Country Count PF % QF QF % Tonnage Suppliers
a 629 0.6 3 0.5 9,426 69
b 193 0.5 0 0.0 1,218 15
c 38 2.6 0 0.0 496 9
d 28 0.0 0 0.0 381 4
e 8 12.5 1 12.5 6 7
f 6 0.0 0 0.0 <1 5
6.1.4 Simulation Results
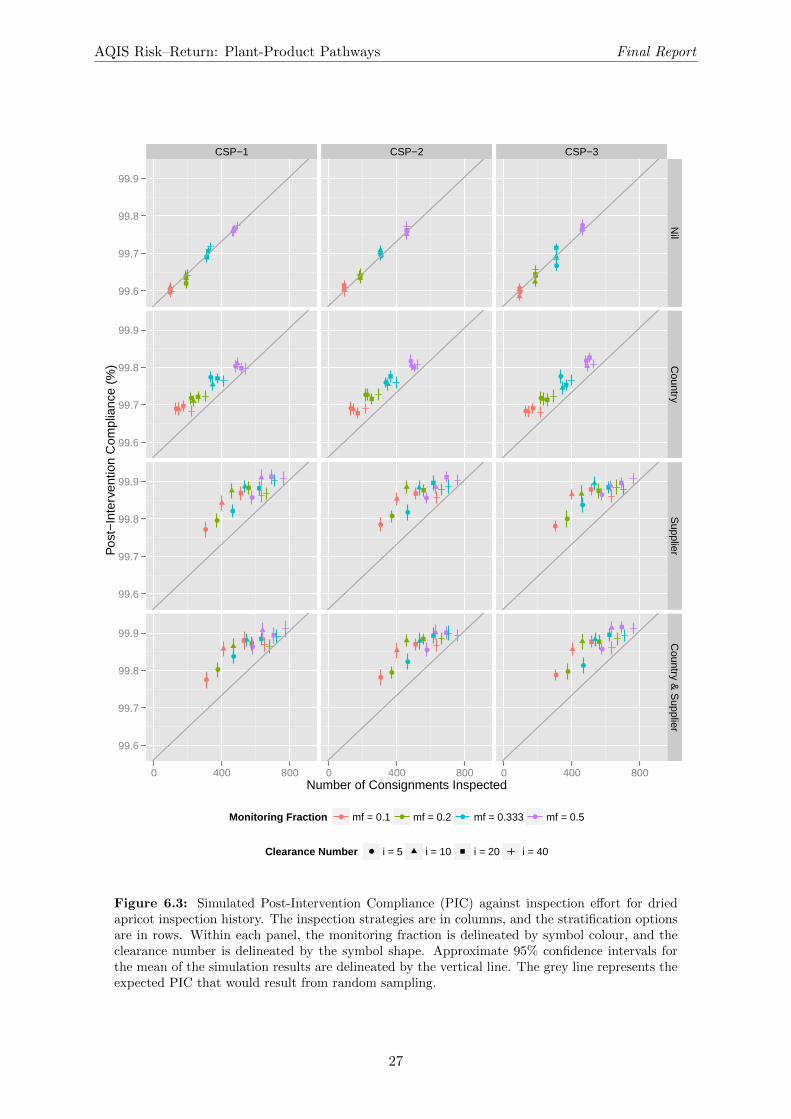
The results are presented in Figures 6.3 and 6.4. Figure 6.3 provides the average simulated post-intervention compliance (PIC) as a function of inspection strategy and total inspection countfor a range of options. The x-axis is the amount of effort, and less is preferred. The y-axis is thePIC, and higher is preferred. The grey line shows the expected PIC for random sampling, andmay be used as a baseline to assess the improvement resulting from selecting a CSP strategy.
25
AQIS Risk–Return: Plant-Product Pathways Final Report
Table 6.5: Summary statistics for dried apricots by supplier. See caption of Table 6.4 for ex-planation of column names and scope. We include only those suppliers with at least 20 recentconsignments. The Countries column reports the number of countries that each supplier hasexported from during the time period.
Supplier Count PF % QF QF % Tonnage Countries
a 75 0.0 0 0.0 482 1
b 52 0.0 0 0.0 1,047 1
c 52 0.0 0 0.0 759 1
d 49 0.0 0 0.0 442 1
e 47 0.0 0 0.0 880 1
f 44 0.0 0 0.0 368 1
g 44 0.0 0 0.0 352 1
h 37 0.0 0 0.0 904 1
i 32 3.1 0 0.0 671 1
j 22 0.0 0 0.0 460 1
k 22 0.0 0 0.0 481 1
l 20 0.0 0 0.0 373 1
We note the following points, and emphasize that these points are relevant only to the simulatedinspection of apricots based on existing data.
• All three CSP regimes are more efficient than random sampling, in that the average PICreturns are all substantially higher than the grey line.
• The difference between the different CSP strategies is minimal. However, of the threeCSP regimes, CSP–3 seems to provide the best match with the pathway manager’s goalsof rewarding compliance with reduced inspection rewards, while not allowing unnecessaryleakage, or over penalizing random spikes in non-compliance.
• The stratification, monitoring fraction, and clearance number all have an effect on com-pliance, and the effects can interact with one another.
• Stratifying by supplier seems to give the best value for simplicity and efficiency.
• Given CSP–3 and stratification by supplier, the best strategy seems to be to set themonitoring fraction to 0.1 and the clearance number to 10, in order to achieve a PIC of99.87%.
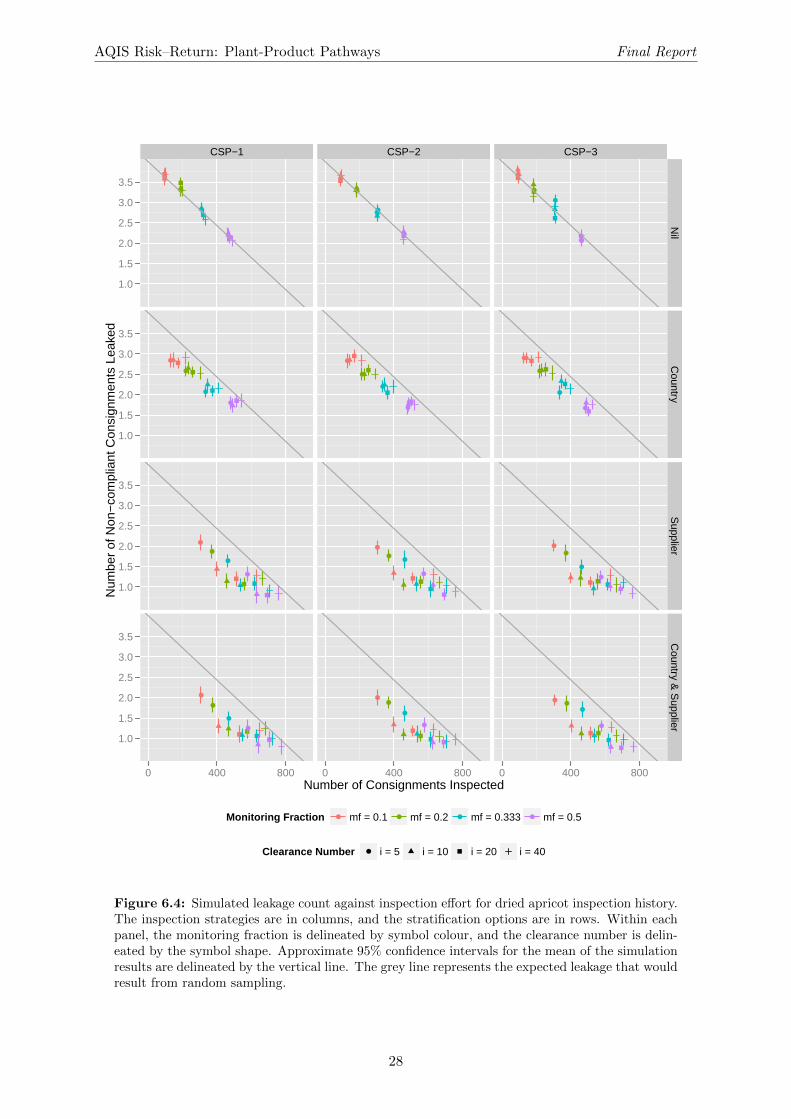
Figure 6.4 provides leakage count profiles for all the simulations. It can be used as analternative means for interpreting the above reasoning.
26
AQIS Risk–Return: Plant-Product Pathways Final Report
CSP−1 CSP−2 CSP−3
99.6
99.7
99.8
99.9
99.6
99.7
99.8
99.9
99.6
99.7
99.8
99.9
99.6
99.7
99.8
99.9
●
●
●
●
●
●
●
●
●
●
●
●
●
●
●
●
●
●
●
●
●
●
●
●
●
●●
●
●●
●
●
●
●
●
●
●
●
●
●
●●
●
●
●●
●
●
Nil
Country
Supplier
Country &
Supplier
0 400 800 0 400 800 0 400 800Number of Consignments Inspected
Pos
t−In
terv
entio
n C
ompl
ianc
e (%
)
Monitoring Fraction ● ● ● ●mf = 0.1 mf = 0.2 mf = 0.333 mf = 0.5
Clearance Number ● i = 5 i = 10 i = 20 i = 40
Figure 6.3: Simulated Post-Intervention Compliance (PIC) against inspection effort for driedapricot inspection history. The inspection strategies are in columns, and the stratification optionsare in rows. Within each panel, the monitoring fraction is delineated by symbol colour, and theclearance number is delineated by the symbol shape. Approximate 95% confidence intervals forthe mean of the simulation results are delineated by the vertical line. The grey line represents theexpected PIC that would result from random sampling.
27
AQIS Risk–Return: Plant-Product Pathways Final Report
CSP−1 CSP−2 CSP−3
1.0
1.5
2.0
2.5
3.0
3.5
1.0
1.5
2.0
2.5
3.0
3.5
1.0
1.5
2.0
2.5
3.0
3.5
1.0
1.5
2.0
2.5
3.0
3.5
●
●
●
●
●
●
●
●
●
●
●
●
●
●
●
●
●
●
●
●
●
●
●
●
●
●●
●
●●
●
●
●
●
●
●
●
●
●
●
●●
●
●
●●
●
●
Nil
Country
Supplier
Country &
Supplier
0 400 800 0 400 800 0 400 800Number of Consignments Inspected
Num
ber
of N
on−
com
plia
nt C
onsi
gnm
ents
Lea
ked
Monitoring Fraction ● ● ● ●mf = 0.1 mf = 0.2 mf = 0.333 mf = 0.5
Clearance Number ● i = 5 i = 10 i = 20 i = 40
Figure 6.4: Simulated leakage count against inspection effort for dried apricot inspection history.The inspection strategies are in columns, and the stratification options are in rows. Within eachpanel, the monitoring fraction is delineated by symbol colour, and the clearance number is delin-eated by the symbol shape. Approximate 95% confidence intervals for the mean of the simulationresults are delineated by the vertical line. The grey line represents the expected leakage that wouldresult from random sampling.
28
7
Recommendations
This chapter details the next set of steps to be undertaken for pathway risk management inthe short and medium term. The following shortcomings of the available data and the existingsystems have been identified during the development of this project.
1. Automated supplier targeting is limited in the current IT system.
Realisation of the risk return savings of reducing inspection regimes is dependent on theability to implement reduced inspection rates without requiring significant additional re-sources for implementation. The ideal solution for reduced inspection rate implementationis by incorporating the automated review of a suppliers compliance history into the currentelectronic system.
Due to the significant cost and development time a plant quarantine ruler that wouldenable this automated review cannot be feasibly developed in the current AIMS system. Analternative implementation of risk return is currently being developed for the interim periodbefore the new ICT system is established. Issues around the alternative implementationinclude a need for increased entry management resources to manually review a supplierspast inspection compliance in order to determine if an inspection is required. A cost benefitassessment will be made and published in a review following the implementation trial todetermine if the additional resources required on review is outweighed by the savings toinspection resources.
The implementation trial will provide invaluable risk return information in addition tothe recommendations identified within this report to support the ICT business case andsystem development.
2. No information about inspection effectiveness is available.
It is generally recognized that inspections are not and cannot be perfect. Two kinds ofinspection error are possible: a false positive, which is wrongly identifying a compliantconsignment as being non-compliant, and a false negative, which is wrongly identifying anon-compliant consignment as being compliant.
Of the two kinds of error, the second is of greater concern, because it leads the inspectorateto believe that the pathway may be cleaner than it truly is. The usual ameliorative actionis to apply an assumed inspection effectiveness rate to correct the estimates of the pathwaycompliance rate.
Estimates of effectiveness are best developed using a leakage survey. The principle of aleakage survey is that a subsample of those consignments that have already been inspectedis inspected again, ideally with greater thoroughness than the initial inspection, if thatis possible. The subsample should ideally be of a sufficient size in order to be able toestimate the effectiveness of the inspection regime with confidence. The useful lower limit
29
AQIS Risk–Return: Plant-Product Pathways Final Report
will be somewhere in the order of a couple of hundred units. Examples of sample sizesand methods to derive them can be found in Appendix 1 of Cannon (2003); the relevantmaterial is reproduced as Appendix B of this report.
As the number of pathways that are being monitored in this way increases, the overall num-ber of leakage surveys required will also increase. It may be possible for the inspectorateto group ‘like’ pathways from the point of view of leakage propensity, in order to form amore efficient estimate of pathway and inspection regime risks. Therefore the inspectoratemay assume that leakage rates are constant across country, supplier, and perhaps acrosscertain tariffs, in order to allow for pooling data to obtain better (less variable) estimatesof effectiveness across the pathways.
By the same token, it is possible that some pathways may be required to be stratifiedto enable the accurate computing of a pathways risk, for example the effectiveness ofinspection may differ within species of nursery stock.
3. Data capture systems do not support automated risk return analysis.
Presently the pathway data are held in two separate databases: AIMS holds the infor-mation on all the inspections, and Incidents holds information on the contamination ofthe non-compliant consignments. The Incidents database was used with the intention ofinforming the biosecurity risk of interceptions detected on each pathway. A sparsity ofidentifications to species level and a lack of reporting on the actionable or non-actionablequarantine status of the interception are current issues with the Incidents database. Thislack of species-specific quarantine information resulted in the project team being unable toproduce a suitable picture of biosecurity risk for each pathway. Subsequently all intercep-tions were classified as quarantine failures1 to insure a conservative approach to assessingthe quarantine risk of a pathway. In addition the Incidents database alone did not con-tain all the quarantine failure information required to assess failure rates for the pathway.For this reason negative inspection data within the AIMS system was also required to bereviewed to ensure quarantine failure rates where accurately represented.
In order to analyze the pathway and deploy the inspection algorithm, it is necessary tomerge the databases, or at least merge the inspection updates of additional quarantinefailures. Unless all the needed information can be consolidated automatically into onedatabase, the merge will have to be performed whenever the algorithm is to be used.
It is recommended that advances to the AIMS database be considered to enable the em-ployment of further risk-return analysis. Specifically the automated addition of incidentsidentification information to be recorded and stored in AIMS against the relevant con-signment details. Information on whether an interception is of quarantine concern couldbe achieved with the addition of a new field in AIMS used to record whether or not theconsignment is non-compliant for reasons that are related to quarantine biosecurity. Im-proving the AIMS database to include an actionable or non-actionable field will assist in theability to determine a pathways actual quarantine failure rate. In addition sub-sampling ofinterceptions for each pathway as discussed in recommendation 4 below, will help developa picture of the quarantine pests associated with the pathway, and in turn enable a moreinformed approach to determining a pathways level of risk. The use of this field wouldnot preclude the maintenance of Incidents for other reasons, however, it would enable anintegrated analysis of inspection data using only AIMS. This single point of contact wouldalso be very beneficial in allowing the possibility for the inspection algorithm to be auto-mated within AIMS. Even the systematic use of an agreed key word in the comments fieldwould improve the current reporting system, although questions could obviously be raisedabout the reliability of such an approach.
1This label is used to denote a failure of the pathway to comply with quarantine regulation.
30
AQIS Risk–Return: Plant-Product Pathways Final Report
4. Identification of risk is not systematic. At present, the identification of pests is haphazard,depending on decisions made by the importer, the availability of scientific resources, andother factors that resist generalization. As a consequence, using the data to decide whethera pest or pathogen is a biosecurity risk must be made conservatively when assessing therisks associated with detections.
A systematic approach based on sampling theory would allow better prescriptions to bemade about the true risk of a pathway. An ACERA project that is intended to developsuch an approach is underway with the Operational Science Program (ACERA Project1101E, Sampling for Invasives).
5. Simultaneous analysis of multiple pathways may yield advantages.
The trial approach used by this case study report has analysed pathways individually. Thisis a necessary and important starting step in the analysis of the system that comprises thepathways. However, such an analysis has two important shortcomings.
(a) The selection of pathways for analysis is haphazard, based on regional inspectorateadvice, rather than being guided by statistical principles that could be used to identifythose pathways that have inspection histories with characteristics that seem likely tobenefit from a risk–return inspection approach.
(b) The pathways are being analyzed independently. It is arguably possible that insightsor patterns that are determined in one pathway may be illuminating, or even useful, inanother pathway. For example, it is possible that the inspection history of a supplierfor one pathway may be relevant to their activities in other pathways.
Statistical model fitting and data mining can provide insight into these conjectures. AnACERA project that is intended to develop such an approach will be undertaken withPlant Quarantine Operations following finalisation of this project (ACERA Project 1101C,Quarantine Inspection and Auditing Across the Biosecurity Continuum).
6. Sustained innovation will be critical.
The outcomes of the analyses that drive this project should be reasonably stable for a yearor so. However, at some point we would want to make allowance for the possibility thatinspection history patterns have changed in ways that were unanticipated at this point.
As a simple example, we may prescribe a supplier-specific monitoring plan, but later findthat a country-specific plan would yield a better outcome. A re-analysis of the inspectiondata, including those new data that have been collected since this analysis, will be required.This re-analysis could be initially performed as a Post-Implementation Review.
The project team should prepare for this eventuality. The analytical tools that will bedeployed over the next portions of this project (1101C) will require reasonably sophisticatedquantitative backgrounds and training. It is unlikely that they will be suitable for the easygrasp of pathway managers and a dedicated data review team with appropriate training andstatistical aptitude should be developed to ensure the continued identification of furtherrisk return pathways and review of implemented inspection regimes.
The data should be reviewed at least quarterly for the first year. That process will involve,at minimum, extracting new inspection data from AIMS, merging the inspection datawith an extraction from Incidents, and performing some simple spreadsheet operations.The process will be more useful to the pathway manager if deeper analysis (such as isdocumented here) is undertaken here by suitably skilled personnel.
31
AQIS Risk–Return: Plant-Product Pathways Final Report
7. Informal variations to the algorithm could be worthwhile.
A reviewer of this report suggested “One benefit of the just checking stage in CSP-3(meaning the stage after a single quarantine detection) is that it provides an entry pointfor monitoring at the start of each season. One could imagine that the suppliers mighthave a few teething problems at such a time, but fewer than a supplier starting up fromscratch. The first four (say) consignments of a seasonal product could be inspected beforeflipping to monitoring mode, rather than the first 10 consignments for a new supplier.”
For this report, the majority of the pathways this algorithm would be applied to are nothorticultural, and have no season. Also, issues such as storage of goods for months prior toshipment, or exports from different hemispheres mean it will be very difficult to determinewhen a season starts and finishes. Nonetheless, the idea is worth keeping in mind.
32
Bibliography
Beale, R., Fairbrother, J., Inglis, A., and Trebeck, D. (2008). One Biosecurity: a WorkingPartnership. Commonwealth of Australia.
Bourke, P. (2002). A continuous sampling plan using cusums. Journal of Applied Statistics,29(8):1121–1133.
Cannon, R. (2003). Data Quality Plan. Australian Quarantine Inspection Service (AQIS) Inter-nal Report.
Dodge, H. (1943). A sampling inspection plan for continuous production. The Annals of Math-ematical Statistics, 14(3):264–279.
Dodge, H. F. and Torrey, M. N. (1951). Additional continuous sampling plans. Industrial QualityControl, 7(5):7–12.
Robinson, A., Burgman, M., Langlands, R., Cannon, R., and Clarke, F. (2009). AQIS ImportClearance Risk Framework. Technical Report 0804a, Australian Centre of Excellence for RiskAnalysis.
Robinson, A., Cannon, R., and Mudford, R. (2011). AQIS Quarantine Operations Risk Return:Performance Indicators. Technical Report 1001i 1, Australian Centre of Excellence for RiskAnalysis.
33
Appendix A
Starting Surveillance
In this chapter we recommend a sequence of actions for the pathway manager to undertake ifno inspection data are available for analysis.
A.1 Snapshot Survey
If nothing is known about the pathway failure rate then the best first step is to perform asnapshot survey. This survey would ideally extend for a minimum of two months (or 500–600consignments, whichever condition is satisfied first). During the survey, every consignment wouldbe inspected, and the outcomes of the inspections recorded in detail. Depending on the nature ofthe consignments, it may be worthwhile to inspect each one more intensively than the standardwork instructions would suggest. For example, if the usual procedure might be to inspect 600randomly selected units, then the snapshot survey might be of 1200 randomly selected units.
The results of these inspections can be used for several purposes:
1. define quarantine contamination, and having done so,
2. develop an understanding of the types and severity of quarantine contamination that thepathway is subject to, as well as
3. estimate the contamination rate of the pathway, and
4. identify data that would be useful to collect in the longer term.
Ideally such a survey should be undertaken with the cooperation of the OSP, so that the fullrange of potential contamination can be surveyed and assessed.
When the data have been analyzed, a CSP protocol can be applied to future inspection ofthe pathway as follows.
A.1.1 Selecting MF and CN
Recall that in order to deploy the CSP–1 algorithm, the pathway manager needs to select twonumbers: the monitoring fraction (MF) and the clearance number (CN). These numbers have astraightforward interpretation:
MF controls how often the pathway is monitored. Higher values of MF are more expensive butmake the sampling more sensitive to changes in the underlying contamination rate. Lowervalues of MF represent a lower burden on compliant pathways.
CN controls how many successive uncontaminated consignments must be inspected before apathway can be deemed ‘clean’. Higher values of CN are associated with greater conser-vatism in terms of pathways demonstrating that they are compliant before being shiftedto monitoring.
34
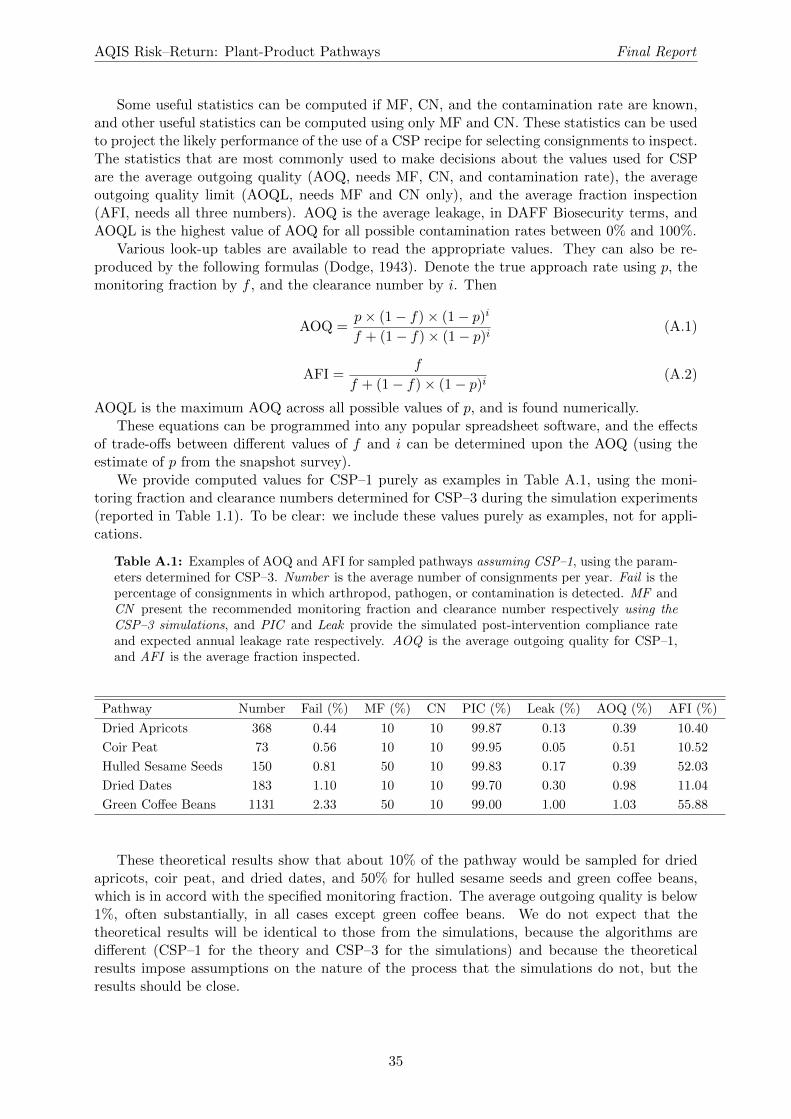
AQIS Risk–Return: Plant-Product Pathways Final Report
Some useful statistics can be computed if MF, CN, and the contamination rate are known,and other useful statistics can be computed using only MF and CN. These statistics can be usedto project the likely performance of the use of a CSP recipe for selecting consignments to inspect.The statistics that are most commonly used to make decisions about the values used for CSPare the average outgoing quality (AOQ, needs MF, CN, and contamination rate), the averageoutgoing quality limit (AOQL, needs MF and CN only), and the average fraction inspection(AFI, needs all three numbers). AOQ is the average leakage, in DAFF Biosecurity terms, andAOQL is the highest value of AOQ for all possible contamination rates between 0% and 100%.
Various look-up tables are available to read the appropriate values. They can also be re-produced by the following formulas (Dodge, 1943). Denote the true approach rate using p, themonitoring fraction by f , and the clearance number by i. Then
AOQ =p× (1 − f) × (1 − p)i
f + (1 − f) × (1 − p)i(A.1)
AFI =f
f + (1 − f) × (1 − p)i(A.2)
AOQL is the maximum AOQ across all possible values of p, and is found numerically.These equations can be programmed into any popular spreadsheet software, and the effects
of trade-offs between different values of f and i can be determined upon the AOQ (using theestimate of p from the snapshot survey).
We provide computed values for CSP–1 purely as examples in Table A.1, using the moni-toring fraction and clearance numbers determined for CSP–3 during the simulation experiments(reported in Table 1.1). To be clear: we include these values purely as examples, not for appli-cations.
Table A.1: Examples of AOQ and AFI for sampled pathways assuming CSP–1, using the param-eters determined for CSP–3. Number is the average number of consignments per year. Fail is thepercentage of consignments in which arthropod, pathogen, or contamination is detected. MF andCN present the recommended monitoring fraction and clearance number respectively using theCSP–3 simulations, and PIC and Leak provide the simulated post-intervention compliance rateand expected annual leakage rate respectively. AOQ is the average outgoing quality for CSP–1,and AFI is the average fraction inspected.
Pathway Number Fail (%) MF (%) CN PIC (%) Leak (%) AOQ (%) AFI (%)
Dried Apricots 368 0.44 10 10 99.87 0.13 0.39 10.40
Coir Peat 73 0.56 10 10 99.95 0.05 0.51 10.52
Hulled Sesame Seeds 150 0.81 50 10 99.83 0.17 0.39 52.03
Dried Dates 183 1.10 10 10 99.70 0.30 0.98 11.04
Green Coffee Beans 1131 2.33 50 10 99.00 1.00 1.03 55.88
These theoretical results show that about 10% of the pathway would be sampled for driedapricots, coir peat, and dried dates, and 50% for hulled sesame seeds and green coffee beans,which is in accord with the specified monitoring fraction. The average outgoing quality is below1%, often substantially, in all cases except green coffee beans. We do not expect that thetheoretical results will be identical to those from the simulations, because the algorithms aredifferent (CSP–1 for the theory and CSP–3 for the simulations) and because the theoreticalresults impose assumptions on the nature of the process that the simulations do not, but theresults should be close.
35
AQIS Risk–Return: Plant-Product Pathways Final Report
A.2 CSP Without Data
If the pathway manager prefers to start a surveillance regime directly, then it is possible to startthe CSP sampling algorithms from scratch. For a pathway for which nothing is known it seemssensible to start with the most conservative option: CSP–1. We advocate the use of AOQL, ora range-limited version (eg. constrain the range to be between 0% and 10% instead of 0% and100%) to set the appropriate CN and MF. The trade-off between CN and MF can then be madebased on operational considerations, as noted above.
36
Appendix B
Leakage Survey Sample Size
We want to estimate how many samples are needed to estimate the effectiveness to the desiredlevel of accuracy. To do this we need a “ball park” figure for some of the parameters. Wereproduce the approximate sample size formula from Cannon (2003). The needed sample size isapproximated by
n ≈ z2E2(1 − E)(1 − a)
w2 × a(B.1)
where
• n is the needed sample size,
• z is the normal two-sided quantile (1.96 for 95% CI),
• w is the desired width of confidence limits,
• E is a preliminary guess at the actual effectiveness, and
• a is an estimate of the approach rate.
For example, assume the following values: we wish for a confidence interval of ±0.1 foreffectiveness, we think that the effectiveness is about 0.8, and that the approach rate is 0.05.Then
n ≈ 1.962 × 0.82 × (1 − 0.8) × (1 − 0.05)
0.12 × 0.05= 934.3 (B.2)
37
Appendix C
Post-Intervention Compliance (PIC)
Here we provide a brief summary of how to compute the PIC performance indicator as used inthis report. For more details and other variations, see Robinson et al. (2011).
The calculation is based on division of the items in the pathway into two strata: enhancedinspection and monitored. We estimate the number of missed consignments for each stratumand then sum them to obtain the overall count, which is used to compute the PIC.
We define, for each stratum,
v as the volume of the pathway (number of intervention units),
i as the number of units actually inspected,
b as the number of inspected units that contain biosecurity risk material (BRM) (not includingthose found by the leakage survey),
n as the number of units inspected in the leakage survey,
y as the number of units inspected in the leakage survey that are not compliant,
l as the estimated leakage count of units that were inspected,
L as the estimated pathway-level leakage count,
a as the approach count, and
e as the inspection effectiveness, defined as the proportion of non-conforming units detectedamong all those non-conforming units that are inspected.
The post-intervention compliance (PIC) is calculated as
PIC =v − L
v(C.1)
If a leakage survey had been done then we would estimate l = i × y/n and then estimatee = b/(b + l). In the absence of a leakage survey, we have assumed that inspection effectivenesse is known, and the same for each stratum. Given e, the inspection-level leakage l is
l =b
e− b = b×
(1
e− 1
)(C.2)
Then, the estimated approach count for each stratum (monitored: k = 1, enhanced inspection:k = 2) is
ak =bke
× vkik
(C.3)
where v2 = i2 for the enhanced inspection stratum, and i1 < v1 for the sampled stratum. Then
Lk = ak − bk = bk ×(
vkik × e
− 1
)(C.4)
38
AQIS Risk–Return: Plant-Product Pathways Final Report
and
L =∑h
Lk (C.5)
The final step is then to compute the quantity in equation (C.1).Note that for these simulation experiments, we assume that the effectiveness is 0.9, so l =
0.11 × b, and
Lk = bk ×(
vkik × 0.9
− 1
)(C.6)
39
Appendix D
Other Case Studies
D.1 Baby Corn
For this analysis, ‘baby corn’ refers to immature, fresh Zea mays consignments imported forhuman consumption. The baby corn pathway has a relatively low failure rate. However, thepathway does not show evidence of being a good match for the supplier-specific sampling pre-scriptions that have been recommended for other imported-plant product pathways. The reasonis that the pathway is dominated by one country and a small number of suppliers, all of whomhave evidence of recent quarantine contamination. Therefore, there is no evidence that targetingthe sub-pathways will provide better pathway compliance than random sampling. We speculatethat using supplier-specific targeting may result in behavioural changes that improve the path-way compliance, and coupled with the already low failure rate, this speculation may provideenough motivation to test supplier targeting for this pathway.
D.1.1 Import Conditions
Baby corn is considered a quarantine risk to Australia because fresh produce and/or the cartonsthat they are packaged in may contain plant material other than the permitted commodity, andother contaminants such as straw packaging, soil, insects, arthropod eggs, disease symptoms orseeds. These contaminants also have the potential to harbour microorganisms or fungi, whichcould have a significant impact if introduced into Australia.
Fresh baby corn is only permitted entry into Australia if accompanied by a valid import per-mit, granted under the condition that all consignments are immature corn only. A phytosanitarycertificate is also required for all consignments.
Prior to entry into Australia, all consignments must pass an AQIS quarantine inspection toverify that the baby corn is free from live insects and other quarantine risk material (QRM).A sample of 600 individual cobs is selected from a random number of punnets within eachconsignment and individually inspected for the presence of insects, pests, disease, soil, and othercontamination such as weed seeds and plant trash. 60 fruit from the sample is examined furtherunder higher magnification.
D.1.2 Pathway Summary
A flowchart of the pathway is presented in Figure D.1.
D.1.3 Analysis
The full dataset comprises 1990 consignments with record creation dates ranging from October2005 to December 2010, and comprises entries from 6 countries and 57 suppliers.
40
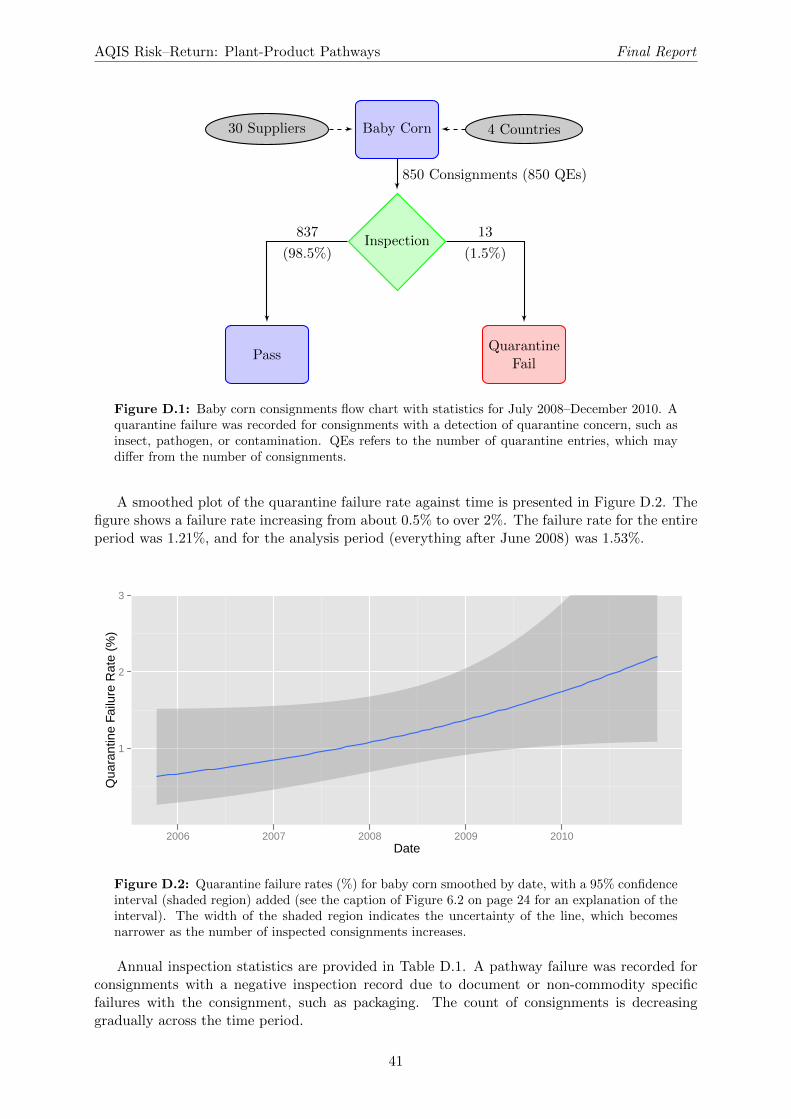
AQIS Risk–Return: Plant-Product Pathways Final Report
30 Suppliers Baby Corn 4 Countries
Inspection
PassQuarantine
Fail
850 Consignments (850 QEs)
837
(98.5%)
13
(1.5%)
Figure D.1: Baby corn consignments flow chart with statistics for July 2008–December 2010. Aquarantine failure was recorded for consignments with a detection of quarantine concern, such asinsect, pathogen, or contamination. QEs refers to the number of quarantine entries, which maydiffer from the number of consignments.
A smoothed plot of the quarantine failure rate against time is presented in Figure D.2. Thefigure shows a failure rate increasing from about 0.5% to over 2%. The failure rate for the entireperiod was 1.21%, and for the analysis period (everything after June 2008) was 1.53%.
1
2
3
2006 2007 2008 2009 2010Date
Qua
rant
ine
Failu
re R
ate
(%)
Figure D.2: Quarantine failure rates (%) for baby corn smoothed by date, with a 95% confidenceinterval (shaded region) added (see the caption of Figure 6.2 on page 24 for an explanation of theinterval). The width of the shaded region indicates the uncertainty of the line, which becomesnarrower as the number of inspected consignments increases.
Annual inspection statistics are provided in Table D.1. A pathway failure was recorded forconsignments with a negative inspection record due to document or non-commodity specificfailures with the consignment, such as packaging. The count of consignments is decreasinggradually across the time period.
41
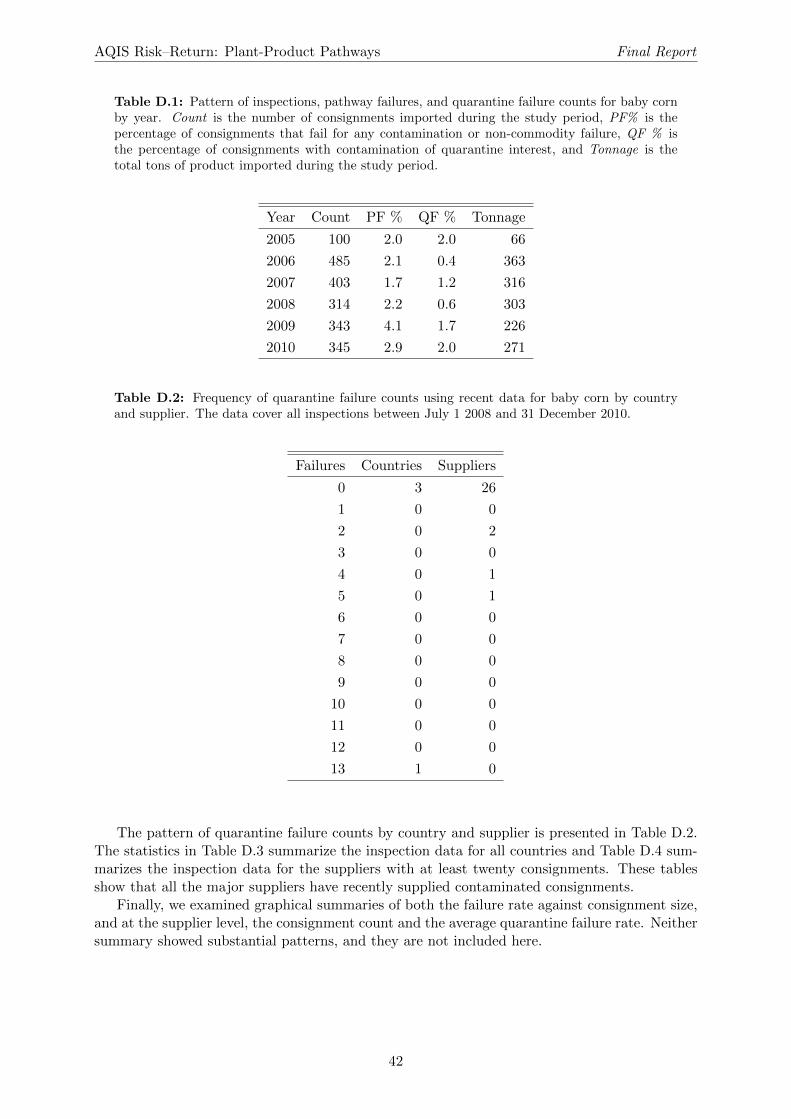
AQIS Risk–Return: Plant-Product Pathways Final Report
Table D.1: Pattern of inspections, pathway failures, and quarantine failure counts for baby cornby year. Count is the number of consignments imported during the study period, PF% is thepercentage of consignments that fail for any contamination or non-commodity failure, QF % isthe percentage of consignments with contamination of quarantine interest, and Tonnage is thetotal tons of product imported during the study period.
Year Count PF % QF % Tonnage
2005 100 2.0 2.0 66
2006 485 2.1 0.4 363
2007 403 1.7 1.2 316
2008 314 2.2 0.6 303
2009 343 4.1 1.7 226
2010 345 2.9 2.0 271
Table D.2: Frequency of quarantine failure counts using recent data for baby corn by countryand supplier. The data cover all inspections between July 1 2008 and 31 December 2010.
Failures Countries Suppliers
0 3 26
1 0 0
2 0 2
3 0 0
4 0 1
5 0 1
6 0 0
7 0 0
8 0 0
9 0 0
10 0 0
11 0 0
12 0 0
13 1 0
The pattern of quarantine failure counts by country and supplier is presented in Table D.2.The statistics in Table D.3 summarize the inspection data for all countries and Table D.4 sum-marizes the inspection data for the suppliers with at least twenty consignments. These tablesshow that all the major suppliers have recently supplied contaminated consignments.
Finally, we examined graphical summaries of both the failure rate against consignment size,and at the supplier level, the consignment count and the average quarantine failure rate. Neithersummary showed substantial patterns, and they are not included here.
42
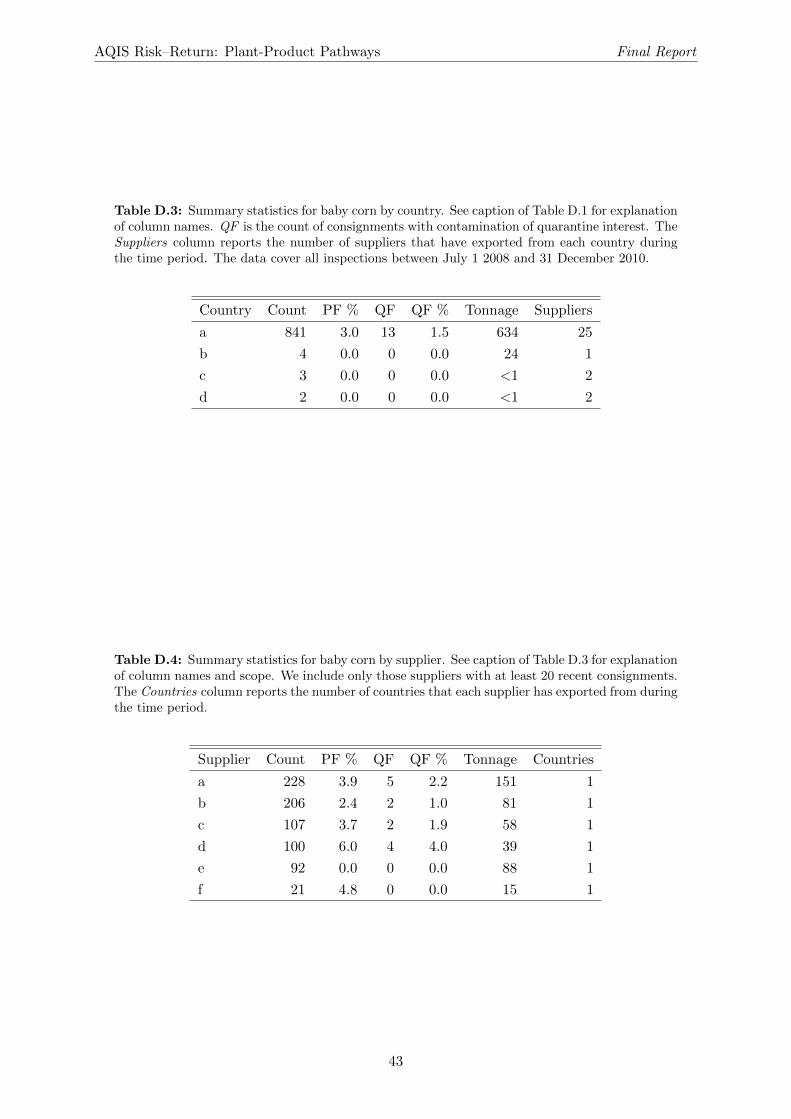
AQIS Risk–Return: Plant-Product Pathways Final Report
Table D.3: Summary statistics for baby corn by country. See caption of Table D.1 for explanationof column names. QF is the count of consignments with contamination of quarantine interest. TheSuppliers column reports the number of suppliers that have exported from each country duringthe time period. The data cover all inspections between July 1 2008 and 31 December 2010.
Country Count PF % QF QF % Tonnage Suppliers
a 841 3.0 13 1.5 634 25
b 4 0.0 0 0.0 24 1
c 3 0.0 0 0.0 <1 2
d 2 0.0 0 0.0 <1 2
Table D.4: Summary statistics for baby corn by supplier. See caption of Table D.3 for explanationof column names and scope. We include only those suppliers with at least 20 recent consignments.The Countries column reports the number of countries that each supplier has exported from duringthe time period.
Supplier Count PF % QF QF % Tonnage Countries
a 228 3.9 5 2.2 151 1
b 206 2.4 2 1.0 81 1
c 107 3.7 2 1.9 58 1
d 100 6.0 4 4.0 39 1
e 92 0.0 0 0.0 88 1
f 21 4.8 0 0.0 15 1
43
AQIS Risk–Return: Plant-Product Pathways Final Report
D.1.4 Simulation Results
The results are presented in Figures D.3 and D.4. Figure D.3 provides the average simulatedpost-intervention compliance as a function of inspection strategy and total inspection count fora range of options. The x-axis is the amount of effort, and less is preferred. The y-axis is thePIC, and higher is preferred. The grey line shows the expected PIC (or leakage) for randommonitoring, and may be used as a baseline to assess the improvement resulting from selecting aCSP strategy.
We note the following points, and emphasize that these points are relevant only to thesimulated inspection of baby corn based on existing data.
• None of the three CSP regimes improve upon random sampling, in that the average PICreturns are all close to or below the grey line.
• The difference between the different CSP strategies is minimal. However, of the threeCSP regimes, CSP–3 seems to provide the best conceptual match with the pathway man-ager’s goals of targeting compliance with reduced inspection rewards, while not allowingunnecessary leakage, or over penalizing random spikes in non-compliance.
• The monitoring fraction has a clear effect on the compliance, but the effect of changingthe clearance number seems minimal.
• Stratifying by supplier or country seems to lead to no improvement at all.
Figure D.4 provides leakage count profiles for all the simulations. It can be used as analternative means for interpreting the above reasoning.
44
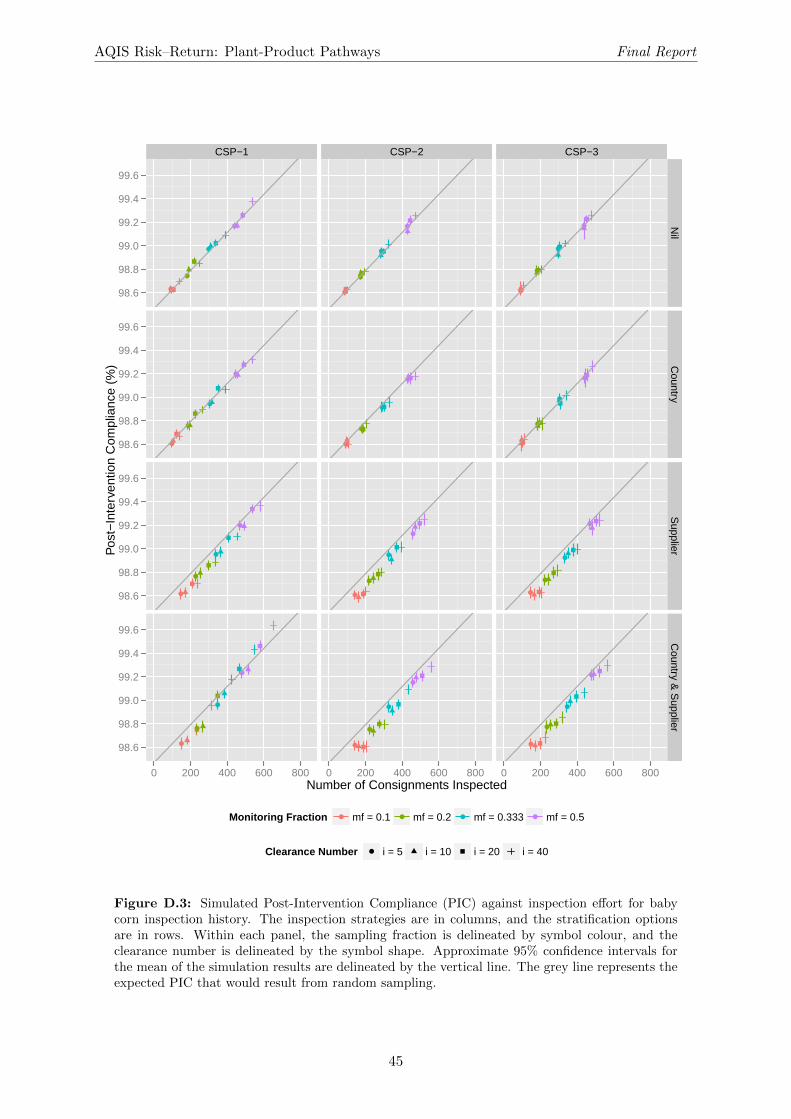
AQIS Risk–Return: Plant-Product Pathways Final Report
CSP−1 CSP−2 CSP−3
98.6
98.8
99.0
99.2
99.4
99.6
98.6
98.8
99.0
99.2
99.4
99.6
98.6
98.8
99.0
99.2
99.4
99.6
98.6
98.8
99.0
99.2
99.4
99.6
●
●
●
●
●
●
●
●
●
●
●
●
●
●
●
●
●
●
●
●
●
●
●
●
●
●
●
●
●
●
●
●
●
●
●
●
●
●
●
●
●
●
●
●
●
●
●
●
Nil
Country
Supplier
Country &
Supplier
0 200 400 600 800 0 200 400 600 800 0 200 400 600 800Number of Consignments Inspected
Pos
t−In
terv
entio
n C
ompl
ianc
e (%
)
Monitoring Fraction ● ● ● ●mf = 0.1 mf = 0.2 mf = 0.333 mf = 0.5
Clearance Number ● i = 5 i = 10 i = 20 i = 40
Figure D.3: Simulated Post-Intervention Compliance (PIC) against inspection effort for babycorn inspection history. The inspection strategies are in columns, and the stratification optionsare in rows. Within each panel, the sampling fraction is delineated by symbol colour, and theclearance number is delineated by the symbol shape. Approximate 95% confidence intervals forthe mean of the simulation results are delineated by the vertical line. The grey line represents theexpected PIC that would result from random sampling.
45
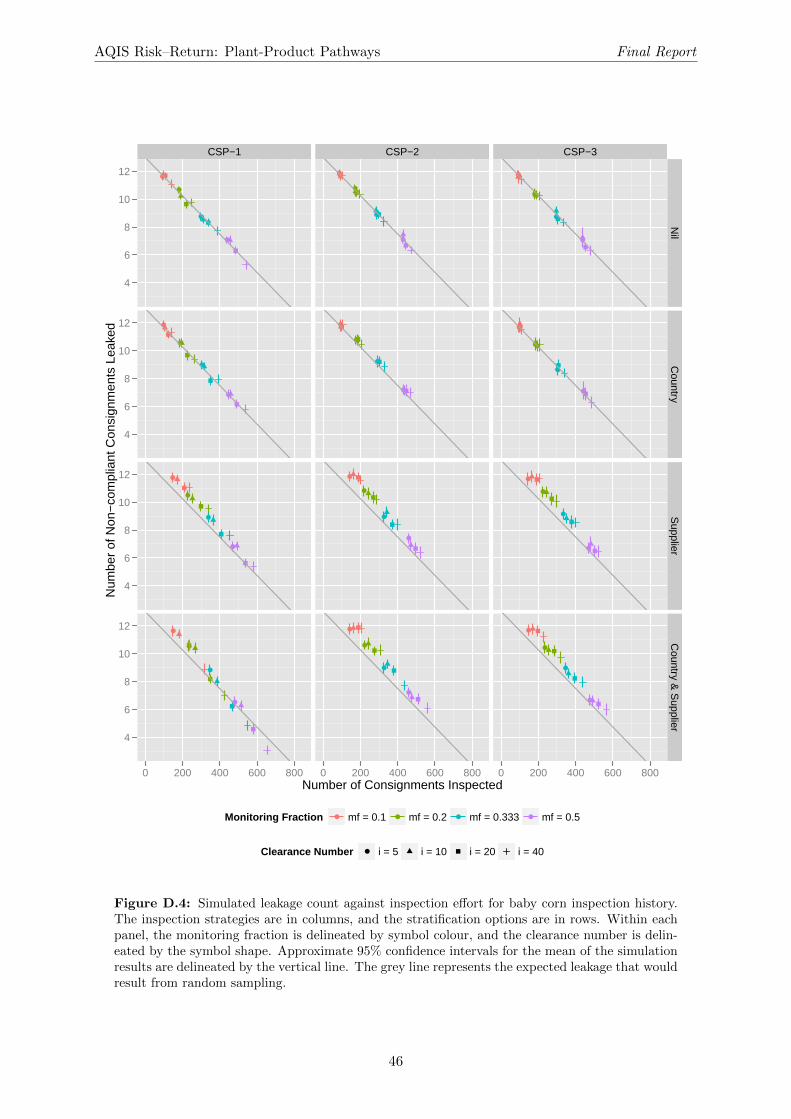
AQIS Risk–Return: Plant-Product Pathways Final Report
CSP−1 CSP−2 CSP−3
4
6
8
10
12
4
6
8
10
12
4
6
8
10
12
4
6
8
10
12
●
●
●
●
●
●
●
●
●
●
●
●
●
●
●
●
●
●
●
●
●
●
●
●
●
●
●
●
●
●
●
●
●
●
●
●
●
●
●
●
●
●
●
●
●
●
●
●
Nil
Country
Supplier
Country &
Supplier
0 200 400 600 800 0 200 400 600 800 0 200 400 600 800Number of Consignments Inspected
Num
ber
of N
on−
com
plia
nt C
onsi
gnm
ents
Lea
ked
Monitoring Fraction ● ● ● ●mf = 0.1 mf = 0.2 mf = 0.333 mf = 0.5
Clearance Number ● i = 5 i = 10 i = 20 i = 40
Figure D.4: Simulated leakage count against inspection effort for baby corn inspection history.The inspection strategies are in columns, and the stratification options are in rows. Within eachpanel, the monitoring fraction is delineated by symbol colour, and the clearance number is delin-eated by the symbol shape. Approximate 95% confidence intervals for the mean of the simulationresults are delineated by the vertical line. The grey line represents the expected leakage that wouldresult from random sampling.
46
AQIS Risk–Return: Plant-Product Pathways Final Report
D.2 Blueberries exported from Country A
For this analysis, ‘blueberries’ refers to fresh Vaccinium corymbosum or Vaccinium angustifoliumimported from Country A for human consumption. Based on the 5.5 years of inspection data,this pathway has a high historical failure rate compared with the other pathways in this project.Also, the failures were mainly among the high-volume suppliers. Based on the results herein,and depending on the inherent biological risk associated with the pathway, it may be defensibleto retain 100% inspection in this pathway. The historical trend suggests that the failure rateis decreasing (see Figure D.6 and Table D.5). A reduced inspection regime is not advocated bythis analysis, however the decreasing failure rate indicates that the pathway may be suitable forrisk–return pathway management in the future.
D.2.1 Import Conditions
Blueberries are considered a quarantine risk to Australia because fresh produce consignments,and/or the cartons that they are packaged in, can contain unidentified plant material, prohibitedseeds and other contaminants such as straw packaging, soil, pupae, or insect pests. Thesecontaminants also have the potential to harbour microorganisms or fungi, which could have asignificant impact if introduced into Australia.
Blueberries are only permitted entry into Australia if accompanied by a valid import permit,granted under the condition that all produce is imported for the single end use only (i.e. humanconsumption). A phytosanitary certificate is also required.
Prior to entry into Australia, all consignments must pass an AQIS quarantine inspectionon arrival to verify that the blueberries are free from live insects and other quarantine riskmaterial (QRM). A sample of 600 fruits (individual berries) is selected at random from theentire consignment and individually inspected under a low magnification (10X) hand lens forthe presence of insects, pests, disease symptoms, soil, and other contamination, such as weedseeds and plant trash. 60 fruit from the sample is examined further under high magnification(30X).
A formal Import Risk Analysis (IRA) has not been completed for blueberry imports, asthis is a long established trade, however, a risk determination has identified ‘Blueberry Rust’(Naohidemyces vaccinii = Pucciniastrum vaccinii) as a disease that affects blueberries and isnot present in a number of Australian states. An additional declaration is required on thephytosanitary certificate for consignments entering Western Australia, Victoria, and Tasmania,declaring freedom or treatment from Blueberry Rust.
D.2.2 Pathway Summary
A flowchart of the pathway is presented in Figure D.5.
D.2.3 Analysis
This section provides a statistical overview of the data. The full dataset comprises 1516 consign-ments with record creation dates ranging from October 2005 to February 2011, and comprisesentries from 1 country and 19 suppliers.
A smoothed plot of the quarantine failure rate against time is presented in Figure D.6. Asat 2011, it is approximately 2.8%. We note a jump in the rate of quarantine failures occurringaround 2010. The failure rate for the entire period was 10.36%, and for the analysis period(everything after June 2008) was 5.36%.
Annual inspection statistics are provided in Table D.5. The count of consignments increasesannually across the time period, and the tonnage nearly doubles in 2010, and is on track to stayequally high in 2011.
47
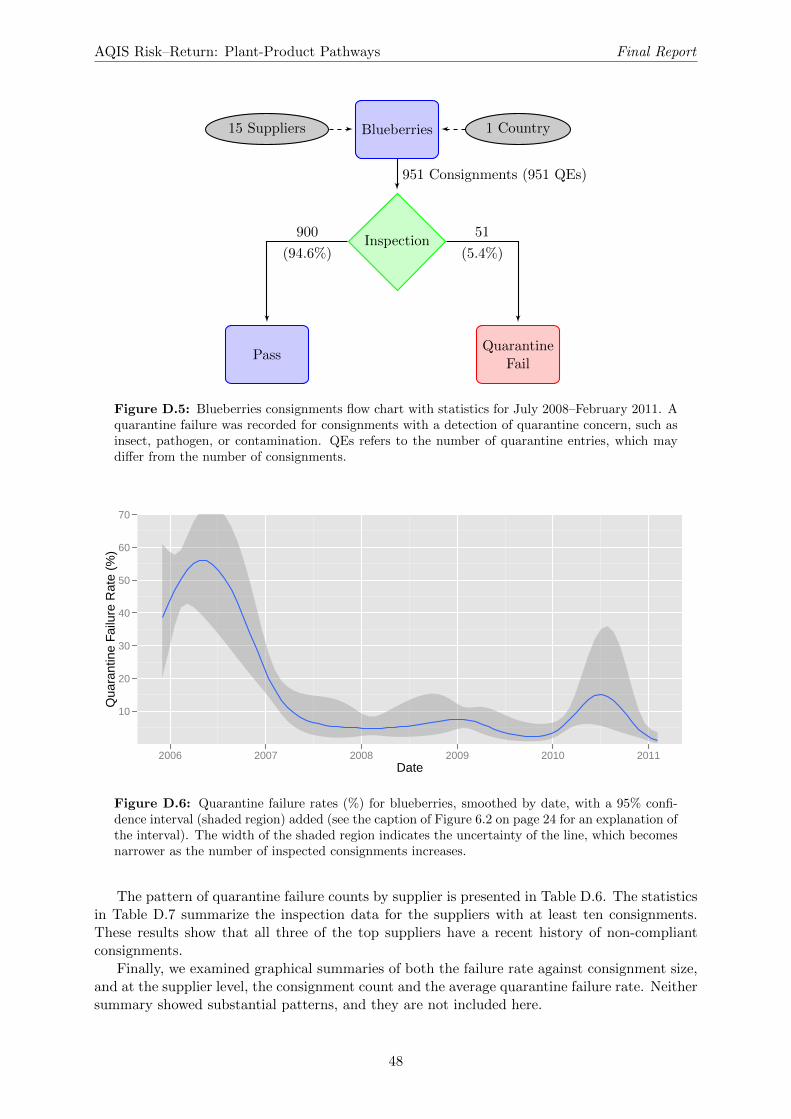
AQIS Risk–Return: Plant-Product Pathways Final Report
15 Suppliers Blueberries 1 Country
Inspection
PassQuarantine
Fail
951 Consignments (951 QEs)
900
(94.6%)
51
(5.4%)
Figure D.5: Blueberries consignments flow chart with statistics for July 2008–February 2011. Aquarantine failure was recorded for consignments with a detection of quarantine concern, such asinsect, pathogen, or contamination. QEs refers to the number of quarantine entries, which maydiffer from the number of consignments.
10
20
30
40
50
60
70
2006 2007 2008 2009 2010 2011Date
Qua
rant
ine
Failu
re R
ate
(%)
Figure D.6: Quarantine failure rates (%) for blueberries, smoothed by date, with a 95% confi-dence interval (shaded region) added (see the caption of Figure 6.2 on page 24 for an explanation ofthe interval). The width of the shaded region indicates the uncertainty of the line, which becomesnarrower as the number of inspected consignments increases.
The pattern of quarantine failure counts by supplier is presented in Table D.6. The statisticsin Table D.7 summarize the inspection data for the suppliers with at least ten consignments.These results show that all three of the top suppliers have a recent history of non-compliantconsignments.
Finally, we examined graphical summaries of both the failure rate against consignment size,and at the supplier level, the consignment count and the average quarantine failure rate. Neithersummary showed substantial patterns, and they are not included here.
48
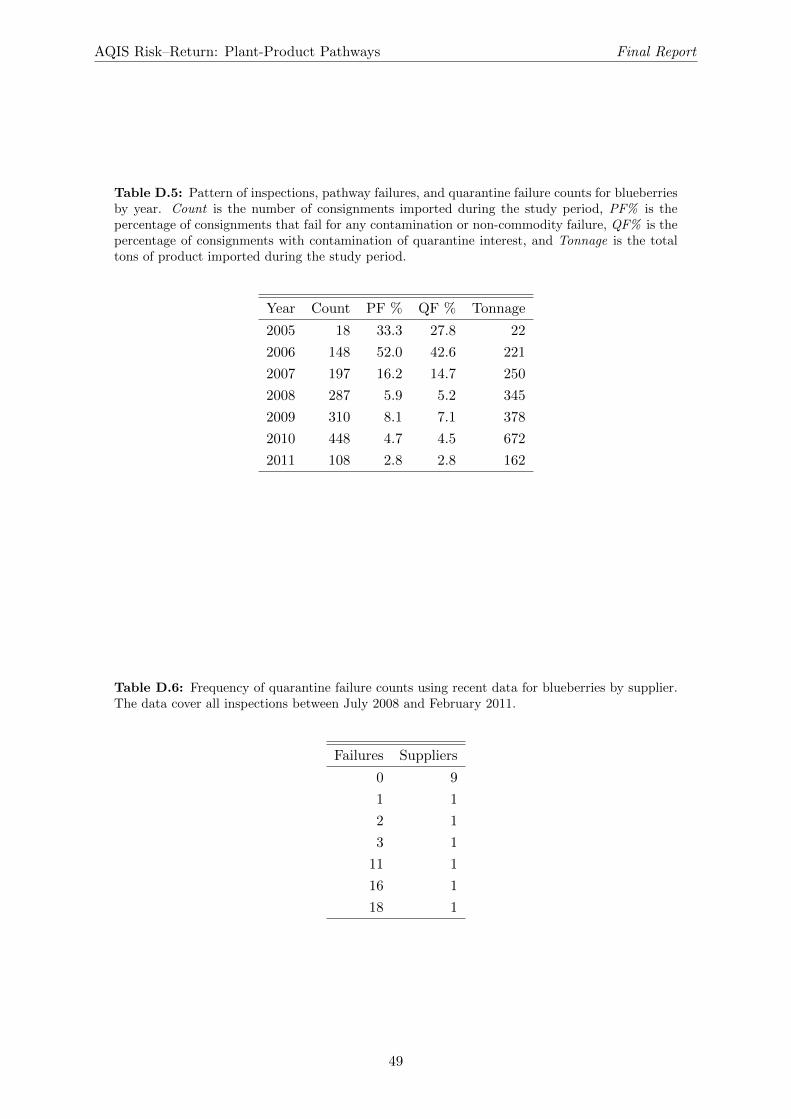
AQIS Risk–Return: Plant-Product Pathways Final Report
Table D.5: Pattern of inspections, pathway failures, and quarantine failure counts for blueberriesby year. Count is the number of consignments imported during the study period, PF% is thepercentage of consignments that fail for any contamination or non-commodity failure, QF% is thepercentage of consignments with contamination of quarantine interest, and Tonnage is the totaltons of product imported during the study period.
Year Count PF % QF % Tonnage
2005 18 33.3 27.8 22
2006 148 52.0 42.6 221
2007 197 16.2 14.7 250
2008 287 5.9 5.2 345
2009 310 8.1 7.1 378
2010 448 4.7 4.5 672
2011 108 2.8 2.8 162
Table D.6: Frequency of quarantine failure counts using recent data for blueberries by supplier.The data cover all inspections between July 2008 and February 2011.
Failures Suppliers
0 9
1 1
2 1
3 1
11 1
16 1
18 1
49
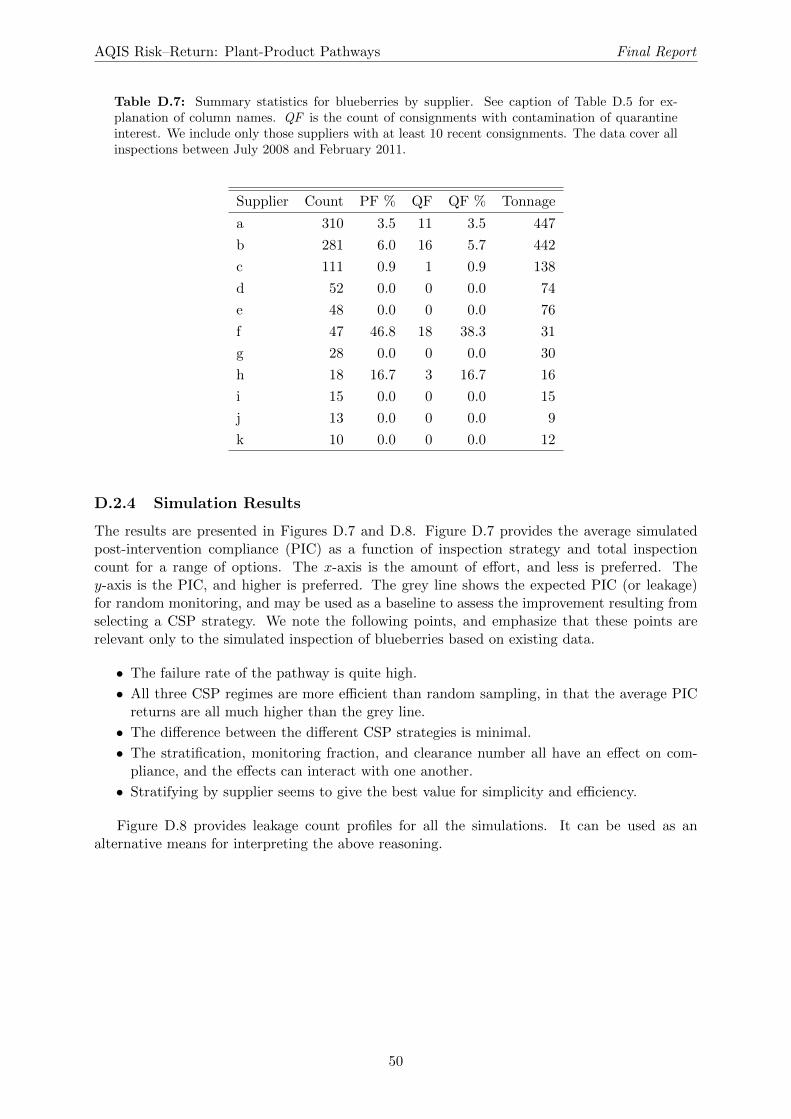
AQIS Risk–Return: Plant-Product Pathways Final Report
Table D.7: Summary statistics for blueberries by supplier. See caption of Table D.5 for ex-planation of column names. QF is the count of consignments with contamination of quarantineinterest. We include only those suppliers with at least 10 recent consignments. The data cover allinspections between July 2008 and February 2011.
Supplier Count PF % QF QF % Tonnage
a 310 3.5 11 3.5 447
b 281 6.0 16 5.7 442
c 111 0.9 1 0.9 138
d 52 0.0 0 0.0 74
e 48 0.0 0 0.0 76
f 47 46.8 18 38.3 31
g 28 0.0 0 0.0 30
h 18 16.7 3 16.7 16
i 15 0.0 0 0.0 15
j 13 0.0 0 0.0 9
k 10 0.0 0 0.0 12
D.2.4 Simulation Results
The results are presented in Figures D.7 and D.8. Figure D.7 provides the average simulatedpost-intervention compliance (PIC) as a function of inspection strategy and total inspectioncount for a range of options. The x-axis is the amount of effort, and less is preferred. They-axis is the PIC, and higher is preferred. The grey line shows the expected PIC (or leakage)for random monitoring, and may be used as a baseline to assess the improvement resulting fromselecting a CSP strategy. We note the following points, and emphasize that these points arerelevant only to the simulated inspection of blueberries based on existing data.
• The failure rate of the pathway is quite high.
• All three CSP regimes are more efficient than random sampling, in that the average PICreturns are all much higher than the grey line.
• The difference between the different CSP strategies is minimal.
• The stratification, monitoring fraction, and clearance number all have an effect on com-pliance, and the effects can interact with one another.
• Stratifying by supplier seems to give the best value for simplicity and efficiency.
Figure D.8 provides leakage count profiles for all the simulations. It can be used as analternative means for interpreting the above reasoning.
50
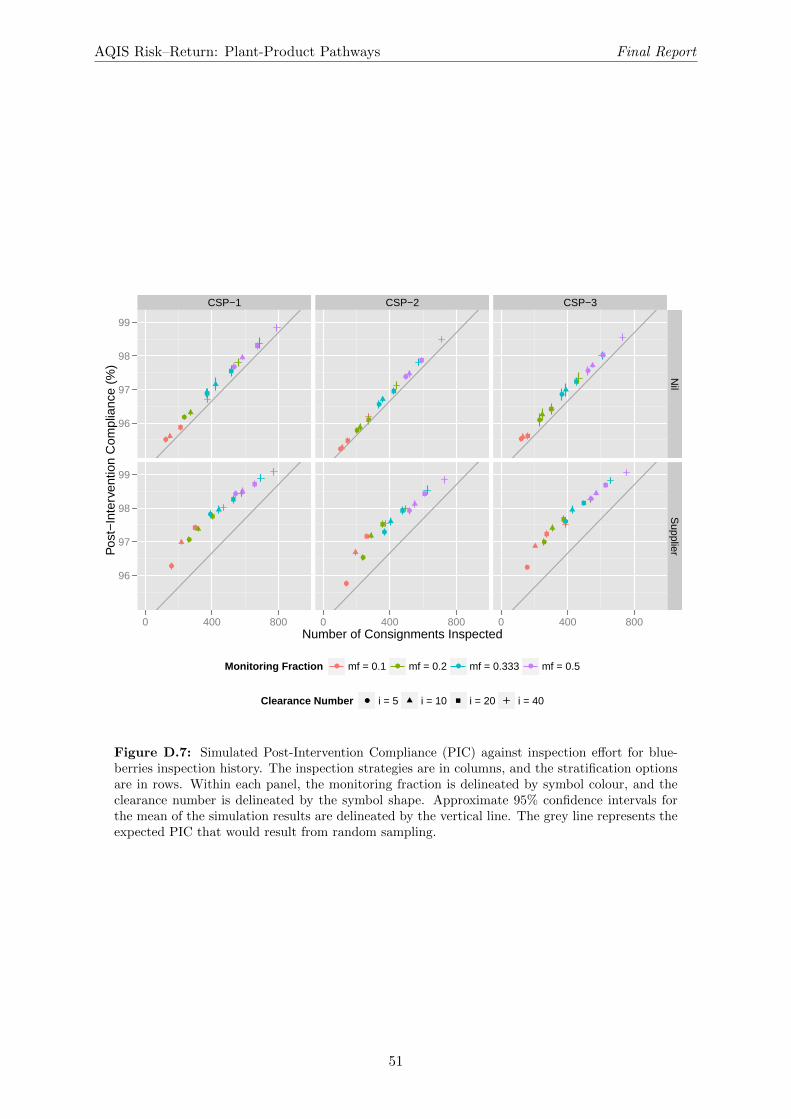
AQIS Risk–Return: Plant-Product Pathways Final Report
CSP−1 CSP−2 CSP−3
96
97
98
99
96
97
98
99
●
●
●
●
●
●
●
●
●
●
●
●
●
●
●
●
●
●
●
●
●
●
●
●
Nil
Supplier
0 400 800 0 400 800 0 400 800Number of Consignments Inspected
Pos
t−In
terv
entio
n C
ompl
ianc
e (%
)
Monitoring Fraction ● ● ● ●mf = 0.1 mf = 0.2 mf = 0.333 mf = 0.5
Clearance Number ● i = 5 i = 10 i = 20 i = 40
Figure D.7: Simulated Post-Intervention Compliance (PIC) against inspection effort for blue-berries inspection history. The inspection strategies are in columns, and the stratification optionsare in rows. Within each panel, the monitoring fraction is delineated by symbol colour, and theclearance number is delineated by the symbol shape. Approximate 95% confidence intervals forthe mean of the simulation results are delineated by the vertical line. The grey line represents theexpected PIC that would result from random sampling.
51
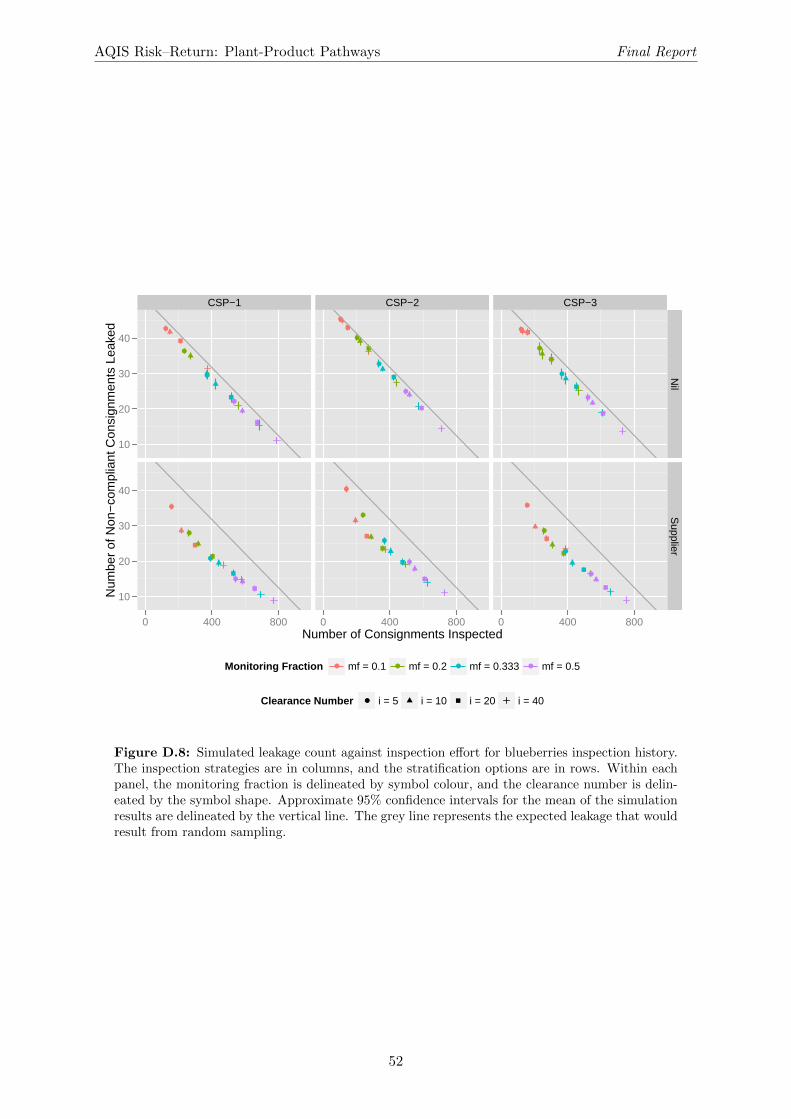
AQIS Risk–Return: Plant-Product Pathways Final Report
CSP−1 CSP−2 CSP−3
10
20
30
40
10
20
30
40
●
●
●
●
●
●
●
●
●
●
●
●
●
●
●
●
●
●
●
●
●
●
●
●
Nil
Supplier
0 400 800 0 400 800 0 400 800Number of Consignments Inspected
Num
ber
of N
on−
com
plia
nt C
onsi
gnm
ents
Lea
ked
Monitoring Fraction ● ● ● ●mf = 0.1 mf = 0.2 mf = 0.333 mf = 0.5
Clearance Number ● i = 5 i = 10 i = 20 i = 40
Figure D.8: Simulated leakage count against inspection effort for blueberries inspection history.The inspection strategies are in columns, and the stratification options are in rows. Within eachpanel, the monitoring fraction is delineated by symbol colour, and the clearance number is delin-eated by the symbol shape. Approximate 95% confidence intervals for the mean of the simulationresults are delineated by the vertical line. The grey line represents the expected leakage that wouldresult from random sampling.
52
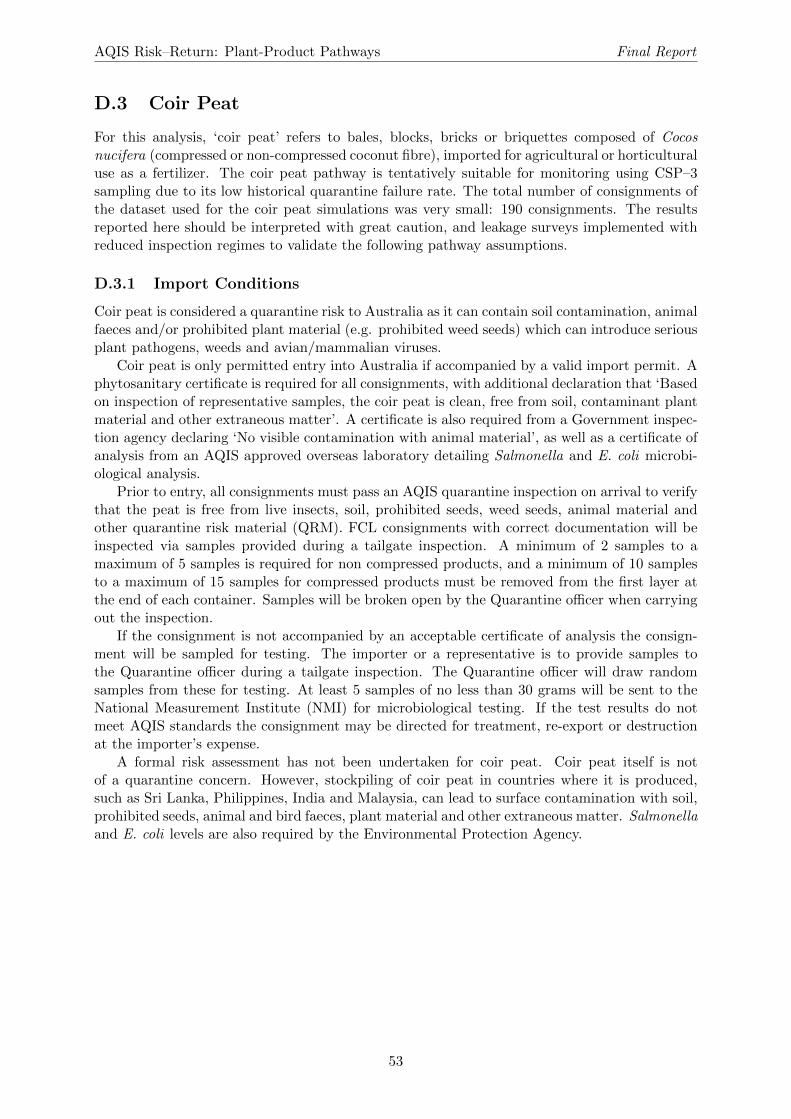
AQIS Risk–Return: Plant-Product Pathways Final Report
D.3 Coir Peat
For this analysis, ‘coir peat’ refers to bales, blocks, bricks or briquettes composed of Cocosnucifera (compressed or non-compressed coconut fibre), imported for agricultural or horticulturaluse as a fertilizer. The coir peat pathway is tentatively suitable for monitoring using CSP–3sampling due to its low historical quarantine failure rate. The total number of consignments ofthe dataset used for the coir peat simulations was very small: 190 consignments. The resultsreported here should be interpreted with great caution, and leakage surveys implemented withreduced inspection regimes to validate the following pathway assumptions.
D.3.1 Import Conditions
Coir peat is considered a quarantine risk to Australia as it can contain soil contamination, animalfaeces and/or prohibited plant material (e.g. prohibited weed seeds) which can introduce seriousplant pathogens, weeds and avian/mammalian viruses.
Coir peat is only permitted entry into Australia if accompanied by a valid import permit. Aphytosanitary certificate is required for all consignments, with additional declaration that ‘Basedon inspection of representative samples, the coir peat is clean, free from soil, contaminant plantmaterial and other extraneous matter’. A certificate is also required from a Government inspec-tion agency declaring ‘No visible contamination with animal material’, as well as a certificate ofanalysis from an AQIS approved overseas laboratory detailing Salmonella and E. coli microbi-ological analysis.
Prior to entry, all consignments must pass an AQIS quarantine inspection on arrival to verifythat the peat is free from live insects, soil, prohibited seeds, weed seeds, animal material andother quarantine risk material (QRM). FCL consignments with correct documentation will beinspected via samples provided during a tailgate inspection. A minimum of 2 samples to amaximum of 5 samples is required for non compressed products, and a minimum of 10 samplesto a maximum of 15 samples for compressed products must be removed from the first layer atthe end of each container. Samples will be broken open by the Quarantine officer when carryingout the inspection.
If the consignment is not accompanied by an acceptable certificate of analysis the consign-ment will be sampled for testing. The importer or a representative is to provide samples tothe Quarantine officer during a tailgate inspection. The Quarantine officer will draw randomsamples from these for testing. At least 5 samples of no less than 30 grams will be sent to theNational Measurement Institute (NMI) for microbiological testing. If the test results do notmeet AQIS standards the consignment may be directed for treatment, re-export or destructionat the importer’s expense.
A formal risk assessment has not been undertaken for coir peat. Coir peat itself is notof a quarantine concern. However, stockpiling of coir peat in countries where it is produced,such as Sri Lanka, Philippines, India and Malaysia, can lead to surface contamination with soil,prohibited seeds, animal and bird faeces, plant material and other extraneous matter. Salmonellaand E. coli levels are also required by the Environmental Protection Agency.
53
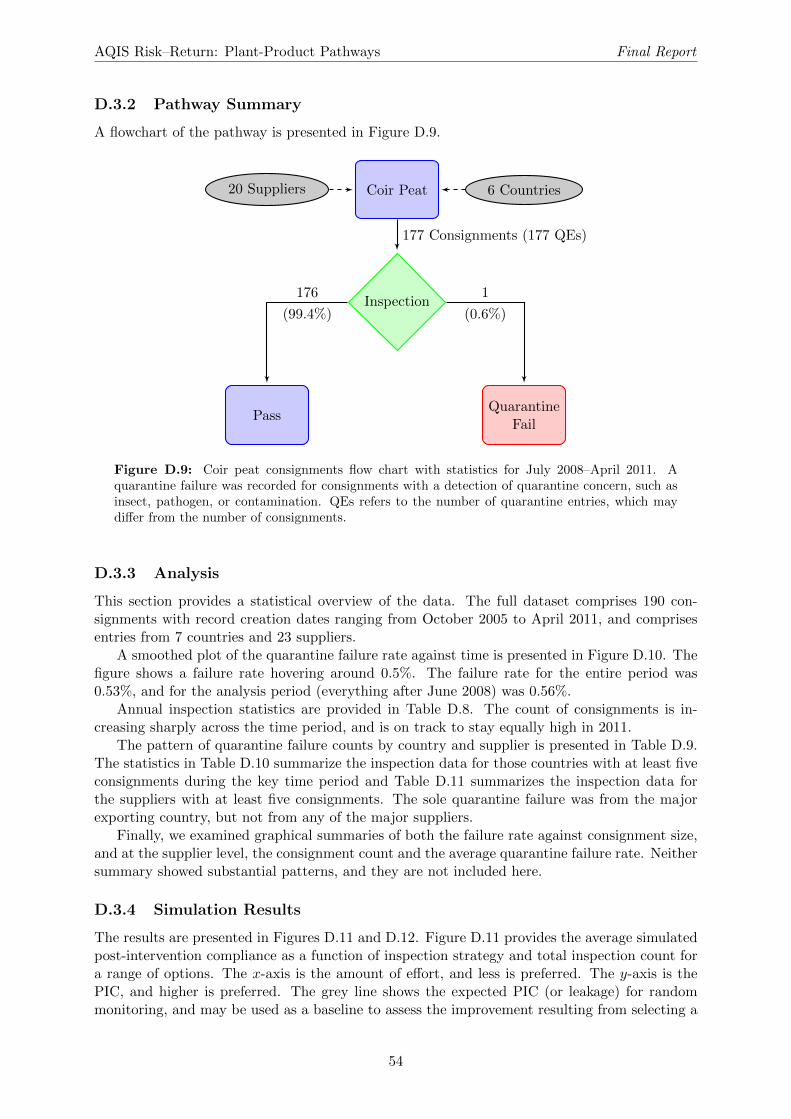
AQIS Risk–Return: Plant-Product Pathways Final Report
D.3.2 Pathway Summary
A flowchart of the pathway is presented in Figure D.9.
20 Suppliers Coir Peat 6 Countries
Inspection
PassQuarantine
Fail
177 Consignments (177 QEs)
176
(99.4%)
1
(0.6%)
Figure D.9: Coir peat consignments flow chart with statistics for July 2008–April 2011. Aquarantine failure was recorded for consignments with a detection of quarantine concern, such asinsect, pathogen, or contamination. QEs refers to the number of quarantine entries, which maydiffer from the number of consignments.
D.3.3 Analysis
This section provides a statistical overview of the data. The full dataset comprises 190 con-signments with record creation dates ranging from October 2005 to April 2011, and comprisesentries from 7 countries and 23 suppliers.
A smoothed plot of the quarantine failure rate against time is presented in Figure D.10. Thefigure shows a failure rate hovering around 0.5%. The failure rate for the entire period was0.53%, and for the analysis period (everything after June 2008) was 0.56%.
Annual inspection statistics are provided in Table D.8. The count of consignments is in-creasing sharply across the time period, and is on track to stay equally high in 2011.
The pattern of quarantine failure counts by country and supplier is presented in Table D.9.The statistics in Table D.10 summarize the inspection data for those countries with at least fiveconsignments during the key time period and Table D.11 summarizes the inspection data forthe suppliers with at least five consignments. The sole quarantine failure was from the majorexporting country, but not from any of the major suppliers.
Finally, we examined graphical summaries of both the failure rate against consignment size,and at the supplier level, the consignment count and the average quarantine failure rate. Neithersummary showed substantial patterns, and they are not included here.
D.3.4 Simulation Results
The results are presented in Figures D.11 and D.12. Figure D.11 provides the average simulatedpost-intervention compliance as a function of inspection strategy and total inspection count fora range of options. The x-axis is the amount of effort, and less is preferred. The y-axis is thePIC, and higher is preferred. The grey line shows the expected PIC (or leakage) for randommonitoring, and may be used as a baseline to assess the improvement resulting from selecting a
54
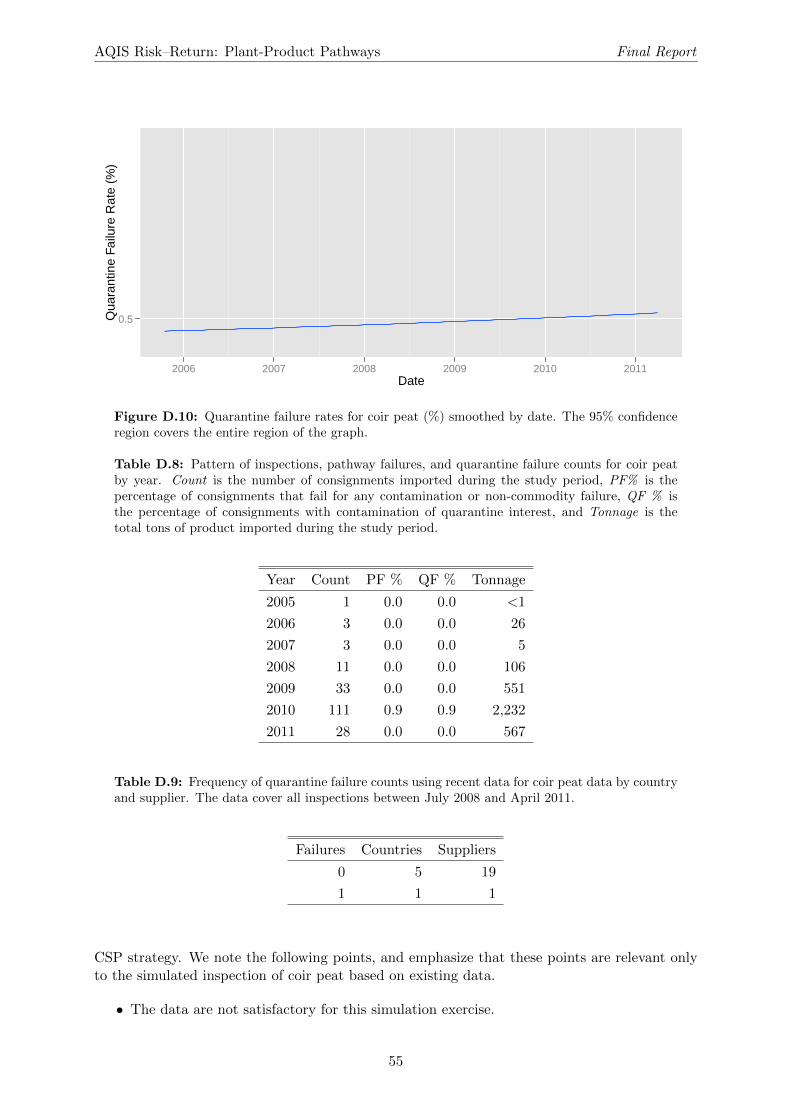
AQIS Risk–Return: Plant-Product Pathways Final Report
0.5
2006 2007 2008 2009 2010 2011Date
Qua
rant
ine
Failu
re R
ate
(%)
Figure D.10: Quarantine failure rates for coir peat (%) smoothed by date. The 95% confidenceregion covers the entire region of the graph.
Table D.8: Pattern of inspections, pathway failures, and quarantine failure counts for coir peatby year. Count is the number of consignments imported during the study period, PF% is thepercentage of consignments that fail for any contamination or non-commodity failure, QF % isthe percentage of consignments with contamination of quarantine interest, and Tonnage is thetotal tons of product imported during the study period.
Year Count PF % QF % Tonnage
2005 1 0.0 0.0 <1
2006 3 0.0 0.0 26
2007 3 0.0 0.0 5
2008 11 0.0 0.0 106
2009 33 0.0 0.0 551
2010 111 0.9 0.9 2,232
2011 28 0.0 0.0 567
Table D.9: Frequency of quarantine failure counts using recent data for coir peat data by countryand supplier. The data cover all inspections between July 2008 and April 2011.
Failures Countries Suppliers
0 5 19
1 1 1
CSP strategy. We note the following points, and emphasize that these points are relevant onlyto the simulated inspection of coir peat based on existing data.
• The data are not satisfactory for this simulation exercise.
55
AQIS Risk–Return: Plant-Product Pathways Final Report
Table D.10: Summary statistics for coir peat by country. See caption of Table D.8 for explanationof column names. QF is the count of consignments with contamination of quarantine interest. TheSuppliers column reports the number of suppliers that have exported from each country during thetime period. The data cover all inspections between July 2008 and April 2011. We only includethose countries with five or more consignments during the time period.
Country Count PF % QF QF % Tonnage Suppliers
a 133 0.8 1 0.8 2,639 12
b 30 0.0 0 0.0 609 7
c 8 0.0 0 0.0 139 1
Table D.11: Summary statistics for coir peat by supplier. See caption of Table D.10 for ex-planation of column names and scope. We include only those suppliers with at least 20 recentconsignments. The Countries column reports the number of countries that each supplier hasexported from during the time period.
Supplier Count PF % QF QF % Tonnage Countries
a 47 0.0 0 0.0 864 1
b 36 0.0 0 0.0 768 3
c 34 0.0 0 0.0 816 1
d 23 4.3 1 4.3 528 1
• All three CSP regimes can improve upon random sampling, in that the average PIC returnscan be higher than the grey line, depending on the stratification.
• The difference between the different CSP strategies is minimal. However, of the threeCSP regimes, CSP–3 seems to provide the best conceptual match with the pathway man-ager’s goals of targeting compliance with reduced inspection rewards, while not allowingunnecessary leakage, or over penalizing random spikes in non-compliance.
• The stratification, monitoring fraction, and clearance number all have an effect on theleakage, and the effects can interact with one another.
• Stratifying by supplier seems to give the best value for simplicity and efficiency
• Given CSP–3 and stratification by supplier, the best strategy seems to be to set themonitoring fraction to 10% and the clearance number to 10, in order to achieve a PIC of99.95%.
Figure D.12 provides leakage count profiles for all the simulations. It can be used as analternative means for interpreting the above reasoning.
56
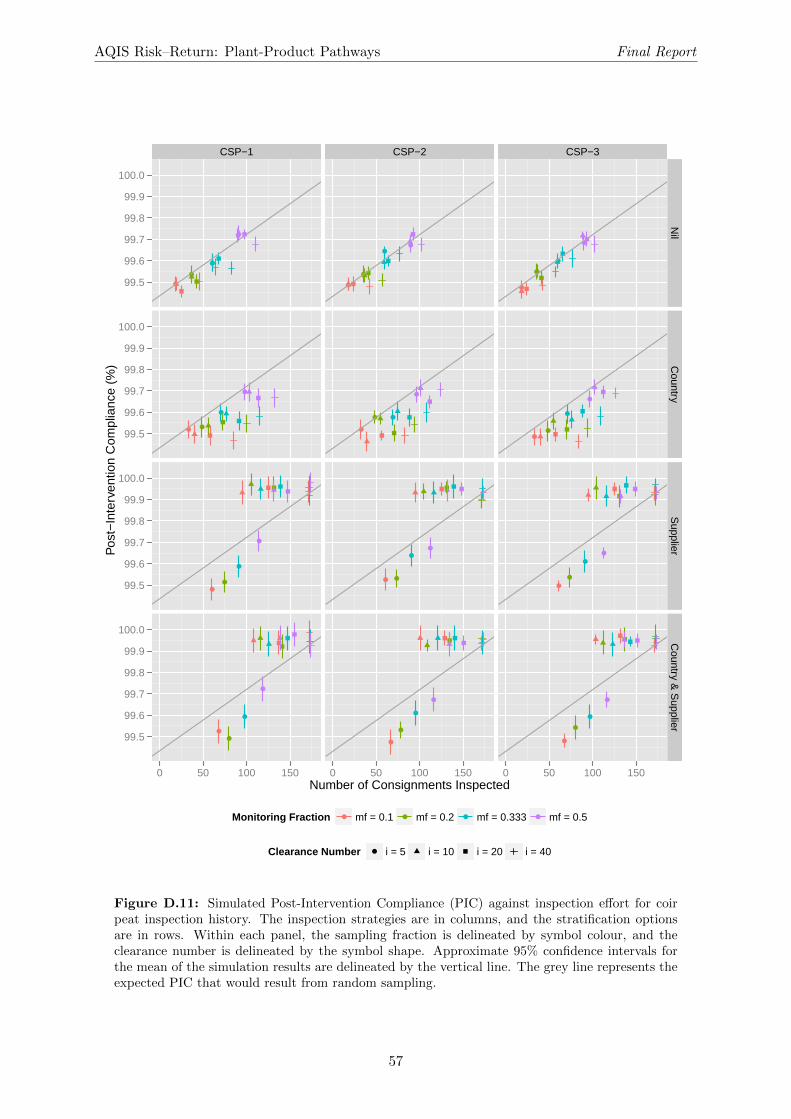
AQIS Risk–Return: Plant-Product Pathways Final Report
CSP−1 CSP−2 CSP−3
99.5
99.6
99.7
99.8
99.9
100.0
99.5
99.6
99.7
99.8
99.9
100.0
99.5
99.6
99.7
99.8
99.9
100.0
99.5
99.6
99.7
99.8
99.9
100.0
●
●
●
●
● ●
●
●
●●
●
●
●●
●
●
●
●
●●
●
● ●
●
● ●
●●
●
●
●
●
●
●
●
●
●●
●
●
●
●
●
●
●
●
●
●
Nil
Country
Supplier
Country &
Supplier
0 50 100 150 0 50 100 150 0 50 100 150Number of Consignments Inspected
Pos
t−In
terv
entio
n C
ompl
ianc
e (%
)
Monitoring Fraction ● ● ● ●mf = 0.1 mf = 0.2 mf = 0.333 mf = 0.5
Clearance Number ● i = 5 i = 10 i = 20 i = 40
Figure D.11: Simulated Post-Intervention Compliance (PIC) against inspection effort for coirpeat inspection history. The inspection strategies are in columns, and the stratification optionsare in rows. Within each panel, the sampling fraction is delineated by symbol colour, and theclearance number is delineated by the symbol shape. Approximate 95% confidence intervals forthe mean of the simulation results are delineated by the vertical line. The grey line represents theexpected PIC that would result from random sampling.
57
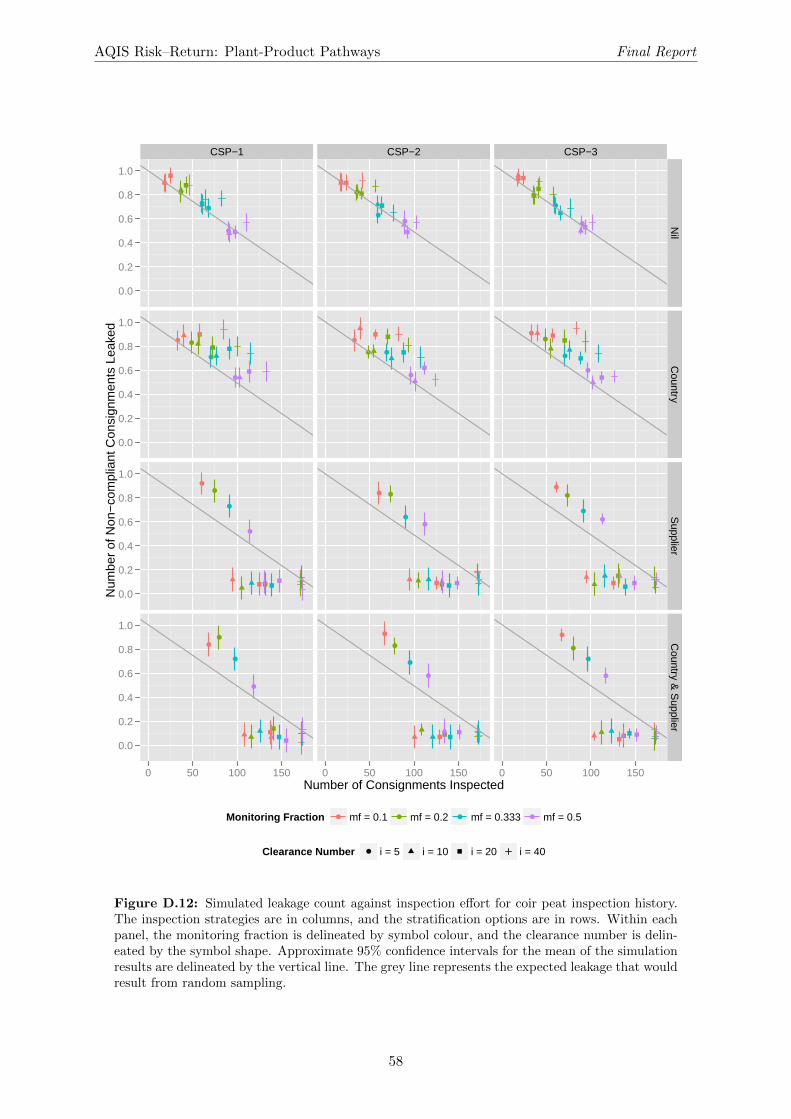
AQIS Risk–Return: Plant-Product Pathways Final Report
CSP−1 CSP−2 CSP−3
0.0
0.2
0.4
0.6
0.8
1.0
0.0
0.2
0.4
0.6
0.8
1.0
0.0
0.2
0.4
0.6
0.8
1.0
0.0
0.2
0.4
0.6
0.8
1.0
●
●
●
●
● ●
●
●
●●
●
●
●●
●
●
●
●
●●
●
● ●
●
● ●
●●
●
●
●
●
●
●
●
●
●●
●
●
●
●
●
●
●
●
●
●
Nil
Country
Supplier
Country &
Supplier
0 50 100 150 0 50 100 150 0 50 100 150Number of Consignments Inspected
Num
ber
of N
on−
com
plia
nt C
onsi
gnm
ents
Lea
ked
Monitoring Fraction ● ● ● ●mf = 0.1 mf = 0.2 mf = 0.333 mf = 0.5
Clearance Number ● i = 5 i = 10 i = 20 i = 40
Figure D.12: Simulated leakage count against inspection effort for coir peat inspection history.The inspection strategies are in columns, and the stratification options are in rows. Within eachpanel, the monitoring fraction is delineated by symbol colour, and the clearance number is delin-eated by the symbol shape. Approximate 95% confidence intervals for the mean of the simulationresults are delineated by the vertical line. The grey line represents the expected leakage that wouldresult from random sampling.
58
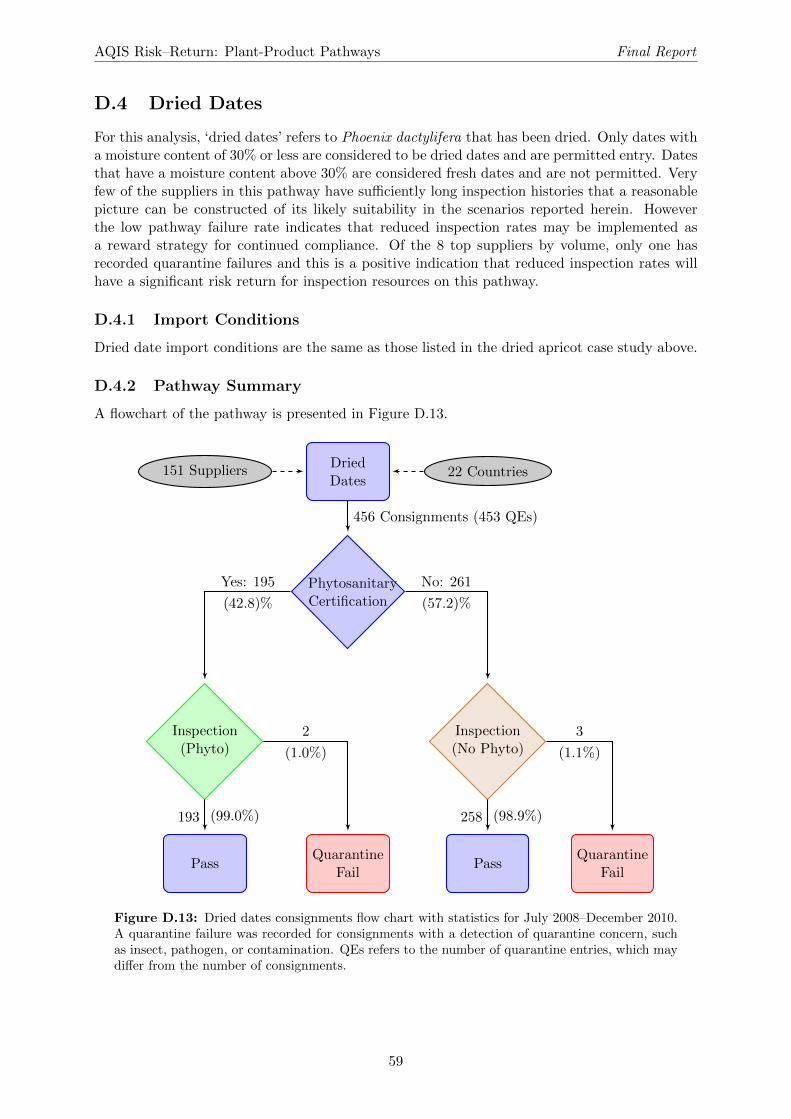
AQIS Risk–Return: Plant-Product Pathways Final Report
D.4 Dried Dates
For this analysis, ‘dried dates’ refers to Phoenix dactylifera that has been dried. Only dates witha moisture content of 30% or less are considered to be dried dates and are permitted entry. Datesthat have a moisture content above 30% are considered fresh dates and are not permitted. Veryfew of the suppliers in this pathway have sufficiently long inspection histories that a reasonablepicture can be constructed of its likely suitability in the scenarios reported herein. Howeverthe low pathway failure rate indicates that reduced inspection rates may be implemented asa reward strategy for continued compliance. Of the 8 top suppliers by volume, only one hasrecorded quarantine failures and this is a positive indication that reduced inspection rates willhave a significant risk return for inspection resources on this pathway.
D.4.1 Import Conditions
Dried date import conditions are the same as those listed in the dried apricot case study above.
D.4.2 Pathway Summary
A flowchart of the pathway is presented in Figure D.13.
151 SuppliersDriedDates
22 Countries
PhytosanitaryCertification
Inspection(Phyto)
Inspection(No Phyto)
PassQuarantine
FailPass
QuarantineFail
456 Consignments (453 QEs)
193 (99.0%)
2
(1.0%)
258 (98.9%)
3
(1.1%)
Yes: 195
(42.8)%
No: 261
(57.2)%
Figure D.13: Dried dates consignments flow chart with statistics for July 2008–December 2010.A quarantine failure was recorded for consignments with a detection of quarantine concern, suchas insect, pathogen, or contamination. QEs refers to the number of quarantine entries, which maydiffer from the number of consignments.
59
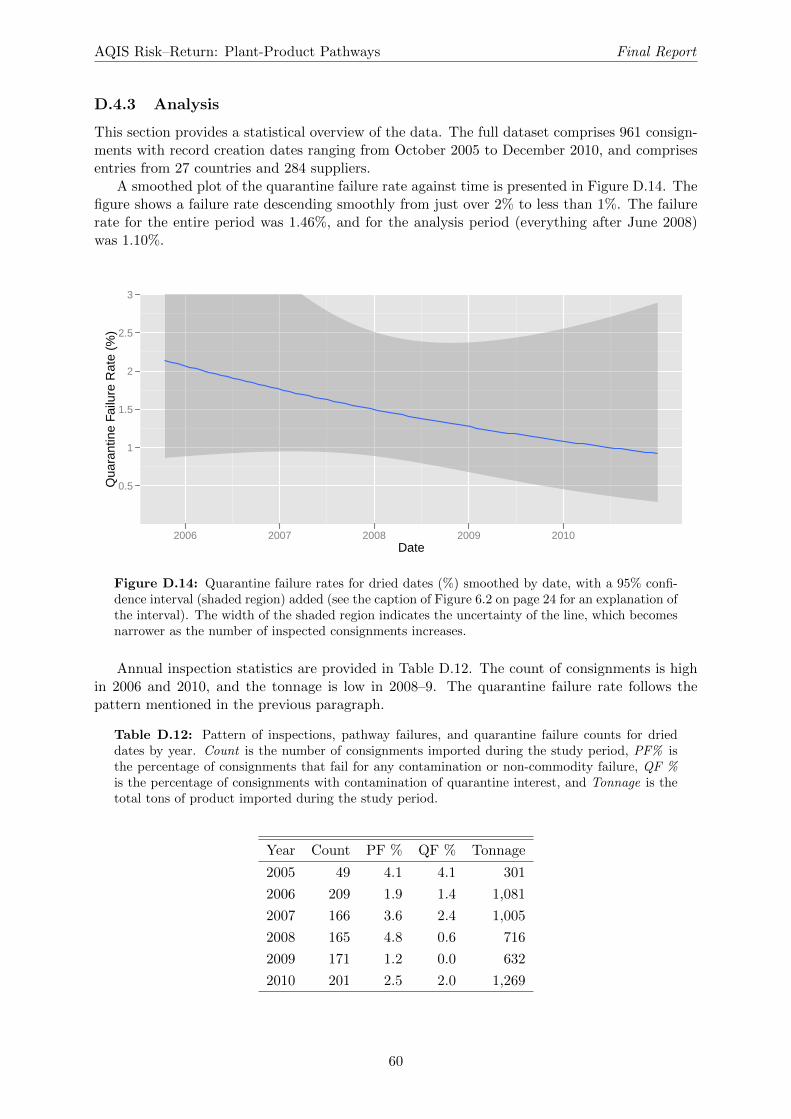
AQIS Risk–Return: Plant-Product Pathways Final Report
D.4.3 Analysis
This section provides a statistical overview of the data. The full dataset comprises 961 consign-ments with record creation dates ranging from October 2005 to December 2010, and comprisesentries from 27 countries and 284 suppliers.
A smoothed plot of the quarantine failure rate against time is presented in Figure D.14. Thefigure shows a failure rate descending smoothly from just over 2% to less than 1%. The failurerate for the entire period was 1.46%, and for the analysis period (everything after June 2008)was 1.10%.
0.5
1
1.5
2
2.5
3
2006 2007 2008 2009 2010Date
Qua
rant
ine
Failu
re R
ate
(%)
Figure D.14: Quarantine failure rates for dried dates (%) smoothed by date, with a 95% confi-dence interval (shaded region) added (see the caption of Figure 6.2 on page 24 for an explanation ofthe interval). The width of the shaded region indicates the uncertainty of the line, which becomesnarrower as the number of inspected consignments increases.
Annual inspection statistics are provided in Table D.12. The count of consignments is highin 2006 and 2010, and the tonnage is low in 2008–9. The quarantine failure rate follows thepattern mentioned in the previous paragraph.
Table D.12: Pattern of inspections, pathway failures, and quarantine failure counts for drieddates by year. Count is the number of consignments imported during the study period, PF% isthe percentage of consignments that fail for any contamination or non-commodity failure, QF %is the percentage of consignments with contamination of quarantine interest, and Tonnage is thetotal tons of product imported during the study period.
Year Count PF % QF % Tonnage
2005 49 4.1 4.1 301
2006 209 1.9 1.4 1,081
2007 166 3.6 2.4 1,005
2008 165 4.8 0.6 716
2009 171 1.2 0.0 632
2010 201 2.5 2.0 1,269
60
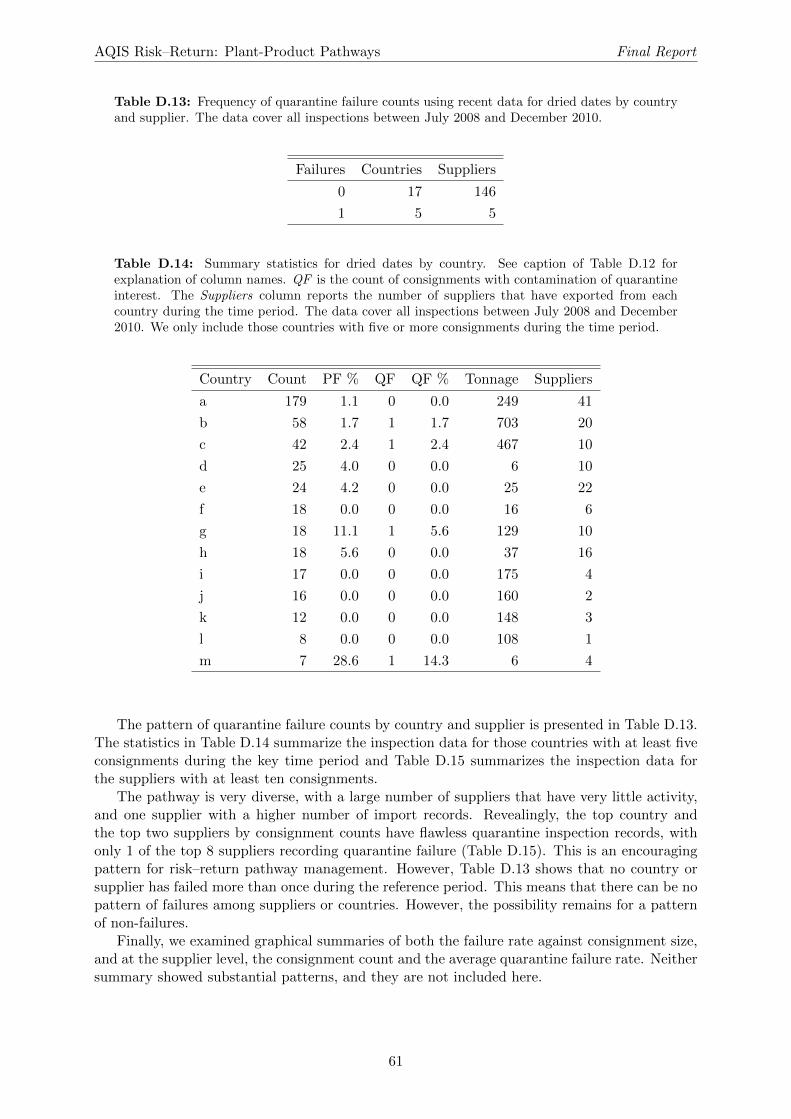
AQIS Risk–Return: Plant-Product Pathways Final Report
Table D.13: Frequency of quarantine failure counts using recent data for dried dates by countryand supplier. The data cover all inspections between July 2008 and December 2010.
Failures Countries Suppliers
0 17 146
1 5 5
Table D.14: Summary statistics for dried dates by country. See caption of Table D.12 forexplanation of column names. QF is the count of consignments with contamination of quarantineinterest. The Suppliers column reports the number of suppliers that have exported from eachcountry during the time period. The data cover all inspections between July 2008 and December2010. We only include those countries with five or more consignments during the time period.
Country Count PF % QF QF % Tonnage Suppliers
a 179 1.1 0 0.0 249 41
b 58 1.7 1 1.7 703 20
c 42 2.4 1 2.4 467 10
d 25 4.0 0 0.0 6 10
e 24 4.2 0 0.0 25 22
f 18 0.0 0 0.0 16 6
g 18 11.1 1 5.6 129 10
h 18 5.6 0 0.0 37 16
i 17 0.0 0 0.0 175 4
j 16 0.0 0 0.0 160 2
k 12 0.0 0 0.0 148 3
l 8 0.0 0 0.0 108 1
m 7 28.6 1 14.3 6 4
The pattern of quarantine failure counts by country and supplier is presented in Table D.13.The statistics in Table D.14 summarize the inspection data for those countries with at least fiveconsignments during the key time period and Table D.15 summarizes the inspection data forthe suppliers with at least ten consignments.
The pathway is very diverse, with a large number of suppliers that have very little activity,and one supplier with a higher number of import records. Revealingly, the top country andthe top two suppliers by consignment counts have flawless quarantine inspection records, withonly 1 of the top 8 suppliers recording quarantine failure (Table D.15). This is an encouragingpattern for risk–return pathway management. However, Table D.13 shows that no country orsupplier has failed more than once during the reference period. This means that there can be nopattern of failures among suppliers or countries. However, the possibility remains for a patternof non-failures.
Finally, we examined graphical summaries of both the failure rate against consignment size,and at the supplier level, the consignment count and the average quarantine failure rate. Neithersummary showed substantial patterns, and they are not included here.
61
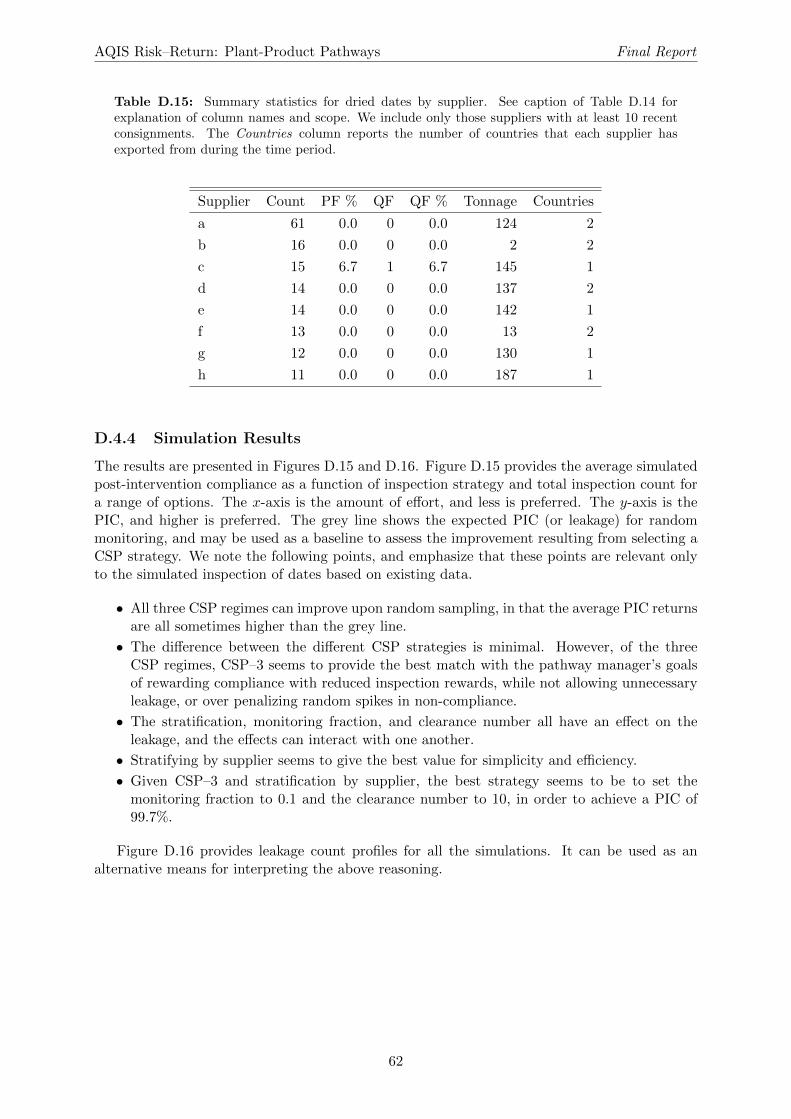
AQIS Risk–Return: Plant-Product Pathways Final Report
Table D.15: Summary statistics for dried dates by supplier. See caption of Table D.14 forexplanation of column names and scope. We include only those suppliers with at least 10 recentconsignments. The Countries column reports the number of countries that each supplier hasexported from during the time period.
Supplier Count PF % QF QF % Tonnage Countries
a 61 0.0 0 0.0 124 2
b 16 0.0 0 0.0 2 2
c 15 6.7 1 6.7 145 1
d 14 0.0 0 0.0 137 2
e 14 0.0 0 0.0 142 1
f 13 0.0 0 0.0 13 2
g 12 0.0 0 0.0 130 1
h 11 0.0 0 0.0 187 1
D.4.4 Simulation Results
The results are presented in Figures D.15 and D.16. Figure D.15 provides the average simulatedpost-intervention compliance as a function of inspection strategy and total inspection count fora range of options. The x-axis is the amount of effort, and less is preferred. The y-axis is thePIC, and higher is preferred. The grey line shows the expected PIC (or leakage) for randommonitoring, and may be used as a baseline to assess the improvement resulting from selecting aCSP strategy. We note the following points, and emphasize that these points are relevant onlyto the simulated inspection of dates based on existing data.
• All three CSP regimes can improve upon random sampling, in that the average PIC returnsare all sometimes higher than the grey line.
• The difference between the different CSP strategies is minimal. However, of the threeCSP regimes, CSP–3 seems to provide the best match with the pathway manager’s goalsof rewarding compliance with reduced inspection rewards, while not allowing unnecessaryleakage, or over penalizing random spikes in non-compliance.
• The stratification, monitoring fraction, and clearance number all have an effect on theleakage, and the effects can interact with one another.
• Stratifying by supplier seems to give the best value for simplicity and efficiency.
• Given CSP–3 and stratification by supplier, the best strategy seems to be to set themonitoring fraction to 0.1 and the clearance number to 10, in order to achieve a PIC of99.7%.
Figure D.16 provides leakage count profiles for all the simulations. It can be used as analternative means for interpreting the above reasoning.
62
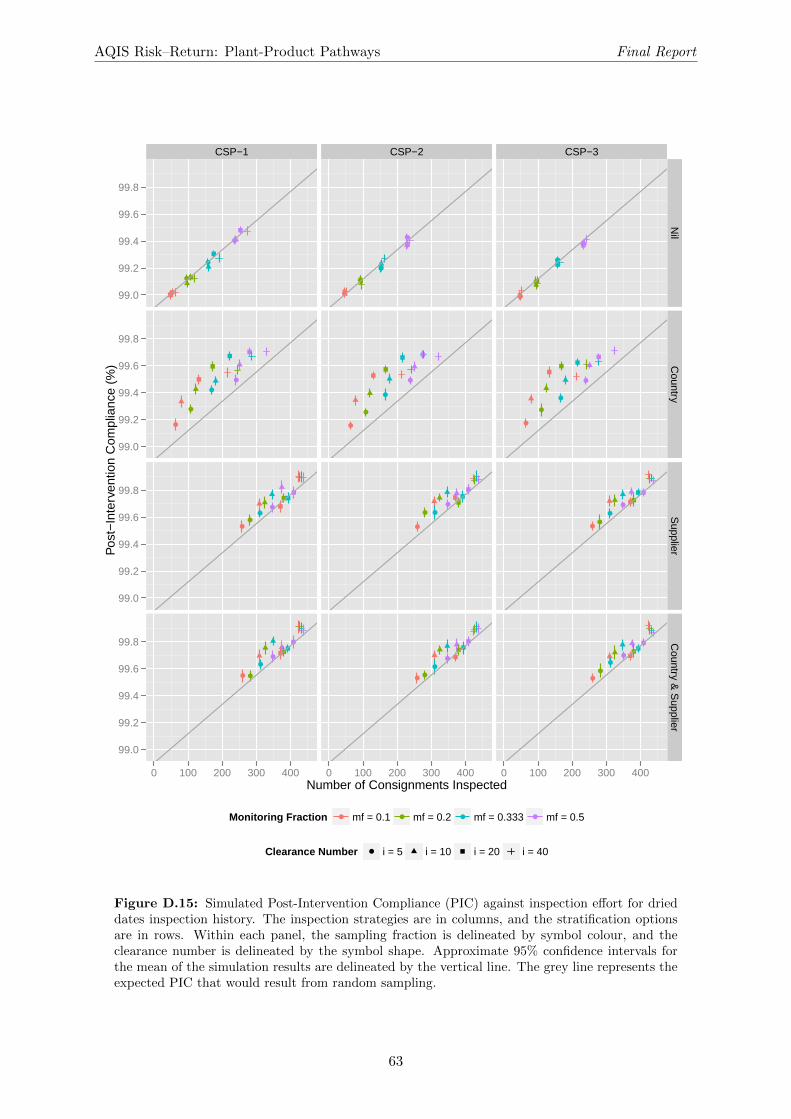
AQIS Risk–Return: Plant-Product Pathways Final Report
CSP−1 CSP−2 CSP−3
99.0
99.2
99.4
99.6
99.8
99.0
99.2
99.4
99.6
99.8
99.0
99.2
99.4
99.6
99.8
99.0
99.2
99.4
99.6
99.8
●
●
●
●
●
●
●
●
●●
●●
● ●
●
●
●
●
●
●
●
●
●
●
●
● ●
●
● ●
●
●
●
●
●
●
●
●
●
●
●●
●
●
●●
●●
Nil
Country
Supplier
Country &
Supplier
0 100 200 300 400 0 100 200 300 400 0 100 200 300 400Number of Consignments Inspected
Pos
t−In
terv
entio
n C
ompl
ianc
e (%
)
Monitoring Fraction ● ● ● ●mf = 0.1 mf = 0.2 mf = 0.333 mf = 0.5
Clearance Number ● i = 5 i = 10 i = 20 i = 40
Figure D.15: Simulated Post-Intervention Compliance (PIC) against inspection effort for drieddates inspection history. The inspection strategies are in columns, and the stratification optionsare in rows. Within each panel, the sampling fraction is delineated by symbol colour, and theclearance number is delineated by the symbol shape. Approximate 95% confidence intervals forthe mean of the simulation results are delineated by the vertical line. The grey line represents theexpected PIC that would result from random sampling.
63
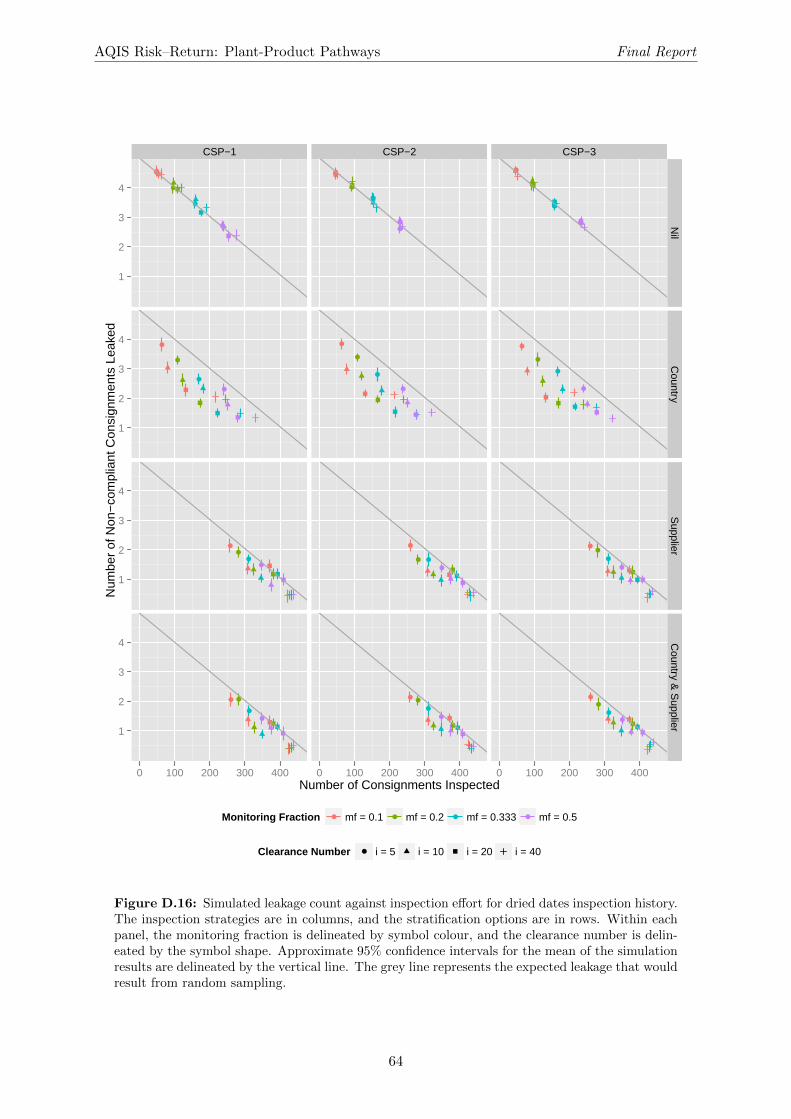
AQIS Risk–Return: Plant-Product Pathways Final Report
CSP−1 CSP−2 CSP−3
1
2
3
4
1
2
3
4
1
2
3
4
1
2
3
4
●
●
●
●
●
●
●
●
●●
●●
● ●
●
●
●
●
●
●
●
●
●
●
●
● ●
●
● ●
●
●
●
●
●
●
●
●
●
●
●●
●
●
●●
●●
Nil
Country
Supplier
Country &
Supplier
0 100 200 300 400 0 100 200 300 400 0 100 200 300 400Number of Consignments Inspected
Num
ber
of N
on−
com
plia
nt C
onsi
gnm
ents
Lea
ked
Monitoring Fraction ● ● ● ●mf = 0.1 mf = 0.2 mf = 0.333 mf = 0.5
Clearance Number ● i = 5 i = 10 i = 20 i = 40
Figure D.16: Simulated leakage count against inspection effort for dried dates inspection history.The inspection strategies are in columns, and the stratification options are in rows. Within eachpanel, the monitoring fraction is delineated by symbol colour, and the clearance number is delin-eated by the symbol shape. Approximate 95% confidence intervals for the mean of the simulationresults are delineated by the vertical line. The grey line represents the expected leakage that wouldresult from random sampling.
64
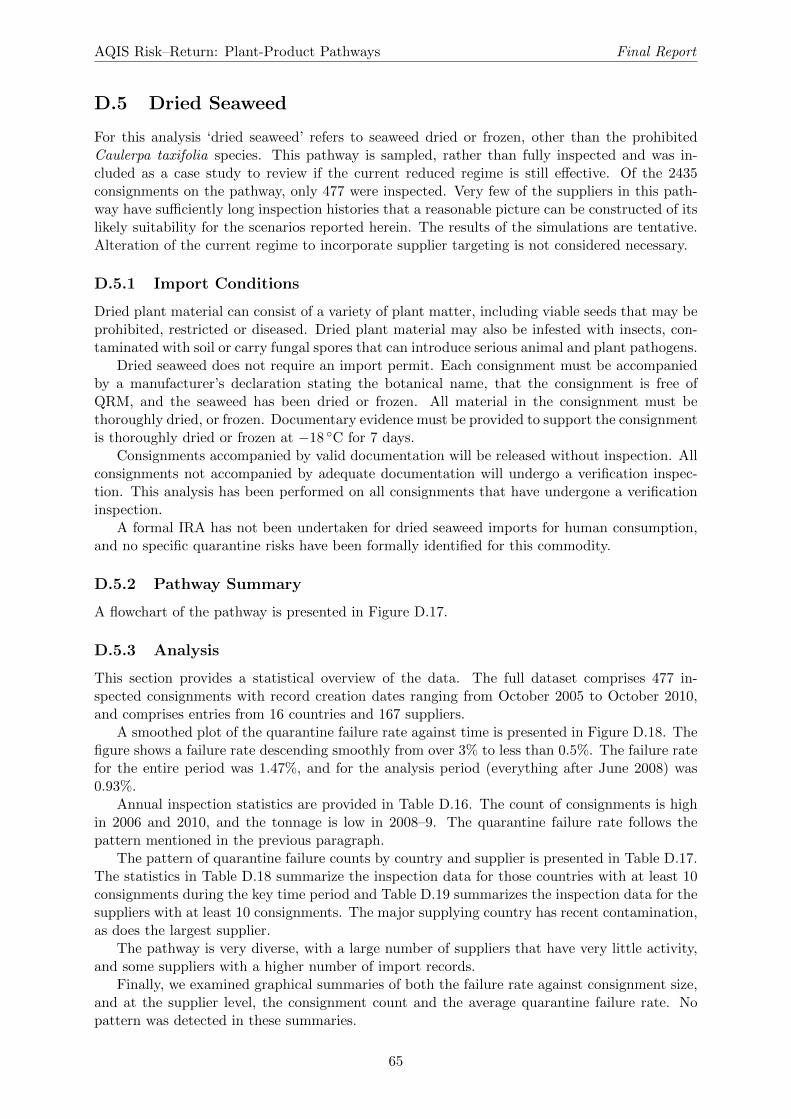
AQIS Risk–Return: Plant-Product Pathways Final Report
D.5 Dried Seaweed
For this analysis ‘dried seaweed’ refers to seaweed dried or frozen, other than the prohibitedCaulerpa taxifolia species. This pathway is sampled, rather than fully inspected and was in-cluded as a case study to review if the current reduced regime is still effective. Of the 2435consignments on the pathway, only 477 were inspected. Very few of the suppliers in this path-way have sufficiently long inspection histories that a reasonable picture can be constructed of itslikely suitability for the scenarios reported herein. The results of the simulations are tentative.Alteration of the current regime to incorporate supplier targeting is not considered necessary.
D.5.1 Import Conditions
Dried plant material can consist of a variety of plant matter, including viable seeds that may beprohibited, restricted or diseased. Dried plant material may also be infested with insects, con-taminated with soil or carry fungal spores that can introduce serious animal and plant pathogens.
Dried seaweed does not require an import permit. Each consignment must be accompaniedby a manufacturer’s declaration stating the botanical name, that the consignment is free ofQRM, and the seaweed has been dried or frozen. All material in the consignment must bethoroughly dried, or frozen. Documentary evidence must be provided to support the consignmentis thoroughly dried or frozen at −18 ◦C for 7 days.
Consignments accompanied by valid documentation will be released without inspection. Allconsignments not accompanied by adequate documentation will undergo a verification inspec-tion. This analysis has been performed on all consignments that have undergone a verificationinspection.
A formal IRA has not been undertaken for dried seaweed imports for human consumption,and no specific quarantine risks have been formally identified for this commodity.
D.5.2 Pathway Summary
A flowchart of the pathway is presented in Figure D.17.
D.5.3 Analysis
This section provides a statistical overview of the data. The full dataset comprises 477 in-spected consignments with record creation dates ranging from October 2005 to October 2010,and comprises entries from 16 countries and 167 suppliers.
A smoothed plot of the quarantine failure rate against time is presented in Figure D.18. Thefigure shows a failure rate descending smoothly from over 3% to less than 0.5%. The failure ratefor the entire period was 1.47%, and for the analysis period (everything after June 2008) was0.93%.
Annual inspection statistics are provided in Table D.16. The count of consignments is highin 2006 and 2010, and the tonnage is low in 2008–9. The quarantine failure rate follows thepattern mentioned in the previous paragraph.
The pattern of quarantine failure counts by country and supplier is presented in Table D.17.The statistics in Table D.18 summarize the inspection data for those countries with at least 10consignments during the key time period and Table D.19 summarizes the inspection data for thesuppliers with at least 10 consignments. The major supplying country has recent contamination,as does the largest supplier.
The pathway is very diverse, with a large number of suppliers that have very little activity,and some suppliers with a higher number of import records.
Finally, we examined graphical summaries of both the failure rate against consignment size,and at the supplier level, the consignment count and the average quarantine failure rate. Nopattern was detected in these summaries.
65
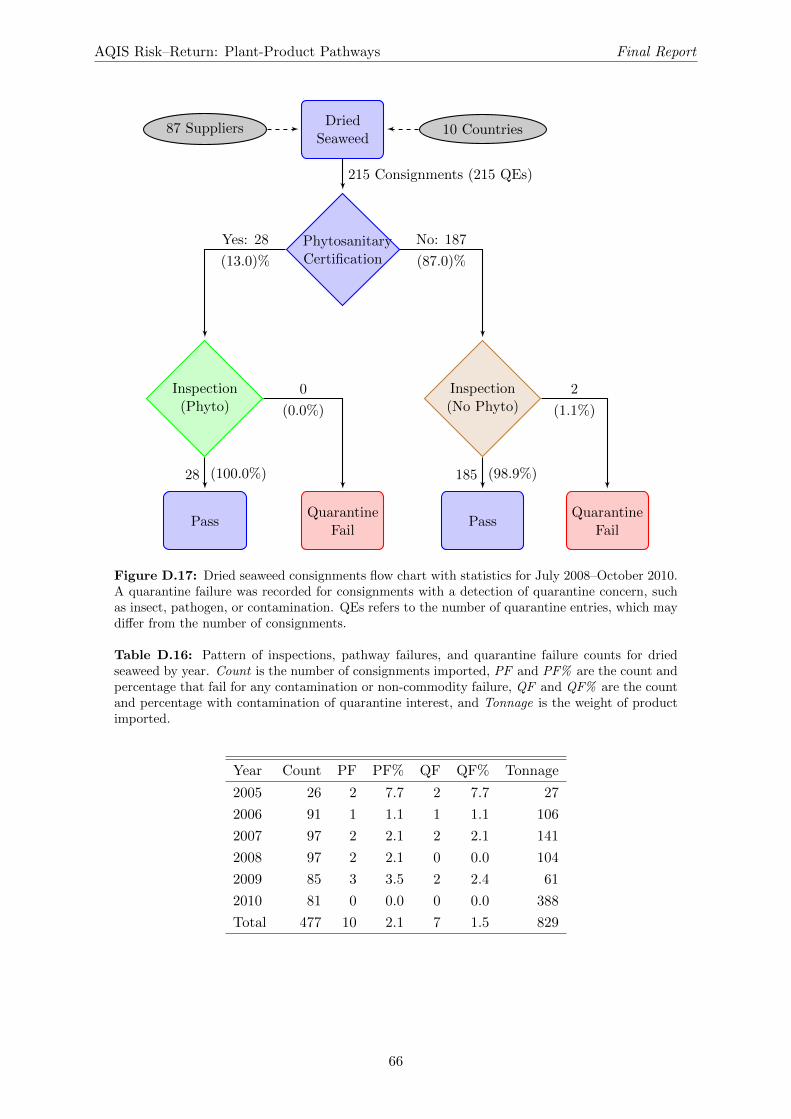
AQIS Risk–Return: Plant-Product Pathways Final Report
87 SuppliersDried
Seaweed10 Countries
PhytosanitaryCertification
Inspection(Phyto)
Inspection(No Phyto)
PassQuarantine
FailPass
QuarantineFail
215 Consignments (215 QEs)
28 (100.0%)
0
(0.0%)
185 (98.9%)
2
(1.1%)
Yes: 28
(13.0)%
No: 187
(87.0)%
Figure D.17: Dried seaweed consignments flow chart with statistics for July 2008–October 2010.A quarantine failure was recorded for consignments with a detection of quarantine concern, suchas insect, pathogen, or contamination. QEs refers to the number of quarantine entries, which maydiffer from the number of consignments.
Table D.16: Pattern of inspections, pathway failures, and quarantine failure counts for driedseaweed by year. Count is the number of consignments imported, PF and PF% are the count andpercentage that fail for any contamination or non-commodity failure, QF and QF% are the countand percentage with contamination of quarantine interest, and Tonnage is the weight of productimported.
Year Count PF PF% QF QF% Tonnage
2005 26 2 7.7 2 7.7 27
2006 91 1 1.1 1 1.1 106
2007 97 2 2.1 2 2.1 141
2008 97 2 2.1 0 0.0 104
2009 85 3 3.5 2 2.4 61
2010 81 0 0.0 0 0.0 388
Total 477 10 2.1 7 1.5 829
66
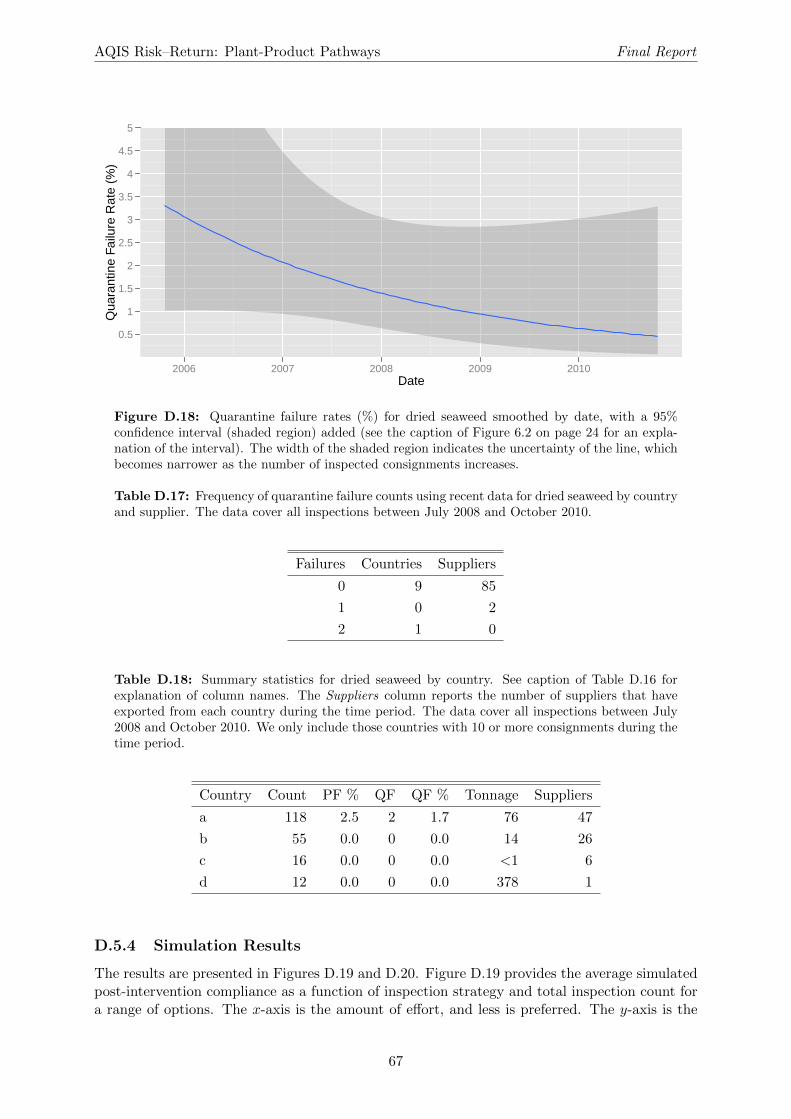
AQIS Risk–Return: Plant-Product Pathways Final Report
0.5
1
1.5
2
2.5
3
3.5
4
4.5
5
2006 2007 2008 2009 2010Date
Qua
rant
ine
Failu
re R
ate
(%)
Figure D.18: Quarantine failure rates (%) for dried seaweed smoothed by date, with a 95%confidence interval (shaded region) added (see the caption of Figure 6.2 on page 24 for an expla-nation of the interval). The width of the shaded region indicates the uncertainty of the line, whichbecomes narrower as the number of inspected consignments increases.
Table D.17: Frequency of quarantine failure counts using recent data for dried seaweed by countryand supplier. The data cover all inspections between July 2008 and October 2010.
Failures Countries Suppliers
0 9 85
1 0 2
2 1 0
Table D.18: Summary statistics for dried seaweed by country. See caption of Table D.16 forexplanation of column names. The Suppliers column reports the number of suppliers that haveexported from each country during the time period. The data cover all inspections between July2008 and October 2010. We only include those countries with 10 or more consignments during thetime period.
Country Count PF % QF QF % Tonnage Suppliers
a 118 2.5 2 1.7 76 47
b 55 0.0 0 0.0 14 26
c 16 0.0 0 0.0 <1 6
d 12 0.0 0 0.0 378 1
D.5.4 Simulation Results
The results are presented in Figures D.19 and D.20. Figure D.19 provides the average simulatedpost-intervention compliance as a function of inspection strategy and total inspection count fora range of options. The x-axis is the amount of effort, and less is preferred. The y-axis is the
67
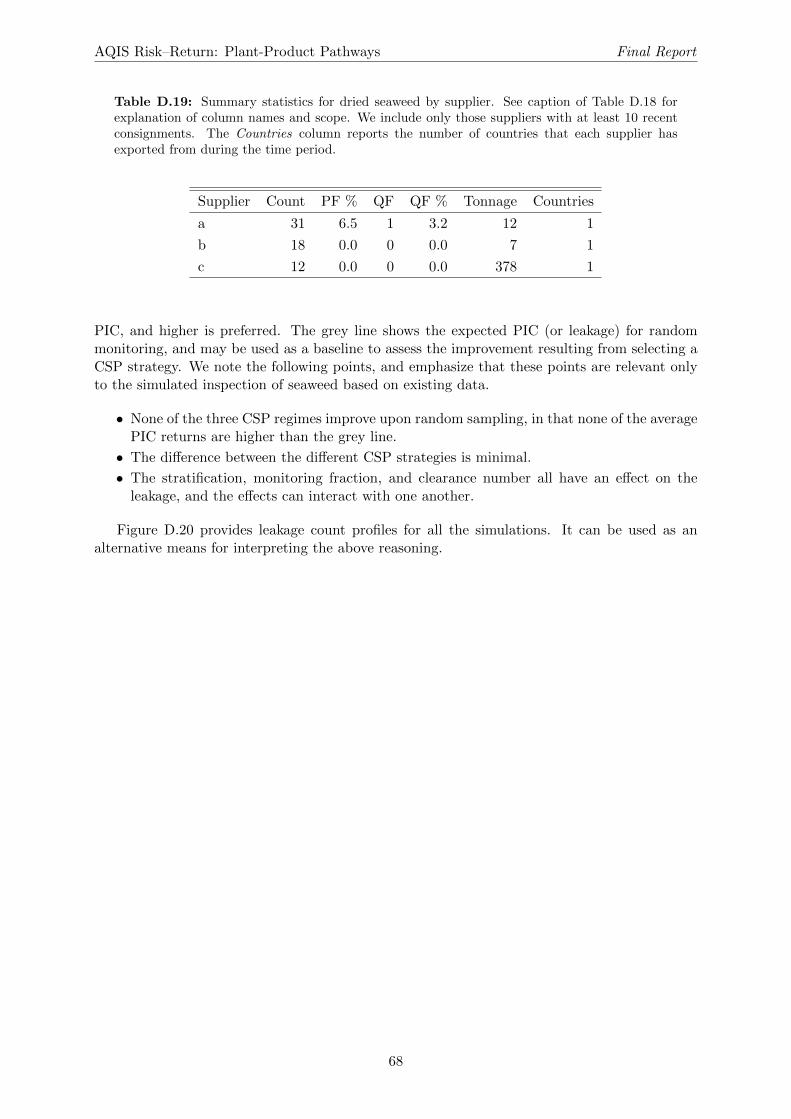
AQIS Risk–Return: Plant-Product Pathways Final Report
Table D.19: Summary statistics for dried seaweed by supplier. See caption of Table D.18 forexplanation of column names and scope. We include only those suppliers with at least 10 recentconsignments. The Countries column reports the number of countries that each supplier hasexported from during the time period.
Supplier Count PF % QF QF % Tonnage Countries
a 31 6.5 1 3.2 12 1
b 18 0.0 0 0.0 7 1
c 12 0.0 0 0.0 378 1
PIC, and higher is preferred. The grey line shows the expected PIC (or leakage) for randommonitoring, and may be used as a baseline to assess the improvement resulting from selecting aCSP strategy. We note the following points, and emphasize that these points are relevant onlyto the simulated inspection of seaweed based on existing data.
• None of the three CSP regimes improve upon random sampling, in that none of the averagePIC returns are higher than the grey line.
• The difference between the different CSP strategies is minimal.
• The stratification, monitoring fraction, and clearance number all have an effect on theleakage, and the effects can interact with one another.
Figure D.20 provides leakage count profiles for all the simulations. It can be used as analternative means for interpreting the above reasoning.
68
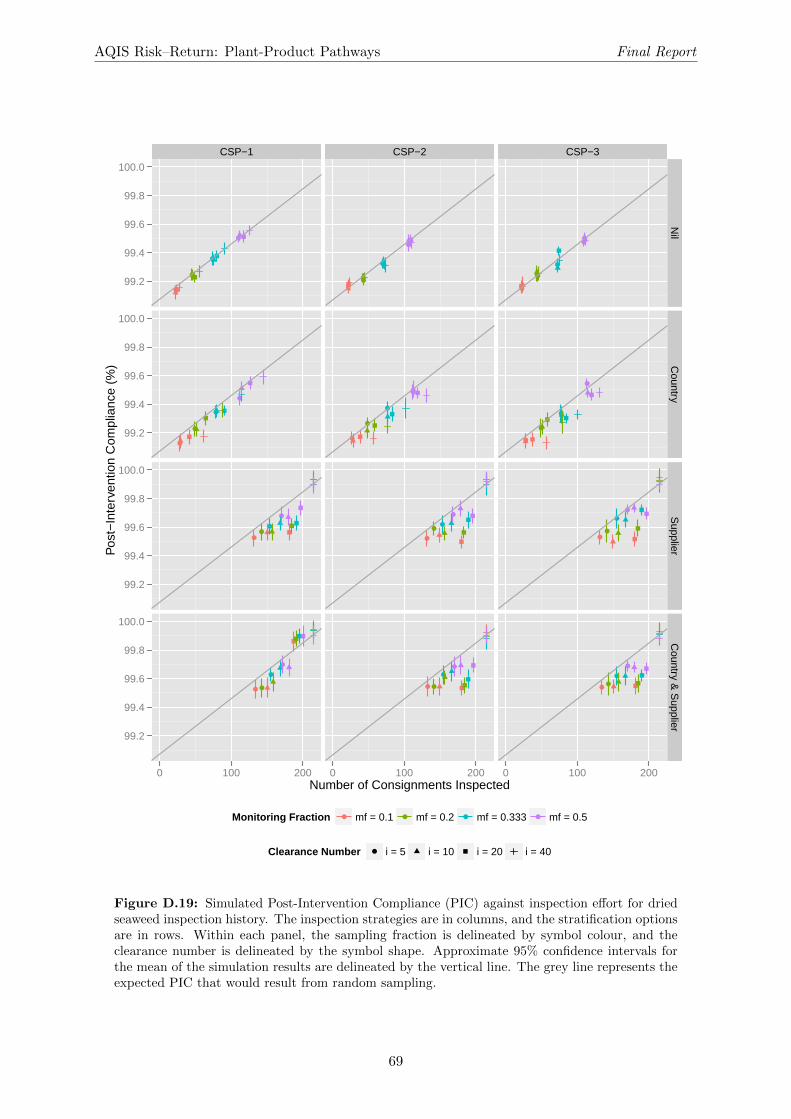
AQIS Risk–Return: Plant-Product Pathways Final Report
CSP−1 CSP−2 CSP−3
99.2
99.4
99.6
99.8
100.0
99.2
99.4
99.6
99.8
100.0
99.2
99.4
99.6
99.8
100.0
99.2
99.4
99.6
99.8
100.0
●
●
●
●
●
●
●
●
●●
●
●
● ●
●
●
●●
●
●
●
●
●
●
●
●●
●
● ●
●
●
●
●
●
●
●
●
●
●
●●
●
●
●●
●
●
Nil
Country
Supplier
Country &
Supplier
0 100 200 0 100 200 0 100 200Number of Consignments Inspected
Pos
t−In
terv
entio
n C
ompl
ianc
e (%
)
Monitoring Fraction ● ● ● ●mf = 0.1 mf = 0.2 mf = 0.333 mf = 0.5
Clearance Number ● i = 5 i = 10 i = 20 i = 40
Figure D.19: Simulated Post-Intervention Compliance (PIC) against inspection effort for driedseaweed inspection history. The inspection strategies are in columns, and the stratification optionsare in rows. Within each panel, the sampling fraction is delineated by symbol colour, and theclearance number is delineated by the symbol shape. Approximate 95% confidence intervals forthe mean of the simulation results are delineated by the vertical line. The grey line represents theexpected PIC that would result from random sampling.
69
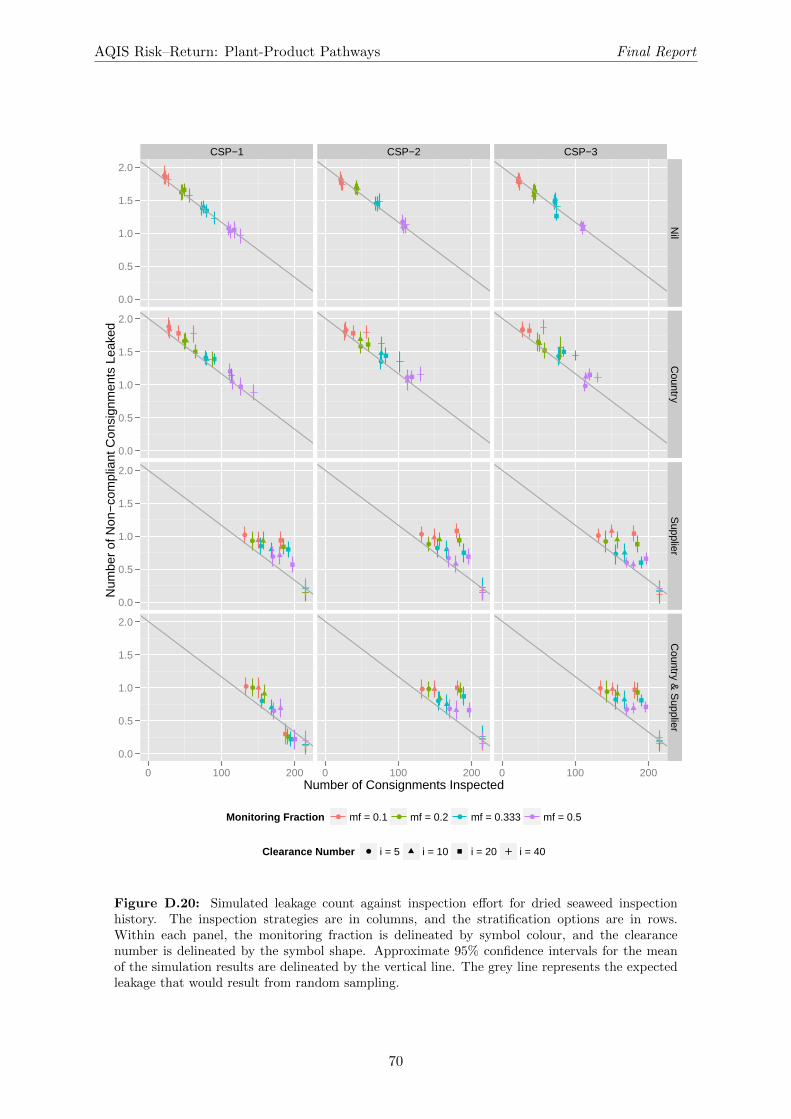
AQIS Risk–Return: Plant-Product Pathways Final Report
CSP−1 CSP−2 CSP−3
0.0
0.5
1.0
1.5
2.0
0.0
0.5
1.0
1.5
2.0
0.0
0.5
1.0
1.5
2.0
0.0
0.5
1.0
1.5
2.0
●
●
●
●
●
●
●
●
●●
●
●
● ●
●
●
●●
●
●
●
●
●
●
●
●●
●
● ●
●
●
●
●
●
●
●
●
●
●
●●
●
●
●●
●
●
Nil
Country
Supplier
Country &
Supplier
0 100 200 0 100 200 0 100 200Number of Consignments Inspected
Num
ber
of N
on−
com
plia
nt C
onsi
gnm
ents
Lea
ked
Monitoring Fraction ● ● ● ●mf = 0.1 mf = 0.2 mf = 0.333 mf = 0.5
Clearance Number ● i = 5 i = 10 i = 20 i = 40
Figure D.20: Simulated leakage count against inspection effort for dried seaweed inspectionhistory. The inspection strategies are in columns, and the stratification options are in rows.Within each panel, the monitoring fraction is delineated by symbol colour, and the clearancenumber is delineated by the symbol shape. Approximate 95% confidence intervals for the meanof the simulation results are delineated by the vertical line. The grey line represents the expectedleakage that would result from random sampling.
70
AQIS Risk–Return: Plant-Product Pathways Final Report
D.6 Fresh Garlic
For this analysis, “fresh garlic” refers to Allium sativum. The fresh garlic pathway does not showevidence of being a good match for the use of sampling for inspections, as has been recommendedfor other imported-plant product pathways, because the approach rate of contamination is toohigh on this pathway.
D.6.1 Import Conditions
Fresh garlic is considered a quarantine risk to Australia because fresh produce and/or the cartonsthat they are packaged in may contain plant material other than the permitted commodity, andother contaminants such as straw packaging, soil, insects, arthropod eggs, disease symptoms orseeds which add to the quarantine risks. These contaminants also have the potential to harbourmicroorganisms or fungi, which could have a significant impact if introduced into Australia.
Fresh garlic is only permitted entry into Australia if accompanied by a valid import permitand phytosanitary certificate.
All consignments are subject to AQIS inspection on arrival. A sample of 600 bulbs is selectedfrom a random number of cartons within each consignment and individually inspected for thepresence of insects, pests, disease, soil, and other contamination such as weed seeds and planttrash. A further 60 bulbs from the sample must be broken open to examine for fly pupae andlarvae.
Fresh garlic from China is known to be periodically infested with Delia antiqua. As this pestis most likely to be found inside the garlic clove, and not readily detectable when inspectingthe surface area, fresh garlic bulbs (from China only) require each of the bulbs in the 600 unitinspection sample to be broken open to check for live quarantinable flies and/or fly pupae.
A formal Import Risk Analysis (IRA) has not been completed for fresh garlic imports, how-ever, a risk determination has identified a risk of introducing the mite, Eriophyes tulipae. Forthis reason fresh garlic from all countries is subject to mandatory fumigation. All consignmentstreated prior to export must have a commercial treatment certificate attached referencing theconsignment. Any mandatory preshipment treatments carried out must have the treatmentdetails included on the Phytosanitary certificate.
D.6.2 Pathway Summary
A flowchart of the pathway is presented in Figure D.21.
D.6.3 Analysis
This section provides a statistical overview of the data. The full dataset comprises 1145 con-signments with record creation dates ranging from October 2005 to early February 2011, andcomprises entries from 15 countries and 123 suppliers.
A smoothed plot of the quarantine failure rate against time is presented in Figure D.22. Thefigure shows a failure rate increasing from below 12% to around 15%. The failure rate for theentire period was 12.05%, and for the analysis period (everything after June 2008) was 13.11%.
Annual inspection statistics are provided in Table D.20. The count of consignments is de-creasing gradually across the time period.
The pattern of quarantine failure counts by country and supplier is presented in Table D.21.The statistics in Table D.22 summarize the inspection data for all countries during the key timeperiod and Table D.23 summarizes the inspection data for the suppliers with at least twentyconsignments. The inspection history for this pathway is uniformly bad.
Finally, we examined graphical summaries of both the failure rate against consignment size,and at the supplier level, the consignment count and the average quarantine failure rate. Neithersummary showed substantial patterns, and they are not included here.
71
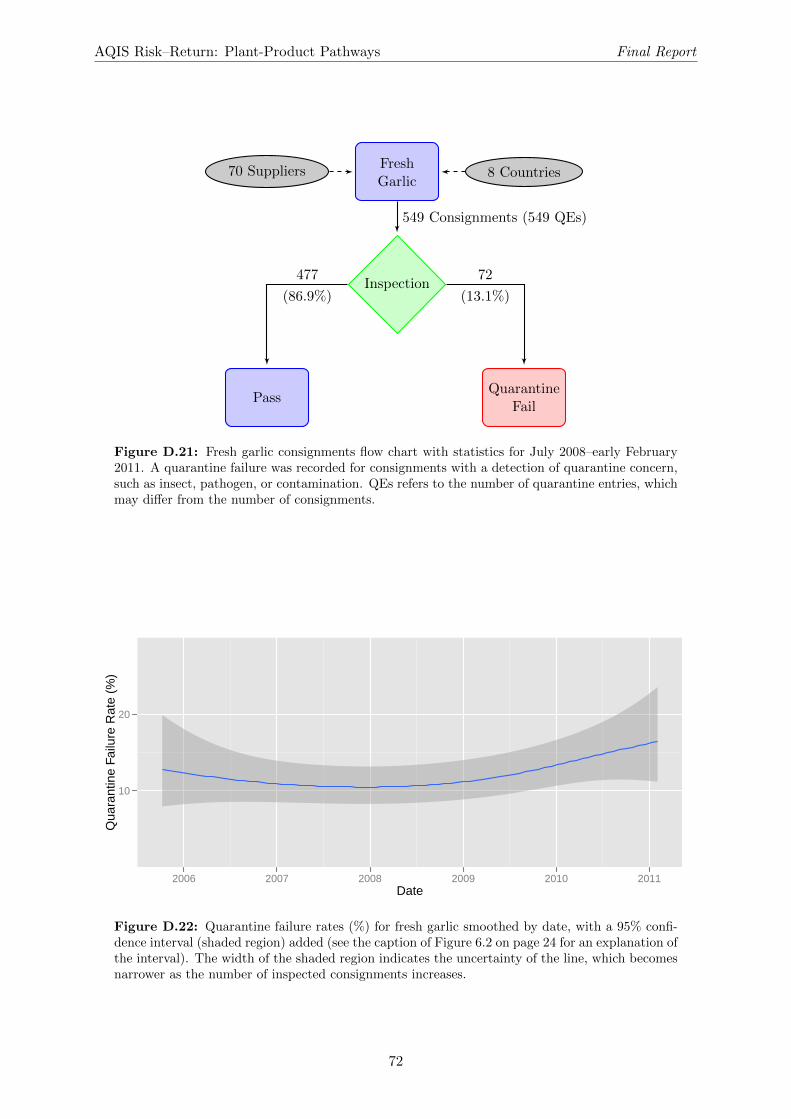
AQIS Risk–Return: Plant-Product Pathways Final Report
70 SuppliersFreshGarlic
8 Countries
Inspection
PassQuarantine
Fail
549 Consignments (549 QEs)
477
(86.9%)
72
(13.1%)
Figure D.21: Fresh garlic consignments flow chart with statistics for July 2008–early February2011. A quarantine failure was recorded for consignments with a detection of quarantine concern,such as insect, pathogen, or contamination. QEs refers to the number of quarantine entries, whichmay differ from the number of consignments.
10
20
2006 2007 2008 2009 2010 2011Date
Qua
rant
ine
Failu
re R
ate
(%)
Figure D.22: Quarantine failure rates (%) for fresh garlic smoothed by date, with a 95% confi-dence interval (shaded region) added (see the caption of Figure 6.2 on page 24 for an explanation ofthe interval). The width of the shaded region indicates the uncertainty of the line, which becomesnarrower as the number of inspected consignments increases.
72
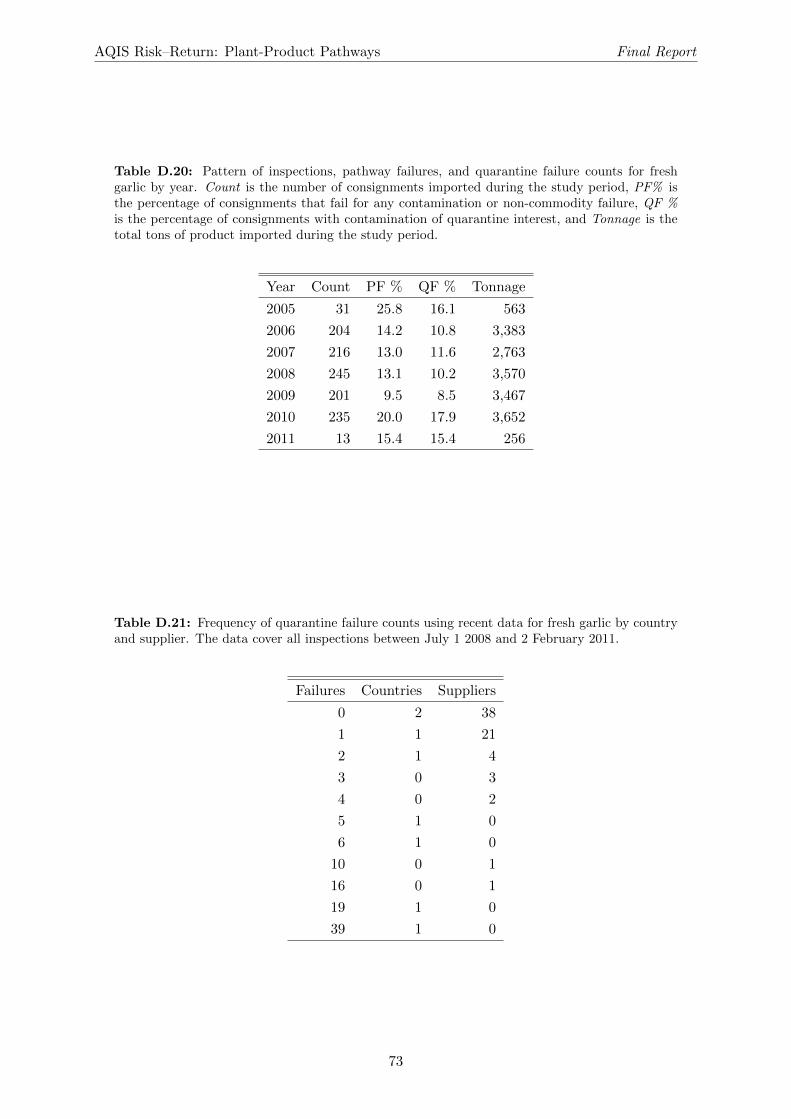
AQIS Risk–Return: Plant-Product Pathways Final Report
Table D.20: Pattern of inspections, pathway failures, and quarantine failure counts for freshgarlic by year. Count is the number of consignments imported during the study period, PF% isthe percentage of consignments that fail for any contamination or non-commodity failure, QF %is the percentage of consignments with contamination of quarantine interest, and Tonnage is thetotal tons of product imported during the study period.
Year Count PF % QF % Tonnage
2005 31 25.8 16.1 563
2006 204 14.2 10.8 3,383
2007 216 13.0 11.6 2,763
2008 245 13.1 10.2 3,570
2009 201 9.5 8.5 3,467
2010 235 20.0 17.9 3,652
2011 13 15.4 15.4 256
Table D.21: Frequency of quarantine failure counts using recent data for fresh garlic by countryand supplier. The data cover all inspections between July 1 2008 and 2 February 2011.
Failures Countries Suppliers
0 2 38
1 1 21
2 1 4
3 0 3
4 0 2
5 1 0
6 1 0
10 0 1
16 0 1
19 1 0
39 1 0
73
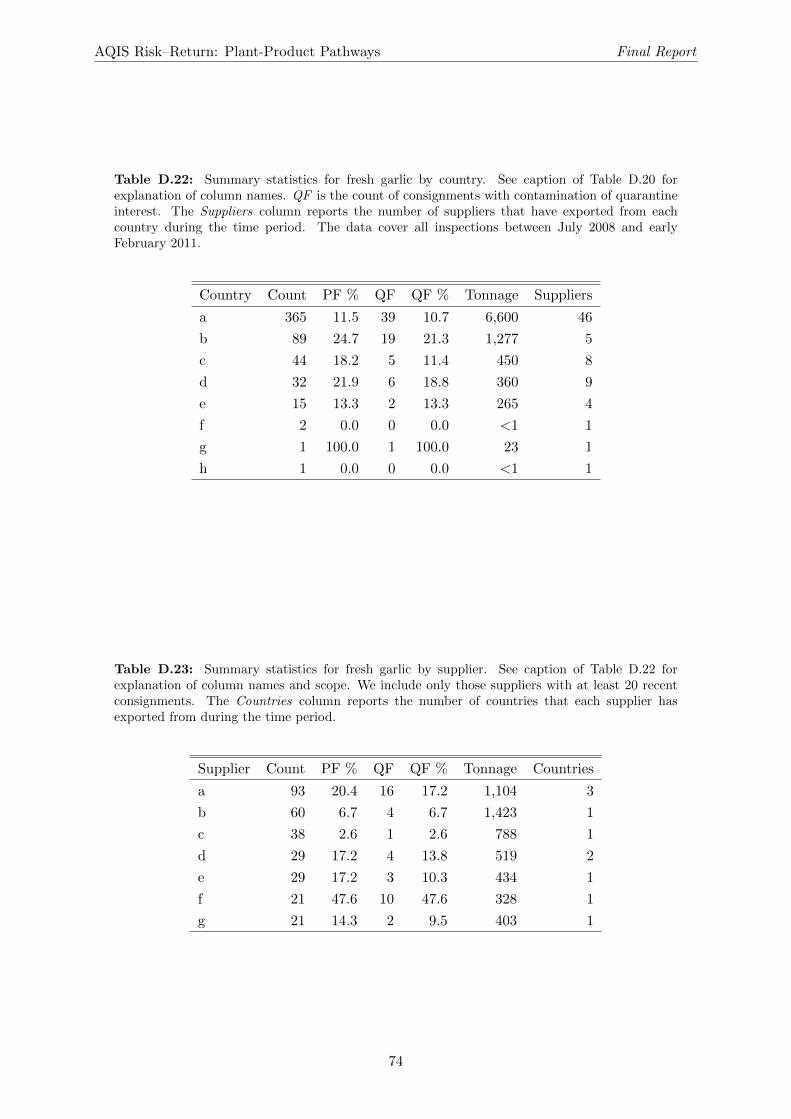
AQIS Risk–Return: Plant-Product Pathways Final Report
Table D.22: Summary statistics for fresh garlic by country. See caption of Table D.20 forexplanation of column names. QF is the count of consignments with contamination of quarantineinterest. The Suppliers column reports the number of suppliers that have exported from eachcountry during the time period. The data cover all inspections between July 2008 and earlyFebruary 2011.
Country Count PF % QF QF % Tonnage Suppliers
a 365 11.5 39 10.7 6,600 46
b 89 24.7 19 21.3 1,277 5
c 44 18.2 5 11.4 450 8
d 32 21.9 6 18.8 360 9
e 15 13.3 2 13.3 265 4
f 2 0.0 0 0.0 <1 1
g 1 100.0 1 100.0 23 1
h 1 0.0 0 0.0 <1 1
Table D.23: Summary statistics for fresh garlic by supplier. See caption of Table D.22 forexplanation of column names and scope. We include only those suppliers with at least 20 recentconsignments. The Countries column reports the number of countries that each supplier hasexported from during the time period.
Supplier Count PF % QF QF % Tonnage Countries
a 93 20.4 16 17.2 1,104 3
b 60 6.7 4 6.7 1,423 1
c 38 2.6 1 2.6 788 1
d 29 17.2 4 13.8 519 2
e 29 17.2 3 10.3 434 1
f 21 47.6 10 47.6 328 1
g 21 14.3 2 9.5 403 1
74
AQIS Risk–Return: Plant-Product Pathways Final Report
D.6.4 Simulation Results
The results are presented in Figures D.23 and D.24. Figure D.23 provides the average simulatedpost-intervention compliance as a function of inspection strategy and total inspection count fora range of options. The x-axis is the amount of effort, and less is preferred. The y-axis is thePIC, and higher is preferred. The grey line shows the expected PIC (or leakage) for randommonitoring, and may be used as a baseline to assess the improvement resulting from selecting aCSP strategy. We note the following points, and emphasize that these points are relevant onlyto the simulated inspection of fresh garlic based on existing data.
• The failure rate of the pathway is quite high.
• All three CSP regimes improve upon random sampling, in that the average PIC returnsare all substantially higher than the grey line.
• The difference between the different CSP strategies is minimal.
• The stratification, monitoring fraction, and clearance number all have an effect on theleakage, and the effects can interact with one another.
• Stratifying by supplier seems to give the best value for simplicity and efficiency.
Figure D.24 provides leakage count profiles for all the simulations. It can be used as analternative means for interpreting the above reasoning.
75
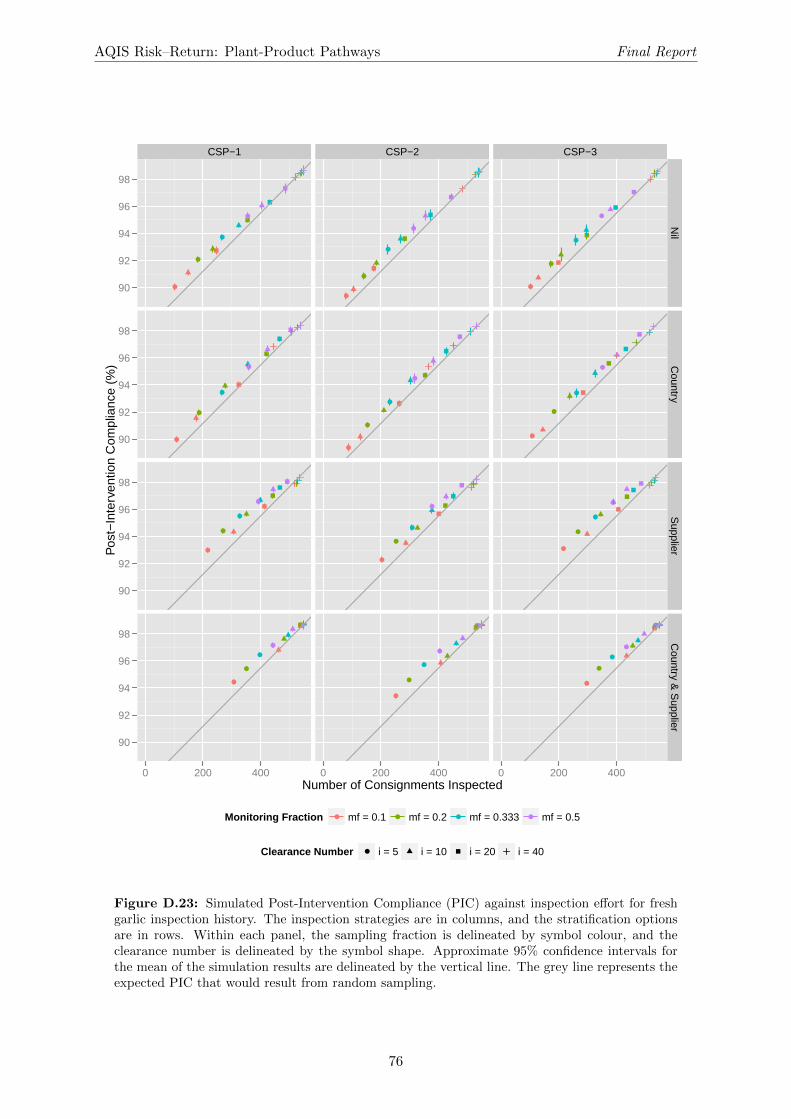
AQIS Risk–Return: Plant-Product Pathways Final Report
CSP−1 CSP−2 CSP−3
90
92
94
96
98
90
92
94
96
98
90
92
94
96
98
90
92
94
96
98
●
●
●
●
●
●
●
●
●
●
●
●
●
●
●
●
●
●
●
●
●
●
●
●
●
●
●
●
●
●
●
●
●
●
●
●
●
●
●
●
●
●
●
●
●
●
●
●
Nil
Country
Supplier
Country &
Supplier
0 200 400 0 200 400 0 200 400Number of Consignments Inspected
Pos
t−In
terv
entio
n C
ompl
ianc
e (%
)
Monitoring Fraction ● ● ● ●mf = 0.1 mf = 0.2 mf = 0.333 mf = 0.5
Clearance Number ● i = 5 i = 10 i = 20 i = 40
Figure D.23: Simulated Post-Intervention Compliance (PIC) against inspection effort for freshgarlic inspection history. The inspection strategies are in columns, and the stratification optionsare in rows. Within each panel, the sampling fraction is delineated by symbol colour, and theclearance number is delineated by the symbol shape. Approximate 95% confidence intervals forthe mean of the simulation results are delineated by the vertical line. The grey line represents theexpected PIC that would result from random sampling.
76
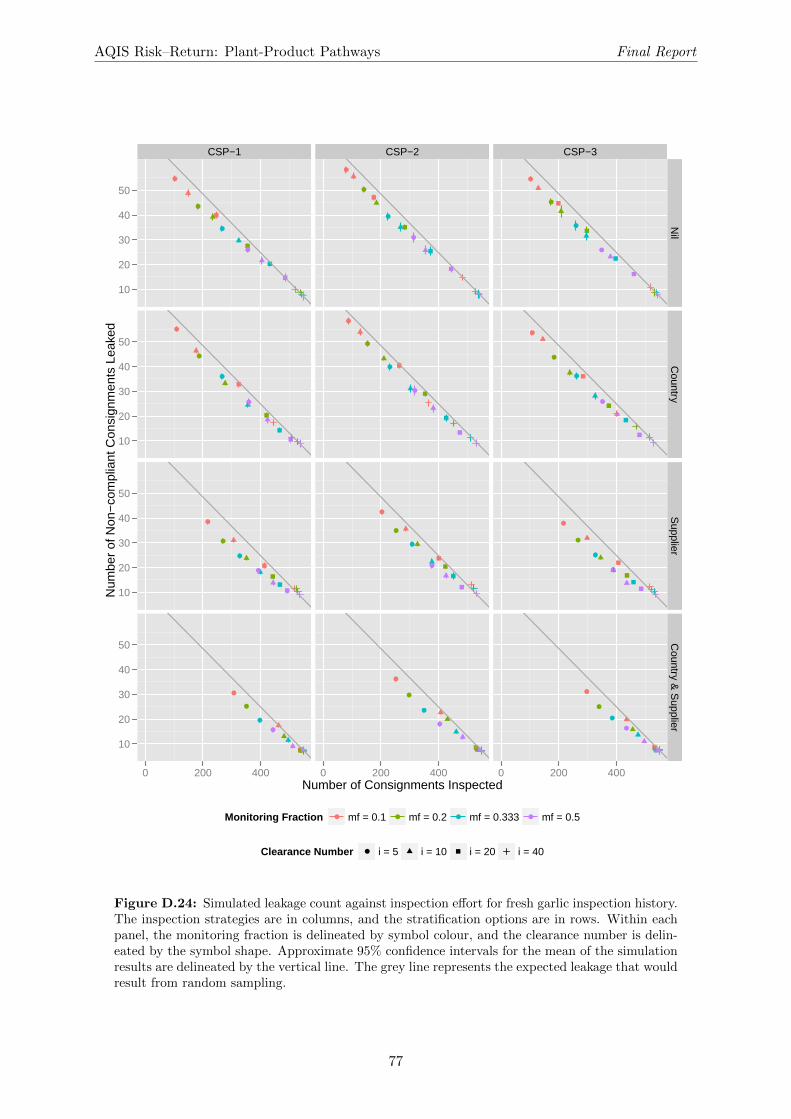
AQIS Risk–Return: Plant-Product Pathways Final Report
CSP−1 CSP−2 CSP−3
10
20
30
40
50
10
20
30
40
50
10
20
30
40
50
10
20
30
40
50
●
●
●
●
●
●
●
●
●
●
●
●
●
●
●
●
●
●
●
●
●
●
●
●
●
●
●
●
●
●
●
●
●
●
●
●
●
●
●
●
●
●
●
●
●
●
●
●
Nil
Country
Supplier
Country &
Supplier
0 200 400 0 200 400 0 200 400Number of Consignments Inspected
Num
ber
of N
on−
com
plia
nt C
onsi
gnm
ents
Lea
ked
Monitoring Fraction ● ● ● ●mf = 0.1 mf = 0.2 mf = 0.333 mf = 0.5
Clearance Number ● i = 5 i = 10 i = 20 i = 40
Figure D.24: Simulated leakage count against inspection effort for fresh garlic inspection history.The inspection strategies are in columns, and the stratification options are in rows. Within eachpanel, the monitoring fraction is delineated by symbol colour, and the clearance number is delin-eated by the symbol shape. Approximate 95% confidence intervals for the mean of the simulationresults are delineated by the vertical line. The grey line represents the expected leakage that wouldresult from random sampling.
77
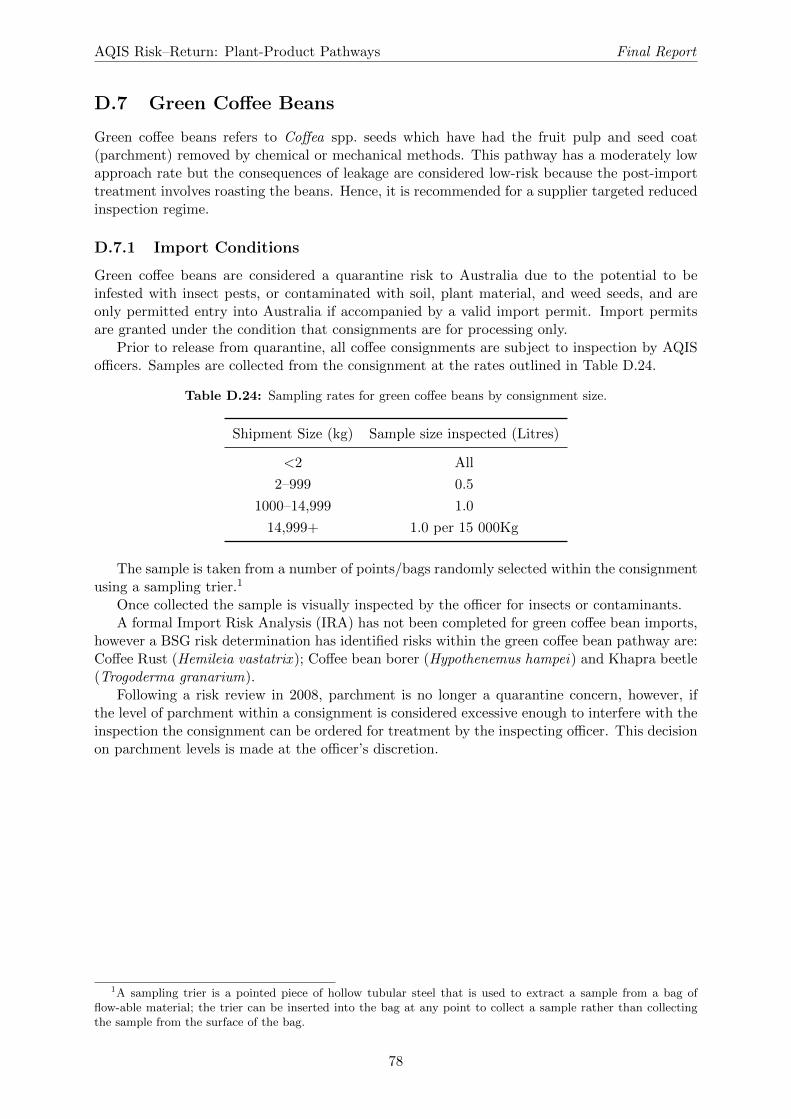
AQIS Risk–Return: Plant-Product Pathways Final Report
D.7 Green Coffee Beans
Green coffee beans refers to Coffea spp. seeds which have had the fruit pulp and seed coat(parchment) removed by chemical or mechanical methods. This pathway has a moderately lowapproach rate but the consequences of leakage are considered low-risk because the post-importtreatment involves roasting the beans. Hence, it is recommended for a supplier targeted reducedinspection regime.
D.7.1 Import Conditions
Green coffee beans are considered a quarantine risk to Australia due to the potential to beinfested with insect pests, or contaminated with soil, plant material, and weed seeds, and areonly permitted entry into Australia if accompanied by a valid import permit. Import permitsare granted under the condition that consignments are for processing only.
Prior to release from quarantine, all coffee consignments are subject to inspection by AQISofficers. Samples are collected from the consignment at the rates outlined in Table D.24.
Table D.24: Sampling rates for green coffee beans by consignment size.
Shipment Size (kg) Sample size inspected (Litres)
<2 All
2–999 0.5
1000–14,999 1.0
14,999+ 1.0 per 15 000Kg
The sample is taken from a number of points/bags randomly selected within the consignmentusing a sampling trier.1
Once collected the sample is visually inspected by the officer for insects or contaminants.A formal Import Risk Analysis (IRA) has not been completed for green coffee bean imports,
however a BSG risk determination has identified risks within the green coffee bean pathway are:Coffee Rust (Hemileia vastatrix ); Coffee bean borer (Hypothenemus hampei) and Khapra beetle(Trogoderma granarium).
Following a risk review in 2008, parchment is no longer a quarantine concern, however, ifthe level of parchment within a consignment is considered excessive enough to interfere with theinspection the consignment can be ordered for treatment by the inspecting officer. This decisionon parchment levels is made at the officer’s discretion.
1A sampling trier is a pointed piece of hollow tubular steel that is used to extract a sample from a bag offlow-able material; the trier can be inserted into the bag at any point to collect a sample rather than collectingthe sample from the surface of the bag.
78
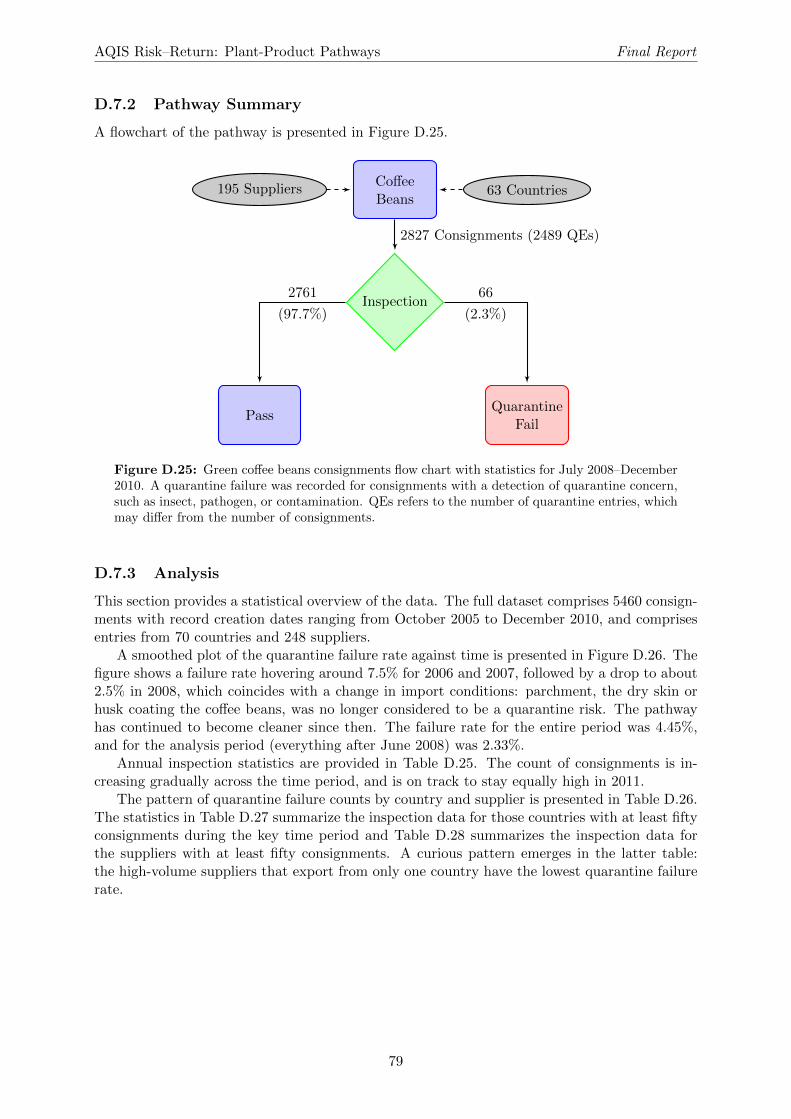
AQIS Risk–Return: Plant-Product Pathways Final Report
D.7.2 Pathway Summary
A flowchart of the pathway is presented in Figure D.25.
195 SuppliersCoffeeBeans
63 Countries
Inspection
PassQuarantine
Fail
2827 Consignments (2489 QEs)
2761
(97.7%)
66
(2.3%)
Figure D.25: Green coffee beans consignments flow chart with statistics for July 2008–December2010. A quarantine failure was recorded for consignments with a detection of quarantine concern,such as insect, pathogen, or contamination. QEs refers to the number of quarantine entries, whichmay differ from the number of consignments.
D.7.3 Analysis
This section provides a statistical overview of the data. The full dataset comprises 5460 consign-ments with record creation dates ranging from October 2005 to December 2010, and comprisesentries from 70 countries and 248 suppliers.
A smoothed plot of the quarantine failure rate against time is presented in Figure D.26. Thefigure shows a failure rate hovering around 7.5% for 2006 and 2007, followed by a drop to about2.5% in 2008, which coincides with a change in import conditions: parchment, the dry skin orhusk coating the coffee beans, was no longer considered to be a quarantine risk. The pathwayhas continued to become cleaner since then. The failure rate for the entire period was 4.45%,and for the analysis period (everything after June 2008) was 2.33%.
Annual inspection statistics are provided in Table D.25. The count of consignments is in-creasing gradually across the time period, and is on track to stay equally high in 2011.
The pattern of quarantine failure counts by country and supplier is presented in Table D.26.The statistics in Table D.27 summarize the inspection data for those countries with at least fiftyconsignments during the key time period and Table D.28 summarizes the inspection data forthe suppliers with at least fifty consignments. A curious pattern emerges in the latter table:the high-volume suppliers that export from only one country have the lowest quarantine failurerate.
79
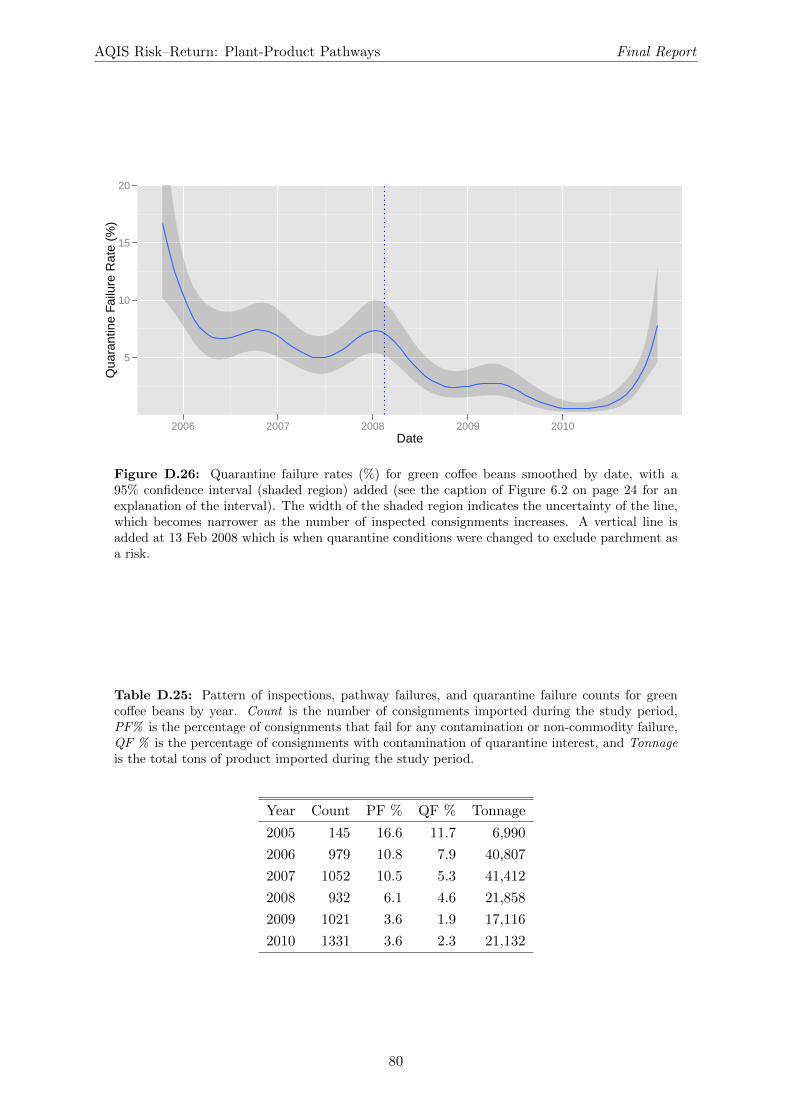
AQIS Risk–Return: Plant-Product Pathways Final Report
5
10
15
20
2006 2007 2008 2009 2010Date
Qua
rant
ine
Failu
re R
ate
(%)
Figure D.26: Quarantine failure rates (%) for green coffee beans smoothed by date, with a95% confidence interval (shaded region) added (see the caption of Figure 6.2 on page 24 for anexplanation of the interval). The width of the shaded region indicates the uncertainty of the line,which becomes narrower as the number of inspected consignments increases. A vertical line isadded at 13 Feb 2008 which is when quarantine conditions were changed to exclude parchment asa risk.
Table D.25: Pattern of inspections, pathway failures, and quarantine failure counts for greencoffee beans by year. Count is the number of consignments imported during the study period,PF% is the percentage of consignments that fail for any contamination or non-commodity failure,QF % is the percentage of consignments with contamination of quarantine interest, and Tonnageis the total tons of product imported during the study period.
Year Count PF % QF % Tonnage
2005 145 16.6 11.7 6,990
2006 979 10.8 7.9 40,807
2007 1052 10.5 5.3 41,412
2008 932 6.1 4.6 21,858
2009 1021 3.6 1.9 17,116
2010 1331 3.6 2.3 21,132
80
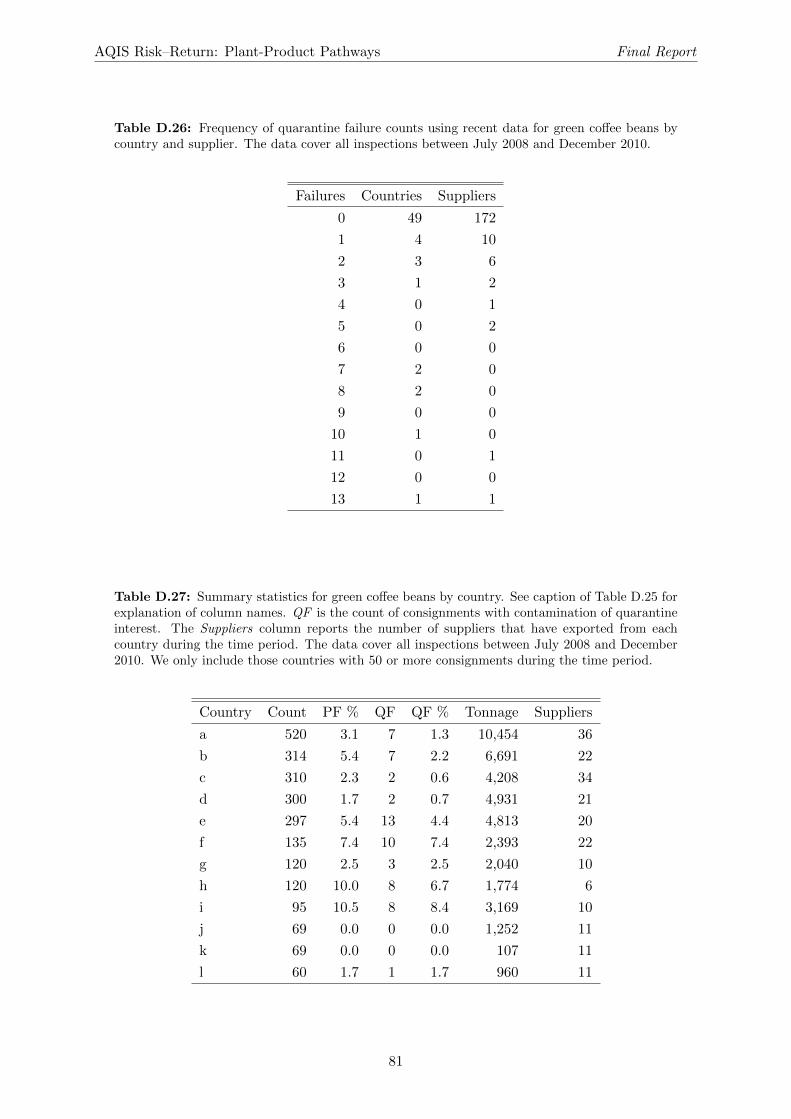
AQIS Risk–Return: Plant-Product Pathways Final Report
Table D.26: Frequency of quarantine failure counts using recent data for green coffee beans bycountry and supplier. The data cover all inspections between July 2008 and December 2010.
Failures Countries Suppliers
0 49 172
1 4 10
2 3 6
3 1 2
4 0 1
5 0 2
6 0 0
7 2 0
8 2 0
9 0 0
10 1 0
11 0 1
12 0 0
13 1 1
Table D.27: Summary statistics for green coffee beans by country. See caption of Table D.25 forexplanation of column names. QF is the count of consignments with contamination of quarantineinterest. The Suppliers column reports the number of suppliers that have exported from eachcountry during the time period. The data cover all inspections between July 2008 and December2010. We only include those countries with 50 or more consignments during the time period.
Country Count PF % QF QF % Tonnage Suppliers
a 520 3.1 7 1.3 10,454 36
b 314 5.4 7 2.2 6,691 22
c 310 2.3 2 0.6 4,208 34
d 300 1.7 2 0.7 4,931 21
e 297 5.4 13 4.4 4,813 20
f 135 7.4 10 7.4 2,393 22
g 120 2.5 3 2.5 2,040 10
h 120 10.0 8 6.7 1,774 6
i 95 10.5 8 8.4 3,169 10
j 69 0.0 0 0.0 1,252 11
k 69 0.0 0 0.0 107 11
l 60 1.7 1 1.7 960 11
81
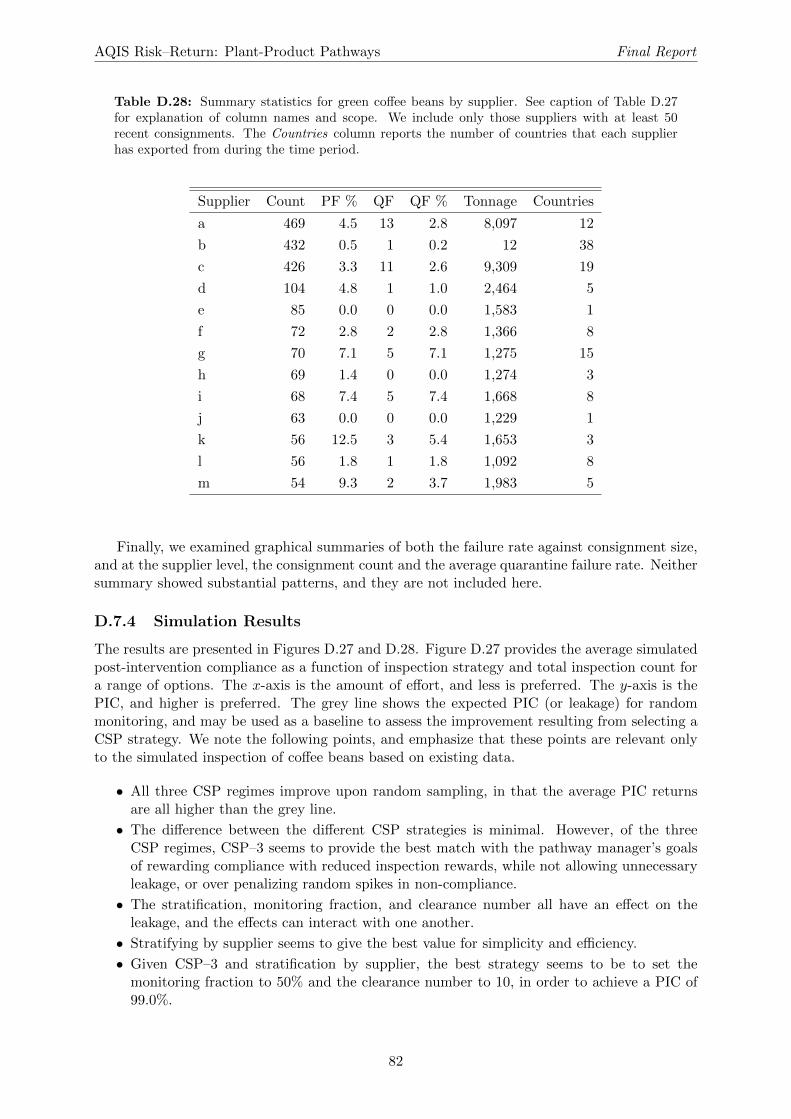
AQIS Risk–Return: Plant-Product Pathways Final Report
Table D.28: Summary statistics for green coffee beans by supplier. See caption of Table D.27for explanation of column names and scope. We include only those suppliers with at least 50recent consignments. The Countries column reports the number of countries that each supplierhas exported from during the time period.
Supplier Count PF % QF QF % Tonnage Countries
a 469 4.5 13 2.8 8,097 12
b 432 0.5 1 0.2 12 38
c 426 3.3 11 2.6 9,309 19
d 104 4.8 1 1.0 2,464 5
e 85 0.0 0 0.0 1,583 1
f 72 2.8 2 2.8 1,366 8
g 70 7.1 5 7.1 1,275 15
h 69 1.4 0 0.0 1,274 3
i 68 7.4 5 7.4 1,668 8
j 63 0.0 0 0.0 1,229 1
k 56 12.5 3 5.4 1,653 3
l 56 1.8 1 1.8 1,092 8
m 54 9.3 2 3.7 1,983 5
Finally, we examined graphical summaries of both the failure rate against consignment size,and at the supplier level, the consignment count and the average quarantine failure rate. Neithersummary showed substantial patterns, and they are not included here.
D.7.4 Simulation Results
The results are presented in Figures D.27 and D.28. Figure D.27 provides the average simulatedpost-intervention compliance as a function of inspection strategy and total inspection count fora range of options. The x-axis is the amount of effort, and less is preferred. The y-axis is thePIC, and higher is preferred. The grey line shows the expected PIC (or leakage) for randommonitoring, and may be used as a baseline to assess the improvement resulting from selecting aCSP strategy. We note the following points, and emphasize that these points are relevant onlyto the simulated inspection of coffee beans based on existing data.
• All three CSP regimes improve upon random sampling, in that the average PIC returnsare all higher than the grey line.
• The difference between the different CSP strategies is minimal. However, of the threeCSP regimes, CSP–3 seems to provide the best match with the pathway manager’s goalsof rewarding compliance with reduced inspection rewards, while not allowing unnecessaryleakage, or over penalizing random spikes in non-compliance.
• The stratification, monitoring fraction, and clearance number all have an effect on theleakage, and the effects can interact with one another.
• Stratifying by supplier seems to give the best value for simplicity and efficiency.
• Given CSP–3 and stratification by supplier, the best strategy seems to be to set themonitoring fraction to 50% and the clearance number to 10, in order to achieve a PIC of99.0%.
82
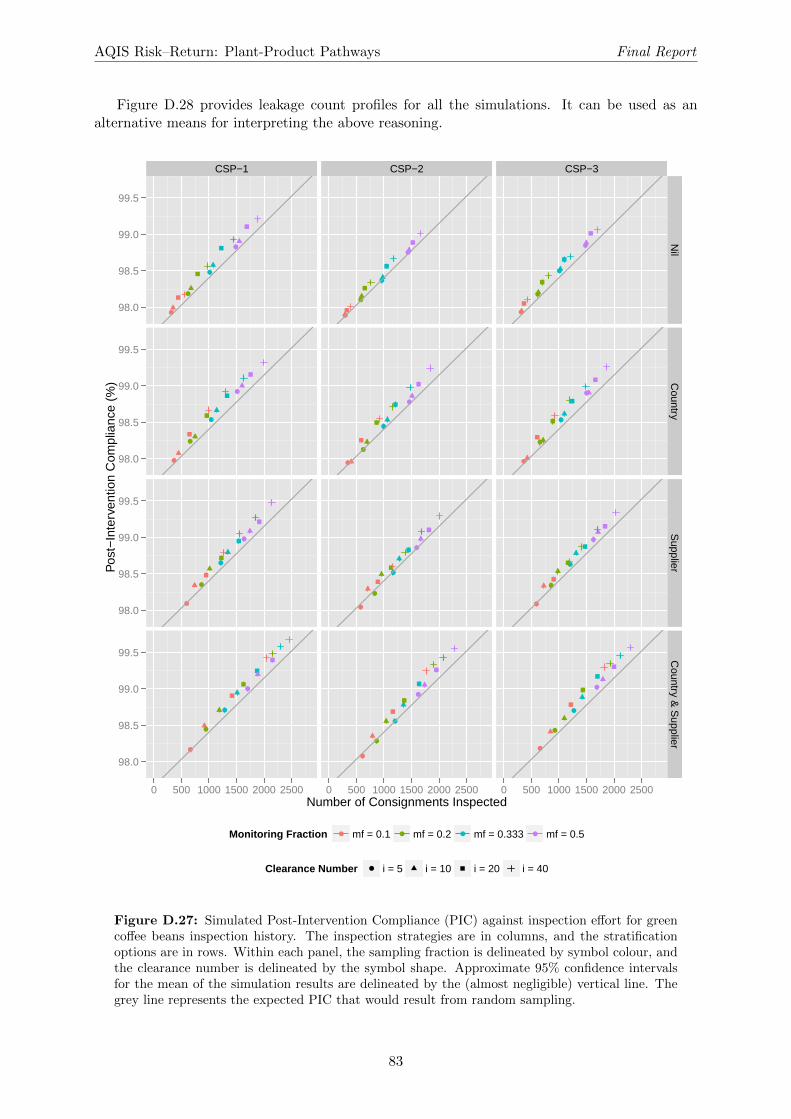
AQIS Risk–Return: Plant-Product Pathways Final Report
Figure D.28 provides leakage count profiles for all the simulations. It can be used as analternative means for interpreting the above reasoning.
CSP−1 CSP−2 CSP−3
98.0
98.5
99.0
99.5
98.0
98.5
99.0
99.5
98.0
98.5
99.0
99.5
98.0
98.5
99.0
99.5
●
●
●
●
●
●
●
●
●
●
●
●
●
●
●
●
●
●
●
●
●
●
●
●
●
●
●
●
●
●
●
●
●
●
●
●
●
●
●
●
●
●
●
●
●
●
●
●
Nil
Country
Supplier
Country &
Supplier
0 500 1000 1500 2000 2500 0 500 1000 1500 2000 2500 0 500 1000 1500 2000 2500Number of Consignments Inspected
Pos
t−In
terv
entio
n C
ompl
ianc
e (%
)
Monitoring Fraction ● ● ● ●mf = 0.1 mf = 0.2 mf = 0.333 mf = 0.5
Clearance Number ● i = 5 i = 10 i = 20 i = 40
Figure D.27: Simulated Post-Intervention Compliance (PIC) against inspection effort for greencoffee beans inspection history. The inspection strategies are in columns, and the stratificationoptions are in rows. Within each panel, the sampling fraction is delineated by symbol colour, andthe clearance number is delineated by the symbol shape. Approximate 95% confidence intervalsfor the mean of the simulation results are delineated by the (almost negligible) vertical line. Thegrey line represents the expected PIC that would result from random sampling.
83
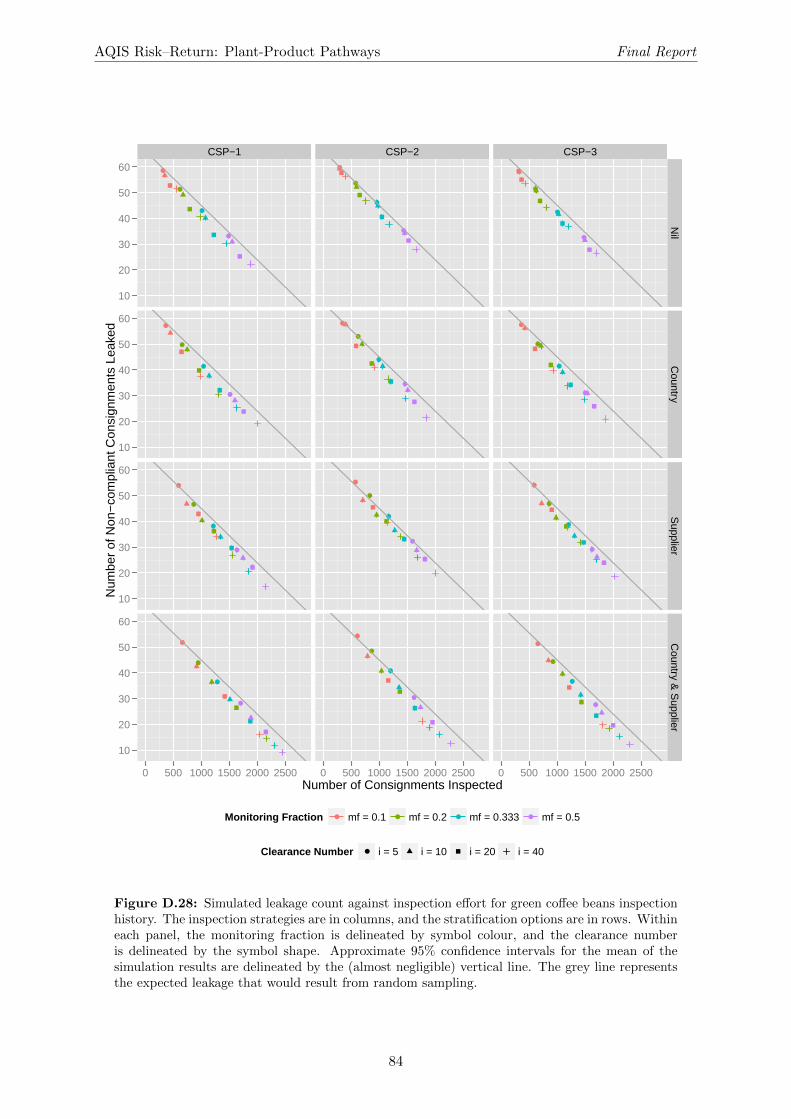
AQIS Risk–Return: Plant-Product Pathways Final Report
CSP−1 CSP−2 CSP−3
10
20
30
40
50
60
10
20
30
40
50
60
10
20
30
40
50
60
10
20
30
40
50
60
●
●
●
●
●
●
●
●
●
●
●
●
●
●
●
●
●
●
●
●
●
●
●
●
●
●
●
●
●
●
●
●
●
●
●
●
●
●
●
●
●
●
●
●
●
●
●
●
Nil
Country
Supplier
Country &
Supplier
0 500 1000 1500 2000 2500 0 500 1000 1500 2000 2500 0 500 1000 1500 2000 2500Number of Consignments Inspected
Num
ber
of N
on−
com
plia
nt C
onsi
gnm
ents
Lea
ked
Monitoring Fraction ● ● ● ●mf = 0.1 mf = 0.2 mf = 0.333 mf = 0.5
Clearance Number ● i = 5 i = 10 i = 20 i = 40
Figure D.28: Simulated leakage count against inspection effort for green coffee beans inspectionhistory. The inspection strategies are in columns, and the stratification options are in rows. Withineach panel, the monitoring fraction is delineated by symbol colour, and the clearance numberis delineated by the symbol shape. Approximate 95% confidence intervals for the mean of thesimulation results are delineated by the (almost negligible) vertical line. The grey line representsthe expected leakage that would result from random sampling.
84
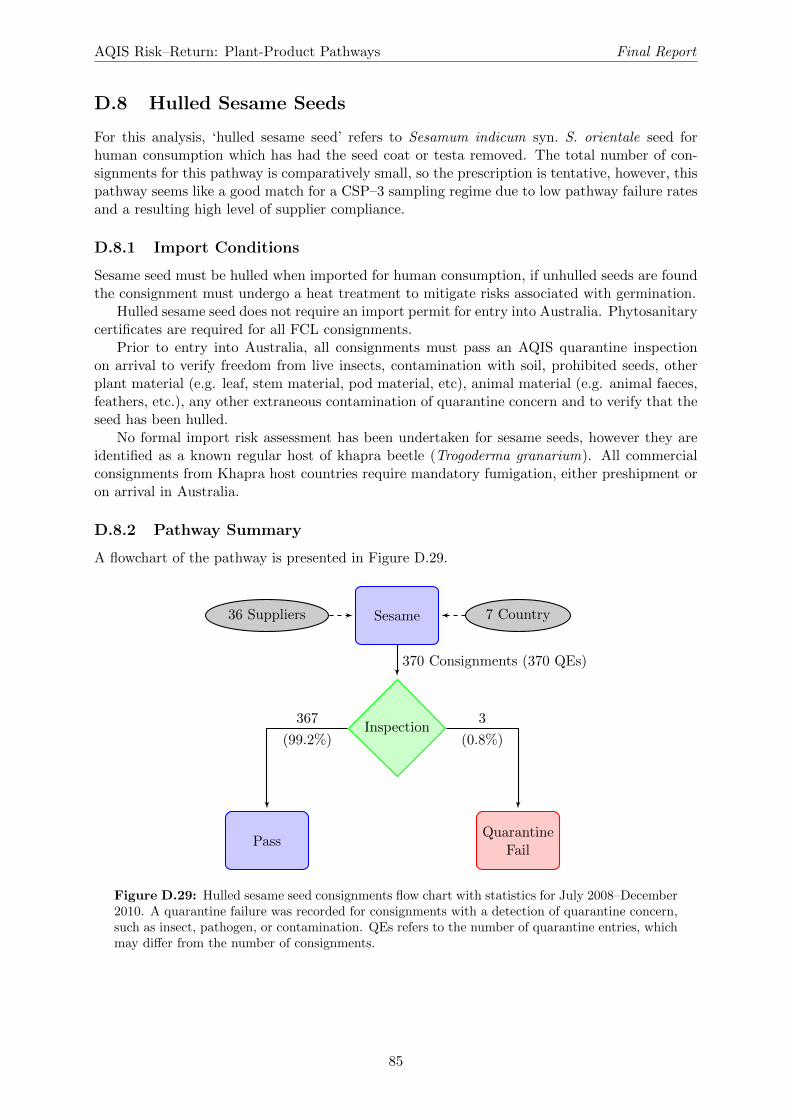
AQIS Risk–Return: Plant-Product Pathways Final Report
D.8 Hulled Sesame Seeds
For this analysis, ‘hulled sesame seed’ refers to Sesamum indicum syn. S. orientale seed forhuman consumption which has had the seed coat or testa removed. The total number of con-signments for this pathway is comparatively small, so the prescription is tentative, however, thispathway seems like a good match for a CSP–3 sampling regime due to low pathway failure ratesand a resulting high level of supplier compliance.
D.8.1 Import Conditions
Sesame seed must be hulled when imported for human consumption, if unhulled seeds are foundthe consignment must undergo a heat treatment to mitigate risks associated with germination.
Hulled sesame seed does not require an import permit for entry into Australia. Phytosanitarycertificates are required for all FCL consignments.
Prior to entry into Australia, all consignments must pass an AQIS quarantine inspectionon arrival to verify freedom from live insects, contamination with soil, prohibited seeds, otherplant material (e.g. leaf, stem material, pod material, etc), animal material (e.g. animal faeces,feathers, etc.), any other extraneous contamination of quarantine concern and to verify that theseed has been hulled.
No formal import risk assessment has been undertaken for sesame seeds, however they areidentified as a known regular host of khapra beetle (Trogoderma granarium). All commercialconsignments from Khapra host countries require mandatory fumigation, either preshipment oron arrival in Australia.
D.8.2 Pathway Summary
A flowchart of the pathway is presented in Figure D.29.
36 Suppliers Sesame 7 Country
Inspection
PassQuarantine
Fail
370 Consignments (370 QEs)
367
(99.2%)
3
(0.8%)
Figure D.29: Hulled sesame seed consignments flow chart with statistics for July 2008–December2010. A quarantine failure was recorded for consignments with a detection of quarantine concern,such as insect, pathogen, or contamination. QEs refers to the number of quarantine entries, whichmay differ from the number of consignments.
85
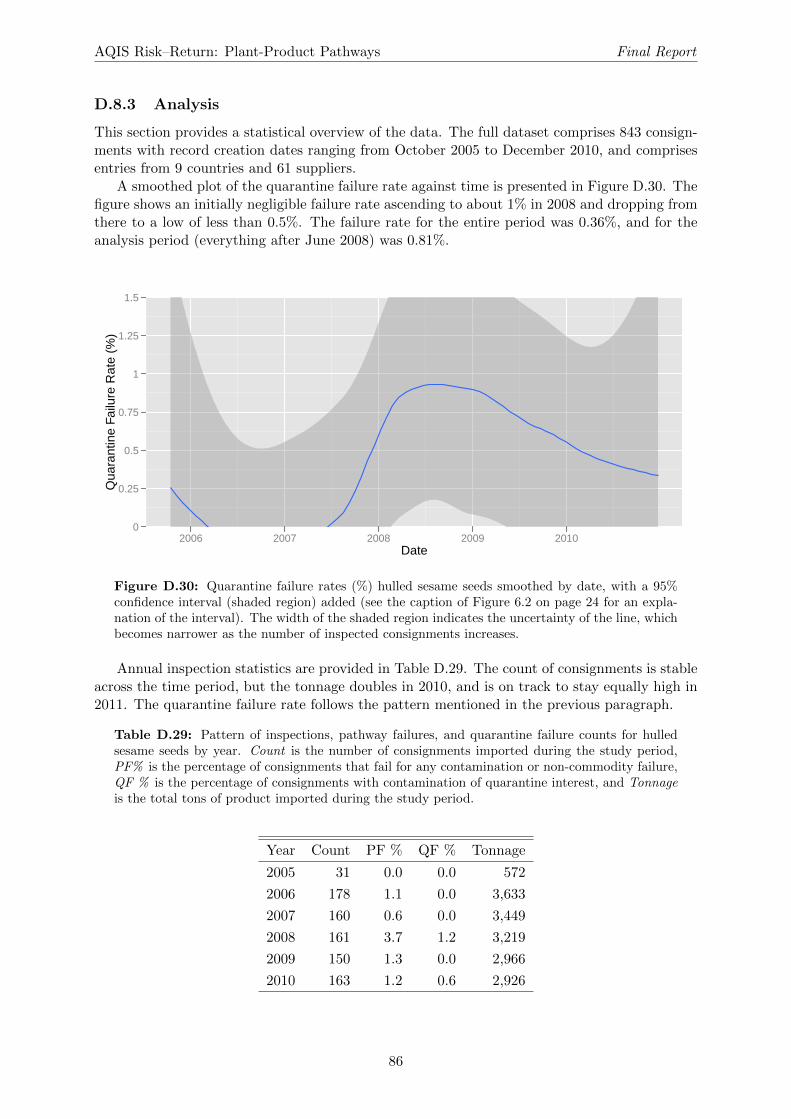
AQIS Risk–Return: Plant-Product Pathways Final Report
D.8.3 Analysis
This section provides a statistical overview of the data. The full dataset comprises 843 consign-ments with record creation dates ranging from October 2005 to December 2010, and comprisesentries from 9 countries and 61 suppliers.
A smoothed plot of the quarantine failure rate against time is presented in Figure D.30. Thefigure shows an initially negligible failure rate ascending to about 1% in 2008 and dropping fromthere to a low of less than 0.5%. The failure rate for the entire period was 0.36%, and for theanalysis period (everything after June 2008) was 0.81%.
0
0.25
0.5
0.75
1
1.25
1.5
2006 2007 2008 2009 2010Date
Qua
rant
ine
Failu
re R
ate
(%)
Figure D.30: Quarantine failure rates (%) hulled sesame seeds smoothed by date, with a 95%confidence interval (shaded region) added (see the caption of Figure 6.2 on page 24 for an expla-nation of the interval). The width of the shaded region indicates the uncertainty of the line, whichbecomes narrower as the number of inspected consignments increases.
Annual inspection statistics are provided in Table D.29. The count of consignments is stableacross the time period, but the tonnage doubles in 2010, and is on track to stay equally high in2011. The quarantine failure rate follows the pattern mentioned in the previous paragraph.
Table D.29: Pattern of inspections, pathway failures, and quarantine failure counts for hulledsesame seeds by year. Count is the number of consignments imported during the study period,PF% is the percentage of consignments that fail for any contamination or non-commodity failure,QF % is the percentage of consignments with contamination of quarantine interest, and Tonnageis the total tons of product imported during the study period.
Year Count PF % QF % Tonnage
2005 31 0.0 0.0 572
2006 178 1.1 0.0 3,633
2007 160 0.6 0.0 3,449
2008 161 3.7 1.2 3,219
2009 150 1.3 0.0 2,966
2010 163 1.2 0.6 2,926
86
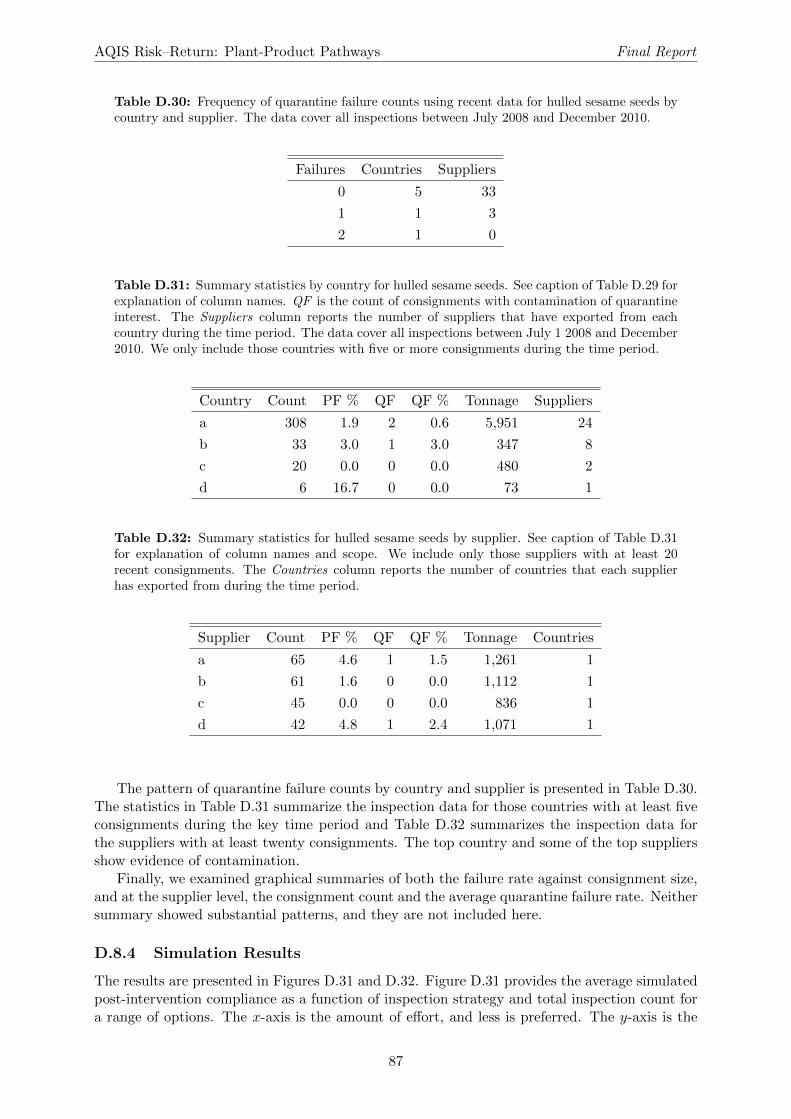
AQIS Risk–Return: Plant-Product Pathways Final Report
Table D.30: Frequency of quarantine failure counts using recent data for hulled sesame seeds bycountry and supplier. The data cover all inspections between July 2008 and December 2010.
Failures Countries Suppliers
0 5 33
1 1 3
2 1 0
Table D.31: Summary statistics by country for hulled sesame seeds. See caption of Table D.29 forexplanation of column names. QF is the count of consignments with contamination of quarantineinterest. The Suppliers column reports the number of suppliers that have exported from eachcountry during the time period. The data cover all inspections between July 1 2008 and December2010. We only include those countries with five or more consignments during the time period.
Country Count PF % QF QF % Tonnage Suppliers
a 308 1.9 2 0.6 5,951 24
b 33 3.0 1 3.0 347 8
c 20 0.0 0 0.0 480 2
d 6 16.7 0 0.0 73 1
Table D.32: Summary statistics for hulled sesame seeds by supplier. See caption of Table D.31for explanation of column names and scope. We include only those suppliers with at least 20recent consignments. The Countries column reports the number of countries that each supplierhas exported from during the time period.
Supplier Count PF % QF QF % Tonnage Countries
a 65 4.6 1 1.5 1,261 1
b 61 1.6 0 0.0 1,112 1
c 45 0.0 0 0.0 836 1
d 42 4.8 1 2.4 1,071 1
The pattern of quarantine failure counts by country and supplier is presented in Table D.30.The statistics in Table D.31 summarize the inspection data for those countries with at least fiveconsignments during the key time period and Table D.32 summarizes the inspection data forthe suppliers with at least twenty consignments. The top country and some of the top suppliersshow evidence of contamination.
Finally, we examined graphical summaries of both the failure rate against consignment size,and at the supplier level, the consignment count and the average quarantine failure rate. Neithersummary showed substantial patterns, and they are not included here.
D.8.4 Simulation Results
The results are presented in Figures D.31 and D.32. Figure D.31 provides the average simulatedpost-intervention compliance as a function of inspection strategy and total inspection count fora range of options. The x-axis is the amount of effort, and less is preferred. The y-axis is the
87
AQIS Risk–Return: Plant-Product Pathways Final Report
PIC, and higher is preferred. The grey line shows the expected PIC (or leakage) for randommonitoring, and may be used as a baseline to assess the improvement resulting from selecting aCSP strategy. We note the following points, and emphasize that these points are relevant onlyto the simulated inspection of sesame based on existing data.
• All three CSP regimes improve upon random sampling, in that the average PIC returnsare all substantially higher than the grey line.
• The difference between the different CSP strategies is minimal. However, of the threeCSP regimes, CSP–3 seems to provide the best match with the pathway manager’s goalsof rewarding compliance with reduced inspection rewards, while not allowing unnecessaryleakage, or over penalizing random spikes in non-compliance.
• The stratification, monitoring fraction, and clearance number all have an effect on theleakage, and the effects can interact with one another.
• Stratifying by supplier seems to give the best value for simplicity and efficiency.
• Given CSP–3 and stratification by supplier, the best strategy seems to be to set themonitoring fraction to 0.5 and the clearance number to 10, in order to achieve a PIC of99.83%.
Figure D.32 provides leakage count profiles for all the simulations. It can be used as analternative means for interpreting the above reasoning.
88
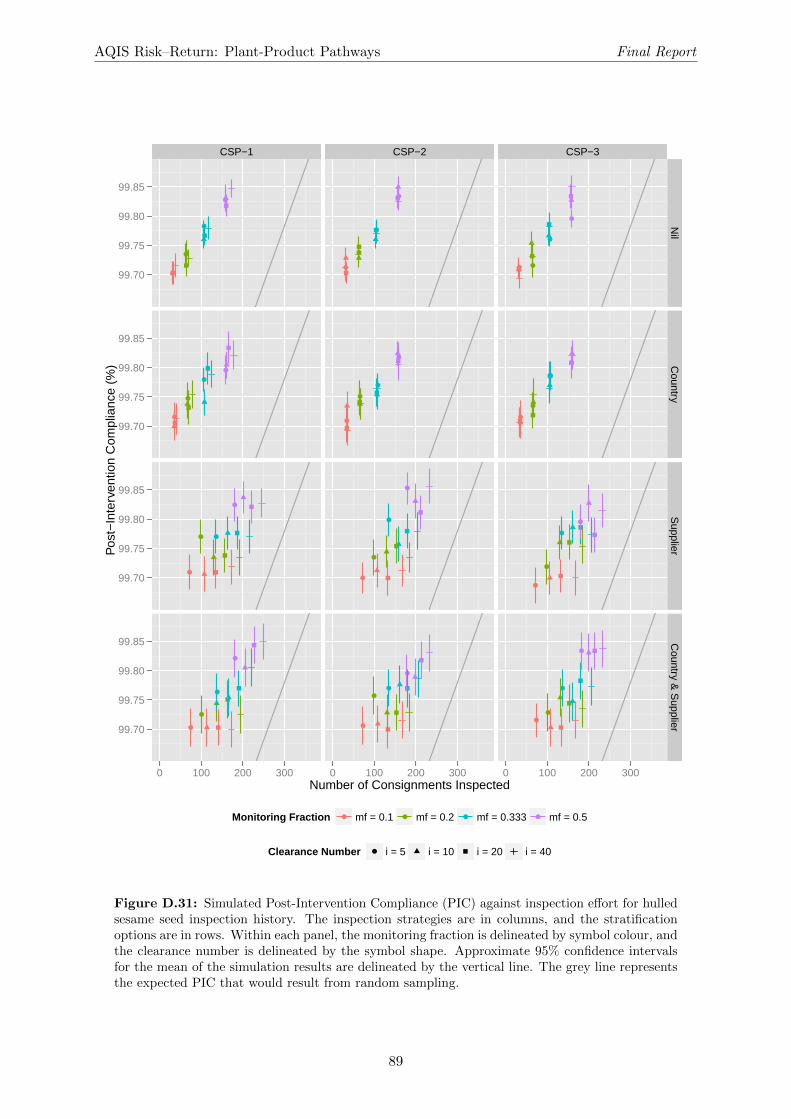
AQIS Risk–Return: Plant-Product Pathways Final Report
CSP−1 CSP−2 CSP−3
99.70
99.75
99.80
99.85
99.70
99.75
99.80
99.85
99.70
99.75
99.80
99.85
99.70
99.75
99.80
99.85
●
●
●
●
●
●
●
●
●
● ●
●
●
●
●
●
●
●
●
●
●
●
●
●
●
●
●
●
●
●
●
●
● ●
●
●
●
●
●
●
●
●
●
●
●
●
●
●
Nil
Country
Supplier
Country &
Supplier
0 100 200 300 0 100 200 300 0 100 200 300Number of Consignments Inspected
Pos
t−In
terv
entio
n C
ompl
ianc
e (%
)
Monitoring Fraction ● ● ● ●mf = 0.1 mf = 0.2 mf = 0.333 mf = 0.5
Clearance Number ● i = 5 i = 10 i = 20 i = 40
Figure D.31: Simulated Post-Intervention Compliance (PIC) against inspection effort for hulledsesame seed inspection history. The inspection strategies are in columns, and the stratificationoptions are in rows. Within each panel, the monitoring fraction is delineated by symbol colour, andthe clearance number is delineated by the symbol shape. Approximate 95% confidence intervalsfor the mean of the simulation results are delineated by the vertical line. The grey line representsthe expected PIC that would result from random sampling.
89

AQIS Risk–Return: Plant-Product Pathways Final Report
CSP−1 CSP−2 CSP−3
0.4
0.6
0.8
1.0
0.4
0.6
0.8
1.0
0.4
0.6
0.8
1.0
0.4
0.6
0.8
1.0
●
●
●
●
●
●
●
●
●
● ●
●
●
●
●
●
●
●
●
●
●
●
●
●
●
●
●
●
●
●●
●
● ●
●
●
●
●
●
●
●
●
●
●
●●
●
●
Nil
Country
Supplier
Country &
Supplier
0 100 200 300 0 100 200 300 0 100 200 300Number of Consignments Inspected
Num
ber
of N
on−
com
plia
nt C
onsi
gnm
ents
Lea
ked
Monitoring Fraction ● ● ● ●mf = 0.1 mf = 0.2 mf = 0.333 mf = 0.5
Clearance Number ● i = 5 i = 10 i = 20 i = 40
Figure D.32: Simulated leakage count against inspection effort for hulled sesame seed inspectionhistory. The inspection strategies are in columns, and the stratification options are in rows.Within each panel, the monitoring fraction is delineated by symbol colour, and the clearancenumber is delineated by the symbol shape. Approximate 95% confidence intervals for the meanof the simulation results are delineated by the vertical line. The grey line represents the expectedleakage that would result from random sampling.
90
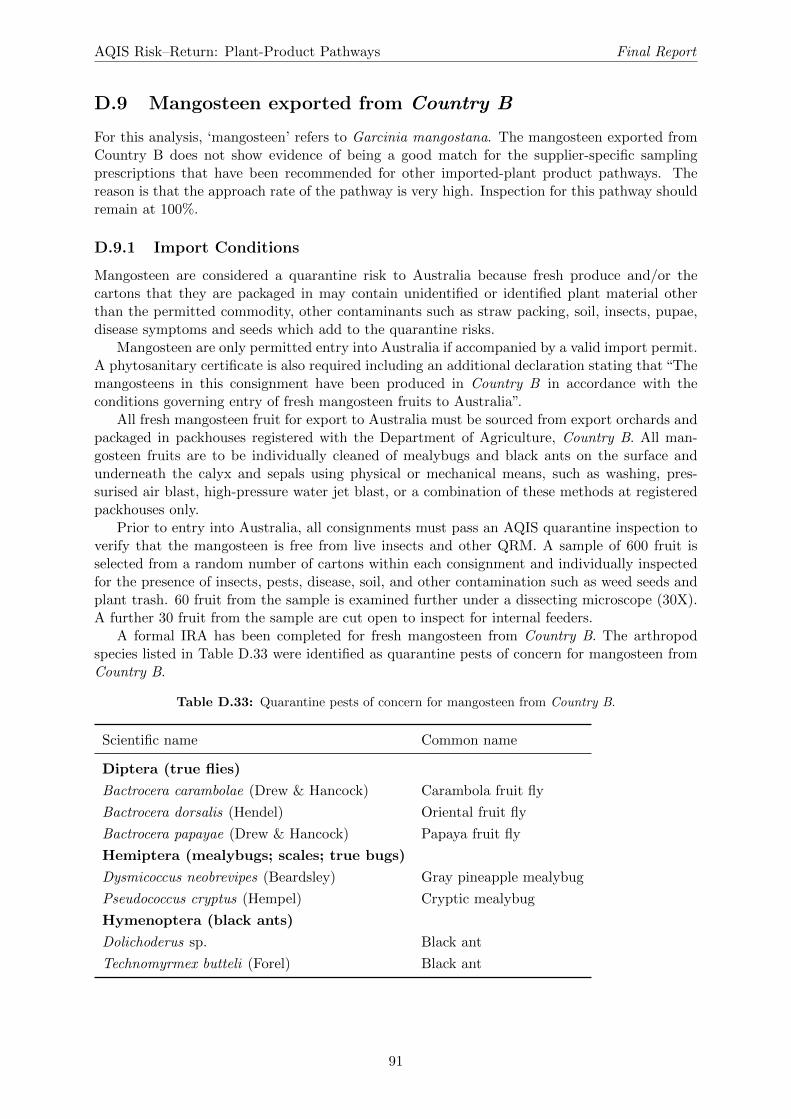
AQIS Risk–Return: Plant-Product Pathways Final Report
D.9 Mangosteen exported from Country B
For this analysis, ‘mangosteen’ refers to Garcinia mangostana. The mangosteen exported fromCountry B does not show evidence of being a good match for the supplier-specific samplingprescriptions that have been recommended for other imported-plant product pathways. Thereason is that the approach rate of the pathway is very high. Inspection for this pathway shouldremain at 100%.
D.9.1 Import Conditions
Mangosteen are considered a quarantine risk to Australia because fresh produce and/or thecartons that they are packaged in may contain unidentified or identified plant material otherthan the permitted commodity, other contaminants such as straw packing, soil, insects, pupae,disease symptoms and seeds which add to the quarantine risks.
Mangosteen are only permitted entry into Australia if accompanied by a valid import permit.A phytosanitary certificate is also required including an additional declaration stating that “Themangosteens in this consignment have been produced in Country B in accordance with theconditions governing entry of fresh mangosteen fruits to Australia”.
All fresh mangosteen fruit for export to Australia must be sourced from export orchards andpackaged in packhouses registered with the Department of Agriculture, Country B. All man-gosteen fruits are to be individually cleaned of mealybugs and black ants on the surface andunderneath the calyx and sepals using physical or mechanical means, such as washing, pres-surised air blast, high-pressure water jet blast, or a combination of these methods at registeredpackhouses only.
Prior to entry into Australia, all consignments must pass an AQIS quarantine inspection toverify that the mangosteen is free from live insects and other QRM. A sample of 600 fruit isselected from a random number of cartons within each consignment and individually inspectedfor the presence of insects, pests, disease, soil, and other contamination such as weed seeds andplant trash. 60 fruit from the sample is examined further under a dissecting microscope (30X).A further 30 fruit from the sample are cut open to inspect for internal feeders.
A formal IRA has been completed for fresh mangosteen from Country B. The arthropodspecies listed in Table D.33 were identified as quarantine pests of concern for mangosteen fromCountry B.
Table D.33: Quarantine pests of concern for mangosteen from Country B.
Scientific name Common name
Diptera (true flies)
Bactrocera carambolae (Drew & Hancock) Carambola fruit fly
Bactrocera dorsalis (Hendel) Oriental fruit fly
Bactrocera papayae (Drew & Hancock) Papaya fruit fly
Hemiptera (mealybugs; scales; true bugs)
Dysmicoccus neobrevipes (Beardsley) Gray pineapple mealybug
Pseudococcus cryptus (Hempel) Cryptic mealybug
Hymenoptera (black ants)
Dolichoderus sp. Black ant
Technomyrmex butteli (Forel) Black ant
91
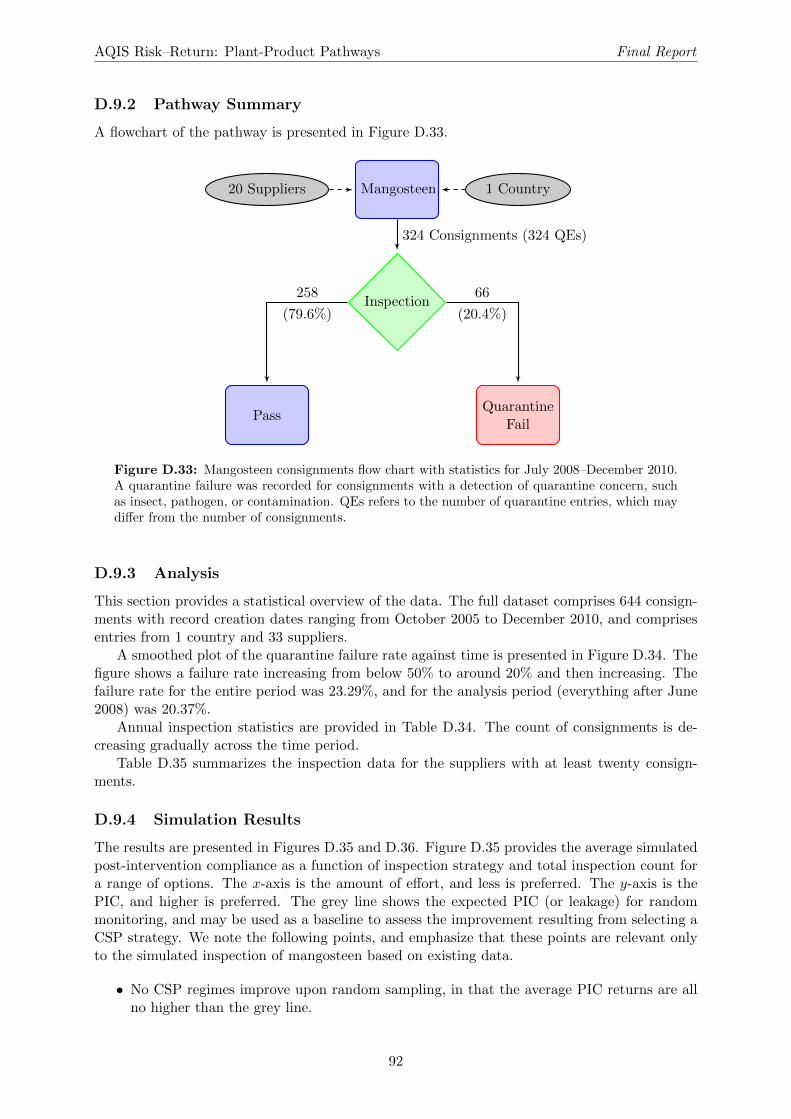
AQIS Risk–Return: Plant-Product Pathways Final Report
D.9.2 Pathway Summary
A flowchart of the pathway is presented in Figure D.33.
20 Suppliers Mangosteen 1 Country
Inspection
PassQuarantine
Fail
324 Consignments (324 QEs)
258
(79.6%)
66
(20.4%)
Figure D.33: Mangosteen consignments flow chart with statistics for July 2008–December 2010.A quarantine failure was recorded for consignments with a detection of quarantine concern, suchas insect, pathogen, or contamination. QEs refers to the number of quarantine entries, which maydiffer from the number of consignments.
D.9.3 Analysis
This section provides a statistical overview of the data. The full dataset comprises 644 consign-ments with record creation dates ranging from October 2005 to December 2010, and comprisesentries from 1 country and 33 suppliers.
A smoothed plot of the quarantine failure rate against time is presented in Figure D.34. Thefigure shows a failure rate increasing from below 50% to around 20% and then increasing. Thefailure rate for the entire period was 23.29%, and for the analysis period (everything after June2008) was 20.37%.
Annual inspection statistics are provided in Table D.34. The count of consignments is de-creasing gradually across the time period.
Table D.35 summarizes the inspection data for the suppliers with at least twenty consign-ments.
D.9.4 Simulation Results
The results are presented in Figures D.35 and D.36. Figure D.35 provides the average simulatedpost-intervention compliance as a function of inspection strategy and total inspection count fora range of options. The x-axis is the amount of effort, and less is preferred. The y-axis is thePIC, and higher is preferred. The grey line shows the expected PIC (or leakage) for randommonitoring, and may be used as a baseline to assess the improvement resulting from selecting aCSP strategy. We note the following points, and emphasize that these points are relevant onlyto the simulated inspection of mangosteen based on existing data.
• No CSP regimes improve upon random sampling, in that the average PIC returns are allno higher than the grey line.
92
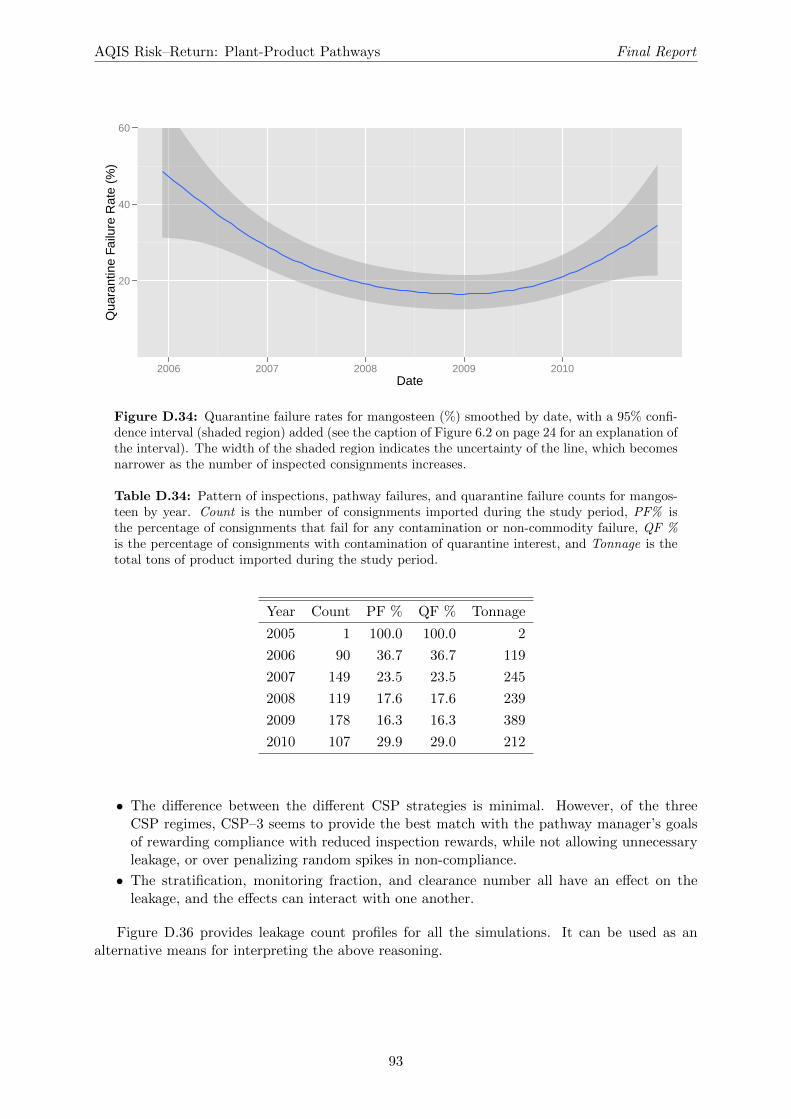
AQIS Risk–Return: Plant-Product Pathways Final Report
20
40
60
2006 2007 2008 2009 2010Date
Qua
rant
ine
Failu
re R
ate
(%)
Figure D.34: Quarantine failure rates for mangosteen (%) smoothed by date, with a 95% confi-dence interval (shaded region) added (see the caption of Figure 6.2 on page 24 for an explanation ofthe interval). The width of the shaded region indicates the uncertainty of the line, which becomesnarrower as the number of inspected consignments increases.
Table D.34: Pattern of inspections, pathway failures, and quarantine failure counts for mangos-teen by year. Count is the number of consignments imported during the study period, PF% isthe percentage of consignments that fail for any contamination or non-commodity failure, QF %is the percentage of consignments with contamination of quarantine interest, and Tonnage is thetotal tons of product imported during the study period.
Year Count PF % QF % Tonnage
2005 1 100.0 100.0 2
2006 90 36.7 36.7 119
2007 149 23.5 23.5 245
2008 119 17.6 17.6 239
2009 178 16.3 16.3 389
2010 107 29.9 29.0 212
• The difference between the different CSP strategies is minimal. However, of the threeCSP regimes, CSP–3 seems to provide the best match with the pathway manager’s goalsof rewarding compliance with reduced inspection rewards, while not allowing unnecessaryleakage, or over penalizing random spikes in non-compliance.
• The stratification, monitoring fraction, and clearance number all have an effect on theleakage, and the effects can interact with one another.
Figure D.36 provides leakage count profiles for all the simulations. It can be used as analternative means for interpreting the above reasoning.
93
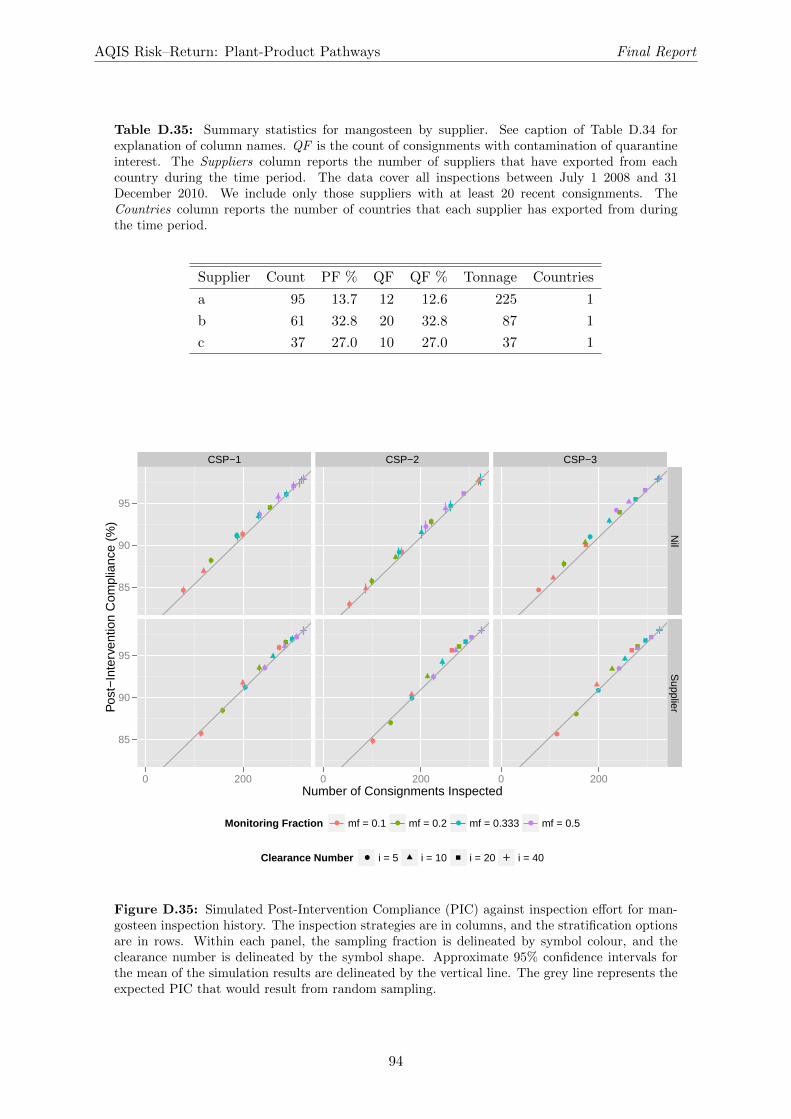
AQIS Risk–Return: Plant-Product Pathways Final Report
Table D.35: Summary statistics for mangosteen by supplier. See caption of Table D.34 forexplanation of column names. QF is the count of consignments with contamination of quarantineinterest. The Suppliers column reports the number of suppliers that have exported from eachcountry during the time period. The data cover all inspections between July 1 2008 and 31December 2010. We include only those suppliers with at least 20 recent consignments. TheCountries column reports the number of countries that each supplier has exported from duringthe time period.
Supplier Count PF % QF QF % Tonnage Countries
a 95 13.7 12 12.6 225 1
b 61 32.8 20 32.8 87 1
c 37 27.0 10 27.0 37 1
CSP−1 CSP−2 CSP−3
85
90
95
85
90
95
●
●
●
●
●
●
●
●
●
●
●
●
●
●
●
●
●
●
●
●
●
●
●
●
Nil
Supplier
0 200 0 200 0 200Number of Consignments Inspected
Pos
t−In
terv
entio
n C
ompl
ianc
e (%
)
Monitoring Fraction ● ● ● ●mf = 0.1 mf = 0.2 mf = 0.333 mf = 0.5
Clearance Number ● i = 5 i = 10 i = 20 i = 40
Figure D.35: Simulated Post-Intervention Compliance (PIC) against inspection effort for man-gosteen inspection history. The inspection strategies are in columns, and the stratification optionsare in rows. Within each panel, the sampling fraction is delineated by symbol colour, and theclearance number is delineated by the symbol shape. Approximate 95% confidence intervals forthe mean of the simulation results are delineated by the vertical line. The grey line represents theexpected PIC that would result from random sampling.
94
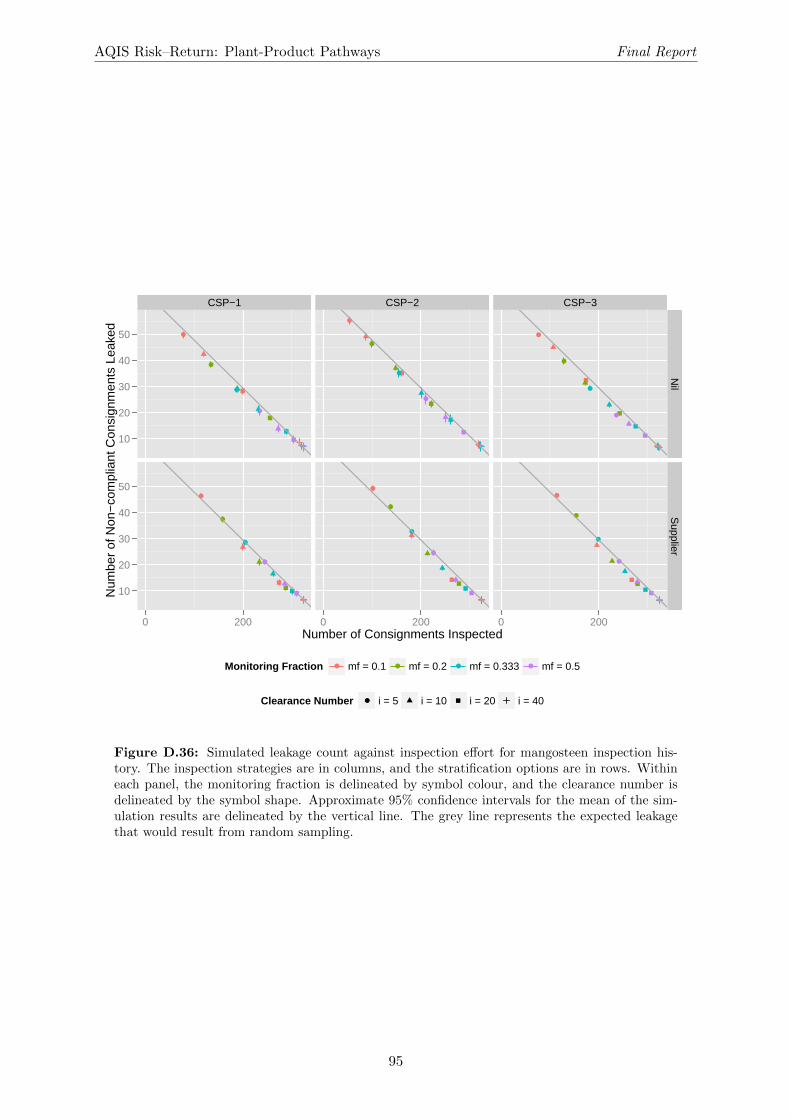
AQIS Risk–Return: Plant-Product Pathways Final Report
CSP−1 CSP−2 CSP−3
10
20
30
40
50
10
20
30
40
50
●
●
●
●
●
●
●
●
●
●
●
●
●
●
●
●
●
●
●
●
●
●
●
●
Nil
Supplier
0 200 0 200 0 200Number of Consignments Inspected
Num
ber
of N
on−
com
plia
nt C
onsi
gnm
ents
Lea
ked
Monitoring Fraction ● ● ● ●mf = 0.1 mf = 0.2 mf = 0.333 mf = 0.5
Clearance Number ● i = 5 i = 10 i = 20 i = 40
Figure D.36: Simulated leakage count against inspection effort for mangosteen inspection his-tory. The inspection strategies are in columns, and the stratification options are in rows. Withineach panel, the monitoring fraction is delineated by symbol colour, and the clearance number isdelineated by the symbol shape. Approximate 95% confidence intervals for the mean of the sim-ulation results are delineated by the vertical line. The grey line represents the expected leakagethat would result from random sampling.
95

Appendix E
List of Tables and Figures
96
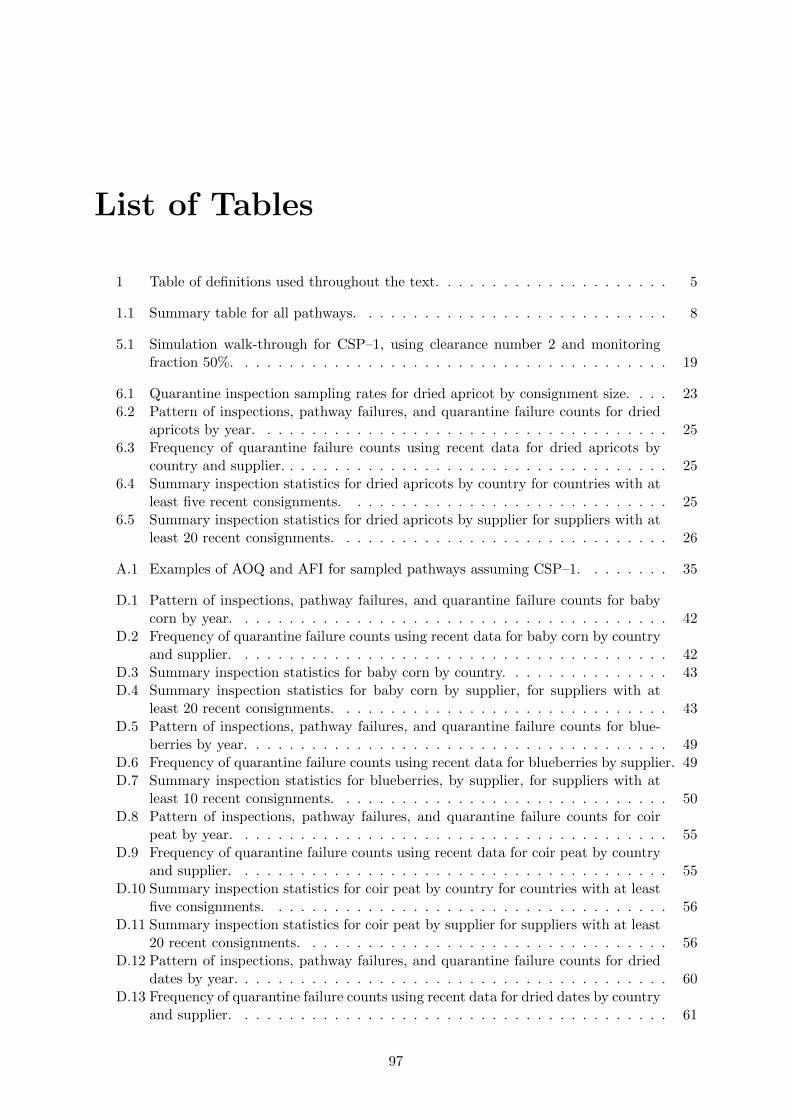
List of Tables
1 Table of definitions used throughout the text. . . . . . . . . . . . . . . . . . . . . 5
1.1 Summary table for all pathways. . . . . . . . . . . . . . . . . . . . . . . . . . . . 8
5.1 Simulation walk-through for CSP–1, using clearance number 2 and monitoringfraction 50%. . . . . . . . . . . . . . . . . . . . . . . . . . . . . . . . . . . . . . . 19
6.1 Quarantine inspection sampling rates for dried apricot by consignment size. . . . 236.2 Pattern of inspections, pathway failures, and quarantine failure counts for dried
apricots by year. . . . . . . . . . . . . . . . . . . . . . . . . . . . . . . . . . . . . 256.3 Frequency of quarantine failure counts using recent data for dried apricots by
country and supplier. . . . . . . . . . . . . . . . . . . . . . . . . . . . . . . . . . . 256.4 Summary inspection statistics for dried apricots by country for countries with at
least five recent consignments. . . . . . . . . . . . . . . . . . . . . . . . . . . . . 256.5 Summary inspection statistics for dried apricots by supplier for suppliers with at
least 20 recent consignments. . . . . . . . . . . . . . . . . . . . . . . . . . . . . . 26
A.1 Examples of AOQ and AFI for sampled pathways assuming CSP–1. . . . . . . . 35
D.1 Pattern of inspections, pathway failures, and quarantine failure counts for babycorn by year. . . . . . . . . . . . . . . . . . . . . . . . . . . . . . . . . . . . . . . 42
D.2 Frequency of quarantine failure counts using recent data for baby corn by countryand supplier. . . . . . . . . . . . . . . . . . . . . . . . . . . . . . . . . . . . . . . 42
D.3 Summary inspection statistics for baby corn by country. . . . . . . . . . . . . . . 43D.4 Summary inspection statistics for baby corn by supplier, for suppliers with at
least 20 recent consignments. . . . . . . . . . . . . . . . . . . . . . . . . . . . . . 43D.5 Pattern of inspections, pathway failures, and quarantine failure counts for blue-
berries by year. . . . . . . . . . . . . . . . . . . . . . . . . . . . . . . . . . . . . . 49D.6 Frequency of quarantine failure counts using recent data for blueberries by supplier. 49D.7 Summary inspection statistics for blueberries, by supplier, for suppliers with at
least 10 recent consignments. . . . . . . . . . . . . . . . . . . . . . . . . . . . . . 50D.8 Pattern of inspections, pathway failures, and quarantine failure counts for coir
peat by year. . . . . . . . . . . . . . . . . . . . . . . . . . . . . . . . . . . . . . . 55D.9 Frequency of quarantine failure counts using recent data for coir peat by country
and supplier. . . . . . . . . . . . . . . . . . . . . . . . . . . . . . . . . . . . . . . 55D.10 Summary inspection statistics for coir peat by country for countries with at least
five consignments. . . . . . . . . . . . . . . . . . . . . . . . . . . . . . . . . . . . 56D.11 Summary inspection statistics for coir peat by supplier for suppliers with at least
20 recent consignments. . . . . . . . . . . . . . . . . . . . . . . . . . . . . . . . . 56D.12 Pattern of inspections, pathway failures, and quarantine failure counts for dried
dates by year. . . . . . . . . . . . . . . . . . . . . . . . . . . . . . . . . . . . . . . 60D.13 Frequency of quarantine failure counts using recent data for dried dates by country
and supplier. . . . . . . . . . . . . . . . . . . . . . . . . . . . . . . . . . . . . . . 61
97
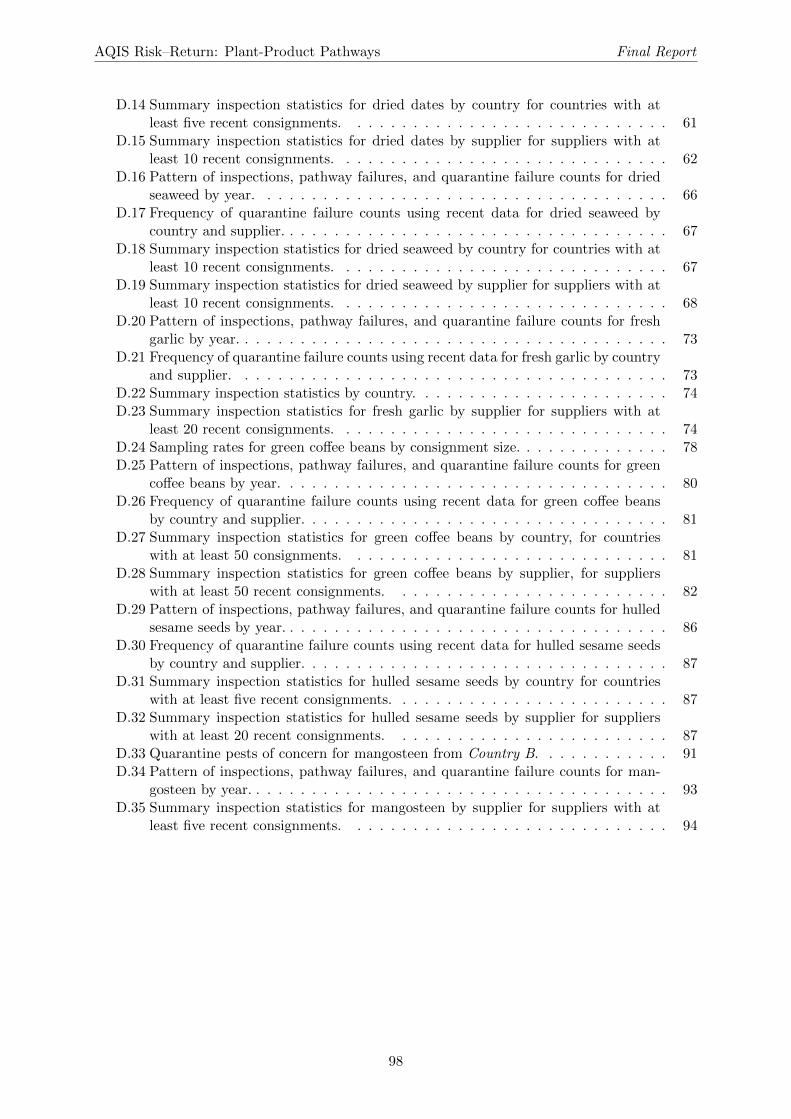
AQIS Risk–Return: Plant-Product Pathways Final Report
D.14 Summary inspection statistics for dried dates by country for countries with atleast five recent consignments. . . . . . . . . . . . . . . . . . . . . . . . . . . . . 61
D.15 Summary inspection statistics for dried dates by supplier for suppliers with atleast 10 recent consignments. . . . . . . . . . . . . . . . . . . . . . . . . . . . . . 62
D.16 Pattern of inspections, pathway failures, and quarantine failure counts for driedseaweed by year. . . . . . . . . . . . . . . . . . . . . . . . . . . . . . . . . . . . . 66
D.17 Frequency of quarantine failure counts using recent data for dried seaweed bycountry and supplier. . . . . . . . . . . . . . . . . . . . . . . . . . . . . . . . . . . 67
D.18 Summary inspection statistics for dried seaweed by country for countries with atleast 10 recent consignments. . . . . . . . . . . . . . . . . . . . . . . . . . . . . . 67
D.19 Summary inspection statistics for dried seaweed by supplier for suppliers with atleast 10 recent consignments. . . . . . . . . . . . . . . . . . . . . . . . . . . . . . 68
D.20 Pattern of inspections, pathway failures, and quarantine failure counts for freshgarlic by year. . . . . . . . . . . . . . . . . . . . . . . . . . . . . . . . . . . . . . . 73
D.21 Frequency of quarantine failure counts using recent data for fresh garlic by countryand supplier. . . . . . . . . . . . . . . . . . . . . . . . . . . . . . . . . . . . . . . 73
D.22 Summary inspection statistics by country. . . . . . . . . . . . . . . . . . . . . . . 74D.23 Summary inspection statistics for fresh garlic by supplier for suppliers with at
least 20 recent consignments. . . . . . . . . . . . . . . . . . . . . . . . . . . . . . 74D.24 Sampling rates for green coffee beans by consignment size. . . . . . . . . . . . . . 78D.25 Pattern of inspections, pathway failures, and quarantine failure counts for green
coffee beans by year. . . . . . . . . . . . . . . . . . . . . . . . . . . . . . . . . . . 80D.26 Frequency of quarantine failure counts using recent data for green coffee beans
by country and supplier. . . . . . . . . . . . . . . . . . . . . . . . . . . . . . . . . 81D.27 Summary inspection statistics for green coffee beans by country, for countries
with at least 50 consignments. . . . . . . . . . . . . . . . . . . . . . . . . . . . . 81D.28 Summary inspection statistics for green coffee beans by supplier, for suppliers
with at least 50 recent consignments. . . . . . . . . . . . . . . . . . . . . . . . . 82D.29 Pattern of inspections, pathway failures, and quarantine failure counts for hulled
sesame seeds by year. . . . . . . . . . . . . . . . . . . . . . . . . . . . . . . . . . . 86D.30 Frequency of quarantine failure counts using recent data for hulled sesame seeds
by country and supplier. . . . . . . . . . . . . . . . . . . . . . . . . . . . . . . . . 87D.31 Summary inspection statistics for hulled sesame seeds by country for countries
with at least five recent consignments. . . . . . . . . . . . . . . . . . . . . . . . . 87D.32 Summary inspection statistics for hulled sesame seeds by supplier for suppliers
with at least 20 recent consignments. . . . . . . . . . . . . . . . . . . . . . . . . 87D.33 Quarantine pests of concern for mangosteen from Country B. . . . . . . . . . . . 91D.34 Pattern of inspections, pathway failures, and quarantine failure counts for man-
gosteen by year. . . . . . . . . . . . . . . . . . . . . . . . . . . . . . . . . . . . . . 93D.35 Summary inspection statistics for mangosteen by supplier for suppliers with at
least five recent consignments. . . . . . . . . . . . . . . . . . . . . . . . . . . . . 94
98
List of Figures
6.1 Dried apricots consignments flow chart with statistics for July 2008 to December2010. . . . . . . . . . . . . . . . . . . . . . . . . . . . . . . . . . . . . . . . . . . . 23
6.2 Quarantine failure rates for dried apricots against date. . . . . . . . . . . . . . . 246.3 Simulated Post-Intervention Compliance against inspection effort for dried apricot
inspection history. . . . . . . . . . . . . . . . . . . . . . . . . . . . . . . . . . . . 276.4 Simulated leakage count against inspection effort for dried apricot inspection history. 28
D.1 Baby corn consignments flow chart with statistics for July 2008–December 2010. 41D.2 Quarantine failure rates for baby corn against date. . . . . . . . . . . . . . . . . . 41D.3 Simulated Post-Intervention Compliance against inspection effort for baby corn
inspection history. . . . . . . . . . . . . . . . . . . . . . . . . . . . . . . . . . . . 45D.4 Simulated leakage count against inspection effort for baby corn inspection history. 46D.5 Blueberries consignments flow chart with statistics for July 2008–February 2011. 48D.6 Quarantine failure rates for blueberries against date. . . . . . . . . . . . . . . . . 48D.7 Simulated Post-Intervention Compliance against inspection effort for blueberries
inspection history. . . . . . . . . . . . . . . . . . . . . . . . . . . . . . . . . . . . 51D.8 Simulated leakage count against inspection effort for blueberries inspection history. 52D.9 Coir peat consignments flow chart with statistics for July 2008–April 2011. . . . 54D.10 Quarantine failure rates for coir peat against date. . . . . . . . . . . . . . . . . . 55D.11 Simulated Post-Intervention Compliance against inspection effort for coir peat
inspection history. . . . . . . . . . . . . . . . . . . . . . . . . . . . . . . . . . . . 57D.12 Simulated leakage count against inspection effort for coir peat inspection history. 58D.13 Dried dates consignments flow chart with statistics for July 2008–December 2010. 59D.14 Quarantine failure rates for dried dates against date. . . . . . . . . . . . . . . . . 60D.15 Simulated Post-Intervention Compliance against inspection effort for dried dates
inspection history. . . . . . . . . . . . . . . . . . . . . . . . . . . . . . . . . . . . 63D.16 Simulated leakage count against inspection effort for dried dates inspection history. 64D.17 Dried seaweed consignments flow chart with statistics for July 2008–October 2010. 66D.18 Quarantine failure rates for dried seaweed against date. . . . . . . . . . . . . . . 67D.19 Simulated Post-Intervention Compliance against inspection effort for dried sea-
weed inspection history. . . . . . . . . . . . . . . . . . . . . . . . . . . . . . . . . 69D.20 Simulated leakage count against inspection effort for dried seaweed inspection
history. . . . . . . . . . . . . . . . . . . . . . . . . . . . . . . . . . . . . . . . . . 70D.21 Fresh garlic consignments flow chart with statistics for July 2008–early February
2011. . . . . . . . . . . . . . . . . . . . . . . . . . . . . . . . . . . . . . . . . . . . 72D.22 Quarantine failure rates for fresh garlic against date. . . . . . . . . . . . . . . . . 72D.23 Simulated Post-Intervention Compliance against inspection effort for fresh garlic
inspection history. . . . . . . . . . . . . . . . . . . . . . . . . . . . . . . . . . . . 76D.24 Simulated leakage count against inspection effort for fresh garlic inspection history. 77D.25 Green coffee beans consignments flow chart with statistics for July 2008–December
2010. . . . . . . . . . . . . . . . . . . . . . . . . . . . . . . . . . . . . . . . . . . . 79
99
AQIS Risk–Return: Plant-Product Pathways Final Report
D.26 Quarantine failure rates for green coffee beans against date. . . . . . . . . . . . . 80D.27 Simulated Post-Intervention Compliance against inspection effort for green coffee
beans inspection history. . . . . . . . . . . . . . . . . . . . . . . . . . . . . . . . . 83D.28 Simulated leakage count against inspection effort for green coffee beans inspection
history. . . . . . . . . . . . . . . . . . . . . . . . . . . . . . . . . . . . . . . . . . 84D.29 Hulled sesame seed consignments flow chart with statistics for July 2008–December
2010. . . . . . . . . . . . . . . . . . . . . . . . . . . . . . . . . . . . . . . . . . . . 85D.30 Quarantine failure rates for hulled sesame seeds against date. . . . . . . . . . . . 86D.31 Simulated Post-Intervention Compliance against inspection effort for hulled sesame
seed inspection history. . . . . . . . . . . . . . . . . . . . . . . . . . . . . . . . . . 89D.32 Simulated leakage count against inspection effort for hulled sesame seed inspection
history. . . . . . . . . . . . . . . . . . . . . . . . . . . . . . . . . . . . . . . . . . 90D.33 Mangosteen consignments flow chart with statistics for July 2008–December 2010. 92D.34 Quarantine failure rates for mangosteen against date. . . . . . . . . . . . . . . . . 93D.35 Simulated Post-Intervention Compliance against inspection effort for mangosteen
inspection history. . . . . . . . . . . . . . . . . . . . . . . . . . . . . . . . . . . . 94D.36 Simulated leakage count against inspection effort for mangosteen inspection history. 95
100