aps alternative fuel (hydrogen) pilot plant monitoring system · pdf fileinl/ext-05-00502 u.s....
TRANSCRIPT

INL/EXT-05-00502
U.S. Department of Energy
FreedomCAR & Vehicle Technologies Program Advanced Vehicle Testing Activity
APS Alternative Fuel (Hydrogen) Pilot Plant Monitoring System
Dimitri Hochard James Francfort
July 2005
Idaho National Laboratory Operated by Battelle Energy Alliance

INL/EXT-05-00502
U.S. Department of Energy FreedomCAR & Vehicle Technologies Program
Advanced Vehicle Testing Activity
APS Alternative Fuel (Hydrogen) Pilot Plant Monitoring System
Dimitri Hocharda
James Francfortb
July 2005
Idaho National Laboratory Transportation Technology Department
Idaho Falls, Idaho 83415
Prepared for the U.S. Department of Energy
Assistant Secretary for Energy Efficiency and Renewable Energy Under DOE Idaho Operations Office
Contract DE-AC07-05ID14517
a Electric Transportation Applications b Idaho National Laboratory

Disclaimer This document highlights work sponsored by agencies of the U.S. Government. Neither the U.S. Government nor any agency thereof, nor any of their employees, makes any warranty, express or implied, or assumes any legal liability or responsibility for the accuracy, completeness, or usefulness of any information, apparatus, product, or process disclosed, or represents that its use would not infringe privately owned rights. Reference herein to any specific commercial product, process, or service by trade name, trademark, manufacturer, or otherwise does not necessarily constitute or imply its endorsement, recommendation, or favoring by the U.S. Government or any agency thereof. The views and opinions of authors expressed herein do not necessarily state or reflect those of the U.S. Government or any agency thereof.

Abstract
The U.S. Department of Energy’s (DOE’s) Advanced Vehicle Testing Activity (AVTA), along with Electric Transportation Applications and Arizona Pubic Service (APS), is monitoring the operations of the APS Alternative Fuel (Hydrogen) Pilot Plant to determine the costs to produce hydrogen fuels (including 100% hydrogen as well as hydrogen and compressed natural gas blends) for use by fleets and other operators of advanced-technology vehicles. The hydrogen fuel cost data will be used as benchmark data by technology modelers as well as research and development programs.
The Pilot Plant can produce up to 18 kilograms (kg) of hydrogen per day by electrolysis. It can store up to 155 kg of hydrogen at various pressures up to 6,000 psi. The dispenser island can fuel vehicles with 100% hydrogen at 5,000 psi and with blends of hydrogen and compressed natural gas at 3,600 psi.
The monitoring system was designed to track hydrogen delivery to each of the three storage areas and to monitor the use of electricity on all major equipment in the Pilot Plant, including the fuel dispenser island. In addition, water used for the electrolysis process is monitored to allow calculation of the total cost of plant operations and plant efficiencies. The monitoring system at the Pilot Plant will include about 100 sensors when complete (50 are installed to date), allowing for analysis of component, subsystems, and plant-level costs.
The monitoring software is mostly off-the-shelve, with a custom interface. The majority of the sensors input to the Programmable Automation Controller as 4- to 20-mA analog signals. The plant can be monitored over of the Internet, but the control functions are restricted to the control room equipment.
Using the APS general service plan E32 electric rate of 2.105 cents per kWh, during a recent eight-month period when 1,200 kg of hydrogen was produced and the plant capacity factor was 26%, the electricity cost to produce one kg of hydrogen was $3.43. However, the plant capacity factor has been increasing, with a recent one-month high of 49%. If a plant capacity factor of 70% can be achieved with the present equipment, the cost of electricity would drop to $2.39 per kg of hydrogen. In this report, the power conversion (76.7%), cell stack (53.1%), and reverse osmosis system (7.14%) efficiencies are also calculated, as is the water cost per kg of hydrogen produced ($0.10 per kg).
The monitoring system has identified several areas having the potential to lower costs, including using an reverse osmosis system with a higher efficiency, improving the electrolysis power conversion efficiency, and using air cooling to replace some or all chiller cooling.
These activities are managed by the Idaho National Laboratory for the AVTA, which is part of DOE’s FreedomCAR and Vehicle Technologies Program.
iii
Contents
1. INTRODUCTION.............................................................................................................................. 1
2. MONITORING SYSTEM SPECIFICATIONS................................................................................. 2
3. MONITORING SYSTEM HARDWARE.......................................................................................... 4 3.1 Sensors and Other Systems ................................................................................................... 4
3.1.1 Numeric Signals .................................................................................................. 4 3.1.2 Thermocouples .................................................................................................... 4 3.1.3 Other Instruments................................................................................................ 4
3.2 Data Acquisition.................................................................................................................... 4
4. MONITORING SYSTEM DATA INTERFACE AND STORAGE.................................................. 6 4.1 Software Interface ................................................................................................................. 6 4.2 Data Storage .......................................................................................................................... 6
4.2.1 Text files.............................................................................................................. 7 4.2.2 Database .............................................................................................................. 7
5. DATA ANALYSIS TOOLS .............................................................................................................. 8 5.1 Local Monitoring Tools......................................................................................................... 8
5.1.1 Scale Options ...................................................................................................... 8 5.1.2 Pan and Zoom Options........................................................................................ 8 5.1.3 Legend Options ................................................................................................... 9 5.1.4 Graph Cursor....................................................................................................... 9
5.2 Internet Viewing Tools.......................................................................................................... 9
6. COST ANALYSIS ........................................................................................................................... 11 6.1 Electricity Cost at current capacity used ............................................................................. 11 6.2 Evolution of Capacity over a Six-month Period.................................................................. 12 6.3 Production at 70% Capacity ................................................................................................ 13
6.3.1 Electricity Costs ................................................................................................ 13 6.3.2 Equipment efficiencies...................................................................................... 13 6.3.3 Electrical Cost Comparison with DOE’s 2005 Target ...................................... 14
7. POSSIBILITIES FOR IMPROVEMENT ........................................................................................ 16
Appendix A Graphical Interfaces Available Online to Monitor the Pilot Plant ........................................ 17
iv

Acronyms
APS Arizona Pubic Service
AVTA Advanced Vehicle Testing Activity
CNG compressed natural gas
DOE Department of Energy
DRAM dynamic random access memory
EEPROM electrically erasable programmable read-only memory
FP Fieldpoint
GGE gasoline gallon equivalent
H/CNG hydrogen and CNG blended fuels
I/O input/output
NB note bene (note well)
ODBC (Microsoft’s) open database connectivity
OLE Object linking and embedding
OPC OLE for Process Control
PAC programmable automation controller
PC personal computer
PLC programmable logic controller
RO reverse osmosis
SCR silicon-controlled rectifier
VI virtual instrument
v

APS Alternative Fuel (Hydrogen) Pilot Plant Monitoring System
1. INTRODUCTION
Arizona Public Service (APS) constructed the APS Alternative Fuel (Hydrogen) Pilot Plant (hereafter Pilot Plant) to produce, store, and dispense hydrogen for their Clean Fuel Vehicle Fleet and to test advanced hydrogen-fueled distributed generation equipment. The Pilot Plant also compresses natural gas on site and fuels vehicles with compressed natural gas (CNG) and blends of hydrogen and CNG (H/CNG).
The Pilot Plant, which initiated operations in June 2002, was originally constructed with only basic monitoring capabilities. Subsequently, a project was undertaken to enhance its monitoring capability to allow for analysis of the Pilot Plant’s production costs and to compare them with the U.S. Department of Energy’s (DOE’s) cost targets for producing hydrogen fuel. For more information on the Pilot Plant’s functions and design, see Arizona Public Service – Alternative Fuel (Hydrogen) Pilot Plant Design Report, INEEL/EXT-03-00976 (available via: http://avt.inl.gov/hydrogen.shtml ).
The DOE’s Advanced Vehicle Testing Activity (AVTA) was a minor partner in the initial construction of the Pilot Plant and is now an equal partner, along with Electric Transportation Applications and Arizona Pubic Service, in the ongoing infrastructure monitoring activities of the Pilot Plant to determine the cost of hydrogen and H/CNG blended fuels. The hydrogen fuel cost data will be used as benchmark data by technology modelers as well as research and development programs. The Idaho National Laboratory (INL) manages this as well as other testing activities for the AVTA, as part of DOE’s FreedomCAR and Vehicle Technologies Program. This report overviews the monitoring system design, as well as hardware and software components, and briefly discusses the initial plant capacity and energy cost information collected to date.
1
2. MONITORING SYSTEM SPECIFICATIONS
The Pilot Plant comprises three separate physical areas:
1. The equipment room, where the hydrogen is produced, and both hydrogen and CNG are compressed and stored
2. The fueling island, where the hydrogen and CNG are dispensed
3. The control room, where monitoring equipment is installed. The monitoring equipment can be accessed from within the control room and from remote locations.
The Pilot Plant is capable of producing 18 kilograms of hydrogen per day, which can be stored in three ways:
1. A low-pressure tank can store 20 kilograms (kg) at 150 pounds per square inch (psi) (located in the equipment room)
2. A tube trailer area can store up to 95 kg at 2400 psi (located in a nearby lot)
3. Two high-pressure tanks in combination can store 40 kg of hydrogen at 6000 psi (located in the equipment room).
The monitoring system was designed to track hydrogen delivery to each of the three storage areas and to monitor the electricity use of all major equipment in the Pilot Plant. In addition, water used for the electrolysis process is monitored to allow calculation of the total cost of plant operations.
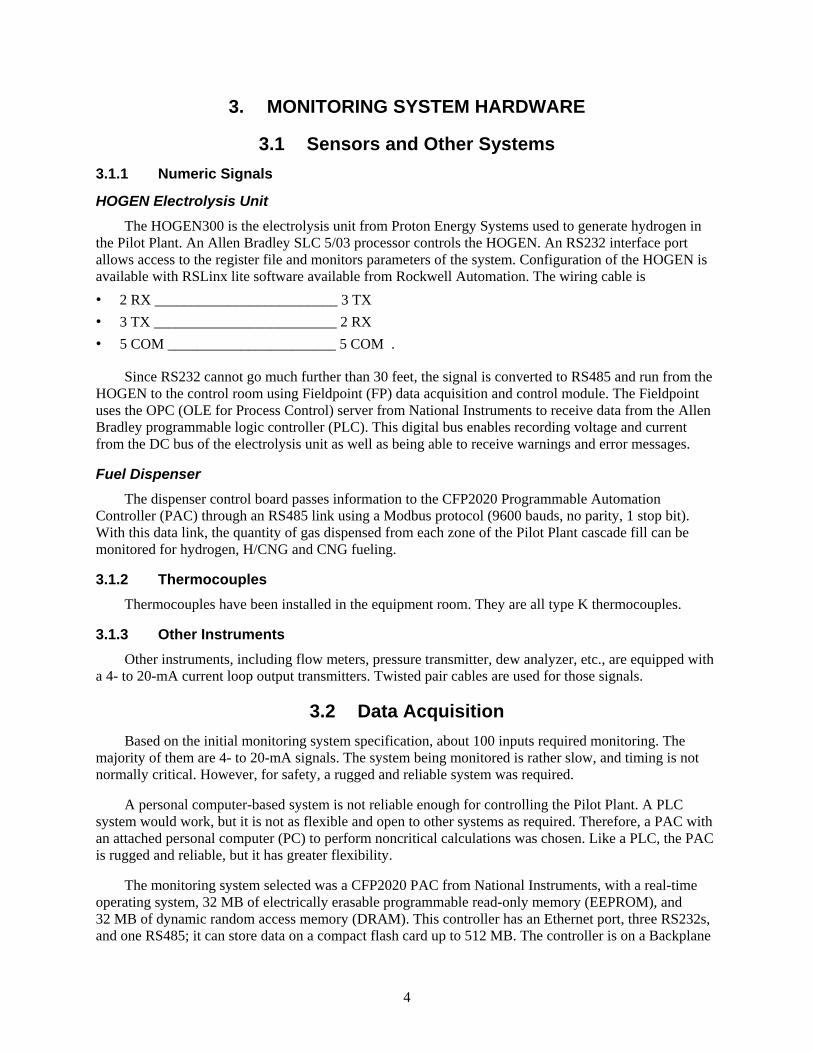
When the Pilot Plant was originally constructed, it included some sensors for controlling and monitoring plant functions and these original sensors were wired to the control room (Table 1). Additional sensors were installed in the Pilot Plant when it was constructed, but they were not wired to the control room until the monitoring effort started in earnest during 2004 (Table 2). Additional sensors required to implement the monitoring system were subsequently added and wired to the control room (Table 3).
Table 1. Sensors installed and wired to the control room when the Pilot Plant was constructed. TAG
Number
Sensor Type
Description Signal Type
Location
PT402 Pressure transmitter
Input pressure of the dispenser 4 to 20 mA HP dispenser panel
PT501 Pressure transmitter
Helium pressure released in case of fire 4 to 20 mA Equipment room
PT220 Pressure transmitter
Input pressure of the high-pressure Tank 2 4 to 20 mA HP dispenser panel
PT210 Pressure transmitter
Input pressure of the high-pressure Tank 1 4 to 20 mA HP dispenser panel
PT101 Pressure transmitter
Input pressure of the low-pressure storage 4 to 20 mA Dryer panel
PT201 Pressure transmitter
Output pressure of the PDC compressor 4 to 20 mA HP tank fill panel
TE501 Thermocouple Temperature of the vent stack TC type K Vent Stack
2

Table 2. Sensors installed when the Pilot Plant was constructed that required wiring to the control room for monitoring purposes. TAG Number Sensor Type Description Signal Type Location
HOGEN Control system Reversed fuel cell RS232 Equipment room Pressure switches (6)
Pressure switches Indicates high and very high pressures
120 VAC discreet HP and dryer panel
Flow switch Flow switch Indicates high flow 120 VAC discreet HP dispenser panel FDs (8) UV/IR detector Flame detector 4 to 20 mA Equipment room and
dispenser island
Table 3. Additional sensors added and wired to the control room for monitoring. TAG Number Sensor Type Description Signal Type Location
CTs (11) Current transmitter RMS reading of AC current 4 to 20 mA Control Room LA, HA, HB panels
PT02 Pressure transmitter Nitrogen generator output pressure
4 to 20 mA Control room
MFM105 Flow meter Nitrogen generator mass flow 4 to 20 mA Control room
PT01 Pressure transmitter Nitrogen generator output
pressure 4 to 20 mA Control room
MFM104 Flow meter Air mass flow 4 to 20 mA Control room
LFM102 Liquid flow meter Potable water flow 4 to 20 mA Control room
PT003 Pressure transmitter Instrument air output pressure 4 to 20 mA Control room
MFM109 Flow meter Instrument air mass flow 4 to 20 mA Control room
MFM106 Flow meter PDC output flow 4 to 20 mA Equipment room
LFM101 Liquid flow meter RO system water input 4 to 20 mA Control room
AE102 Dew analyzer Hydrogen water content (ppm) 4 to 20 mA Equipment room
MFM102 Flow meter Output flow of the HOGEN 4 to 20 mA Equipment room
MFM103 Flow meter Output flow from dryer 4 to 20 mA Equipment room
TT101 Thermocouple Chiller supply temperature TC type K Equipment room
TT102 Thermocouple Chiller return temperature TC type K Equipment room
TT103 Thermocouple Dryer temperature: IN TC type K Equipment room
TT104 Thermocouple Dryer temperature: OUT TC type K Equipment room
TT105 Thermocouple PDC temperature TC type K Equipment room
Dispenser Control system Provides mass flow and other information from the dispenser
RS485 Dispenser island
3
3. MONITORING SYSTEM HARDWARE
3.1 Sensors and Other Systems 3.1.1 Numeric Signals
HOGEN Electrolysis Unit The HOGEN300 is the electrolysis unit from Proton Energy Systems used to generate hydrogen in
the Pilot Plant. An Allen Bradley SLC 5/03 processor controls the HOGEN. An RS232 interface port allows access to the register file and monitors parameters of the system. Configuration of the HOGEN is available with RSLinx lite software available from Rockwell Automation. The wiring cable is • 2 RX _________________________ 3 TX • 3 TX _________________________ 2 RX • 5 COM _______________________ 5 COM .
Since RS232 cannot go much further than 30 feet, the signal is converted to RS485 and run from the HOGEN to the control room using Fieldpoint (FP) data acquisition and control module. The Fieldpoint uses the OPC (OLE for Process Control) server from National Instruments to receive data from the Allen Bradley programmable logic controller (PLC). This digital bus enables recording voltage and current from the DC bus of the electrolysis unit as well as being able to receive warnings and error messages.
Fuel Dispenser The dispenser control board passes information to the CFP2020 Programmable Automation
Controller (PAC) through an RS485 link using a Modbus protocol (9600 bauds, no parity, 1 stop bit). With this data link, the quantity of gas dispensed from each zone of the Pilot Plant cascade fill can be monitored for hydrogen, H/CNG and CNG fueling.
3.1.2 Thermocouples Thermocouples have been installed in the equipment room. They are all type K thermocouples.
3.1.3 Other Instruments Other instruments, including flow meters, pressure transmitter, dew analyzer, etc., are equipped with
a 4- to 20-mA current loop output transmitters. Twisted pair cables are used for those signals.
3.2 Data Acquisition Based on the initial monitoring system specification, about 100 inputs required monitoring. The
majority of them are 4- to 20-mA signals. The system being monitored is rather slow, and timing is not normally critical. However, for safety, a rugged and reliable system was required.
A personal computer-based system is not reliable enough for controlling the Pilot Plant. A PLC system would work, but it is not as flexible and open to other systems as required. Therefore, a PAC with an attached personal computer (PC) to perform noncritical calculations was chosen. Like a PLC, the PAC is rugged and reliable, but it has greater flexibility.
The monitoring system selected was a CFP2020 PAC from National Instruments, with a real-time operating system, 32 MB of electrically erasable programmable read-only memory (EEPROM), and 32 MB of dynamic random access memory (DRAM). This controller has an Ethernet port, three RS232s, and one RS485; it can store data on a compact flash card up to 512 MB. The controller is on a Backplane
4

circuit board with eight slots to plug in up to eight National Instruments input/output (I/O) modules. The controller has been configured with 4- to 20-mA input modules, digital input modules, and output relay modules, as follows.
Table 4. Configuration of the CFP2020 Programmable Automation Controller’s eight input and output slots. AI-111 DI-330 RLY421 RLY421
AI-111: module 16 analog inputs 4 to 20 mA. DI-330: module 8 digital input 3 to 250 VDC. RLY-421: module 8 SPST Normally open relay.
To minimize wiring work and reduce data losses, signals are regrouped as much as possible into standalone data acquisition units, daisy chained on a single, twisted pair, RS485 bus using ADAM series data acquisition modules. This also provides flexibility after the eight controller slots are full, eliminating the need for a second controller, which would make the software more complex in a multiprocessor environment.
The ADAM units have eight inputs, which can include 4- to 20-mA inputs, 0- to 10-volt inputs, and thermocouple inputs. The modules are controlled by the CFP2020 PAC.
The HOGEN Fieldpoint device has the following configuration: • IP address: 192.168.0.101 • Mask: 255.255.255.0 • Gateway: 192.168.0.1.
The Fieldpoint is configured using National Instruments Measurement and Automation Explorer Software (see the CFP-20xx user manual for details).
The PC attached to the PAC has the following network configuration: • IP address: 192.168.0.100 • Mask: 255.255.255.0 • Gateway: 192.168.0.1.
Externally, the above server is located at the following IP address: http://66.213.226.251/ .
The ADAM hardware configuration is as follows: • Device number: 01 • Baud rate: 9600 • Data type: +/- 20 mA (needs a 125-Ohm 0.1% resistor between signal input and ground or differential
inputs) • Data format: engineering, no checksum.
The ADAM module is configured using an RS232 link from a desktop computer with an RS232/RS485 converter. HyperTerminal is used to configure the unit. Every unit in the bus must have a different device number (default is one). See the ADAM 4000 Series Datasheet for the proper set of commands to configure a module.
5
4. MONITORING SYSTEM DATA INTERFACE AND STORAGE
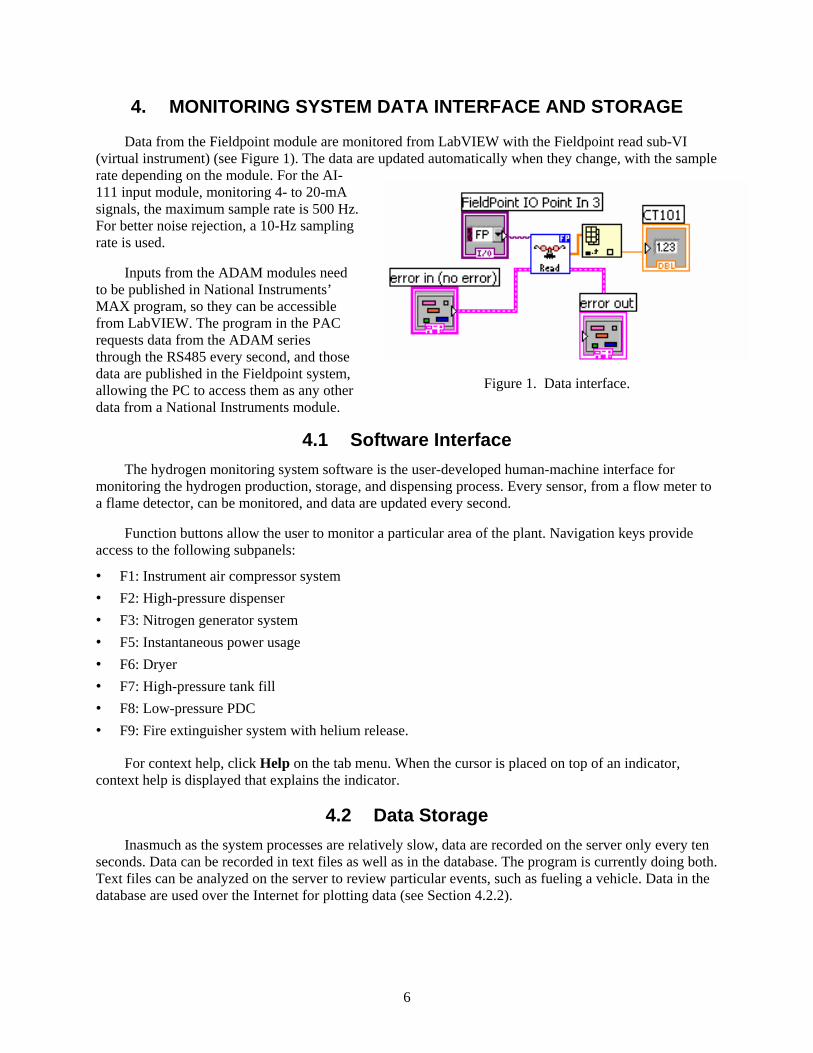
Data from the Fieldpoint module are monitored from LabVIEW with the Fieldpoint read sub-VI (virtual instrument) (see Figure 1). The data are updated automatically when they change, with the sample rate depending on the module. For the AI-111 input module, monitoring 4- to 20-mA signals, the maximum sample rate is 500 Hz. For better noise rejection, a 10-Hz sampling rate is used.
Inputs from the ADAM modules need to be published in National Instruments’ MAX program, so they can be accessible from LabVIEW. The program in the PAC requests data from the ADAM series through the RS485 every second, and those data are published in the Fieldpoint system, allowing the PC to access them as any other data from a National Instruments module.
Figure 1. Data interface.
4.1 Software Interface The hydrogen monitoring system software is the user-developed human-machine interface for
monitoring the hydrogen production, storage, and dispensing process. Every sensor, from a flow meter to a flame detector, can be monitored, and data are updated every second.
Function buttons allow the user to monitor a particular area of the plant. Navigation keys provide access to the following subpanels:
• F1: Instrument air compressor system • F2: High-pressure dispenser • F3: Nitrogen generator system • F5: Instantaneous power usage • F6: Dryer • F7: High-pressure tank fill • F8: Low-pressure PDC • F9: Fire extinguisher system with helium release.
For context help, click Help on the tab menu. When the cursor is placed on top of an indicator, context help is displayed that explains the indicator.
4.2 Data Storage Inasmuch as the system processes are relatively slow, data are recorded on the server only every ten
seconds. Data can be recorded in text files as well as in the database. The program is currently doing both. Text files can be analyzed on the server to review particular events, such as fueling a vehicle. Data in the database are used over the Internet for plotting data (see Section 4.2.2).
6
4.2.1 Text files The default location for text files is C:\Temp\ . This file contains all data recorded over a 24-hour
period. It is used with local tools to determine instrument behavior. Files are typically 2.5 MB per 24-hours of data.
4.2.2 Database The database is in Microsoft Access, with a 1 gigabyte .mdb file size. The primary key is Time,
because the database will never receive data twice at the same time. Time is recorded in seconds, limiting the fastest recording speed to every second. (NB: Microsoft Automatic Time synchronization needs to be deactivated.)
The default location for the database files is F\vi\h2\MonitoringPoints.mdb. The file contains the same number of elements as the text file. The database deletes elements older than July 1st of the previous year on New Year’s day. The database is accessed through Microsoft Open Database Connectivity (ODBC) Administrator, System DSN. The database will then content up to one year of data, after which it will delete old data to generate space.
7

5. DATA ANALYSIS TOOLS
5.1 Local Monitoring Tools A virtual instrument (VI), called View Recorded Data, plots channels recorded in Text files. The VI
is available from the control room only. Other analysis tools are available online. Two channels can be plotted on the same graph with different Y axes. Plot 0 has the Y axis on the left; Plot 1 has the Y axis on the right.
5.1.1 Scale Options Graphs can automatically adjust their horizontal and vertical scales to reflect the data to be
presented. The autoscaling feature is turned ON or OFF using the Autoscale X and Autoscale Y menu item from the Data Operations or the X Scale/Y Scale submenus of the pop-up menu for the graph. Autoscaling ON is the default setting for graphs.
Right click on the graph to access the Autoscale settings.
5.1.2 Pan and Zoom Options
Normally, the display is in standard operating mode, indicated by the plus or crosshatch. In operating mode, clicking in the graph moves the cursor about.
Pressing the panning tool switches to a mode that can scroll the visible data by clicking and dragging the plot area of the graph. Autoscale must be OFF to use this feature.
Pressing the zoom tool zooms IN or OUT on the graph. Clicking the zoom tool opens a pop-up menu to choose methods of zooming. This menu is shown in Figure 2, which includes descriptions of the menu items.
- Zoom by rectangle - Zoom by rectangle, with zooming
restricted to X data (the Y scale remains unchanged).
- Zoom by rectangle, with zooming restricted to Y data (the X scale remains unchanged).
- Undo last zoom. Resets the graph to its previous setting.
- Zoom in about a point. If you hold the cursor on a specific point, the graph continuously zooms in until you release the mouse button.
- Zoom out about a point. If you hold the cursor on a specific point, the graph continuously zooms out until you release the mouse button.
Figure 2. Pan and zoom options menu on the graph.
8

In the last two modes—zoom in and zoom out about a point—clicking while pressing the shift key zooms in the other direction. The autoscale must be OFF to use the zoom feature.
5.1.3 Legend Options Right clicking on the plot legend opens the plot sample
pop-up menu, shown in Figure 3.
Common Plots assists in configuring a plot for any of six popular plot styles, including a scatter plot, bar plot, and fill-to-zero plot.
Color displays the palette for selecting the plot color.
Line Style and Line Width display the styles available to distinguish a plot. The line width subpalette contains widths thicker than the default (one pixel), as well as hairline. The latter has no effect on the screen display but prints a very thin line if the printer and print mode support hairline printing.
Bar Plots has a selection of vertical bars, horizontal bars, and no bars.
Fill Baseline sets the baseline fill. Zero fills from the plot to a baseline generated at 0. Infinity fills from the plot to the positive edge of the graph. Infinity fills from the plot to the negative edge of the graph. The bottom part of this menu allows selecting the other plot of this graph to fill to.
Figure 3. Options pop-up menu for the plotting legend.
Interpolation allows selecting how the graph draws lines between plotted points. The first item does not draw a line. The item at bottom left draws a straight line between plotted points. The four stepped items, which link with a right-handed elbow, are useful for creating histogram-like plots.
5.1.4 Graph Cursor The cursor on the graph allows reading the exact value of a point on a plot. The value displays in the
cursor legend. The lock symbol is used to lock the cursor onto a plot. The menu allows locking on Plot 0 or Plot 1. The cursor mover allows you to select which plot is locked onto, by using the up and down arrow. The next and previous point values may be selected by using the right and left arrow.
5.2 Internet Viewing Tools The monitoring system Webpage allows viewing of data on the Microsoft Access database stored on
the server. Use the Active Server Page to access the database. The IP address of the Web server is http://66.213.226.251/ .
The daily, weekly, and monthly averages for various energy efficiencies can be viewed, such as the efficiency of:
• Power conversion of the stack • Cell stack • Balance-of-plant energy • Compression energy • Storage and dispensing
9

• Total energy.
These analytical results can be plotted based on the data recorded in the database.
Internet users can control the hydrogen monitoring system software; only one person at a time, however, can have control of the software. With the current National Instruments license, up to five people can monitor the plant at the same time.
10

6. COST ANALYSIS
Pilot Plant operations data recorded between the second half of 2004 and March 2005 have been analyzed and are presented below. The primary Pilot Plant cost of interest is the electricity cost per equipment component. Other costs were also examined, including the cost of water and various plant efficiencies and capacity factors.
6.1 Electricity Cost at current capacity used Between July 2004 and mid-March 2005, 1,200 kg of hydrogen were produced. This is an average
production rate of 4.7 kg per day. During this period, the Pilot Plant operated at an average capacity of 26%. Based on the readings of current transducers, a total of 764 kilowatt-hours (kWh) were used during the same period (Table 5).
Table 5. Daily kWh usage per major component at 26% of capacity. (Cost is based on APS’s E32 electric rate of 2.105 cents per kWh.) Equipment
Daily Usage (kWh)
Electricity Cost (per kg)
Electrolysis unit 410 $1.84 Compressor 13 $0.05 Chillers 254 $1.14 Control room 34 $0.15 Dryer 11 $0.06 Instrument air 23 $0.10 Nitrogen system 19 $0.09 Total 764 $3.43
Electricity costs for the Pilot Plant’s chiller can be separated between its nominal (stand-by) consumption mode and its electricity consumption for chilling the compression, electrolysis, and air-conditioning units. To determine the percentage of the chiller used per Pilot Plant component, data were analyzed when only one component was running. The results of this analysis are presented in Table 6.
Table 6. Load repartition for the chilling system at 100% of capacity.
Equipment Daily Usage
(kWh) Percent Load
HOGEN 319 kWh 67.5 Compressor 12 kWh 2.5 Chiller standby 87 kWh 18.5 Air conditioning 55 kWh 11.5
Total 473 kWh 100 Figure 4 presents the total energy cost components for producing hydrogen from July 2004 to mid March 2005 at 26% plant capacity.
11

Chiller Compressor 2%
Chiller Cell Stack 14%
Chiller Standby 11%
Chiller AC 7%
Electrolysis Unit 54%
Instrument Air 3%
Control room4%
Compressor1%
Dryer2%
Nitrogen System 3%
Chiller 33%
Figure 4. Hydrogen production cost components at the actual 26% of capacity.
6.2 Evolution of Capacity over a Six-month Period Figure 5 presents the evolution of the capacity factor over the last six months. The Plant is used to
produce hydrogen for on-road vehicles and for distributed generation hardware testing. Variations in the capacity factor are due to fuel use for distributed generation hardware (generator-set and fuel cell) testing over the past three months. Except for the February data, plant use has increased each month. It is anticipated that the plant will achieve 70% of capacity by the end of 2005 as a result of fueling additional on-road vehicles.
p y
11.00%
28.00%31.00%
41.00%
49.00%
22.00%
0.00%
10.00%
20.00%
30.00%
40.00%
50.00%
60.00%
Sep-04 Oct-04 Nov-04 Dec-04 Jan-05 Feb-05
Figure 5. Evolution of the capacity factor over the past six months.
12
6.3 Production at 70% Capacity 6.3.1 Electricity Costs
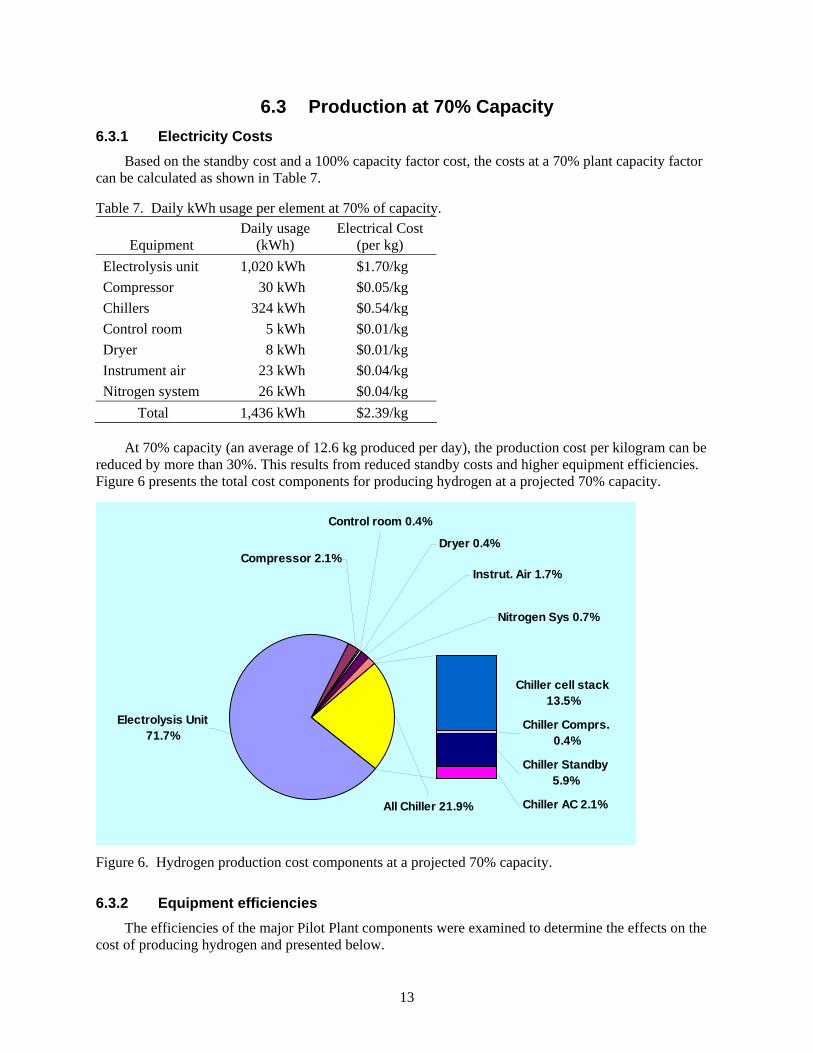
Based on the standby cost and a 100% capacity factor cost, the costs at a 70% plant capacity factor can be calculated as shown in Table 7.
Table 7. Daily kWh usage per element at 70% of capacity.
Equipment Daily usage
(kWh) Electrical Cost
(per kg) Electrolysis unit 1,020 kWh $1.70/kg Compressor 30 kWh $0.05/kg Chillers 324 kWh $0.54/kg Control room 5 kWh $0.01/kg Dryer 8 kWh $0.01/kg Instrument air 23 kWh $0.04/kg Nitrogen system 26 kWh $0.04/kg
Total 1,436 kWh $2.39/kg
At 70% capacity (an average of 12.6 kg produced per day), the production cost per kilogram can be reduced by more than 30%. This results from reduced standby costs and higher equipment efficiencies. Figure 6 presents the total cost components for producing hydrogen at a projected 70% capacity.
All Chiller 21.9% Chiller AC 2.1%
Chiller Standby5.9%
Chiller Comprs. 0.4%
Chiller cell stack13.5%
Electrolysis Unit71.7%
Control room 0.4%
Compressor 2.1%Dryer 0.4%
Instrut. Air 1.7%
Nitrogen Sys 0.7%
Figure 6. Hydrogen production cost components at a projected 70% capacity.
6.3.2 Equipment efficiencies The efficiencies of the major Pilot Plant components were examined to determine the effects on the
cost of producing hydrogen and presented below.
13

Power Conversion Efficiency of the Electrolysis Unit
rPowerFactoCurrentACVoltageACCurrentDCVoltageDC
×××
=η
kWVA
60461000 ×
=η .
The HOGEN power conversion efficiency for July 2004 through mid March 2005 was 76.7%.
Cell Stack Efficiency
CurrentDCVoltageDCLHVdensityHOutputFlow
×××
=2η
4634.3310362763.2310 3 ×××
=−
η .
The HOGEN cell stack efficiency for July 2004 through mid-March 2005 was 53.1%.
Efficiency of the Reverse Osmosis System From the equation
22122 OHOH +>−
with
n(H2) = 2 g/mol and n(H2O) = 18 g/mol
it can be seen that 2.38 gallons of water are required to make one kg of hydrogen with no losses.
LFM101 (liquid flow meter on the input of the reverse osmosis system) shows that ~600 gallons of water are required to produce 18 kg of hydrogen in a 24 hr period. Assuming no water loss in the HOGEN unit and the de-ionized water system, the system efficiency of the reverse osmosis (RO) system is
6001838.2 ×
= 7.14 % .
Based on City of Phoenix pricing as of March 2005, the water cost is $2.08 per 748 gallons, resulting in a water cost of $0.10 per kg of hydrogen produced. In addition to this production cost, the electrolysis unit drains up to 10 gallons of water at startup to flush the system. At the current RO system efficiency, another 140 gallons of water is used for starting the production process.
6.3.3 Electrical Cost Comparison with DOE’s 2005 Target DOE’s Hydrogen Program has established targets for hydrogen production, which include both
energy use and hydrogen cost. At a 70% projected plant capacity factor, the Pilot Plant hydrogen production energy efficiency is 114 kWh per kg of hydrogen. As shown in Figure 7, this is well above the DOE 2005 target of 71 kWh per kg. However, as shown in Figure 8, at the current APS E32 electric rate of 2.105¢ per kWh, the cost of hydrogen production for the Pilot Plant is $2.39 per kg, slightly below the DOE 2005 target.
14

114
71
0
10
20
30
40
50
60
70
80
90
100
110
120
Status DOE 2005 Target
kWh/
kg
Figure 7. Kilowatt-hour usage per kg of hydrogen produced versus DOE’s 2005 Target. Note: kWh per kg comparison assumes 1 kg of hydrogen equals 1 gasoline gallon equivalent (GGE).
$2.39
$3.99
$2.47
$0.00
$0.50
$1.00
$1.50
$2.00
$2.50
$3.00
$3.50
$4.00
$4.50
APS Status DOE 2005 Target
Elec
trici
ty C
ost p
er k
g of
Hyd
roge
n
Figure 8. Pilot Plant electricity cost versus DOE’s 2005 target. Notes: 1. Comparison assumes 1 kg of hydrogen equals 1 GGE. 2. The APS bar electricity cost at APS E32 rate of 2.105 cents per kWh. 3. The Status bar represents hydrogen cost if electric cost is 3.5 cents per kWh as the DOE target estimates.
15

7. POSSIBILITIES FOR IMPROVEMENT
The data collected by the monitoring system allow for analysis of the major contributors to the Pilot Plant hydrogen production electricity costs. As seen from the discussion above, several parts of the production process can be targeted for improvement to lower the cost of producing hydrogen, including the following:
• The RO system should be replaced with one that recycles water, to improve system efficiency. Some companies advertise RO system efficiencies as high as 60%. This would significantly reduce the current $0.10 water cost per kg of hydrogen produced.
• The electrolysis unit (HOGEN) power conversion efficiency must be improved. The existing SCR (silicon-controlled rectifier) power supply should be replaced by a more efficient supply and one maintaining a unity power factor. Assuming a power conversion efficiency of 96%, the daily kWh usage at 70% capacity factor would be 814 kWh with the existing cell stack. This would reduce the cost per kg for the electrolysis unit to $1.36 per kg.
• The chiller system currently constitutes 22% of the energy cost to produce hydrogen. Proper system design to allow air cooling rather than refrigeration can reduce this energy use significantly. This would require redesigned compressor and power electronics for the electrolysis unit (HOGEN). This will also reduce the potential maintenance costs associated with the refrigeration compressor system.
16

17
Appendix A
Graphical Interfaces Available Online to Monitor the Pilot Plant

Appendix A Graphical Interfaces Available Online to Monitor the Pilot Plant
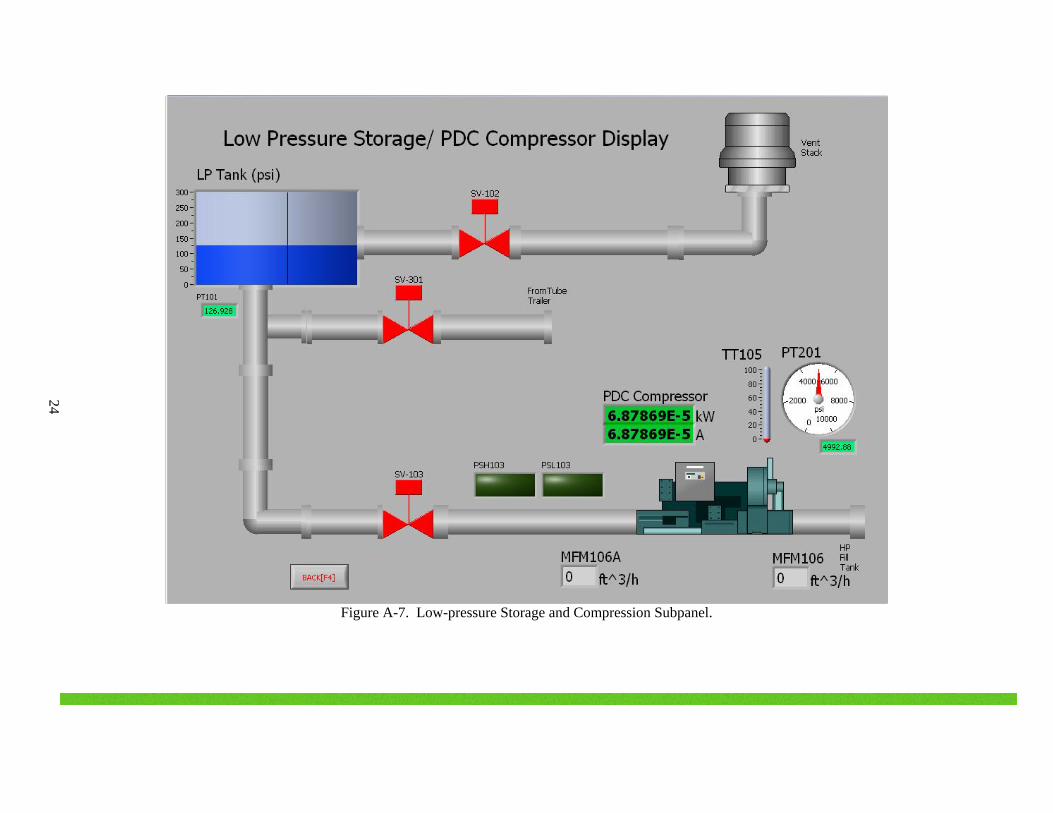
The following figures present graphical interfaces available online to monitor the Pilot Plant (see Section 5.2). Figure A-1 is the main interface. The other figures (Figures A-2 to A7) are examples of subpanels of the main graphical interface.
18
Figure A-1. APS Alternative Fuels (Hydrogen) Pilot Plant, Monitoring System Main Interface Panel.

19
Figure A-2. Dryer Subpanel.

20
Figure A-3. Dispensing Subpanel.
21
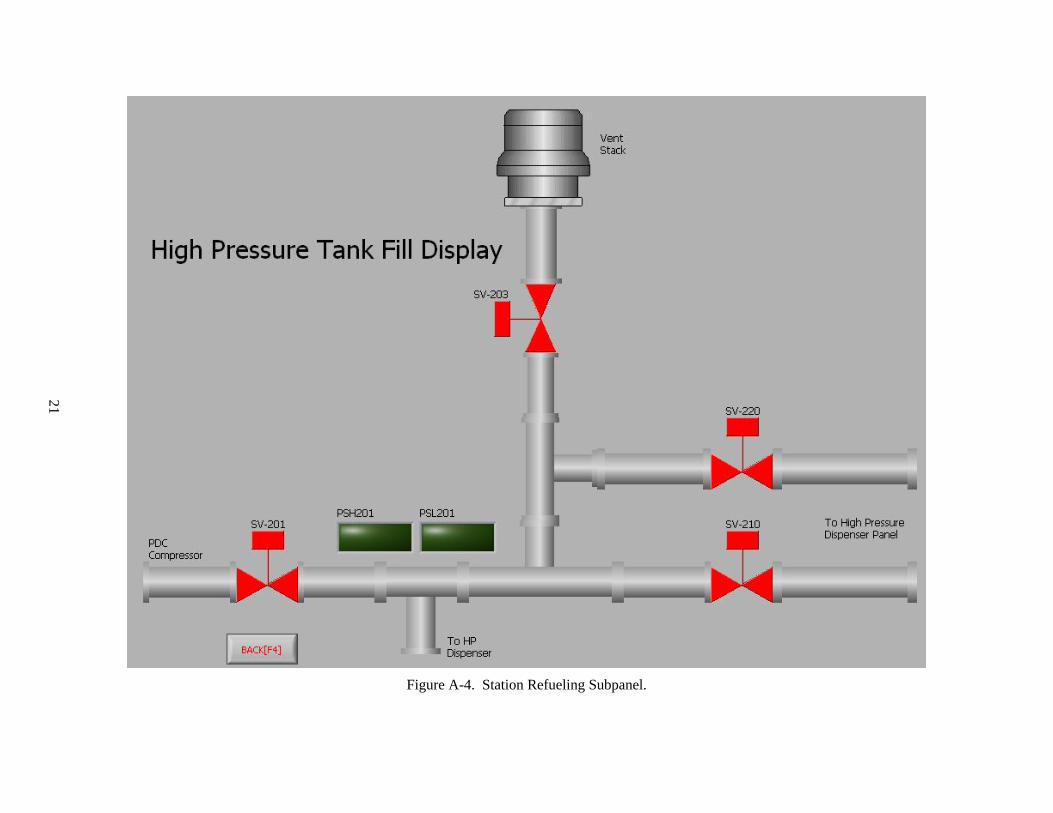
Figure A-4. Station Refueling Subpanel.

22
Figure A-5. Instrument Air Subpanel.
23
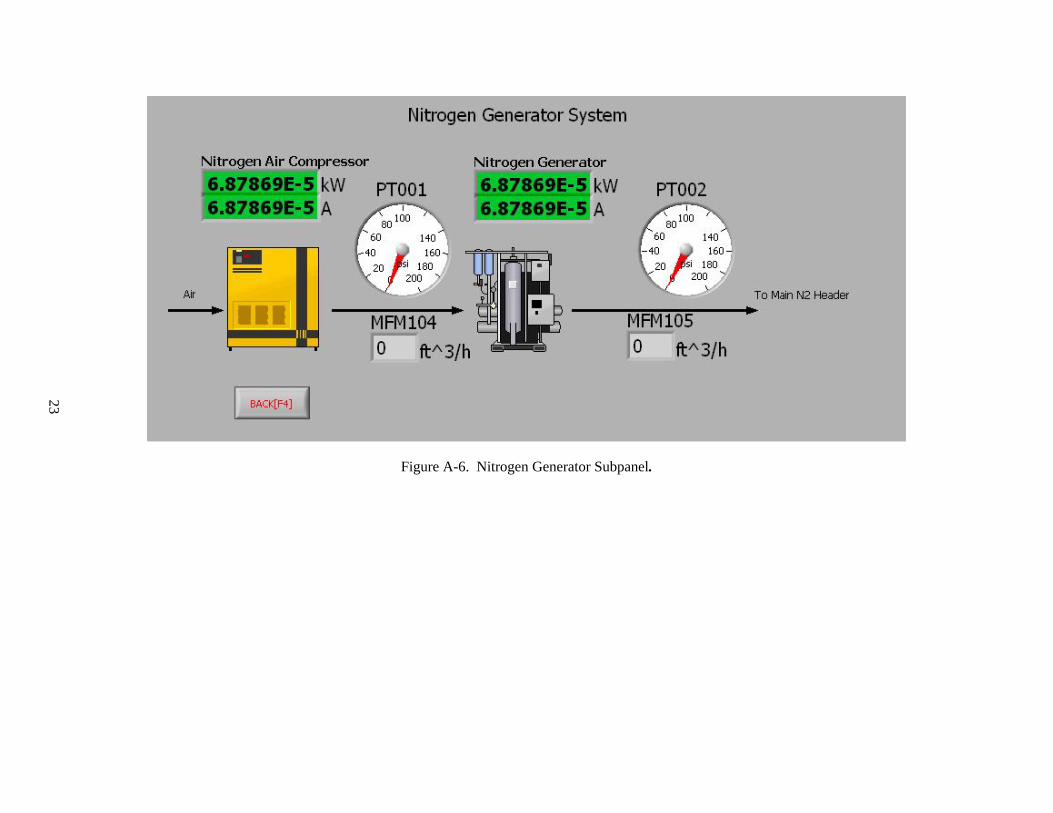
Figure A-6. Nitrogen Generator Subpanel.
24
Figure A-7. Low-pressure Storage and Compression Subpanel.