apresentação do powerpointir.marfrig.com.br/en/documentos/3776_results... · achievement of...
TRANSCRIPT

2Q15 Earnings
August 12, 2015

Strategic Vision
GREATER VALUE TO
SHAREHOLDERS
FULL SUPPORT OF CONTROLLING SHAREHOLDERS
STAGE
EXAMPLES
VALUE LEVERAGE
FOCUS TO WINProfitable growth and global leadership in foodservice
Adjusting the capital structure and reducing borrowing costs
Continuous operational improvement and increased operating cash flow
• Productivity Agenda
• Streamlining of Beef Brazil production units
• Improved sales • mix Brazil
• Pursuit of synergies
• Sale ofMoy Park
• Liability Management
Prioritizing organic growth opportunities
- Keystone- Beef
1

Highlights in 2Q15� Strong growth in net revenue (+26%) and Adjusted EBITDA (+41%) on
2Q14¹;
� EBITDA Margin expansion at all business units, with combined1 Adjusted EBITDA of 8.7%;
� Positive free cash flow of R$136 million in the quarter and R$48 million year to date;
� Keystone’s adjusted EBITDA grew 20% in USD, driven by robust growth in Asia and continuous growth in Key Accounts;
� Marfrig Beef’s Adjusted EBITDA margin stood at 9.7%, due to a better sales mix and higher operating efficiency;
� Opening-up of the US and Chinese markets to Brazilian beef;
� Sale of Moy Park for approximately US$1.5 billion;
� On a proforma basis (considering the Moy Park divestment), financial leverage ended 2Q15 at 3.8x.
1 Includes Moy Park for comparison purposes, not audited.
2

Achievement of Guidance
Note: (1) In BRL based on the exchange rates of R$2.70/US$1.00 and R$4.30/£1.00.(2) Adjusted by non-recurring events.(3) Operating cash flow after investments, variations in working capital, interest expenses and income tax.
Target Range2015 (1)
6M15Achieved
Net Revenue R$23 to25billion
R$12.3billion
AdjustedEBITDA Margin (2) 8.0% - 9.0% 8.3%
CAPEX R$650million
R$339million
Free Cash Flow toShareholders (3)
R$100 to R$200 million
R$48million
3
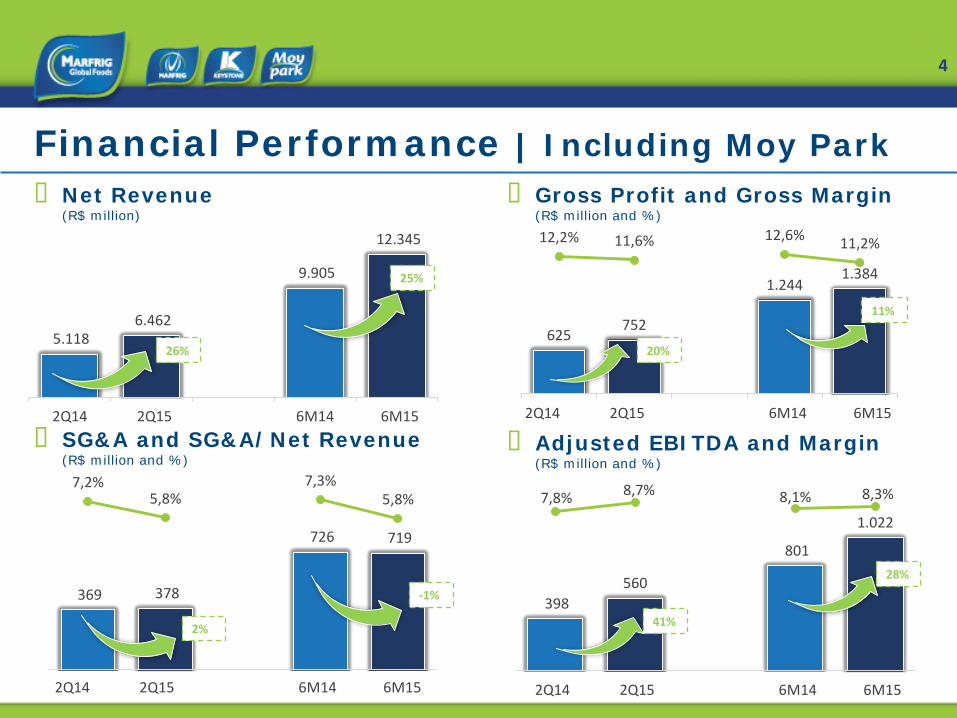
398 560
801
1.0227,8% 8,7% 8,1% 8,3%
2T14 2T15 1S14 1S152Q14 2Q15 6M14 6M15
625752
1.2441.384
12,2% 11,6% 12,6% 11,2%
2T14 2T15 1S14 1S152Q14 2Q15 6M14 6M15
369 378
726 719
7,2%5,8%
7,3%5,8%
2T14 2T15 1S14 1S152Q14 2Q15 6M14 6M15
5.118 6.462
9.905
12.345
2T14 2T15 1S14 1S152Q14 2Q15 6M14 6M15
Financial Performance | Including Moy Park� Net Revenue
(R$ million)
� SG&A and SG&A/Net Revenue(R$ million and %)
� Gross Profit and Gross Margin(R$ million and %)
� Adjusted EBITDA and Margin(R$ million and %)
26%
25%
11%
28%
41%
20%
2%
-1%
4

294 415
595 759
7,8%8,8%
8,2% 8,3%
2T14 2T15 1S14 1S15
3.789 4.728
7.265
9.099
2T14 2T15 1S14 1S15
Financial Performance | Continuing Operations� Net Revenue
(R$ million)
� Adjusted EBITDA and Margin(R$ million and %)
25%
25%
41%
27%
� Profile of Continuing Ops.
� Revenue Breakdown
Approximately 33,000 employees
46 commercial, production and distribution units
Operational presence
in 11 countries in the Americas, Asia and Oceania
Serving clients with our products in approx.
100 countries
45%
42%
13%
Business
KeystoneBeef BrasilBeef Intr. Ops.
63%
22%
15%
CurrencyUSD
BRL
Other
2Q14 2Q15 6M14 6M15
2Q14 2Q15 6M14 6M15
51%
41%
8%
ProductOther
Fresh
Processed
5
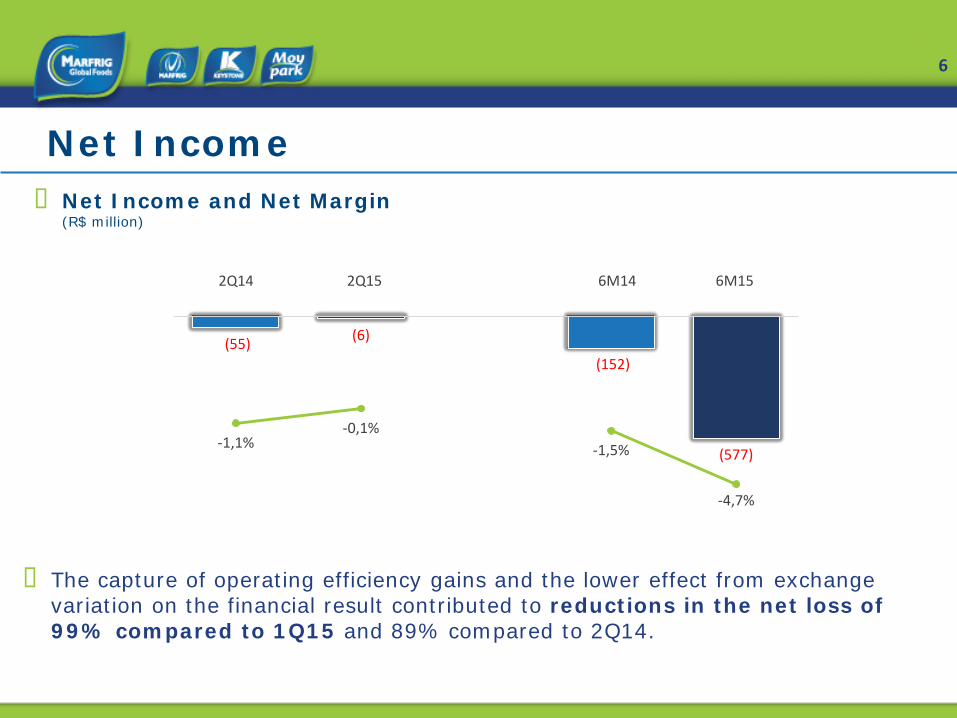
Net Income� Net Income and Net Margin
(R$ million)
� The capture of operating efficiency gains and the lower effect from exchange variation on the financial result contributed to reductions in the net loss of 99% compared to 1Q15 and 89% compared to 2Q14.
(55) (6)
(152)
(577)-1,1%
-0,1%-1,5%
-4,7%
2T14 2T15 1S14 1S152Q14 2Q15 6M14 6M15
6

36 53
83 99 5,7%
7,6%6,8% 7,3%
2T14 2T15 1S14 1S152Q14 2Q15 6M14 6M15
45 54
92 102
7,1%7,7% 7,5% 7,5%
2T14 2T15 1S14 1S152Q14 2Q15 6M14 6M15
8
17
26 32
1,3%2,4% 2,1% 2,4%
2T14 2T15 1S14 1S152Q14 2Q15 6M14 6M15
634 698
1.223 1.359
2T14 2T15 1S14 1S152Q14 2Q15 6M14 6M15
2Q15 Highlights | Keystone� Net Revenue
(USD million)
� SG&A and SG&A/Net Revenue(USD million and %)
� Gross Profit and Gross Margin(USD million and %)
� Adjusted EBITDA and Margin(USD million and %)
10%
11%
47%
18%
20%
11%
109%
25%
7

2T14 2T152Q14 2Q15
211 226
3747
2T14 2T152Q14 2Q15
471 500
163198
2T14 2T15
EUA APMEA
2Q14 2Q15
Operating Performance | Keystone
� Total Volume (‘000 ton)
� Net Revenue(USD million)
25% 22%
7% 6%
� Net Revenue Key Accounts (1)
(USD million)
19%
(1) Processed, value-added products
137
163
10%
634698
10%
248272
USA
8
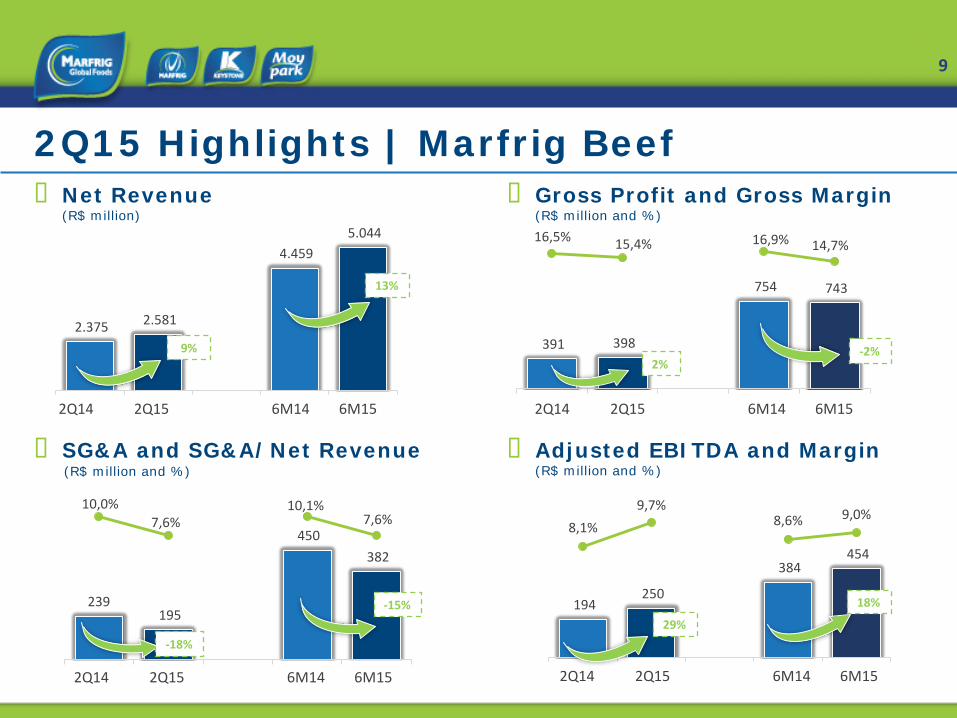
194 250
384 454
8,1%9,7%
8,6% 9,0%
2T14 2T15 1S14 1S15
239195
450 382
10,0%7,6%
10,1%7,6%
2T14 2T15 1S14 1S15
391 398
754 743
16,5% 15,4% 16,9% 14,7%
2T14 2T15 1S14 1S15
2Q15 Highlights | Marfrig Beef� Net Revenue
(R$ million)
� SG&A and SG&A/Net Revenue(R$ million and %)
� Gross Profit and Gross Margin(R$ million and %)
� Adjusted EBITDA and Margin(R$ million and %)
29%
18%
-2%2%
-15%
-18%
2.375 2.581
4.459 5.044
2T14 2T15 1S14 1S15
9%
13%
2Q14 2Q15 6M14 6M15
2Q14 2Q15 6M14 6M15
2Q14 2Q15 6M14 6M15
2Q14 2Q15 6M14 6M15
9
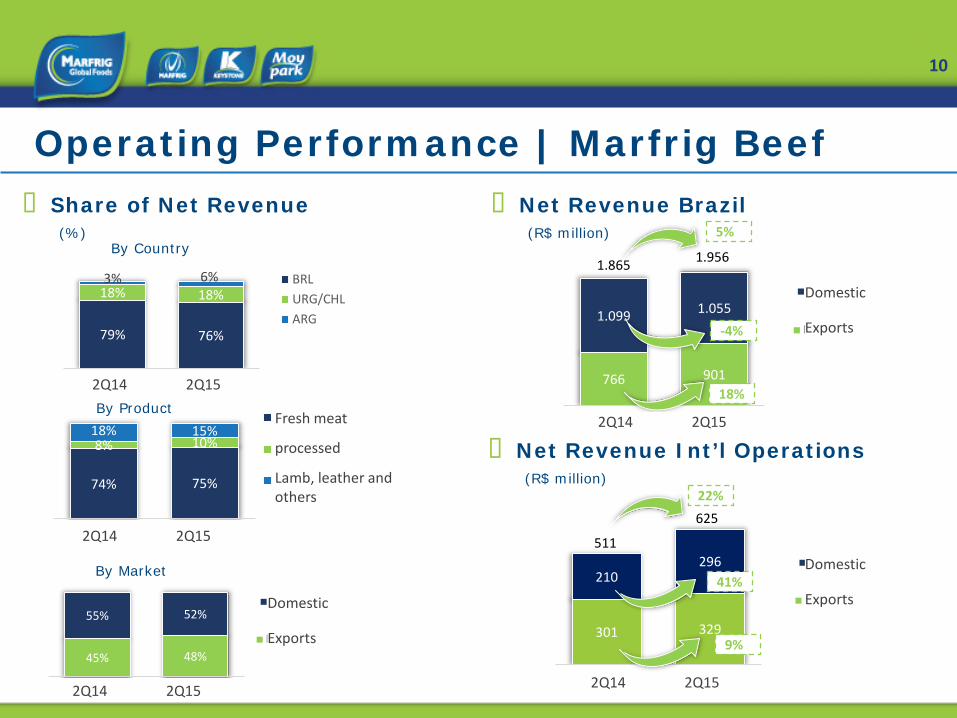
Operating Performance | Marfrig Beef� Share of Net Revenue
(%)By Country
By Product
By Market
79% 76%
18% 18%3% 6%
2T14 2T15
BRLURG/CHLARG
74% 75%
8% 10%18% 15%
2T14 2T15
Carne in natura
Processados
Ovinos, Couro,Outros
45% 48%
55% 52%
2T14 2T15
Exportação
MercadoInterno
� Net Revenue Brazil (R$ million)
� Net Revenue Int’l Operations(R$ million)
766 901
1.099 1.055
2T14 2T15
Exportação
MercadoInterno
301 329
210296
2T14 2T15
Exportação
MercadoInterno
1.865 1.956
625
511
-4%
18%
5%
41%
9%
22%
2Q14 2Q15
2Q14 2Q15
2Q14 2Q15
2Q14 2Q15
2Q14 2Q15
Fresh meat
processed
Lamb, leather and others
Domestic
Exports
Domestic
Exports
Domestic
Exports
10

Operating Performance | Marfrig Beef� Slaughter Volume
(‘000 head)
Total Brazil
� Capacity Utilization(% of authorized capacity in operation)
� Temporary closure of 5 of the 15 slaughtering plants, or approximately 29% of the total authorized capacity in operation.
� The objective is to achieve capacity utilization of 90-95%.
� Conclusion of the restructuring of production units.
1.562 1.555
1S14 1S15
1.220 1.206
1S14 1S15
-0.5% -1.1%
66,9%
82,9%
1T15 2T15
65,0%
74,9%
1S14 1S15
6M14 6M15 6M14 6M15
6M14 6M151Q15 2Q15
11

353 373
2T14 2T15
Domestic Market | Beef Brasil� Food Service share in Total
Domestic Revenue(R$ million)
1.098 1.055
6%
Others
Food Service
� Fresh and Processed Meat� Net Revenue
(R$ million)
� Volume('000 ton)
� Average Price(R$/Kg)
79 70 70
2T14 1T15 2T15
-11%
861852
873
2T14 1T15 2T15
10,9512,14 12,50
2T14 1T15 2T15
14%
1%
2Q14 2Q15
2Q14 1Q15 2Q15
2Q14 1Q15 2Q15
2Q14 1Q15 2Q15
12

343
261293
2T14 1T15 2T15
7365
78
2T14 1T15 2T15
Exports | Beef Brasil� Market Share Fresh Meat
(% Volume (1))
� Export Volume('000 ton)
� Share of Exports(% Beef Brasil Revenue )
� Export Revenue(USD million)
7%
-14%
41% 41%
46%
2T14 1T15 2T15
19.0%19.9%
20.6%19.8%
21.6%
14,0%15,0%16,0%17,0%18,0%19,0%20,0%21,0%22,0%
0
200
400
600
800
2T14 3T14 4T14 1T15 2T15
(1) Secex
2Q14 1Q15 2Q15
2Q14 1Q15 2Q152Q14 1Q15 2Q15
2Q14 3Q14 4Q14 1Q15 2Q15
13
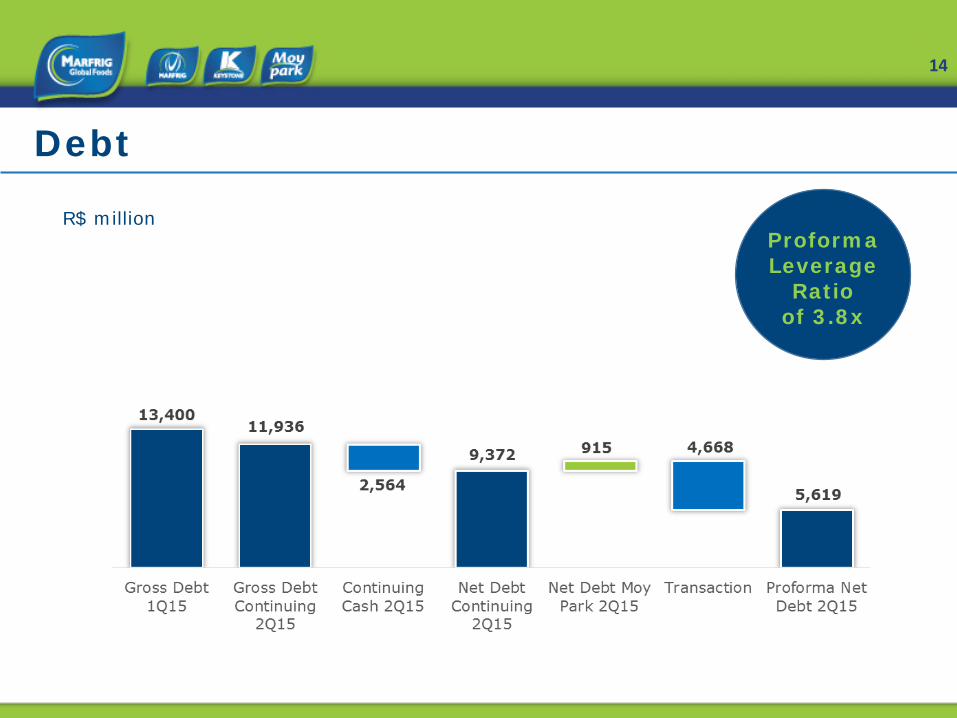
Debt
R$ millionProforma Leverage
Ratio of 3.8x
14

2,564
450 1,066
246 196 677 757
3,0142,392
2,993
145
6,317
Cash 3Q15 4Q15 1Q16 2Q16 2016 2017 2018 2019 2020 2021
Short Term R$ 2.0 bn
Debt Maturity Schedule excl. Moy Park
R$ million
(1) Cash to be received from the sale of Moy Park.
3,753(1)
15
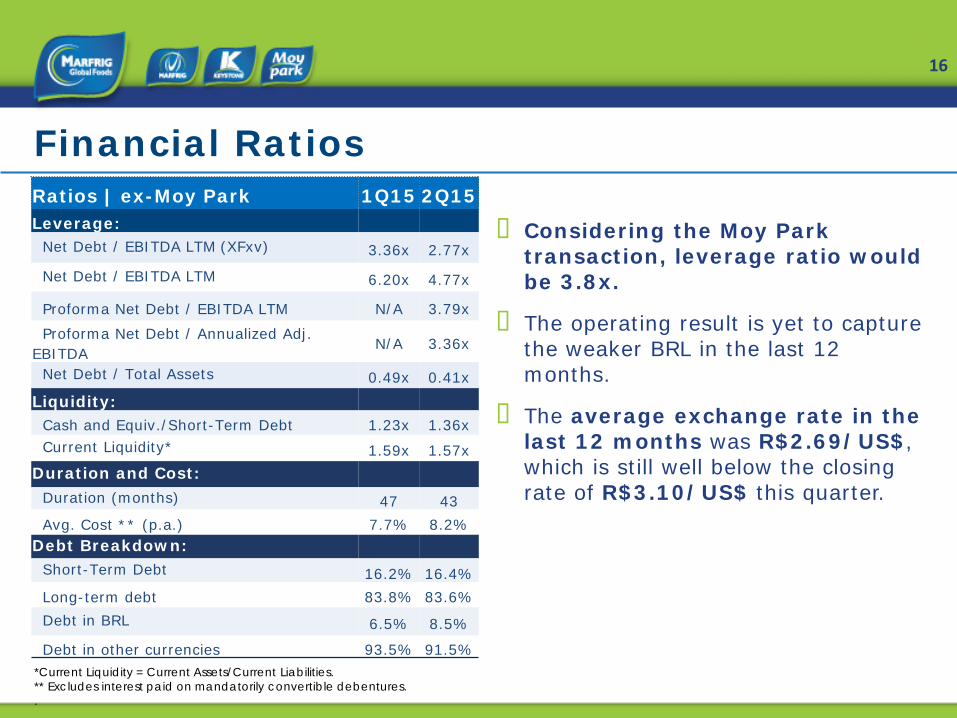
� Considering the Moy Park transaction, leverage ratio would be 3.8x.
� The operating result is yet to capture the weaker BRL in the last 12 months.
� The average exchange rate in the last 12 months was R$2.69/US$, which is still well below the closing rate of R$3.10/US$ this quarter.
*Current Liquidity = Current Assets/Current Liabilities.** Excludes interest paid on mandatorily convertible debentures..
Financial RatiosRatios | ex-Moy Park 1Q15 2Q15Leverage:
Net Debt / EBITDA LTM (XFxv) 3.36x 2.77x
Net Debt / EBITDA LTM 6.20x 4.77x
Proforma Net Debt / EBITDA LTM N/A 3.79xProforma Net Debt / Annualized Adj.
EBITDAN/A 3.36x
Net Debt / Total Assets 0.49x 0.41xLiquidity:
Cash and Equiv./Short-Term Debt 1.23x 1.36xCurrent Liquidity* 1.59x 1.57x
Duration and Cost:Duration (months) 47 43Avg. Cost ** (p.a.) 7.7% 8.2%
Debt Breakdown:Short-Term Debt 16.2% 16.4%Long-term debt 83.8% 83.6%Debt in BRL 6.5% 8.5%
Debt in other currencies 93.5% 91.5%
16
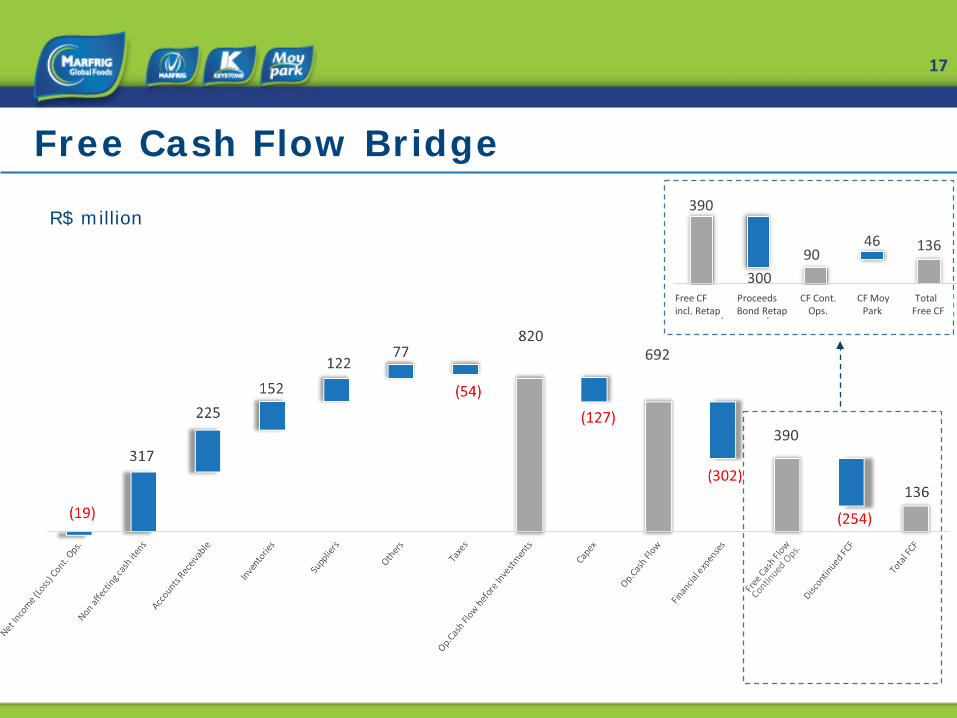
390
30090
46 136
FC LivreIncl. Retap
RecursosRetap
FC Op.Cont.
FC MoyPark
FC LivreTotal
Free Cash Flow Bridge
R$ million
Free CF Proceeds CF Cont. CF Moy Total incl. Retap Bond Retap Ops. Park Free CF
17
Closing Remarks
� We generated strong free cash flow, transformed Marfrig Beef Brazil andsigned an agreement to sell Moy Park.
� The strategic decision to divest Moy Park leaves Marfrig with a stronger focuson the foodservice channel, which offers excellent opportunities for growth inthe key markets of Asia and the United States.
� This transaction significantly reduces Marfrig’s net debt, which ended thequarter with a ratio of Pro-Forma Net Debt to EBITDA from ContinuingOperations of 3.8x in 2Q15.
� Cash generation in the quarter confirms our determination and financialdiscipline, and was the result of our pursuit of increased operating efficiencyand better working capital management.
18

Closing Remarks
� Marfrig Beef posted margin of 9.7%, driven by greater efficiency, improvedsales mix and continuous improvement in the management of costs andexpenses. The second-quarter results only partially reflect these changes,since many are still in the implementation phase.
� The opening up of the U.S. and Chinese markets to Brazilian beef importsshould generate volume growth in the medium term. We have already begunshipments to China and hope to make our first shipments to the United Statesbefore year-end.
� Marfrig Beef’s international operations continue to make a positive contributionto the division's results.
19

Closing Remarks
� Keystone continues to contribute to free cash flow, posting accelerated growthand benefitting from its impeccable reputation for customer service andexecution excellence in its industrial operations.
� Strategically, Marfrig's priorities are:
� expanding Keystone's food service business in both Asia and the United States;
� optimizing production capacity at Marfrig Beef;
� growing beef exports from Brazil; and
� strengthening the capital structure and increasing free cash flow.
20
This material is a presentation of general information about Marfrig GlobalFoods S.A. and its consolidated subsidiaries (jointly the “Corporation”) on thedate hereof. The information is presented in summary form and does notpurport to be complete.
No representation or warranty, either expressed or implied, is made regardingthe accuracy or scope of the information herein. Neither the Company nor anyof its affiliated companies, consultants or representatives undertake anyresponsibility for any losses or damages arising from any of the informationpresented or contained in this presentation. The information contained in thispresentation is up to date as of June 30, 2015, and, unless stated otherwise, issubject to change without prior notice. Neither the Corporation nor any of itsaffiliated companies, consultants or representatives have signed anycommitment to update such information after the date hereof. Thispresentation should not be construed as a legal, tax or investmentrecommendation or any other type of advice.
The data contained herein were obtained from various external sources andthe Corporation has not verified said data through any independent source.Therefore, the Corporation makes no warranties as to the accuracy orcompleteness of such data, which involve risks and uncertainties and aresubject to change based on various factors.
This presentation includes forward-looking statements. Such statements donot constitute historical fact and reflect the beliefs and expectations of theCorporation’s management. The words “anticipates,” “hopes,” “expects,”“estimates,” “intends,” “projects,” “plans,” “predicts,” “projects,” “aims” andother similar expressions are used to identify such statements.
Although the Corporation believes that the expectations and assumptionsreflected by these forward-looking statements are reasonable and based onthe information currently available to its management, it cannot guaranteeresults or future events. Such forward-looking statements should beconsidered with caution, since actual results may differ materially from thoseexpressed or implied by such statements. Securities are prohibited from beingoffered or sold in the United States unless they are registered or exempt fromregistration in accordance with the U.S. Securities Act of 1933, as amended(“Securities Act”). Any future offering of securities must be made exclusivelythrough an offering memorandum. This presentation does not constitute anoffer, invitation or solicitation to subscribe or acquire any securities, and nopart of this presentation nor any information or statement contained hereinshould be used as the basis for or considered in connection with any contractor commitment of any nature. Any decision to buy securities in any offeringconducted by the Corporation should be based solely on the informationcontained in the offering documents, which may be published or distributedopportunely in connection with any security offering conducted by theCompany, depending on the case.
Disclaimer

IR Contacts
Website
www.marfrig.com.br/ri
Address
Avenida Chedid Jafet, 222 Bloco A 5º andar -São Paulo - SP SP: +55 (11) 3792-8650
Telephone
@