approaching the limit of predictability in human mobility
TRANSCRIPT

Approaching the Limit of Predictability inHuman MobilityXin Lu1,2,3,4, Erik Wetter2,5, Nita Bharti6, Andrew J. Tatem7,8 & Linus Bengtsson2,3
1College of Information System and Management, National University of Defense Technology, 410073 Changsha, China,2Flowminder Foundation, 17177 Stockholm, Sweden, 3Department of Public Health Sciences, Karolinska Institutet, 17177Stockholm, Sweden, 4Department of Sociology, Stockholm University, 17177 Stockholm, Sweden, 5Department of Managementand Organization, Stockholm School of Economics, 11383 Stockholm, Sweden, 6Department of Biology, Center for InfectiousDisease Dynamics and Huck Institute of Life Sciences, Penn State University, University Park, PA 16801, USA, 7Department ofGeography and Environment, University of Southampton, Highfield, Southampton, United Kingdom, 8Fogarty International Center,National Institutes of Health, Bethesda, MD 20892, USA.
In this study we analyze the travel patterns of 500,000 individuals in Cote d’Ivoire using mobile phone calldata records. By measuring the uncertainties of movements using entropy, considering both the frequenciesand temporal correlations of individual trajectories, we find that the theoretical maximum predictability isas high as 88%. To verify whether such a theoretical limit can be approached, we implement a series ofMarkov chain (MC) based models to predict the actual locations visited by each user. Results show that MCmodels can produce a prediction accuracy of 87% for stationary trajectories and 95% for non-stationarytrajectories. Our findings indicate that human mobility is highly dependent on historical behaviors, and thatthe maximum predictability is not only a fundamental theoretical limit for potential predictive power, butalso an approachable target for actual prediction accuracy.
Studies of mobility patterns and predictions of individual mobility trajectories are important in manyresearch fields, such as mobile computing, epidemic modeling, traffic planning and disaster response1–3.Real-time locations visited by individuals are typically collected through mobile devices equipped with
global-positioning system (GPS) capability, mobile phone cell towers, or wireless local area network (WLAN)access points.
Various methods have been proposed to forecast individual trajectories, including Markov chain (MC) mod-els4,5, neural networks6, Bayesian networks7, and finite automaton8. Prediction accuracy has been shown to varyaccording to the algorithm used and the context from which the location data come. For example, in an evaluationof next cell prediction based on more than 6000 users on Dartmouth’s campus-wide Wi-Fi wireless network, itwas found that the best predictor (the O 2ð Þ-MC model) had an accuracy of about 65–72%9. In another studywhere mobility traces of six researchers and GPS-locations of 175 individuals were used, the prediction accuracywas shown to be in the range of 70% to 95% with anO 2ð Þ-MC model10–12. On the other hand, in an evaluation ofMC models for pedestrian-movement prediction, the prediction accuracy was as low as 2%, 45% and 74.4% forthe O 1ð Þ-MC model, hidden-Markov model, and the mixed MC model, respectively13.
The above studies investigated small numbers of individuals or special populations, and the results andpractical feasibility of the proposed new predictive algorithms were therefore difficult to generalize to the generalpopulation. In addition, it was not clear how well these algorithms performed versus the best possible algorithmthat could theoretically be constructed; i.e., what is, for the given data type, the best possible accuracy achievableand how well do the predictive algorithms perform versus such a benchmark? The highest potential accuracy ofpredictability, termed ‘‘maximum predictability’’ (Pmax), is defined by the entropy of information of a person’strajectory (frequency, sequence of location visits, etc.). Pmax can be calculated by solving a limiting case of Fano’sinequality (a relation derived from calculation of the decrease in information in a noisy information channel)14–16.
By measuring Pmax, Song et al showed, using a mobile phone dataset of 50,000 users in a high-income country,that there is a 93% potential predictability in user mobility, despite very large differences in travel distances17.Under much more extreme conditions and in a low-income setting, Lu et al analyzed a complete mobile phonedataset of 2.9 million anonymous subscribers after the earthquake in Haiti in 2010, and found that despite massivepopulation movements and increased travel distances following the earthquake, the predictability of people’smovements remained as high as 85%, indicating a fundamental regularity in human mobility1. These findings are
OPEN
SUBJECT AREAS:STATISTICAL METHODS
COMPUTATIONAL BIOLOGY ANDBIOINFORMATICS
INFORMATION TECHNOLOGY
EPIDEMIOLOGY
Received21 May 2013
Accepted19 September 2013
Published11 October 2013
Correspondence andrequests for materials
should be addressed toX.L. (xin.lu@
flowminder.org)
SCIENTIFIC REPORTS | 3 : 2923 | DOI: 10.1038/srep02923 1

promising for the design and improvement of predictive algorithms.However, these studies did not show how close to the maximumpotential predictability the accuracy of actual algorithms can comein practice.
In this study we aim to fill this gap in knowledge by measuring themaximum predictability and performance of actual prediction algo-rithms on a mobile phone data set of 500,000 users from Coted’Ivoire (CIV), West Africa. We also give an overview of populationmobility patterns during the data collection period, which took placeafter the 2011 civil war. We find that the maximum predictability andregularity in mobility in CIV is high, similar to what was found instudies in Haiti and Europe1,17. The evaluation of practical predictivealgorithms on this dataset reveals that the maximum predictabilitycan be approached with MC-based models. Interestingly, we also
show that higher order MC models do not generate improved pre-diction accuracy when compared to a first order MC model.
ResultsThe mobile phone dataset. Mobility data was provided by thetelecom company Orange and derived from call detail records(CDR) from a random sample of 500,000 anonymous Orangemobile phone subscribers, active during December 1, 2011 to April28, 2012 in CIV. The user’s location was provided as the location ofthe subprefecture (sous-prefecture in French) of the mobile phonetower through which the call was routed. CIV is composed of 19regions, which are further divided into 255 subprefectures (237 ofthese subprefectures have at least one tower, see Fig. 1). The originalCDR contains approximately five million users (1/4 of the total
Savanes
Zanzan
Vallee du Bandama
Bas-Sassandra
Worodougou
Denguele
N'zi-Comoe
Dix-Huit Montagnes
Haut-Sassandra
Moyen-Cavally
LagunesSud-Bandama
Agneby
Lacs
Bafing
Marahoue
Fromager
Moyen-Comoe
Sud-Comoe
Figure 1 | Administrative map of Cote d’Ivoire and distribution of cell phone towers. (http://sodexo.orange-labs.fr/GEOM_SUB_PREFECTURE.zip).
www.nature.com/scientificreports
SCIENTIFIC REPORTS | 3 : 2923 | DOI: 10.1038/srep02923 2
population of CIV)18,19. Detailed description of the data can be foundin20.
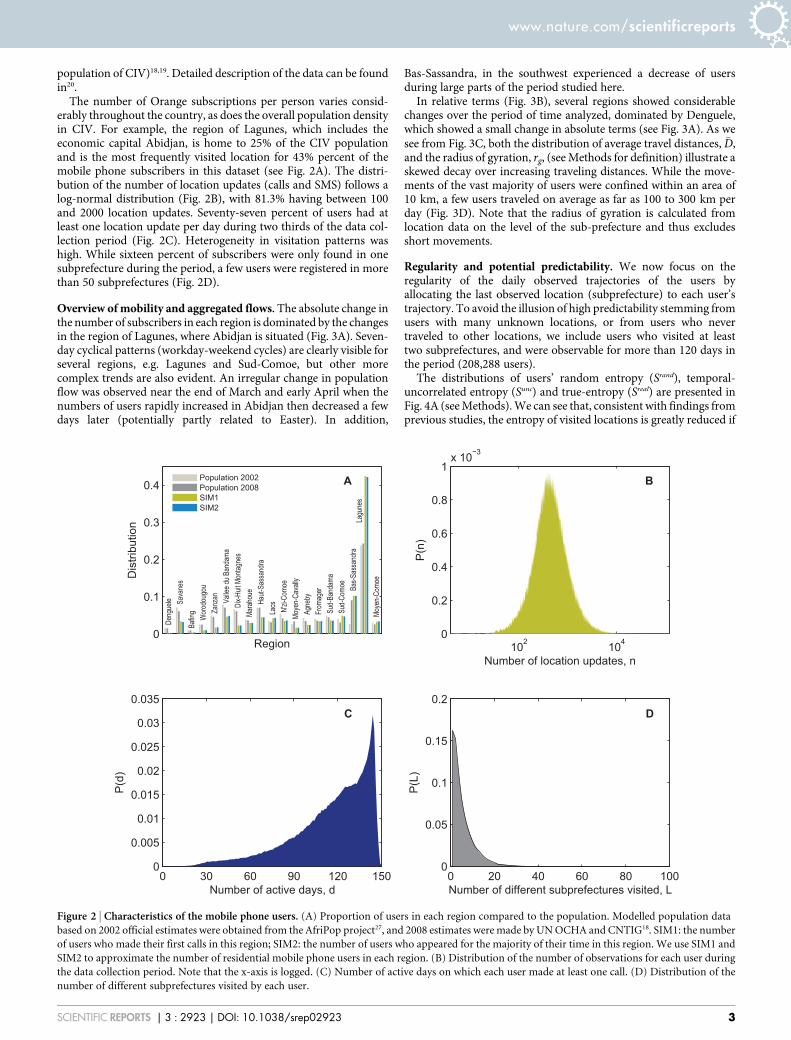
The number of Orange subscriptions per person varies consid-erably throughout the country, as does the overall population densityin CIV. For example, the region of Lagunes, which includes theeconomic capital Abidjan, is home to 25% of the CIV populationand is the most frequently visited location for 43% percent of themobile phone subscribers in this dataset (see Fig. 2A). The distri-bution of the number of location updates (calls and SMS) follows alog-normal distribution (Fig. 2B), with 81.3% having between 100and 2000 location updates. Seventy-seven percent of users had atleast one location update per day during two thirds of the data col-lection period (Fig. 2C). Heterogeneity in visitation patterns washigh. While sixteen percent of subscribers were only found in onesubprefecture during the period, a few users were registered in morethan 50 subprefectures (Fig. 2D).
Overview of mobility and aggregated flows. The absolute change inthe number of subscribers in each region is dominated by the changesin the region of Lagunes, where Abidjan is situated (Fig. 3A). Seven-day cyclical patterns (workday-weekend cycles) are clearly visible forseveral regions, e.g. Lagunes and Sud-Comoe, but other morecomplex trends are also evident. An irregular change in populationflow was observed near the end of March and early April when thenumbers of users rapidly increased in Abidjan then decreased a fewdays later (potentially partly related to Easter). In addition,
Bas-Sassandra, in the southwest experienced a decrease of usersduring large parts of the period studied here.
In relative terms (Fig. 3B), several regions showed considerablechanges over the period of time analyzed, dominated by Denguele,which showed a small change in absolute terms (see Fig. 3A). As wesee from Fig. 3C, both the distribution of average travel distances, �D,and the radius of gyration, rg, (see Methods for definition) illustrate askewed decay over increasing traveling distances. While the move-ments of the vast majority of users were confined within an area of10 km, a few users traveled on average as far as 100 to 300 km perday (Fig. 3D). Note that the radius of gyration is calculated fromlocation data on the level of the sub-prefecture and thus excludesshort movements.
Regularity and potential predictability. We now focus on theregularity of the daily observed trajectories of the users byallocating the last observed location (subprefecture) to each user’strajectory. To avoid the illusion of high predictability stemming fromusers with many unknown locations, or from users who nevertraveled to other locations, we include users who visited at leasttwo subprefectures, and were observable for more than 120 days inthe period (208,288 users).
The distributions of users’ random entropy (Srand), temporal-uncorrelated entropy (Sunc) and true-entropy (Sreal) are presented inFig. 4A (see Methods). We can see that, consistent with findings fromprevious studies, the entropy of visited locations is greatly reduced if
0
0.1
0.2
0.3
0.4
Region
Dis
tribu
tion
Population 2002Population 2008SIM1SIM2
102 1040
0.2
0.4
0.6
0.8
1x 10⁻³
Number of location updates, n
P(n
)
0 30 60 90 120 1500
0.005
0.01
0.015
0.02
0.025
0.03
0.035
Number of active days, d
P(d
)
0 20 40 60 80 1000
0.05
0.1
0.15
0.2
Number of different subprefectures visited, L
P(L
)
A B
C D
Deng
uele Sa
vane
sBa
fing
Wor
odou
gou
Zanz
an
Valle
e du B
anda
ma
Dix-H
uit M
ontag
nes
Mara
houe
Ha
ut-Sa
ssan
dra
Lacs N'zi-
Como
e Mo
yen-
Cava
lly
Agne
by
From
ager
Su
d-Ba
ndam
a Su
d-Co
moe
Bas-S
assa
ndra
La
gune
s
Moye
n-Co
moe
Figure 2 | Characteristics of the mobile phone users. (A) Proportion of users in each region compared to the population. Modelled population data
based on 2002 official estimates were obtained from the AfriPop project27, and 2008 estimates were made by UN OCHA and CNTIG18. SIM1: the number
of users who made their first calls in this region; SIM2: the number of users who appeared for the majority of their time in this region. We use SIM1 and
SIM2 to approximate the number of residential mobile phone users in each region. (B) Distribution of the number of observations for each user during
the data collection period. Note that the x-axis is logged. (C) Number of active days on which each user made at least one call. (D) Distribution of the
number of different subprefectures visited by each user.
www.nature.com/scientificreports
SCIENTIFIC REPORTS | 3 : 2923 | DOI: 10.1038/srep02923 3

we consider both the spatial and temporal correlation of the visitsequences. The median value of Srand is 2.0, indicating that if weassume that individuals randomly choose a location to visit the nextday, a typical individual could be found in any of 22.0 < 4 locations.On the other hand, if we use information contained in the frequencyand sequence order of the trajectory of individuals, the uncertainty ina typical individual’s whereabouts reduces to 2Sunc
~20:91<1:88 and2Sreal
~20:71<1:64, in less than two locations.Not surprisingly, the reduced uncertainty leads to increased max-
imum predictability, as shown in Fig. 4B. If information is availableonly on the number of unique locations visited, Li, the accuracy ofany predictive algorithm cannot exceed 0.35. With the additionalinformation on frequency and temporal correlation, the average pre-dictability increases to ,Punc. < 0.84, and ,Pmax. < 0.88,respectively. Additionally, we evaluated the sensitivity of our entropyand predictability measures to the sampling rate of the data, withoutfinding any important biases (see Supporting Information S1).
In Fig. 4C, we investigated the correlation between the radius ofgyration and the average predictability, ,P.. There is a steadydecrease of ,Prand. and ,Punc. when rg increases (measuredbased on the centroid of each subprefecture). On the other hand,,Pmax. stays around 0.85 for a wide range of rg g [20, 300]. Thisfinding is consistent with previous studies, revealing the independ-ence of predictability on travel distance in human mobility1,17.However, we have also examined other travel distance measure-ments. Increases in average travel distance (�D) cause a slight decrease
in predictability. ,Pmax. ranging from 0.9 to 0.7 when �D increasesfrom 1 to 20 km, and stays around 0.63 0.68 for �D [ 20,70½ �. However,interestingly, predictability decreases considerably with an increas-ing number of unique locations visited. From Fig. 4E, we can see thatthe average predictability ,Punc. and ,Pmax. decays almost lin-early with the number of unique locations visited.
Prediction accuracy based on Markov-chain models. The predicta-bility analysis in the previous section reveals that, by combininginformation on frequency with temporal correlation of the trajec-tory, the theoretical upper bound of prediction accuracy can get ashigh as 0.88. However, the largest prediction accuracy that can beachieved with properly designed predictive algorithms is not givendirectly by this measure. In this section, we use MC(n) models topredict the location of users on each day, by considering all previousdata points in the trajectory (see Methods). The accuracy of thesemodels is presented in Fig. 5A and shows accuracies of more than 0.8for almost all days. The accuracy of MC-based models (,c. < 0.91),MC(1) toMC(7), produce substantially higher accuracies than theestimation method based only on frequency information, i.e., MC(0)(,c. < 0.85).
There is however little difference between the performance of MC-based models of different orders. At the beginning of the period whenhistorical information is limited, the accuracy of MC(1) is slightlyhigher than the other MC models, however this difference becomesvery small when the historical trajectory is over 100 data points.
Figure 3 | Overview of population movements: (A) Cumulative change in number of users in each region. (B) Same data as in panel (A) but changes are
shown in proportion to the number of users in each region at the beginning of the period. (C) Distribution of average travel distances �D and the radius of
gyration, rg. (D) Cumulative probability distribution of average daily travel distance over the 150 study days.
www.nature.com/scientificreports
SCIENTIFIC REPORTS | 3 : 2923 | DOI: 10.1038/srep02923 4

Another interesting finding from Fig. 5A, is that the MC-basedmodels perform more robustly than MC(0). For example, during thelater period of the data, there is a sharp decrease in the accuracy ofMC(0) (from 0.88 to 0.77), while the accuracy of MC-based modelsshows a much smaller decrease, from 0.92 to 0.87. Irruptions ofdecreased accuracy from the MC(0) model indicate that peoplemoved abnormally from their regular patterns. The sustainabilityof MC-based models reveals that such abnormalities can be capturedpartly by considering the temporal correlation of visiting sequencesin the trajectories.
The increase of ,c. over the observation period is not very appar-ent from Fig. 5A, as ,c. is calculated based on a combination of userswith long and short historical trajectories. To investigate the effect of
trajectory length on the performance of algorithms, we removed, foreach user, the unknown locations and calculated the average predictionaccuracy for users with valid historical trajectories of the same lengthLhist. The results (Fig. 5B) show that the accuracy of MC(0) approachesrelative stability after around 15 historical data points. For a wide rangeof Lhsit g [15, 120], ,c. is steady around 0.85, indicating that thevisiting behavior on frequency is relatively stable over time for userswith valid historical trajectories of this range. On the other hand, thereis a steady increase of ,c. for the MC-based models. When theavailable historical trajectories contain more than 100 data points,the average prediction accuracy climbs to over 0.9.
The performance of MC-based models indicates that, while thepredictability of a typical user is Pmax 5 0.88, which gives an upper
Figure 4 | Entropy and predictability analysis based on trajectory of visited subprefectures. (A) Shows the frequency distribution of Srand, Sunc and Sreal.
(B) Shows the frequency distribution of Prand, Punc and Pmax. (C) Shows the correlation between radius of gyration and Pmax. (D) Shows the correlation
between average travel distance �D and P. (E) Shows the correlation between the number of different locations visited and P.
Figure 5 | Visiting behavior and prediction accuracy. (A) Proportion of accurate predictions for each day based on historical data (users who were not
active on a day are excluded in the prediction). In (B), the accuracy of predictive algorithms increases with the length of historical trajectories. (C) Fraction
of time users spent in their most n visited subprefectures. Subscribers are divided into 10 groups based on the number of distinct locations they visited (N).
www.nature.com/scientificreports
SCIENTIFIC REPORTS | 3 : 2923 | DOI: 10.1038/srep02923 5

bound for the accuracy of any predictive algorithm when the traject-ory is stable, the MC-based models are able to produce estimates ashigh as 0.91, even higher than the theoretical upper limit. Possiblereasons for why the practical algorithm can produce accuracieshigher than Pmax could be that the trajectory data contains onlyone data point for each day, which means that the maximum lengthof the trajectory can only be 150 and the movement patterns ofindividuals may not yet have stabilized. To investigate the effect ofstability on the performance of prediction algorithms, we use theGeweke diagnostic21,22 to classify Xi into stationary and non-station-ary trajectories (see Methods). In Fig. 6, we can see that there is a cleardifference in the prediction accuracy of MC models between station-ary and non-stationary trajectories: after 50 historical observations,the average prediction rate is about 0.95 for non-stationary traject-ories and only 0.87 for stationary trajectories. This finding confirmsthat, given that the trajectory is stationary, the maximum predict-ability,Pmax, provides an upper bound of accuracy for any predictionalgorithm. However, for non-stationary trajectories we show thatprediction accuracy can greatly surpass the maximum predictability.
MC-models considering higher orders (longer correlations of pre-vious locations) do not necessarily improve prediction accuracy. Forexample, for trajectories with the same historical length, the MC(4)model always produces less precise predictions compared to otherMC-models (Fig. 5B). This finding is consistent with previous stud-ies, in which the MC(n . 2) model was found to not bring importantimprovement at the cost of a significant overhead in terms of com-putation and space for the learning and storing of the mobilitymodel9,12. It is worth noting that a large part of the predictive powerof the studied prediction algorithm is due to the fact that many
individuals spent a substantial time in his/her top visited locations.For example, users who visited four distinct subprefectures, stillspent almost 80% of their time in their most visited locations(Fig. 5C).
Entropy, predictability and prediction accuracy. The evaluation ofpredictive algorithms above reveal that, for this dataset, which is acombination of stationary and non-stationary trajectories, themaximum predictability Pmax can be achieved with a first-orderMarkov chain model (MC(1)). In this section, we investigatewhether the individual predictability, Pmax
i , is correlated with theaccuracy in predicting all the locations when the trajectoryincreases from 1 to T. We measure the individual predictionaccuracy (,ci.) by the proportion of accurate predictions over alldays for each individual (days without any location data areexcluded).
First, we check the correlation between prediction accuracy andthe disorder in the trajectory, i.e., Sreal. As we can see from Fig. 7A,,ci. is highly correlated with the trajectory’s entropy; the larger theentropy, the lower the prediction accuracy. The correlation coef-ficient between Sreal and ,ci. is as high as 20.849, with p ,
0.000. Second, we investigate the correlation between predictionaccuracy and the maximum predictability, i.e., Pmax
i . Not surpris-ingly, Pmax
i also correlates highly with ,ci., with a correlationcoefficient of 0.802, p , 0.000 (Fig. 7B).
The high correlation between predictability and prediction accu-racy of the MC(1) model reveals that, as a measurement for disorderand potential predictability, Sreal and Pmax
i capture the theoreticallimits for the predictive analysis of human movement behaviors,
1
Figure 6 | Prediction accuracy on stationary (A, C) and non-stationary (B, D) trajectories.
www.nature.com/scientificreports
SCIENTIFIC REPORTS | 3 : 2923 | DOI: 10.1038/srep02923 6

and provide an approachable upper bound of predictive power forthis type of mobility data. More broadly, the approach used hereprovides an important strategy to evaluate and guide the designand improvement of mobility prediction algorithms.
DiscussionBy investigating the movement of 500,000 mobile phone usersduring the post-civil war period in Cote d’Ivoire, we have found apotential predictability in user mobility as high as 88% in this West-African, lower-middle income setting. The finding of high predict-ability is consistent with two previous studies which investigated themobility patterns of mobile phone users in very different settings, onein a high-income country with stable social conditions17 and one in alow-income country following an extreme natural disaster1. Byapplying MC-based estimate algorithms, we found that the firstorder MC model (MC(1)) is able to produce an average predictiveaccuracy of 91%, with stationary and non-stationary trajectories hav-ing a predictive accuracy of 87%, and 95% respectively.
One would perhaps assume that Markov chains of second or sev-enth order would produce next-location estimates with higher accu-racy, as aggregated flows based on mobile phone data frequentlyshow weekly cycles, see e.g., Fig. 3A, and1,2,17. However, our evalua-tions on the MC(n) models show that this information is not neces-sary in this setting. This could be due to the fact that many people inCote d’Ivoire do not have a two-day weekend, and that unplannedjourneys are less common in resource-limited settings, which may betrue of travel in general23,24. The trajectories used for prediction con-tain only the last observed location on each day, which makes itdifficult for the time series to reach stability. As we can see, there isa big difference in the predictive power between stationary and non-stationary trajectories, implying that the diagnostics for convergenceare critical for drawing conclusions from predictability analysis onhuman mobility. Nevertheless, we believe that the evaluation of pre-dictive performance on a daily basis is most practical for the long-term investigation of population movements. For the purpose of thisstudy, we have only included the Markov chain based models in theevaluation of predictive performance of algorithms. Future studiesmay want to compare other predictive algorithms, such as dynamicBayesian networks (DBN)25, neural networks6 and finite automaton8,and to evaluate the feasibility of predicting aggregated populationmovements with individual-based travel behavior models.
In summary, this paper is, to the best of our knowledge, the firstattempt to investigate both the maximum predictability and howclose to this value practical algorithms can come when applied on
a large mobile phone data set. Our results not only show that thepredictability of human mobility is high, but also show that this highpredictability is achievable for daily population movement predic-tions. These findings indicate that human mobility behavior is farfrom random, and that individuals’ movements are highly influencedby their historical behavior. With a good understanding of indivi-duals’ travel patterns, mobility modeling and public policy decisionmaking, such as epidemic modeling, urban planning, and trafficdesign, may be significantly improved.
MethodsMeasures of mobility. We use the average travel distance, �D, and the radius ofgyration of the trajectory, rg, to measure the mobility property of individuals.Specifically, let Mi 5 {m1, m2, …, mn} be the sequence of observed location updates forperson i during the period of data collection. Then �D and rg are defined by:
�D ið Þ~Xn
j~2mj{mj{1
�� �� ð1Þ
and rg ið Þ~ffiffiffiffiffiffiffiffiffiffiffiffiffiffiffiffiffiffiffiffiffiffiffiffiffiffiffiffiffiffiffiffiffiffi1n
Pnj~1 mj{�m�� ��2
q, where jmj 2 mj21j is the distance between location
mj and mj21, and �m~ 1n
Pj mj is the center of mass of the trajectory26.
The radius of gyration is different from the average travel distance. Someone whomoves in a comparatively confined space will have a small radius of gyration eventhough he or she covers a large distance. On the other hand, rg can be larger than �D ifsomeone travels with small steps but in a fixed direction or in a large circle. Note thatin the dataset used here we only know the location of each individual by subprefec-ture, consequently, the centroid of each subprefecture is used to approximate thecoordinates of individuals. Such an approximation can introduce imprecision for themeasure of travel distances, but still provides useful information when comparingmobility between users, as those who traveled across many subprefectures will havelarger rg and �D than those who spent most of their time in one or two subprefectures.
Measures of entropy and predictability. We are primarily interested in the stable,long-term patterns of population mobility behavior as opposed to short-termmovements. Here we focus on entropy and predictability analysis of day-to-daymovements of individuals. Let Xi 5 {x1, x2, …, xT} be the sequence of daily locationsfor person i during the data collection period of T days. xj is the last observed locationID of person i on day j, otherwise we mark xj ‘‘unknown’’. The uncertainty (ordisorder) of the trajectories can be measured by entropy. Larger entropy indicatesgreater disorder, and consequently reduces the predictability of an individual’smovements.
Entropy. Following notation in17 we measure: (i) the random entropy, Srandi ~log2Li ,
capturing the predictability of each user by assuming that the person’s whereaboutsare uniformly distributed among Li distinct locations in Xi; (ii) the temporal-uncor-related entropy, Sunc
i ~{PLi
k~1 pklog2pk , where pk is the frequency at which theperson visited the kth location among the Li distinct locations. Sunc
i takes into accountthe number of different locations visited as well as the proportion of time i spent ateach location, decreasing the uncertainty of the trajectory, and; (iii) the true-entropy,Sreal
i ~{P
X’i5XiP X’ið Þ log2 P X’ið Þ½ �, where P X’ið Þ is the probability of finding a sub-
sequence X’i in Xi, considering both spatial and temporal patterns.
Figure 7 | Correlation between entropy, predictability and prediction accuracy. Data points are aggregated into intervals of equal lengths.
(A) Correlation between entropy and prediction accuracy. (B) Correlation between predictability and prediction accuracy.
www.nature.com/scientificreports
SCIENTIFIC REPORTS | 3 : 2923 | DOI: 10.1038/srep02923 7

Predictability. Given the entropy E for an individual i, Fano’s inequality gives an upperlimit for the predictability of i, i.e., the level of accuracy the best possible predictivealgorithm can achieve:
PiƒPFanoi E, Lið Þ ð2Þ
where PFanoi is given by
E~H PFanoi
� �z 1{PFano
i
� �log2 Li{1ð Þ ð3Þ
and
H PFanoi
� �~{PFano
i log2 PFanoi
� �{ 1{PFano
i
� �log2 1{PFano
i
� �ð4Þ
Let Prandi ~PFano
i Srandi , Li
� �, Punc
i ~PFanoi Sunc
i , Li� �
and Pmaxi ~PFano
i Sreali , Li
� �,
since Srandi §Sunc
i §Sreali , it is true thatPmax
i §Punci §Prand
i . Comparing between thesethree predictability measurements provides us with the ability to investigate how thespatial distribution and temporal correlations in an individual’s trajectory improvepotential predictive power. Since Pmax
i provides the best possible predictive power(because it uses the maximum information from Sreal
i ) we refer to it in this paper as the‘‘maximum predictability’’.
Prediction algorithms. Predicting a user’s next location using Markov chain models.To investigate how close we can get to achieving P with actual prediction algorithmswe implement several variants of Markov chain (MC) based models.
In an MC-based model, the trajectory of each individual is modeled as a Markovchain of order n, which assumes that the movement of individuals between the Li
locations is a process with limited memory in the sense that the future location isvisited depending only on the previous n visited location, i.e., P Xtz1
i ~xtz1 Xti ~xt ,
���Xt{1
i ~xt{1, . . . , X1i ~x1:Þ~P Xtz1
i ~xtz1 Xti ~xt , Xt{1
i ~xt{1, . . . , Xt{nz1i ~
���xt{nz1:Þ, where Xt
i is a random variable representing the location for individual i attime t.
Given the previous n locations Xti ~xt
i , Xt{1i ~xt{1
i , . . . , Xt{nz1i ~xt{nz1
i , theprediction is then determined by the transition matrix, P, choosing the destinationlocation xpre(1 # pre # Li) which maximizes the probability:
P Xtz1i ~xpre Xt
i ~xti , Xt{1
i ~xt{1i , . . . , Xt{nz1
i ~xt{nz1i
��� �
~maxLik~1 P Xtz1
i ~xk Xti ~xt , Xt{1
i ~xt{1, . . . , Xt{nz1i ~xt{nz1
��� �� �
Increases of the order n in the Markov chain do not necessarily lead to improve-ment in the prediction accuracy. However, to investigate the correlation of predictivepowers with the length of trips to historical locations considered, we vary n from 1 to 7(one day to one week). If predictions for a higher ordered MC(n) model did not exist(i.e., the order of the previous n locations is unique in history), the prediction from alower ordered model, MC(n 2 1), was used.
The performance of each model was evaluated by the accuracy, c, which is theproportion of accurate predictions from all predictions made:
c~number of correct predictions
total number of predictions: ð5Þ
Users who were not active on a specific day were excluded from the prediction.
Next place prediction using historical frequency data. For comparison we implementeda simple algorithm predicting the next location based on the most visited location inthe historical trajectory: P xpreð Þ~maxLi
k~1 pk Xti ~xt
i , Xt{1i ~xt{1
i , . . . , X1i ~x1
i
���� �,
where pk is defined the same as in Sunc. As no temporal correlation is considered in thisalgorithm, we refer it as MC(0).
Using the MC models, we repeatedly updated the transition matrices and thevisiting frequency for each user when new locations were observed in the trajectory.We predicted for each user the most likely location s/he would visit on each day basedon all the historical information, i.e., for each day t, the transition matrices andvisiting frequency are constructed based on the trajectory from day 1 to day t 2 1.
Geweke diagnostic. The Geweke Diagnostic21,22 is a test to detect failure ofconvergence by comparing values in the early part of a Markov chain to those in thelatter part of the chain.
Let X1i ~ x1
i,t : t~1, . . . , n1
n oand X2
i ~ x2i,t : t~na, . . . , n
n o, where 1 , n1 , na
, n. let n2 5 n 2 na 1 1 and define
�h1~1
n1
Xn1
t~1
x1i,t , ð6Þ
�h2~1
n2
Xn2
t~na
x2i,t : ð7Þ
Then the statistic
Zn~�h1{�h2ffiffiffiffiffiffiffiffiffiffiffiffiffiffiffiffiffiffiffiffi
s1 0ð Þn1
zs2 0ð Þ
n2
q ð8Þ
converges to a standard normal distribution as n1 R ‘ given that the chain isstationary and (n1 1 n2)/n , 1.
In the above equation, s1 and s2 denote consistent spectral density estimates at zerofrequency21,22 for X1
i and X2i , respectively.
Large Zn-scores then indicate rejection of the null hypothesis and provide evidencethat the chain is non-stationary. For the purpose of this study, we first converted thevalues of xi,t into unique integers monotonically increasing from 1, and used a sig-nificant level of a 5 0.05 and let n2/n 5 50%. A trajectory is said to be stationary onlyif it passes all the tests at n1/n 5 0.2, n1/n 5 0.3, n1/n 5 0.4, and n1/n 5 0.5. By the end,the proportion of trajectories that passed the Geweke test (stationary trajectories) was49%, see also supporting figure S2.
1. Lu, X., Bengtsson, L. & Holme, P. Predictability of population displacement afterthe 2010 haiti earthquake. Proc Natl Acad Sci U S A 109, 11576–81 (2012).
2. Bengtsson, L., Lu, X., Thorson, A., Garfield, R. & von Schreeb, J. Improvedresponse to disasters and outbreaks by tracking population movements withmobile phone network data: A post-earthquake geospatial study in haiti. PlosMedicine 8, (2011).
3. Kenett, D. Y. & Portugali, J. Population movement under extreme events.Proceedings of the National Academy of Sciences 109, 11472–11473 (2012).
4. Ross, S. M. Introduction to probability models (Academic press, 2009).5. Liu, G. & Maguire Jr, G. A class of mobile motion prediction algorithms for
wireless mobile computing and communication. Mobile Networks andApplications 1, 113–121 (1996).
6. Liou, S.-C. & Lu, H.-C. Applied neural network for location prediction andresources reservation scheme in wireless networks. In International Conference onCommunication Technology Proceedings, 2003. ICCT 2003, vol. 2, 958–961 (IEEE,2003).
7. Akoush, S. & Sameh, A. Mobile user movement prediction using bayesian learningfor neural networks. In Proceedings of the 2007 international conference onWireless communications and mobile computing 191–196 (ACM, 2007).
8. Petzold, J., Bagci, F., Trumler, W. & Ungerer, T. Global and local contextprediction (2003).
9. Song, L., Kotz, D., Jain, R. & He, X. Evaluating next-cell predictors with extensivewi-fi mobility data. Mobile Computing, IEEE Transactions on 5, 1633–1649(2006).
10. Killijian, M.-O., Roy, M. & Tredan, G. Beyond san francisco cabs: Building a*-litymining dataset. In Proceedings of the Workshop on the Analysis of Mobile PhoneNetworks, 75–78 (2010).
11. Zheng, Y., Li, Q., Chen, Y., Xie, X. & Ma, W.-Y. Understanding mobility based ongps data. In Proceedings of the 10th international conference on Ubiquitouscomputing, 312–321 (ACM, 2008).
12. Gambs, S., Killijian, M.-O. & del Prado Cortez, M. N. Next place prediction usingmobility markov chains. In Proceedings of the First Workshop on Measurement,Privacy, and Mobility, 3 (ACM, 2012).
13. Asahara, A., Maruyama, K., Sato, A. & Seto, K. Pedestrian-movement predictionbased on mixed markov-chain model (2011).
14. Kontoyiannis, I., Algoet, P. H., Suhov, Y. M. & Wyner, A. J. Nonparametricentropy estimation for stationary processes and random fields, with applicationsto english text. Information Theory, IEEE Transactions on 44, 1319–1327 (1998).
15. Fano, R. M. Transmission of information: A statistical theory of communications.American Journal of Physics 29, 793–794 (1961).
16. Brabazon, A. & O’Neill, M. Natural computing in computational finance, vol. 1,(Springer, 2008).
17. Song, C. M., Qu, Z. H., Blumm, N. & Barabasi, A. L. Limits of predictability inhuman mobility. Science 327, 1018–1021 (2010).
18. UN OCHA Cote d’Ivoire and Le Comite National de Teledetection etd’Information Gegraphique (CNTIG). Common and fundamental operationaldatasets registry (2011). http://cod.humanitarianresponse.info/fr/country-region/c%C3%B4te-divoire [accessed Febuary 13, 2013].
19. Bank, T. W. Population total in cote d’ivoire (2011). http://data.worldbank.org/country/cote-divoire [accessed Febuary 13, 2013].
20. Blondel, V. D. et al. Data for development: the d4d challenge on mobile phonedata. arXiv:1210.0137v2 (2013).
21. Cowles, M. K. & Carlin, B. P. Markov chain monte carlo convergence diagnostics:a comparative review. Journal of the American Statistical Association 91, 883–904(1996).
22. Geweke, J. Evaluating the accuracy of sampling-based approaches to thecalculation of posterior moments. In IN BAYESIAN STATISTICS 169–193(Oxford: Oxford University Press, 1991).
23. Rubio, A., Frias-Martinez, V., Frias-Martinez, E. & Oliver, N. Human mobility inadvanced and developing economies: A comparative analysis. In AAAI SpringSymposia Artificial Intelligence for Development, AI-D, Stanford, USA (2010).
24. Wesolowski, A., Eagle, N., Noor, A. M., Snow, R. W. & Buckee, C. O. The impact ofbiases in mobile phone ownership on estimates of human mobility. Journal of theRoyal Society Interface 10, (2013).
25. Eagle, N., Clauset, A. & Quinn, J. A. Location segmentation, inference andprediction for anticipatory computing. In AAAI Spring Symposium: TechnosocialPredictive Analytics, 20–25 (2009).
26. Gonzalez, M. C., Hidalgo, C. A. & Barabasi, A. L. Understanding individualhuman mobility patterns. Nature 453, 779–782 (2008).
www.nature.com/scientificreports
SCIENTIFIC REPORTS | 3 : 2923 | DOI: 10.1038/srep02923 8

27. Tatem, A. & Linard, C. High spatial resolution data on persons per grid square incote d’ivoire (2010). http://www.afripop.org [accessed October 3, 2013].
AcknowledgementsThe authors would like to thank the operator France Telecom-Orange and the ‘‘Data forDevelopment’’ committee for sharing the mobile phone dataset and organizing the D4Dchallenge. This paper forms part of the output of the Human Mobility Mapping Project(www.thummp.org) and the AfriPop population mapping project (www.afripop.org). AJTacknowledges funding support from the RAPIDD program of the Science and TechnologyDirectorate, Department of Homeland Security, and the Fogarty International Center,National Institutes of Health, and is also supported by grants from NIH/NIAID(U19AI089674) and the Bill and Melinda Gates Foundation (#49446 and #1032350). NBacknowledges funding from the Branco Weiss - Society in Science.
Additional informationSupplementary information accompanies this paper at http://www.nature.com/scientificreports
Competing financial interests: The authors declare no competing financial interests.
How to cite this article: Lu, X., Wetter, E., Bharti, N., Tatem, A.J. & Bengtsson, L.Approaching the Limit of Predictability in Human Mobility. Sci. Rep. 3, 2923; DOI:10.1038/srep02923 (2013).
This work is licensed under a Creative Commons Attribution-NonCommercial-NoDerivs 3.0 Unported license. To view a copy of this license,
visit http://creativecommons.org/licenses/by-nc-nd/3.0
www.nature.com/scientificreports
SCIENTIFIC REPORTS | 3 : 2923 | DOI: 10.1038/srep02923 9
1
Supporting Information:
Approaching the Limit of Predictability in Human Mobility
Xin Lu1,2,3,4,*, Erik Wetter2,5, Nita Bharti6, Andy Tatem7,8, and Linus Bengtsson2,3
1, College of Information System and Management, National University of Defense
Technology, 410073 Changsha, China
2, Flowminder Foundation, 17177 Stockholm, Sweden
3, Department of Public Health Sciences, Karolinska Institutet, 17177 Stockholm, Sweden
4, Department of Sociology, Stockholm University, 17177 Stockholm, Sweden
5, Department of Management and Organization, Stockholm School of Economics, 11383
Stockholm, Sweden
6, Department of Biology, Center for Infectious Disease Dynamics and Huck Institute of
Life Sciences, Penn State University, University Park, PA 16801, USA
7, Department of Geography and Environment, University of Southampton, Highfield,
Southampton, United Kingdom
8, Fogarty International Center, National Institutes of Health, Bethesda, MD 20892, USA
S1. Distribution of Entropy and Predictability with Increased Sampling Rates
To examine the effect of sampling rates on the distributions of entropy and predictability, we
have increased the sampling rates of trajectory from once per day to two times ( 12S and 12 )
and three times ( 8S and 8 ) per day. Specifically we construct a trajectory for each individual
by his/her observed location every 12 hours (12:00, 0:00) and every 8 hours (8:00, 16:00,
0:00), respectively. Distribution of entropy and predictability for trajectories with more than
80% known locations are shown in Fig. S1.
We can see that, despite the different sampling rate, the distributions of S and are very
similar to those shown in the main text, indicating that the sampling rate has little effect on
our conclusion: that considering both the spatial and temporal correlation can reduce the
uncertainties and improve predictability significantly.
* Email: [email protected]

2
Fig. S1. Distribution of entropy and predictability for trajectories sampled two times a day (A, B) and three times a day (C, D). In comparison to the daily trajectory from the main text, which has the median
entropy (predictability) of 2.0 (0.25), 0.90 (0.84) and 0.71 (0.89), the median entropy (predictability) with increased sampling rate is 2.32 (0.20), 0.97 (0.84), 0.69 (0.90) for trajectories sampled twice a day, and is 2.59 (0.17), 1.04 (0.83), 0.70 (0.90), respectively.
1 2 3 4 5 6 70
0.1
0.2
0.3
0.4
0.5
0.6
0.7
Predictability, S12
P(S
12)
0 0.2 0.4 0.6 0.8 10
0.1
0.2
0.3
0.4
0.5
0.6
0.7
Predictability, 12
P(
12)
Srand
Sunc
Sreal
rand
unc
max
1 2 3 4 5 6 70
0.1
0.2
0.3
0.4
0.5
0.6
0.7
Entropy,S8
P(S
8)
0 0.2 0.4 0.6 0.8 10
0.1
0.2
0.3
0.4
0.5
0.6
0.7
Predictability, 8
P(
8)
rand
unc
max
Srand
Sunc
Sreal
A B
C D

3
S2. Geweke Diagnostic
Based on the Geweke Diagnostic method presented in the main text, the proportion of
trajectories that passed the convergence test is presented in Fig. S2. We can see that when the
length of tested chains 1 1
, 1{ : 1,..., }i i tX x t n varies from 20% to 50% of the length of the
trajectory, the percentage of trajectories that passed the convergence test decreases from 65% to
56%. By the end, the percentage of trajectories passed all the tests (i.e., for n1/n={0.2, 0.3, 0.4,
0.5}) is 49%.
Fig. S2. Proportion of individual trajectories that passed the Geweke test.
20% 30% 40% 50%0
10
20
30
40
50
60
70
n1/n
Pro
port
ion o
f tr
aje
cto
ries p
assed t
he G
ew
eke t
est
( =
0.0
5)