approaches to risk-based quality management quality · pdf fileapproaches to risk-based...
TRANSCRIPT

Clinical Trials Transformation Initiative-Sponsored Meeting
Bethesda Marriott Suites
Bethesda, MD
Beat Widler, F. Hoffmann-La RocheOctober 13, 2010
Approaches to Risk-Based Quality Management
Quality by design / Quality Systems

2
The objective of quality management is to
ensure safety of patients and integrity of data
Patient Safety, Rights and Integrityin all clinical trials and post-marketing activities
Data Integrityof data created in these clinical trials and post-marketing activities
Focus

3
Questionnaire
� Standardized form providing structured guidance throughout the definition process
� Mitigating actions to be defined in case of high risk scores
� Data from questionnaires transferred into the respective risk reports
� Allows standardized calculation of risk scores
� Provides signals which allow identification of further optimization potential, e.g. in operations, processes and systems
� Tailored by Risk Areas and study types
� Structured along different risk assessment categories
� Set-up to ensure quick & convenient report generationQuestionnaire
Risk Reports
Mitigating
Actions
Diagnostic tools comprise three components: questionnaires,
reporting and mitigating action templates
� Diagnostic tools are self surveys which are used for questionnaire-based risk evaluation of
structural elements, such as processes and organization
� They consist of three components: questionnaires, risk reports and mitigating action templates

4
SQA is intended to allow standardized risk assessments across
different study types and guides study teams during risk mitigation
Objectives
�Support Senior Management and study
teams with information on study set-up
based risk levels
– Prior to final protocol approval
– Before FPI and during study
conduct
�Provide standard approach to assess
study quality risk level – allowing
comparison across studies
�Offer guidance to study teams to
mitigate high and medium risk levels
Scope
� SQA conducts risk assessments in first
step of study value chain: ‘Study Set-
up’
� SQA encompasses all studies with
Roche involvement
– PD, GPS, PA, pRED and gRED
– Phase I-IV (global and local)
– Sponsored and supported
– Interventional and non-interventional

5
The SQA tool covers all key activities of the study design and study
conduct phase
Set-up of SQA Questionnaires
Study ConductStudy Design Study Close-out
Risk Assessment Categories1
Tailored Questionnaires for�Sponsored Interventional Studies�Sponsored Non-Interventional Studies �Supported Interventional Studies �Supported Non-Interventional Studies
1) Not all of the listed risk assessment categories apply to all different study types
Study Environment
Medication
Regulatory
Budget
Process & Documents
Feasibility/ Recruitment
Sampling
Randomization/Data
Outsourcing/ Contracts
Pharmacovigilance/ Safety
Registry
Relationship to External Sponsor
SQA applied
SQA not applied
6
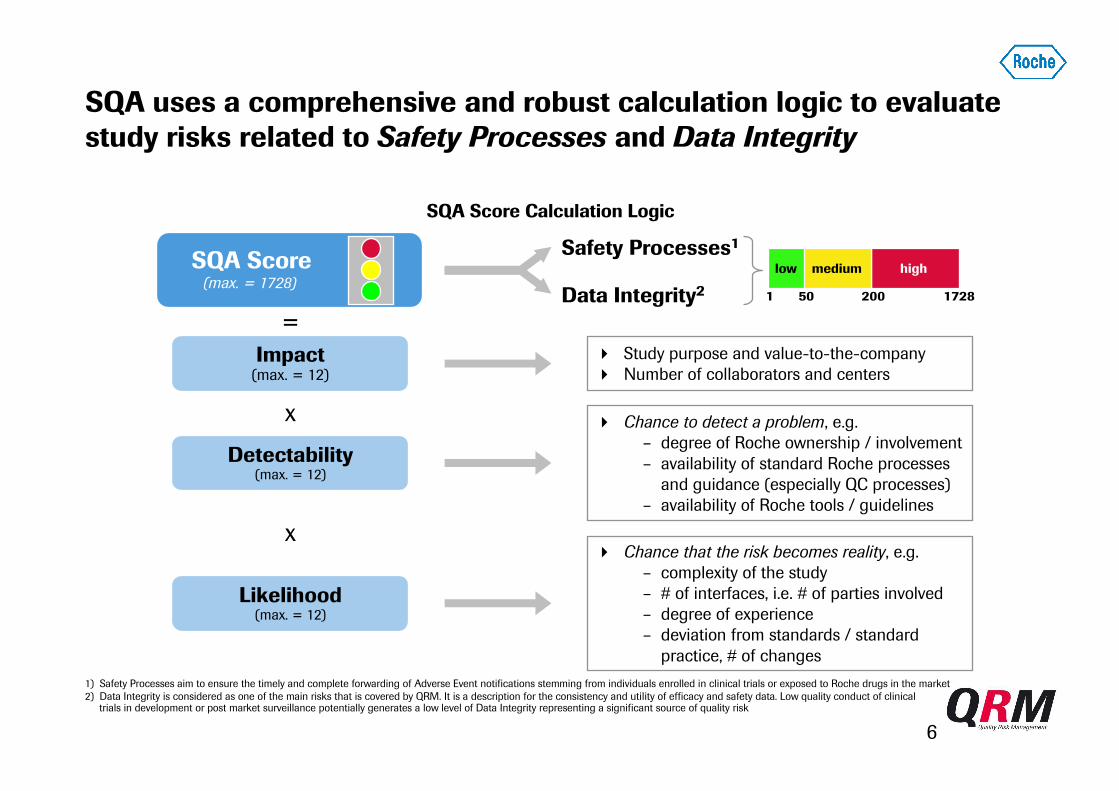
SQA uses a comprehensive and robust calculation logic to evaluate
study risks related to Safety Processes and Data Integrity
Likelihood(max. = 12)
� Chance that the risk becomes reality, e.g.
– complexity of the study
– # of interfaces, i.e. # of parties involved– degree of experience
– deviation from standards / standard
practice, # of changes
x
x
=
Impact(max. = 12)
� Study purpose and value-to-the-company
� Number of collaborators and centers
Safety Processes1
Data Integrity2
Detectability(max. = 12)
� Chance to detect a problem, e.g.
– degree of Roche ownership / involvement
– availability of standard Roche processes
and guidance (especially QC processes)
– availability of Roche tools / guidelines
SQA Score(max. = 1728)
1) Safety Processes aim to ensure the timely and complete forwarding of Adverse Event notifications stemming from individuals enrolled in clinical trials or exposed to Roche drugs in the market
2) Data Integrity is considered as one of the main risks that is covered by QRM. It is a description for the consistency and utility of efficacy and safety data. Low quality conduct of clinical trials in development or post market surveillance potentially generates a low level of Data Integrity representing a significant source of quality risk
1 50 200
highmediumlow
1728
SQA Score Calculation Logic
7
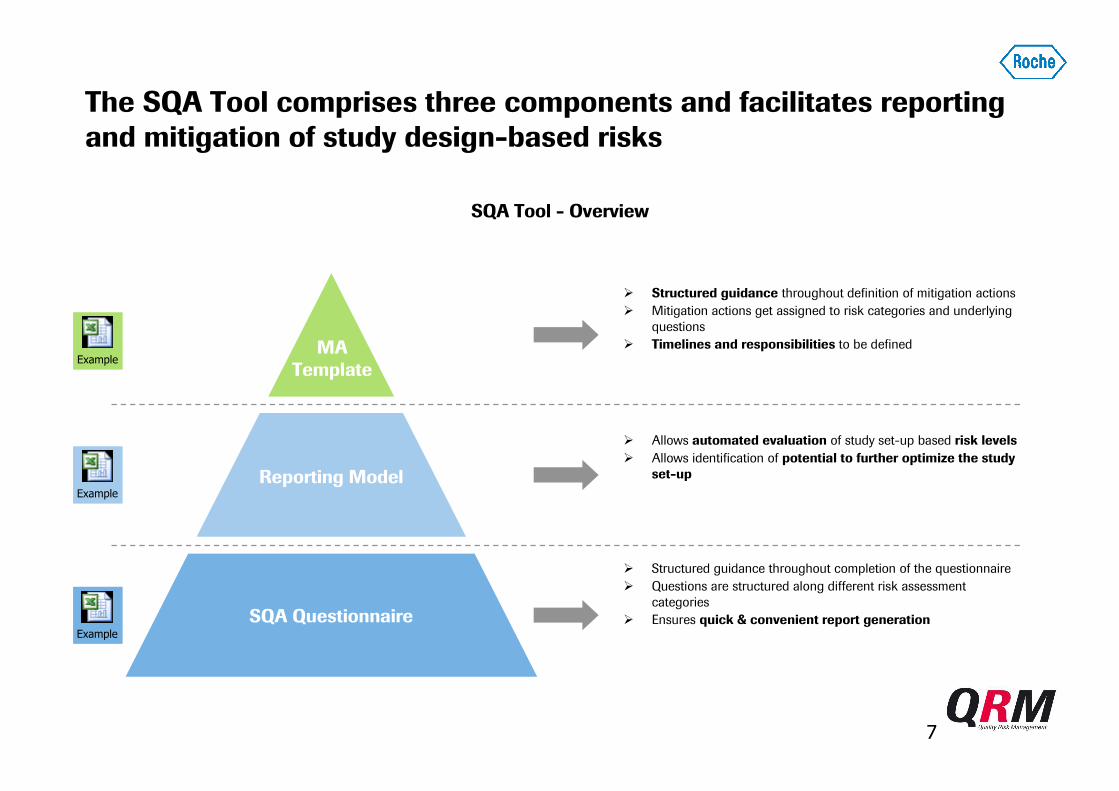
The SQA Tool comprises three components and facilitates reporting
and mitigation of study design-based risks
SQA Questionnaire
Reporting Model
MA
Template
� Structured guidance throughout definition of mitigation actions
� Mitigation actions get assigned to risk categories and underlying
questions
� Timelines and responsibilities to be defined
� Allows automated evaluation of study set-up based risk levels
� Allows identification of potential to further optimize the study
set-up
� Structured guidance throughout completion of the questionnaire
� Questions are structured along different risk assessment
categories
� Ensures quick & convenient report generation
SQA Tool - Overview
Example
Example
Example

8
SQA is now in global Phase IV mandatory for protocol approval -
ensuring improvement of quality prior to study start
Validate
Gap
Analysis
Create
Protocol
Synopsis
Produce
Protocol
Plan &
Select
Sites
Initiate
Sites
Recruit
Patients
Form Study
Management
Team
PAC2)
GK3)
Refine design
from outline in
Medical Plan
Define study
population &
methodology
Initiate study
planning
Draft protocol
synopsis
Determine key
elements of
feasibility
Agree coun-
tries/sites for
feasibility
Distribute
feasibility
questionnaire
On-site clinic.
records check
for validation
Incorporate
assessment
findings
Conduct team
review of pro-
tocol synopsis
PAC reviewApproval of
synopsis?
3 months 1 month 3 months
SMT1)
SQA questionnaire must be completed at this process step
SQA
CTR4
SQA Integration with Protocol Approval Process

9
Category breakdowns show similar risk distribution in both
Interventional and Non-Interventional, with exceptions
64%
92%
35%
28%
27%
63%
60%
27%
2%
2%
6%
5%
100%
Regulatory 100%
Medication
Study Environment 31%
14%
Outsourcing & Contracts 40%
Randomization & Data1) 35%
Sampling 71% 29%
Pharmacovigilance & Safety 71%
Feasibility & Recruitment 48% 24%
Processes & Documents 11% 54%
Budget
Registry 59%
SQA Category Risk Level Distribution for Locally Sponsored PA Studies
1) For Non-Interventional studies, this category does not include questions on “Randomization”
2) Not applicable for this study type
Source Initial SQA Roll-out, 2010; Booz & Company analysis
2%
56%
6%
13%
29%
14%
61%
37%
72%
5%
23%
55% 8%
39%
73% 13%
44% 26%
82%
100%
94%
44%
Non-Interventional Studies(n=131)
Interventional Studies(n=98)
Low RiskMedium RiskHigh Risk
N/A2)
N/A2)
Analysisas of 31st July 2010

10
GCP DT assesses infrastructure and clinical trial related
capabilities of affiliates across all regions
GCP DT Objectives & Scope
Objectives
�Support local and global Senior Mgmt. to
facilitate decisions (e.g. countries’
participation in clinical trials) triggered by
affiliate:
– Infrastructure set-up
– Clinical trial capabilities
�Provide standard approach to assess
affiliates’ GCP compliance level – allowing
comparison across affiliates and regions
�Offer guidance to local clinical
operations functions to mitigate high and
medium risk levels related to GCP
compliance
Scope
�GCP DT encompasses all affiliates across
all regions with clinical trial activities
conducted by Roche
– North America
– Latin America
– Western Europe
– CEMAI
– Asia Pacific
�GCP DT covers clinical trial activities
within an Affiliate
– Pharma Development (PD)
– Global Product Strategy (GPS)
– Pharma Affiliate (PA)

11
The GCP DT is set up as a self assessment questionnaire with
various risk assessment categories
Set-up of GCP DT Self Assessment Questionnaire
Affiliate Demographics(Questionnaire Section 1)
Information on number and type of:
Number of questions: 9
Affiliate Infrastructure(Questionnaire Section 2)
Information on:
Number of questions: 30
Study Management(Questionnaire Section 3)
Information on:
Number of questions: 22
Clinical Trials
Study Sites
Patients
Clinical Trial Staff
Vendors
Communication & Support
IT Systems
Archiving
Resource Management
Training
Issue Management
Medical & Safety
Study Planning & Conduct
Outsourcing
IMP Management
Monitoring
�The GCP DT Questionnaire needs to be completed on an annual basis by the local ‘GCP DT Coordinator’
�In case both local PD and GPS/PA activities are ongoing, the questionnaire needs to be completed individually
�After having completed the questionnaire, reports are generated by PDQ and discussed with the business partners

12
This data is used to calculate risk scores based on Impact,
Detectability and Likelihood; red scores require mitigation
1) Separate GCP DT scores are calculated for Safety Processes and Data Integrity
GCP DT Score1
1 50 200
highmediumlow
1728
High (12)
Medium (3)
Low (1)
Impact Magnitude of risk
High (12)
Medium (3)
Low (1)
DetectabilityChance to detect
a problem=
x
xHigh (12)
Medium (3)
Low (1)
LikelihoodChance that the risk
becomes reality
Definition and implementation of
Mitigating Actions mandatory
GCP DT Scoring and Mitigation Logic

13
As a result >70 affiliate-specific GCP DT reports can be generated,
which can then be aggregated to create regional and global reports
Overview of GCP DT Reports
Affiliate specific GCP DT reports
Key addressee: Local GCP DT Responsible
Regional GCP DT reports
Key addressee: Regional Business Heads
Global GCP DT report
Key addressee: P. Soriot
North
America
Latin
America
Western
Europe
CEMAIAsia
Pacific

14
Example: Selected results from regional GCP DT report
EXAMPLE FROMPREVIOUS VERSION
Affiliate E17
Affiliate E16
Affiliate E15
Affiliate E14
Affiliate E13
Affiliate E12
Affiliate E11
Affiliate E10
Affiliate E9
Affiliate E8
Affiliate E7
Affiliate E6
Affiliate E5
Affiliate E4
Affiliate E3
Affiliate E2
Affiliate E1
Low riskMedium riskHigh riskN/A
Strategic Clinical Trial
Mgmt
Issue Mgmt
Quality Mgmt
Project Planning
Results for GPS/PA Trials
HQ Comms
Infrastrct. & HQ
Support
AIMS/CTMS
Project Execution
Approval/ Adequacy of local
protocols
Out-sourcing
TrainingIMPElectronic
Data capture
Archiving SafetyMonito-ring
Regulatory
Local IT Systems
Affiliates/ risk areas highlighted in red to indicate highest risk
GCP DT Regional Report - Previous GCP DT Version

15
Continuous Risk Evaluation by Analyses of Existing Data
…
…
…Trial info
Clinical data
…
Safety data
…
…
…
QRM Report
Use the existing data… … to identify areas with increased quality risks
# AEs
Wealth of Existing Data at Roche Pharma
16
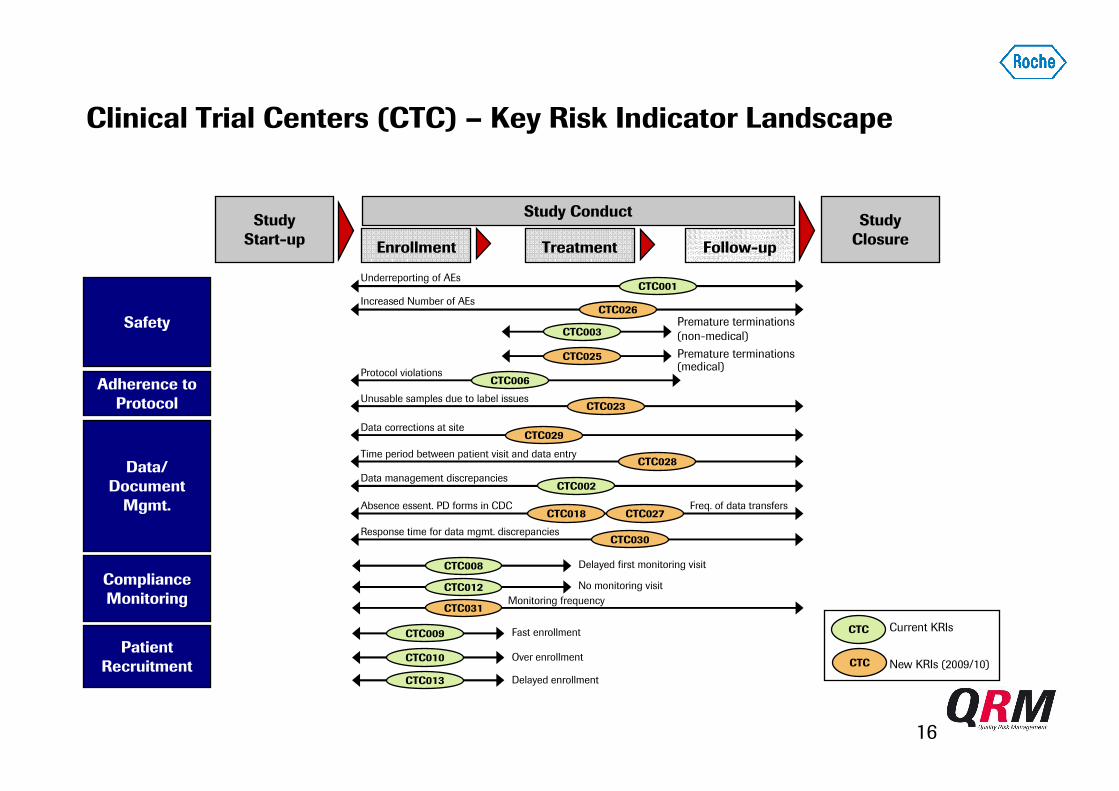
Clinical Trial Centers (CTC) – Key Risk Indicator Landscape
Safety
Study
Start-upEnrollment Treatment Follow-up
Study
Closure
Study Conduct
CTC001Underreporting of AEs
Data/
Document
Mgmt.
Compliance
Monitoring
CTC008 Delayed first monitoring visit
CTC012 No monitoring visit
Adherence to
Protocol
Patient
Recruitment
CTC009
CTC010
Fast enrollment
Over enrollment
CTC013 Delayed enrollment
CTC Current KRIs
New KRIs (2009/10)CTC
CTC029Data corrections at site
CTC002Data management discrepancies
CTC026Increased Number of AEs
CTC003Premature terminations
(non-medical)
Time period between patient visit and data entry
CTC006Protocol violations
CTC023Unusable samples due to label issues
Freq. of data transfersCTC018
Absence essent. PD forms in CDCCTC027
CTC028
CTC025 Premature terminations (medical)
CTC030Response time for data mgmt. discrepancies
CTC031Monitoring frequency

17
First set of CTC KRIs Different influence and predictive value
HHDNo monitoring visit12
LLLFast enrollment9
MMDDelayed first monitoring visit8
LLLOver enrollment10
LLPremature terminations (non-medical)3
MLData management discrepancies2
MMLUnderreporting of AEs1
HHLProtocol violations 6
Link to Risks and Predictive Value
(H=High, M=Medium, L=Low)
LLLDelayed enrollment13
Safety ProcessesData Integrity
Influence on
Detectability (D)
or Likelihood (L)
KRI NameKRI #
Predictive Value - Matrix

18
RationalePossible indicator for inadequate monitoring, lack of source data verification, site-staff training and/or insufficient
resources
Underreporting of AEs
Lower than average number of AEs reported per patient visit per site compared to the average number of AEs
reported per patient visit per countryDescription
Input Parameter Source
Allocation
Risks
SP, DI
D/L
Likelihood
Predictive Value
Medium
Formula: Signal is Red if
Number of patients per site, per countryOracle Clinical,
AIMS/CTMS
Number of patient visits per site, per country Oracle Clinical
Results
Number of AEs per site, per country Oracle Clinical
At least 3 patients enrolled at site (OC) and
At least 3 patients enrolled at site (AIMS/CTMS) and
A) KRI Value Above Threshold:
B) Significant Data Missing:
KRI Value =Acc. Σ of AEs per patient visit per site
Acc. Σ of AEs per patient visit per countrySelected Sites1.45
0.56 0.330.61
0.84
00.20.40.60.8
11.21.41.6
Site 1 Site 2 Site 3 Site 4 Site 5
KRI Value Threshold (0.5)
5 Sites in
Spain
< 0.5
KRI Value
significant data missing
(no AEs reported in entire country)
(1) If there are less than 4 sites in a country, the average number of AEs per
patient visit per site is divided by the average number of AEs per patient visit per
study

19
RationaleKRI serves as an indicator for potential issues with medical care and/or disease severity and/or patient selection
at site.
Increased average number of AEs per patient visit at site compared to the average number of AEs per patient visit
in country (or per study)Description
Allocation
Risks
SP
D/L
Likelihood
Predictive Value
Low
Formula: Signal is Red if
Results
A) KRI Value Above Threshold:
KRI Value = > 2
At least 3 patients enrolled at site (OC) and
Selected Sites
0.05
1.16 1.08 1.18
2.04
0
1.0
1.5
2.0
Site 1 Site 2 Site 3 Site 4 Site 5
KRI Value Threshold (2.0)
5 Sites in
France
KRI Value
0.5
Average number of AEs per
patient visit per site
Average number of AEs per
patient visit in country
(or per study)(1)
(1) If there are less than 4 sites in a country, the average number of AEs per
patient visit per site is divided by the average number of AEs per patient visit per
study
Increased number of AEs
At least 3 patients enrolled at site (AIMS/CTMS) and
B) Significant Data Missing:
significant data missing
(no AEs reported in entire country)
Input Parameter Source
Number of patients per site, per countryOracle Clinical,
AIMS/CTMS
Number of patient visits per site, per country Oracle Clinical
Number of AEs per site, per country Oracle Clinical

20
Rationale Possible indicator for inadequate site management, including lack of protocol adherence
Premature terminations (non-medical reasons)
Higher than average number of premature terminations (excluding termination due to death, AE/intercurr. illness
or insufficient therapeutic response) per patient enrolled per site compared to the average number of premature
terminations per patient enrolled in the protocol
Description
Input Parameter Source
Allocation
Risks
DI
D/L
Likelihood
Predictive Value
Low
Formula: Signal is Red if
Number of patients per site, per studyOracle Clinical,
AIMS/CTMS
Number of premature terminations per site, per
studyOracle Clinical
Results
At least 3 patients enrolled at site (AIMS/CTMS(1)) and
KRI Value =
Acc. Σ of premature terminations per patient enrolled per site
Acc. Σ of premature terminations per patient enrolled per study
(1) data source will be changed to OC in 2010
0
5.37
1.79
0 00
1
2
3
4
5
6> 2.0
A) KRI Value Above Threshold:
5 Sites in
USA KRI Value
Site 1 Site 2 Site 3 Site 4 Site 5
Selected Sites
KRI Value Threshold (2.0)
21
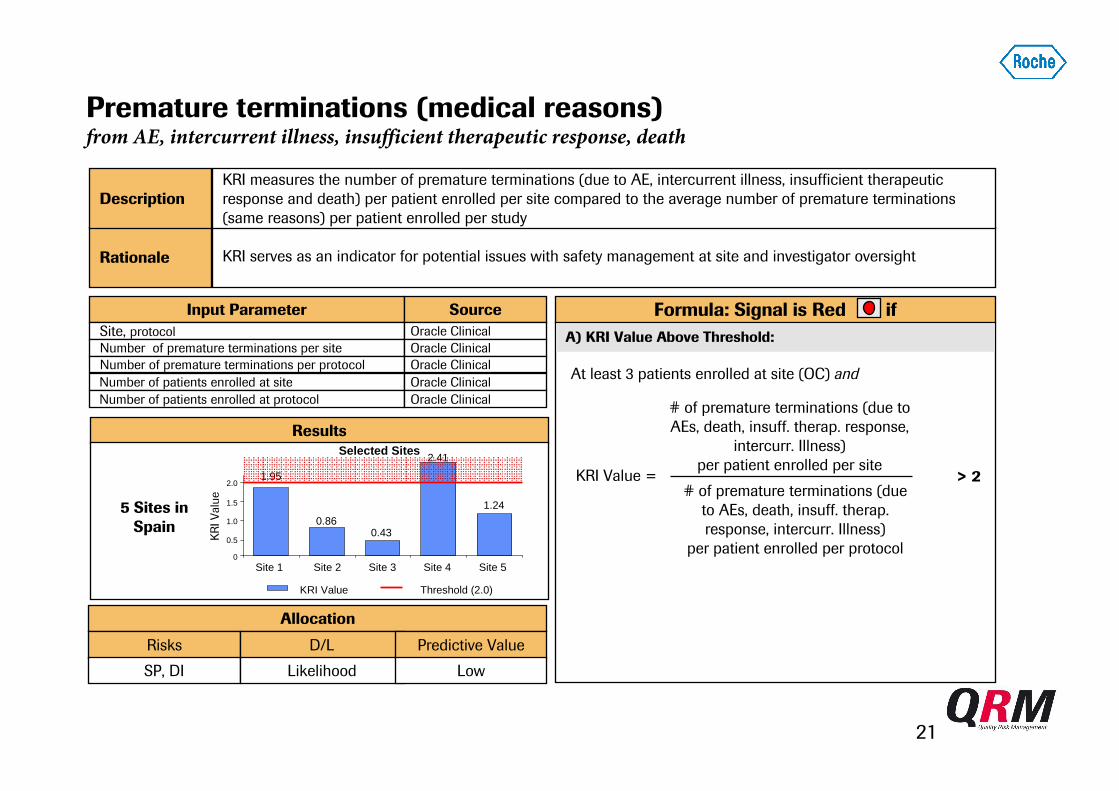
Rationale KRI serves as an indicator for potential issues with safety management at site and investigator oversight
KRI measures the number of premature terminations (due to AE, intercurrent illness, insufficient therapeutic
response and death) per patient enrolled per site compared to the average number of premature terminations
(same reasons) per patient enrolled per study
Description
Input Parameter Source
Allocation
Risks
SP, DI
D/L
Likelihood
Predictive Value
Low
Formula: Signal is Red if
Results
A) KRI Value Above Threshold:
KRI Value = > 2
Site, protocol Oracle Clinical
Number of premature terminations per site Oracle Clinical
Number of premature terminations per protocol Oracle Clinical
Number of patients enrolled at site Oracle Clinical
Number of patients enrolled at protocol Oracle Clinical# of premature terminations (due to
AEs, death, insuff. therap. response,
intercurr. Illness)
per patient enrolled per site
# of premature terminations (due
to AEs, death, insuff. therap.
response, intercurr. Illness)
per patient enrolled per protocol
At least 3 patients enrolled at site (OC) and
Selected Sites
1.95
0.860.43
2.41
1.24
0
1.0
1.5
2.0
Site 1 Site 2 Site 3 Site 4 Site 5
KRI Value Threshold (2.0)
5 Sites in
Spain
KRI Value
0.5
Premature terminations (medical reasons)from AE, intercurrent illness, insufficient therapeutic response, death

22
Managing Mega-Trials: a New Frontier
• Monitoring outcome data
• Auditing outcomes
• KRI data
• CAPA & mitigating action data
Further enhance compliance oversight “universe”
by a controlled sharing amongst sponsors of, e.g.
Enhances credibility of own QRM data and
leads to continuous benchmarking and
quality improvement

23
We Innovate Healthcare