approaches to learning in a classroom environment
TRANSCRIPT

Scholars' Mine Scholars' Mine
Masters Theses Student Theses and Dissertations
Fall 2008
Approaches to learning in a classroom environment: Approaches to learning in a classroom environment:
observational & experiential observational & experiential
Raj Kanwar Singh
Follow this and additional works at: https://scholarsmine.mst.edu/masters_theses
Part of the Operations Research, Systems Engineering and Industrial Engineering Commons
Department: Department:
Recommended Citation Recommended Citation Singh, Raj Kanwar, "Approaches to learning in a classroom environment: observational & experiential" (2008). Masters Theses. 4681. https://scholarsmine.mst.edu/masters_theses/4681
This thesis is brought to you by Scholars' Mine, a service of the Missouri S&T Library and Learning Resources. This work is protected by U. S. Copyright Law. Unauthorized use including reproduction for redistribution requires the permission of the copyright holder. For more information, please contact [email protected].

i

APPROACHES TO LEARNING IN A CLASSROOM ENVIRONMENT:
OBSERVATIONAL & EXPERIENTIAL
by
RAJ KANWAR SINGH
A THESIS
Presented to the Faculty of the Graduate School of the
MISSOURI UNIVERSITY OF SCIENCE AND TECHNOLOGY
In Partial Fulfillment of the Requirements for the Degree
MASTER OF SCIENCE IN ENGINEERING MANAGEMENT
2008
Approved by
Ray A. Luechtefeld, AdvisorSteve E. Watkins
Elizabeth A. Cudney
i

© 2008
RAJ KANWAR SINGH
All Rights Reserved
ii

PUBLICATION THESIS OPTION
This thesis consists of the following two articles that have been submitted or
intended to submit for publication as follows:
Pages 3-23 were submitted to the FRONTIERS IN EDUCATION
CONFERENCE 2007, Milwaukee, Wisconsin.
Pages 24-59 are intended for submission to JOURNAL OF ENGINEERING
EDUCATION.
iii

ABSTRACT
Accreditation Board for Engineering and Technology (ABET) has established a
set of criteria that requires engineering graduates to be able to effectively communicate,
work in teams with ethics and professionalism understanding the contemporary issues.
There are different approaches for teaching and learning these skills, two of which are
discussed in this thesis. The intention of this research is to understand the impact of
observational and experiential learning on team and individual performance.
The first paper assesses the team performance based on the type of facilitation
provided to different teams. The paper hypothesizes that the team exposed to facilitation
using the virtual facilitator would show better performance and decision-making skills
based on the theory of observational learning by Albert Bandura. Data collection
occurred at a University in the state of Missouri where both undergraduate and graduate
students participated in simulation games that were designed to assess the performance of
different teams.
The second paper deals with the concept of experiential learning in a classroom-
based environment. It assesses the performance of students based on their own
autonomous motivation and their instructor’s autonomy support to learn management
concepts using experiential learning. Data was collected using surveys in both
undergraduate and graduate level classes that were taught using the same approach of
learning.
iv

ACKNOWLEDGMENTS
With this thesis I am accomplishing another dream, another hope and another
epitome of self-evolution and thoughtfulness. Retrospection of the past makes me liable
to thank many people who have helped shape my life and dreams and supported me with
the best of their efforts. I take this moment to thank a few and acknowledge many others
in my thoughts who contributed significantly to this wonderful journey.
First and foremost, I would like to thank my grandparents Jaspal Singh and
Joginder Kaur, and my parents Kanwar Jit Singh and Davinder Kaur, who provided me
encouragement and support on the decisions I made and the career I chose. I would also
like to thank my younger brother Bir Kanwar Singh without whose sacrifice, patience,
and understanding my long night studies would not have been possible. The last two and
a half years in Rolla would not have been successful without the wonderful support of my
fiancée Amardeep Kaur, who helped me focus on my goals and priorities while walking
with me through the thick of things. I appreciate her efforts and am thankful to her.
In addition, I am really thankful to my advisor Dr. Ray A. Luechtefeld for his
immense support and the knowledge imparted by him, which not just helped in my thesis
but also in my evolution to a better thought process and an able perspective to see things
differently. I am also thankful to Dr. Steve E. Watkins for his guidance over the writing of
my first paper and Dr. Elizabeth A. Cudney for serving on my committee.
Finally, I would like to thank the Missouri University of Science & Technology
for supporting me as a research assistant and the president of the student government
body, both of which facets were important for my evolution.
v

TABLE OF CONTENTS
PAGE
PUBLICATION THESIS OPTION………………………………………………………iii
ABSTRACT……………………………………………………………………………...iv
ACKNOWLEDGEMENTS……………………………………………………………….v
LIST OF FIGURES………………………………………………………………………ix
LIST OF TABLES………………………………………………………………………..xi
...............................................................................................................INTRODUCTION 1
PAPER - 1
EXPERT SYSTEM FOR TEAM FACILITATION USING OBSERVATIONAL
.........................................................................................................................LEARNING 3
........................................................................................................................ABSTRACT 3
1. .........................................................................................................INTRODUCTION 4
1.1. ...........................ALBERT BANDURA’S THEORY OF SOCIAL LEARNING 6
2. .................................................................................................PROJECT OVERVIEW 7
2.1. ...........THE VIRTUAL FACILITATOR – AN EXPERT DIALOGIC SYSTEM 7
2.1.1. ...........FACILITATION FOR EFFECTIVE TEAM COMMUNICATION 8
2.1.2. ..................................VIRTUAL FACILITATOR AS EXPERT SYSTEM 9
3. .......................................................................................EXERCISE DESCRIPTION 13
3.1. ....................................................DESCRIPTION OF SIMULATION GAMES 13
3.2. .....................................................................SETTINGS AND TREATMENTS 15
4. .....................................................................................................................RESULTS 16
5. ..............................................................................................................DISCUSSION 19
6. ..........................................................................................................CONCLUSIONS 20
7. .............................................................................................ACKNOWLEDGMENT 21
8. ............................................................................................................REFERENCES 21
vi

PAPER - 2
EXPERIENTIAL LEARNING: THE EFFECTS OF INSTRUCTOR’S AUTONOMY
................................SUPPORT ON STUDENTS’ PERFORMANCE & MOTIVATION 24
......................................................................................................................ABSTRACT 24
1. .................................................................................................INTRODUCTION 25
1.1. .........................................................CLASSROOM AS ORGANIZATION 25
1.2. ..........................................................SELF-DETERMINATION THEORY 26
1.3. ......................BEHAVIORAL ORIENTATION AND SOCIAL SUPPORT 28
1.3.1. ..........................................................CAUSALITY ORIENTATION 28
1.3.2. ..................................................................AUTONOMY SUPPORT 29
1.3.3. ..................................................LEARNING SELF-REGULATION 31
1.3.4. ..........................................................PERCEIVED COMPETENCE 31
1.3.5. .......................................................INTEREST AND ENJOYMENT 32
1.3.6. ....................................GRADE AND LEARNING ORIENTATION 32
2. .......................................................................................THE PRESENT STUDY 33
3. ..............................................................................................................METHOD 35
4. ..........................................................................................................MEASURES 37
4.1. ............THE GENERAL CAUSALITY ORIENTATION SCALE (GCOS) 37
4.2.PERCEIVED AUTONOMY SUPPORT: THE LEARNING CLIMATE
...................................................................QUESTIONNAIRE (LCQ) 38
4.3. .....THE LEARNING SELF-REGULATION QUESTIONNAIRE (LSRQ) 38
4.4. ...................................THE PERCEIVED COMPETENCE SCALE (PCS) 39
4.5. .....................................THE INTEREST/ENJOYMENT (I/E) MEASURE 39
4.6. ...........................................THE GRADE ORIENTATION SCALE (GOS) 40
4.7. ..........................................................PERFORMANCE IN THE COURSE 40
5. ...............................................................................................................RESULTS 41
6. ........................................................................................................DISCUSSION 50
7. .....................................................................................................CONCLUSION 54
8. ......................................................................................................REFERENCES 56
vii

...............................................................................................................FUTURE WORK 60
APPENDIX A.
..........................................................................PAPER-2 SURVEY QUESTIONNAIRE 63
1. .......................................................PRE-COURSE (TYPICAL COURSE) SURVEY 64
2. .................................................................................POST-COURSE (XB) SURVEY 70
APPENDIX B.
...............................................................PAPER-2 REFERENCE TABLES & FIGURES 76
................................................................................................................................VITA 101
viii

LIST OF FIGURES
PAGE
PAPER-1
FIGURE 1: Student Team Interaction Using The Expert Dialogic System………..……...11
PAPER-2
FIGURE 1: Instructor’s Autonomy Support As Moderating Variable…………………….34
FIGURE 2: Perceived Autonomy Support As Mediating Variable………………………..35
FIGURE 3: Relation with Perceived Competence & Interest/Enjoyment for Graduate
Students………………………………………………………………………42
FIGURE 4: Relation with Interest/Enjoyment & Grade Orientation for Graduate
Students………………………………………………………………………43
FIGURE 5: Relation with Perceived Competence & Interest/Enjoyment for Undergraduate
Students………………………………………………………………………45
FIGURE 6: Relation with Interest/Enjoyment & Grade Orientation for Undergraduate
Students………………………………………………………………………46
FIGURE 7: Relation Significance Using Regression Analysis……..……………………. 49
FIGURE 8: Relation Significance with Autonomous Behavior…………………………..52
FIGURE 9: Relation Significance with Perceived Autonomy Support…………………...53
APPENDIX B
FIGURE 1: Relation with Perceived Competence for Graduate Students………………...78
FIGURE 2: Relation with Autonomous Self-Regulation for Graduate Students………….79
FIGURE 3: Relation with Interest/Enjoyment for Graduate Students…………………….80
FIGURE 4: Relation with Grade Orientation for Graduate Students……………………...81
FIGURE 5: Relation with Perceived Competence for Undergraduate Students…………..82
FIGURE 6: Relation with Autonomous Self-Regulation for Undergraduate Students……83
FIGURE 7: Relation with Interest/Enjoyment for Undergraduate Students……………....84
FIGURE 8: Relation with Grade Orientation for Undergraduate Students………………..85
FIGURE 9: Pre-Course Mean Comparison of Autonomous Behavior……………………86
FIGURE 10: Post-Course Mean Comparison of Autonomous Behavior………………….86
ix

FIGURE 11: Post-Course Mean Comparison of Perceived Autonomy Support…………..87
FIGURE 12: Post-Course Mean Comparison……………..………………………………88
FIGURE 13: Relation Between Students’ Autonomous Behavior and Students’ Perceived
Autonomy Support…………………………………………………………...89
FIGURE 14: Relation Between Students’ Perceived Autonomy Support and Students’
Performance in the Course…………………………………………………...90
FIGURE 15: Relation Between Students’ Autonomous Behavior and Students’
Performance in the Course………...…………………………………………91
FIGURE 16: Relation Between Students’ Autonomous Behavior & Perceived
Competence…………………………………………………………………..92
FIGURE 17: Relation Between Students’ Autonomous Behavior & Autonomous Self-
Regulation……………………………………………………………………93
FIGURE 18: Relation Between Students’ Autonomous Behavior & Interest/
Enjoyment……………………………………………………………………94
FIGURE 19: Relation Between Students’ Autonomous Behavior & Grade
Orientation…………………………………………………………………...95
FIGURE 20: Relation Between Perceived Autonomy Support & Perceived
Competence…………………………………………………………………..96
FIGURE 21: Relation Between Perceived Autonomy Support & Autonomous Self-
Regulation……………………………………………………………………97
FIGURE 22: Relation Between Perceived Autonomy Support & Interest/
Enjoyment……………………………………………………………………98
FIGURE 23: Relation Between Perceived Autonomy Support & Grade
Orientation…………………………………………………………………...99
x

LIST OF TABLES
PAGE
PAPER-1
TABLE 1: Examples of IF-THEN Rules………………………………………………….12
TABLE 2: Courses Involved In The Research……………………………………………14
TABLE 3: Results - Number Of Questions Asked………………………………………..17
TABLE 4: Results – Quantitative Performance………………………………………….. 17
TABLE 5: Types of Behaviors…………………………………………………………… 18
TABLE 6: Results – Constructive Controversy Level…………………………………… 19
PAPER-2
TABLE 1: Number of Males & Females………………………………………………….36
TABLE 2: Mean Comparisons Using t-Test….…………………………………………...47
TABLE 3: Responses to Trust and Ability to Share Feelings…………………………….54
APPENDIX B
TABLE 1: Number of Males & Females in the course…………………………………...77
TABLE 2: Responses to Learning Climate Questionnaire………………………………100
xi

INTRODUCTION
The 2007-2008 Accreditation Board for Engineering and Technology (ABET)
criteria emphasizes the importance of learning “soft skills” by engineering students along
with the ability to apply scientific and mathematical skills to solve engineering problems
which is the part of a traditional classroom. Moreover, global competition, customer
focus, knowledge explosion, and the development of third world countries has driven
corporate organizations to seek students with not just the technical ability but with critical
thinking ability and creative skills. Companies require employees to drive issues
autonomously and make informed decisions while understanding the perspectives of
others.
With the building revolution to the approaches to learning in higher education,
there are a number of key ideas that emerge which challenge the nature of the traditional
class based coursework. The purpose of this thesis is to study two such learning
techniques called Observational and Experiential Learning.
The first part of this thesis considers a study of students’ learning behavior when
exposed to the computationally intelligent “virtual facilitator” which is based on Albert
Bandura’s theory of Observational Learning. This theory states that skills can be
developed through observation of expert “others” engaged in practice. This paper aims at
showing that beneficial team behaviors such as constructive controversy can be triggered
by observing a model or an expert (virtual facilitator) thus increasing the performance of
the team. The result of the analysis supports the theory that the students who are exposed
11

to the questions (interventions) posed by the virtual facilitator asked more questions thus
indicating the possibility of observational learning.
The second part of this thesis studies the effects of an instructor’s autonomy
support on the motivation and performance of the students using the concepts of
experiential based learning and self-determination theory. This paper investigates the
quality of students to autonomously behave in an organization based class environment
with the instructor acting as the “senior manager” of the organization and the students
playing different roles to keep the organizational work flowing. Experiential based
learning of this type (the "classroom as organization") began more than 20 years ago
when it was first used to teach students the concepts of organizational behavior. In the
second paper we study the behavior of students in a class which uses similar idea to teach
management concepts at both graduate and undergraduate level. The paper hypothesizes
that the students who are more autonomously oriented towards taking this course would
have a better performance in the course.
2

PAPER - 1
EXPERT SYSTEM FOR TEAM FACILITATION USING OBSERVATIONAL
LEARNING
Raj Kanwar SinghResearch Assistant
Missouri University of Science & Technology, U.S.A
Dr. Ray A. LuechtefeldAssistant Professor
Missouri University of Science & Technology, U.S.A
Dr. Steve E. WatkinsProfessor
Missouri University of Science & Technology, U.S.A
ABSTRACT
While ABET criteria require that engineering graduates be able to “function on
multidisciplinary teams” and “communicate effectively”, the need for effective team
skills goes far deeper. One solution is the use of a computationally intelligent “virtual
facilitator” that contains a subset of the expert knowledge of a skilled facilitator. The
“virtual facilitator” models behaviors of an expert facilitator to engineering student teams
as they are working together. Albert Bandura’s theory of observational learning suggests
that skills can be developed through observation of expert “others” engaged in practice.
Preliminary research indicates that students can increase beneficial team behaviors (such
as inquiry) through observation and imitation of an expert system.
This paper is an extension of a 2005 Frontiers In Education (FIE) Work-In-
Progress presentation that documented an expert facilitator system. In this study the
3

system is used as part of an hour-long team exercise for engineering students. This study
looks at student interactions during the exercise. Measures include analysis of team
conversations for instances of imitation of the expert system, as well as a comparison of
differences in team performance. The potential for an easily disseminated method to help
engineering students learn effective team skills is discussed.
1. INTRODUCTION
The development of communication skills is necessary preparation for effective
engineering team work. Teams with a high degree of openness and interdependence
exhibit enhanced quality of decision making [1]. ABET requirements for accrediting
Engineering Programs 2007 – 2008 state, “Engineering programs must demonstrate that
their students attain: an ability to function on multi-disciplinary teams…...and....an ability
to communicate effectively…..” [2]. While many faculty and institutions work to make
team skills a part of the technical repertoire of the students, the portability of this
knowledge is limited as it is difficult to share between institutions.
History attests to the catastrophic consequences of team dysfunctions and neglect
of group dynamics. For example the space shuttle Challenger and Columbia tragedies can
be attributed to failures in team skills [3]-[5]. The Columbia Accident Investigation
Board found that “the hole in the wing of the shuttle was produced not simply by debris,
but by holes in organizational decision-making. Furthermore, the factors that produce the
holes in organizational decision-making are not unique to today’s NASA or limited to the
4

shuttle program, but are generic vulnerabilities that have contributed to other failures and
tragedies across other complex industrial settings” [6].
Such conflicts and team dysfunctions are related to difficulties of team members
sharing their perspectives and making tradeoffs [7], [8]. Since engineering teams are
often multi-disciplinary, the complex set of problems that engineers face need to combine
the expertise of different disciplines. Also, to make the project successful they need to
collaborate with others in a team who may have different perspectives and technical
objectives. The quality of decision-making in these contexts is enhanced by increasing
openness and interdependence, and diminished when team members regulate or ignore
certain information [1], [9].
While engineering institutions regularly give students projects involving technical
knowledge, all too often students are put in project teams where they are expected to
work together successfully without sufficient support in interpersonal and team skills.
Mere placement in teams does not guarantee the learning of these skills [8]. This can be
improved in engineering education through activities specifically designed to nurture
team skills [8], [10].
One solution is the use of a computationally intelligent “virtual facilitator” that
contains a subset of the expert knowledge of a skilled facilitator. The “virtual facilitator”
models the behaviors of an expert facilitator to engineering student teams as they are
working together.
Automated facilitation tools may provide a simplified model for conversational
interventions, which students can imitate [8]. Albert Bandura’s theory of social (or
5

observational) learning suggests that skills can be developed through observation of
expert “others” engaged in practice. Bandura’s theory has received a strong support in
research on this area. This paper describes the virtual facilitator tool and presents findings
from its use by several student groups [8].
1.1. ALBERT BANDURA’S THEORY OF SOCIAL LEARNING
Given that team skills produce highly beneficial results, the question arises ‘How
does someone learn to improve communication skills?’ One possibility is that team skills
could be learned in a fashion similar to other skills. The theoretical basis for this study is
provided by Bandura’s theory of social learning.
Albert Bandura suggested that individuals learn many skills through a process of
modeling, in which behaviors are observed and imitated within a social context [11]-[14].
There are four steps involved in this process:
1. Attention – The first step is paying attention to the actions of another person
modeling a behavior [11]-[14].
2. Retention – The second step involves retaining or remembering what one paid
attention to. Imagery and language have a significant part to play in this because an
individual stores what he has seen the model doing in the form of mental images or
verbal descriptions. When stored in this form, he can later recall the image or
description, so that he can reproduce it in his own behavior [11]-[14].
3. Reproduction – The ability to reproduce what has been observed and retained results
in a more effective learning process. Reproduction is significant because the ability to
6

imitate a behavior improves with practice. People’s abilities improve even by just
imagining themselves performing a behavior [11]-[14]. For example, Many athletes
rehearse their performance in their own minds prior to the actual event.
4. Motivation – The final step for learning comes from seeing the model as useful based
on its outcomes [3]. If outcomes are perceived as valuable a person will be more
likely to pay attention to that behavior because it has personal relevance [6], [15].
Bandura’s theory thus predicts that “individuals in contact with models that
produce useful outcomes will pay attention to their behaviors and are more likely to
produce similar behavior” [11]-[14].
2. PROJECT OVERVIEW
2.1. THE VIRTUAL FACILITATOR – AN EXPERT DIALOGIC SYSTEM
Much learning occurs through the presence of real-life models but with the
advancing technology as well as written and audiovisual means of communication, there
can be increasing use of audiovisual and computational models that create imitable
behavior [11]. Verbal instructions that describe the correct responses and their sequencing
comprise one of the widely prevalent means of providing symbolic models [11].
Abstract theoretical concepts of leadership, management, teamwork, facilitation
and communication can be connected to real experience through these ‘symbolic
models’ [16]. Model-based activities that enhance such experiences offer valuable
opportunities for learning concepts such as group facilitation.
7

2.1.1. FACILITATION FOR EFFECTIVE TEAM COMMUNICATION
Group facilitation is a process “in which a person who is acceptable to all
members of the group, substantively neutral, and has no decision – making authority,
intervenes to help a group improve the way it identifies and solves problems and makes
decisions, in order to increase the group’s effectiveness” [16].
Researchers in team learning and group development have described “recipes for
action” in interventions used for group facilitation [8], [17]. Recipes in this context refer
to “relatively simple statements or questions that are triggered by particular words or
phrases” [8].
While the literature on team learning and group development acknowledges the
existence of “recipes for action” as a platform for mastering intervention skills, previous
research on approaches to individual therapy have accounted for a “far richer set of these
recipes” [8], [18]. For example, interventions used by experts in organizational
facilitation can also be found in the behaviors used in therapy to help individuals surface
information [8]. Research conducted with more than 100 virtual teams working in chat
space found that teams exposed to these types of interventions performed significantly
better than teams that were not exposed [8], [19].
An increase in team performance has been associated with facilitation [20].
Facilitation encompasses several goals, for example, helping team members to manage
conflict effectively and share knowledge and expertise. These goals are achieved by
facilitators through an observable process of intervening with questions and comments
8

into group dialogue [11]. Outcomes such as conflict resolution and increased efficacy are
expected to be some outcomes of observational/social learning.
Expert facilitation promotes greater shared understanding by:
1. Assisting team members unearth and test negative evaluations of others in the team.
2. Helping team members to reach conclusions and make their emotional reactions
explicit, on the basis of their reasoning and data they have.
3. Encouraging everyone in the team to collaborate on team decisions.
Analysis of previous work in this area indicated that teams exposed to
interventions exhibited significantly (p<0.05) higher levels of “constructive
controversy” , a set of behaviors associated with the ability to manage conflict effectively,
which is widely associated with improved team performance [22], [23]. Constructive
controversy within a team involves the open-minded sharing of alternative perspectives
in order to achieve a cooperative (win-win) solution that accrues benefit to the entire
team.
2.1.2. VIRTUAL FACILITATOR AS EXPERT SYSTEM
The virtual facilitator is a responsive software system that functions similar to a
chat space over the internet. It has a dialogue box that lists the names of the team
members participating. As with a typical chat tool, conversations appear in the dialogue
box. However, it also has a space where system-generated interventions into the team’s
conversation appear. The software includes the option of turning these interventions on
or off as desired.
9

The software also has the ability to save the conversations between the team
members and generate a transcript listing the detailed timings of the conversations and
showing the interventions in a different font and color.
The virtual facilitator automatically “listens” to a team conversation (with the use
of notebook computers equipped with microphones and wirelessly interconnected) and
then generates a transcription of the conversation (using commercially available speech-
recognition systems). Figure 1 illustrates the system [8].
When using the system, students participating in a team discussion wear a headset
fitted with a microphone that is plugged into a notebook computer [8]. Commercially
available speech recognition software converts each individual’s spoken words into text
[8]. The Expert Dialogic System connects each individual notebook computer with the
others wirelessly and knits together each individual’s text into a transcription of the group
conversation [8].
The virtual facilitator’s main function is to help the group increase its
effectiveness by improving its communication skills [17]. It achieves this by intervening
in the conversations that occur between team members.
Interventions are triggered by particular words or phrases in the team
conversation. These responses (interventions) are based on rules built into the software.
10
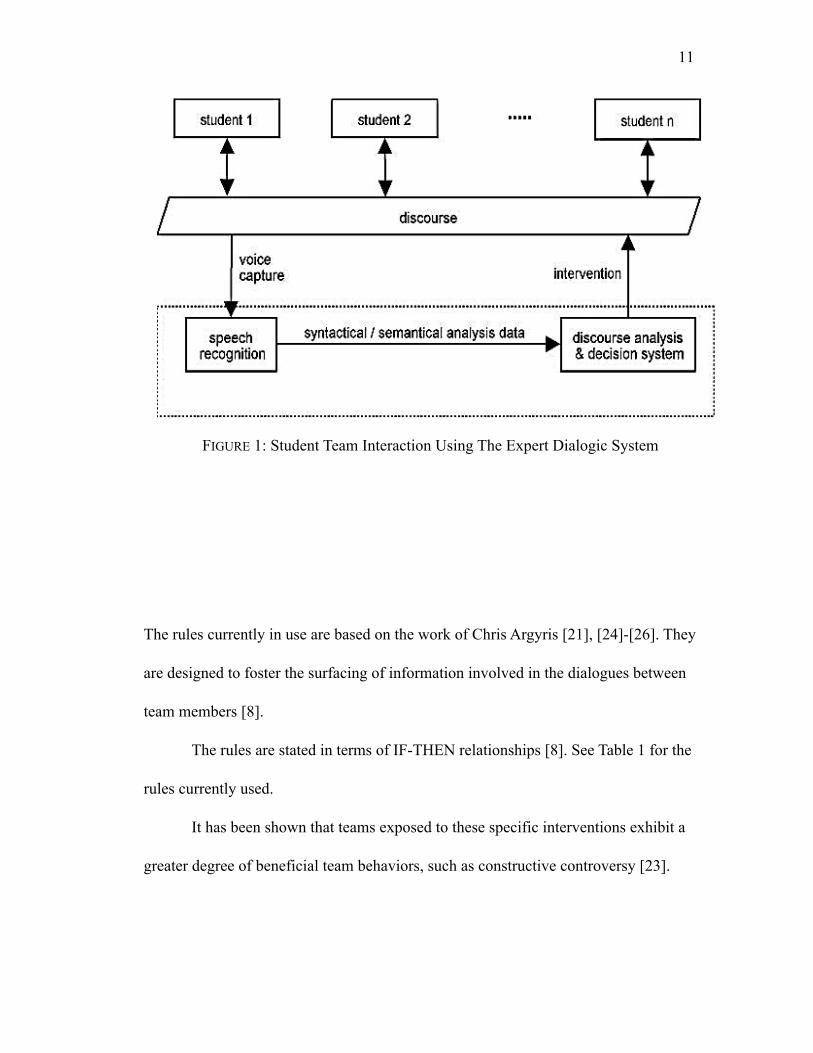
The rules currently in use are based on the work of Chris Argyris [21], [24]-[26]. They
are designed to foster the surfacing of information involved in the dialogues between
team members [8].
The rules are stated in terms of IF-THEN relationships [8]. See Table 1 for the
rules currently used.
It has been shown that teams exposed to these specific interventions exhibit a
greater degree of beneficial team behaviors, such as constructive controversy [23].
11
FIGURE 1: Student Team Interaction Using The Expert Dialogic System

Situation Indicators (IF) Questions (THEN ASK)
Deletion - Clearly and Obviously
-ly ending or "it was clear to me"
What leads you to see it that way?
Can you give specific examples?
Deletion - Comparisons-er, -est, more/less, most/
least, etc.
Better (faster, etc.) than what?
How, specifically, do you see it this way?
Deletion - Can't, Impossible, and Unable
can't, impossible, unable, no one can
What prevents you from doing so?
(Does anyone see things differently?)
Deletion - Advocacy without illustration
"should, must, expect, encourage"
What leads you to see it that way?
Distortion - Forcing or Making
"I had to, you made me, you bore me”
What experience had you had that leads you to
believe X?What was done that makes
you Y?
Through the process of observing, the virtual facilitator generates inquiries into
the team’s conversation. It is hypothesized that students can increase level of beneficial
team behaviors, such as inquiry. Two specific hypotheses are tested in this research.
1. Students exposed to questions posed by the virtual facilitator (the treatment group)
will ask more questions than those not exposed to it (the control group).
12
TABLE 1: Examples of IF-THEN Rules

2. Students exposed to questions posed by the virtual facilitator (treatment group) will
exhibit higher performance on a team decision-making exercise than those not
exposed to it (control group).
3. EXERCISE DESCRIPTION
Teams in this research worked through one of two decision making exercises. The
exercises involve team decision-making and information sharing as part of mock
engineering and managerial design scenarios.
3.1. DESCRIPTION OF SIMULATION GAMES
Brief descriptions of the simulation games are given below.
Solar Car Team – The goal of this game was to make choices of solar car
components that would maximize the number of miles the car would be able to travel.
Each team consisted of four members representing one department each. The Mechanical
Engineering Department had to suggest the type of motor to be used from the list of
choices, the Electrical Engineering Department suggested types of batteries, and the
Frame Design Department suggested the type of frame and solar cell. Finally, the Cost
Management Department was charged with ensuring that the car did not exceed the
budget.
Budget Balancing Team – Students participating in this game were given the task
of balancing the budget of a fictional company to maximize profit. Each team had four
roles, with one member playing each role. The team consisted of the Union
Representative whose goal was to protect regular employee interests by limiting layoffs.
13

The Director of Personnel on the other hand had to retain not only employees but also
managers from different departments. The Director of Development and the Director of
Finance had to retain employees, their own department’s managers and also had to make
sure that they had funds for projects.
These two simulation games were conducted with students from four senior/
graduate level courses at the Missouri University of Science & Technology. These
courses were chosen because the advisors of these courses agreed to allow access for one
hour to conduct the simulation games. Table 2 below shows the list of courses and other
details.
Course Name Number of Students Type of Simulation Game
Project Management 8 Solar Car
Business Logistics & Systems Analysis 16 Budget Balancing
Organizational Psychology 4 Budget Balancing
Psychology of Leadership 4 Budget Balancing
14
TABLE 2: Courses Involved In The Research

The games were conducted as a virtual team, which meant that members
communicated over the internet in a chat-space using the virtual facilitator.
Each team member was asked to balance personal goals (e.g., retaining as many
employees as possible) with group goals (e.g., maximizing profitability). The exercises
simulate real-life scenarios in which personal goals must be weighed against group needs.
Team members were asked to use mathematical, communication, and critical
thinking skills to solve problems in such a way that each member could meet a basic level
of individual role interests while maximizing team performance. Different team members
achieved higher or lower individual goals depending on their ability to communicate and
influence others in the team. Teams were required to reach a consensus agreement.
3.2. SETTINGS AND TREATMENTS
Immediately after entering the laboratory the students were assigned randomly to
computer systems. These systems were arranged to have similar kinds of departmental
representatives sitting together (e.g., for the solar car team simulation game the
Mechanical Engineering Department members from each team were juxtaposed). Each
team member was given a profile sheet which illustrated his or her own specific roles in
the team. Also, a common sheet which described the team’s goals and the other
departments on the team was given to each student.
The participants of the Solar Car and the Budget Balancing games were given
forty and thirty minutes respectively to make the first decision. Later an additional ten
minutes were given for improving and making the second decision. At the end of each
15

decision a particular team member was asked to bring the team’s decision sheet and their
results were calculated on the spreadsheets that were prepared for each game. After the
game the conversations were saved and compared.
Students were divided into two groups:
1. The first group (the “treatment group”) received facilitation by the virtual facilitator
(expert system) throughout the exercise.
2. The second group (the “control group”) was not exposed to facilitation by the expert
system.
4. RESULTS
The conversations between the team members were saved and were later
evaluated for results of the three hypotheses.
1. Number of inquiries during the conversation of each team (see Table 3) - A paired
comparison T-Test was performed to evaluate whether there was a significant
difference in the means of the average number of questions asked by the treatment
and the control groups. The test was based on the assumption that the two groups
have a normally distributed population.
2. Quantitative performance of the teams based on the decisions made by each (see
Table 4) – A comparison on the basis of the team performance was made. Team
performance was measured by evaluating which team reached a greater number of
miles/day (Solar Car simulation game) and which team made more profit (Budget
Balancing simulation game), without violating the rules and by reaching a consensus.
16

Type of Simulation Game
Type of Group - Team #
Number of questions
asked
Difference (treatment - control)
Solar Car (Project Management)
Treatment - Team 1 8310
Control - Team 2 73
Business Budgeting ( Business Logistics &
System Analysis)
Treatment - Team 1 3711
Control - Team 2 26
Business Budgeting (Psychology)
Treatment - Team 1 265
Control - Team 2 21
Type of Simulation Game Type of Group - Team # Decision Reached
Solar Car (Project Management)
Treatment - Team 1 346.9 miles/day
Control - Team 2 352.4 miles/day
Business Budgeting (Business Logistics &
System Analysis)
Treatment - Team 1 Loss - $11,950
Control - Team 2 Loss - $17,000
Treatment - Team 1 Loss - $11,200
Control - Team 2 Profit - $5000
Business Budgeting (Psychology)
Treatment - Team 1 Loss - $10,000
Control - Team 2 No Consensus Reached
17
TABLE 3: Results - Number Of Questions Asked
TABLE 4: Results – Quantitative Performance

3. Conversations were coded based on the degree of constructive controversy behaviors
[23]. If a positive connotation behavior was reflected it was coded “+1” and a
negative connotation behavior received a “-1”. Table 5 shows a brief description of
the behavior. Table 6 shows the level of constructive controversy for each team.
The results of the hypotheses are:
1. Hypothesis 1 is supported, with p = 0.02286 (≤ 0.05). There is strong evidence
that students exposed to questions posed by the virtual facilitator asked more
questions than those not exposed to it.
2. Hypothesis 2 was not supported. There was no significant result on whether
students exposed to questions posed by the virtual facilitator exhibited higher
performance on a team decision-making exercise than those not exposed to it.
3. Hypothesis 3 is not supported, with p = 0.19971 (≥0.05). There is not strong
evidence to indicate that students exposed to questions posed by the virtual
facilitator showed a higher level of constructive controversy.
Positive Connotation Negative Connotation
Contributes Ideas & Opinions Emphasizes win-lose competition
Emphasizes mutual goals Criticizes and disagrees with others
Asks others for proof, facts, and rationale Criticizes others as persons
18
TABLE- 5: Types of Behaviors

Type of Simulation Game
Type of Group - Team #
Constructive Controversy Level
Difference (treatment-control)
Solar Car (Project Management)
Treatment - Team 1 6960
Control - Team 2 9
Business Budgeting
(Business Logistics & System Analysis)
Treatment - Team 1 6425
Control - Team 2 39
Treatment - Team 1 42-20
Control - Team 2 62
Business Budgeting
(Psychology)
Treatment - Team 1 342
Control - Team 2 32
5. DISCUSSION
Earlier work showed that student team performance could be significantly
improved (p < 0.05) by applying a set of basic interventions, which have now been
embedded in the proof-of-concept virtual facilitator [19]. This work investigated the
effect of manually typing the interventions triggered by these rules into a chat room used
by student teams as they worked on a team problem-solving exercise in cyberspace. The
results indicated that interjecting these interventions into team conversations significantly
improved team performance by around a half-sigma [19].
The previous results were obtained with a much larger sample size. Because the
deviation of performance and constructive controversy results was quite large, it is
19
TABLE 6: Results – Constructive Controversy Level

understandable that the results of this research would not show statistically significant
effects.
6. CONCLUSIONS
As an investigation of Bandura’s Observational Learning theory, this study tested
the effect of inquiry on the team members. Results supported one of our hypotheses.
These results have two implications.
The expert dialogic system increased beneficial team behaviors. The virtual
facilitator does appear to modify behavior by increasing the frequency of inquiry. While
not conclusive, this indicates the possibility of observational learning. This implies that
learning inquiry is like many other human behaviors and can occur through observational
learning.
These results suggest that additional research is necessary to further study the
effects of an expert dialogic system on team behavior and performance. Some avenues to
explore include:
1. Using the virtual facilitator during face to face “spoken” team meetings by converting
the conversations between the team members into written scripts for evaluation.
2. Further developing intervention rules by adding more complex rules or by adding
rules from other experts.
3. Incorporating emotional components of communication between team members. The
system has the capability to incorporate recognition of words and phrases with
emotional attributes and to inquire accordingly into the discussion.
20

7. ACKNOWLEDGMENT
We gratefully acknowledge support of this research through NSF Award No. EEC
- 0644917.
8. REFERENCES
[1] Baca, D., Watkins, S.E., and Luechtefeld, R., (2006) “Patterns in Team Communication during a Simulation Game,” Proc. of the 2006 ASEE Annual Confer, 18-21 June 2006 Chicago, Illinois.
[2] ABET (2007-2008) Criteria for Accrediting Engineering Programs. Engineering Accreditation Commission, Accreditation Board for Engineering and Technology, Inc, Baltimore, MD.
[3] Maier, M., “Ten Years after ‘A Major Malfunction’… Reflections on the Challenger Syndrome”, Journal of Management Inquiry, Vol 11, No 3, 2002, 282-292.
[4] Moorhead, G., Frence, R., Neck, C., “Group Decision Fiascoes Continue: Space Shuttle Challenger and Revised Groupthink Framework”, Human Relations, Vol. 44, No. 6, 1991, pp. 539-550.
[5] Edmondson, A., C., Roberto, M., A., Bohmer, R., M.J., Ferlins, E., M., Feldman, L., R., “The recovery window: Organizational learning following ambiguous threats”, Organization at the limit: lessons from the Columbia disaster edited Starbuck, W., H., Farjoun, M., 2005, Blackwell Publishing, Malden, MA.
[6] Woods, D., D., “Creating Foresight: Lessons for Enhancing Resilience from Columbia”, Organization at the limit: lessons from the Columbia disaster edited by Starbuck, W., H., Farjoun, M., 2005, Blackwell Publishing, Malden, MA.
[7] Townsley, C., A., “Resolving Conflict in Work Teams,” Center for the Study of Work Teams, University of North Texas, 1995.
21

[8] Luechtefeld, R., Watkins, S., E., and Flori, R., “Automated Discourse Interventions and Student Teaming,” (Work In Process paper), Frontiers In Education Conference, 19-22 October 2005, Indianapolis, Indiana.
[9] Cook, M., Elder, L., Ward, G., “Decision Making, Planning and Teams,” Computer Mediated Complex Supervisory and Decision Making in Teams, presented at IEE Colloquium, April 3, 1997, pp. 5/1- 5/22.
[10] Shuman, L., J., Besterfield-Sacre, M., McGourty, J., “The ABET ‘Professional Skills’ – Can They Be Taught? Can They Be Assessed?” Journal of Engineering Education, 94 (1), 41-55, 2005.
[11] Bandura, A., Walters, R., H., Social Learning and Personality Development, Holt, Rinehart and Winston, Inc., July, 1963.
[12] Bandura, A., Social Foundations of Thought and Action, Prentice-Hall, Englewood Cliffs, New Jersey, 1986.
[13] Bandura, A., Social Learning Theory, Prentice-Hall, Inc., Englewood Cliffs, New Jersey, 1977.
[14] Bandura, A., Aggression: A Social Learning Analysis, Prentice-Hall, Englewood Cliffs, New Jersey, 1973.
[15] Rosenthal, T., L., Zimmerman, B., J., Social learning and cognition New York: Academic Press, 1978. pp. 75-15
[16] Luechtefeld, R. and Watkins, S. E., “Balancing Theory and Practice in Higher Education,” in Perspectives on Higher Education in the Digital Age, edited by M. F. Beaudoin (Nova Science Publishers, Hauppauge, NY, 2006), Chap. 15, 247-258.Schwarz, R., M., The Skilled Facilitator – Practical Wisdom for Developing Effective Group, San Francisco: Jossey-Bass Publishers, 1994.
[17] Putnam, R., “Recipes and Reflective Learning: ‘What would prevent you from saying it that way?’” The Reflective Turn: Case Studies in and on Educational Practice, Schön, D. (Ed.), Teacher’s College Press, New York City, 1991.
[18] Bandler, R., Grinder, J., Structure of magic: A book about language and therapy, Science and Behavior Books, Palo Alto, CA, 1975.
[19] Luechtefeld, R., A., “Model II Behavior And Team Performance: An Experimental Design And Intertextual Analysis,” Ph.D. Dissertation, Carroll Graduate School of Management. Boston College, 2002.
22

[20] Wageman, R., “How leaders foster self-managing team effectiveness: Design choices versus hands-on coaching”. Organizational Science, 12, 2001, pp. - 559-577.
[21] Argyris, C., Schön, D., Theory in Practice: Increasing Professional Effectiveness, Jossey-Bass, San Francisco, 1974.
[22] Rajappa, V., “Argyris’ Model II Interventions, Constructive Controversy and Team Performance: The Mediating Role of Constructive Controversy,” M.S. Thesis, University of Missouri-Rolla, 2004.
[23] Tjosvold, D. & Tjosvold, M. M. (1995). “Cooperation theory, constructive controversy, and effectiveness: Learning from crises.” In R. A. Guzzo and E. Salas (Eds.), Team Effectiveness and Decision Making in Organizations. San Francisco: Jossey-Bass, 79-112.
[24] Argyris, C., Reasoning, Learning, and Action, Jossey-Bass, San Francisco, 1982.
[25] Argyris, C., “Single-Loop and Double-Loop Models in Research on Decision Making”, Administrative Science Quarterly, September, 1976, pp. 363-375.
[26] Argyris, C., Putnam, R., McLain-Smith, D., Action Science, Jossey-Bass, San Francisco, 1990.
23

PAPER - 2
EXPERIENTIAL LEARNING: THE EFFECTS OF INSTRUCTOR’S
AUTONOMY SUPPORT ON STUDENTS’ PERFORMANCE & MOTIVATION
Raj Kanwar SinghResearch Assistant
Missouri University of Science & Technology, U.S.A
Dr. Ray A. LuechtefeldAssistant Professor
Missouri University of Science & Technology, U.S.A
ABSTRACT
This paper studies and compares the effects of instructor’s autonomy support on
the motivation and performance of the students in graduate and undergraduate level
courses. The course called EXperience-Based learning or XB considered for this study is
designed to provide autonomy support to students by the instructor (called the “senior
manager”) to help them create their own “process and learning” environment, in a
“classroom as organization” structure. Based on the concept of Self-Determination
Theory the paper hypothesizes that (a) masters level (graduate) students as compared to
bachelors level (undergraduate) students will show relatively higher perceived
competence and interest/enjoyment and lower grade-focused performance goals which
further relates to how students perform in the class, (b) greater perceived autonomy
support tends to increase autonomous self regulation, perceived competence, and interest/
enjoyment amongst students, and (c) students’ performance in the course directly relates
to their autonomous behavior and their perceived autonomy support towards their
instructor.
24

1. INTRODUCTION
Learning in the traditional sense means completion of the homework assignments
and exams by the students in a typical classroom setting. This method of learning
involves one way transfer of information and often creates a “swim or sink” competitive
environment [1]. In a typical classroom setting, students follow their instructor and rely
on him to set the rules for the class. The instructor makes decision on what is right or
wrong in an environment which is organized around the lecture hall, with students busy
following what is laid down by their teacher.
1.1. CLASSROOM AS ORGANIZATION
The Classroom as Organization on the other hand provides the students with an
autonomous setting and support needed to create their own process and learning
environment. With its beginning more than 12 years ago where it was first used to teach
college students theories of organization behavior, the classroom as organization has
found applications in various academic fields including engineering and management. It
is a form of simulation role play that can teach concepts and skills through reflection on
action. EXperience-Based learning, or XB, is one such course being taught both at
bachelors and masters level in a mid-western engineering university.
Contrary to a typical class format where students passively listen to lectures and
take exams, the senior manager (instructor) in this course lets the students run the
organization by delegating responsibilities to the participants. The class creates an
organization and the students are distributed to form different departments to run this
25

organization. For example, the Responsibility department consists of a staffing, planning
and control team. The staffing team takes care of the employment of the organizational
members (students) in different departments and makes sure that the skill sets of the team
and their members match. The weekly agenda is prepared by the Planning team and the
Control team keeps a check on the performance of and evaluations by the students.
Students enact a self-directed learning process to learn the concepts of management and
organizational behavior as a product of the autonomous class environment. The goal of
the students is not winning or competing with others but to develop the concept of
managing and organizing their department and see how its function ties into the whole.
Expressing their opinions and discussing conflicts with other students in the
organizations helps “facilitate self-determination” [2], [3].
1.2. SELF-DETERMINATION THEORY
Self-Determination Theory advocates that an important measure of motivated
behavior is the degree to which it is autonomous rather than controlled [1]. Autonomous
behaviors are voluntary behaviors that are performed out of interest or personal
preferences [1]. They are the product of intrinsic motivation [1]. For example, if a student
attributes his/her interest to internal factors that they can be controlled through, for
example, efforts put in, the behavior is intrinsically motivated. In contrast, if the behavior
is necessary to accommodate to the environment, it is said to be externally or
extrinsically motivated. For example, if the student’s interest is dependent on his/her
grade, then the behavior is extrinsically motivated. Thus, extrinsic motivators, often
26

result in controlled behavior to undertake and sustain the probable circumstance or event
such as the “offer of a reward” [1].
Intrinsic and extrinsic motivation can thus be distinguished from each other on the
basis of the rewards associated with the activity [4]. A behavior is extrinsically motivated
when the individual focuses more on the goal, rather than on the process of doing the
activity well [4]. Intrinsically motivated behavior on the other hand is associated with
feeling of competence and self-determination [4]. Though the competition found in a
typical class environment might seem to foster involvement and generate excitement it is
in reality a special form of extrinsic activity with rewards associated with winning (or
beating the other person or other team) [4]. This form of competition measures students’
effectiveness by competing with others [4].
Based on Self-Determination Theory, researchers have argued that pursuing
extrinsically motivated content tends to be associated with poorer mental health while
intrinsic goal pursuits promotes people’s natural growth tendencies [6], [7]. Studies
indicate that because the pursuit of intrinsic goals promotes satisfaction of one’s
psychological needs for autonomy, competence, and relatedness, it has positive effects on
the mental heath and well being of a person [5]-[7]. On the other hand, the pursuit of
extrinsic goals is aimed at external indicators of worth, which result in excessive social
comparisons and unstable self-esteem, both of which are negatively associated with well
being [7]-[9].
27

1.3. BEHAVIORAL ORIENTATION AND SOCIAL SUPPORT
1.3.1. CAUSALITY ORIENTATION
The degree of self-determination and its source of initiation & regulation is
characterized by causality orientation, which is a relatively enduring aspect of one’s
behavior [10]. Causality orientation can further be divided into three types of orientations
that explain the autonomous, controlled or impersonal behavior of a person.
Autonomy orientation explains the behavioral tendency of an individual to be
autonomous across domains and his/her orientation towards the autonomy supportive
aspect of the environment [1]. Autonomy orientation is seen to positively correlate with
ego-development, self-esteem, and self-actualization and with personality integration [1],
[10], [11]. An individual with a relatively higher autonomy orientation tends to display
greater self-initiation and seeks interest in the activities which are interesting and
challenging while taking responsibility of his/her actions [10]-[15].
The controlled orientation describes the behavioral tendency of an individual to
be controlled and his/her orientation towards controlling inputs such as rewards,
deadlines, structures, ego-involvements, and the directives of others [1], [10]-[15]. The
controlled orientation has a positive correlation with public self-consciousness and
negatively impacts the well being of an individual [1], [7], [10]. An individual higher on
the controlled orientation tends to be dependent upon rewards or other controls and is
more receptive to what people want rather than what they want from themselves [10]-
[15].
28

The third category called the impersonal orientation describes one’s behavioral
tendency to be unmotivated and his/her orientation towards the aspects of the
environment that promote incompetence [1]. This orientation is positively correlated with
social anxiety, depression, and self-derogation [1], [10]. This individual cannot cope up
with demands or changes and tends to believe that he/she is incapable of attaining the
desired outcome and that success is largely a matter of luck or fate [10]-[15].
In the present paper we focus on the autonomy and controlled orientations of the
students.
1.3.2. AUTONOMY SUPPORT
Studies done by Grolnick & Ryan on “social contexts and internalization” show
that an interpersonal context, referred to as autonomy support, is important to promote
internalization and self-determination [2], [16]. Self-determination theory proposes that
the extent to which an individual is autonomous versus controlled is influenced by the
autonomy support [1].
An autonomy supportive individual while in the position of authority (e.g.,
instructor) would consider other’s (e.g., students’) perspective, acknowledge their
feelings and concerns, and provides them with pertinent information and opportunities to
make informed choices [1]. This would minimize the pressure and demand from others to
perform in a particular way and would encourage initiation [17]. For example, an
autonomy supportive instructor would provide the students with necessary information
encouraging them to use this information to solve the problem in their own way [1]. On
29

the other hand, a controlling person in authority would pressure others to work or behave
in their perceived correct way either through coercive or seductive techniques that
generally include implicit or explicit rewards or punishments [1]. For example, a
controlling instructor would expect the students to follow his/her method of solving the
problem to score well on the class tests [1].
Autonomously supportive social events that provide moderate structures and
contain involved others are optimal for encouraging, self-determined engagement, and
promoting development. This is because such events lead to the satisfaction of the basic
needs of a person by facilitating his/her expressions. Studies show that this environment
will not only promote effective behavior but will also help in the development of the
inner resources required for the adaptive self-regulation. In contrast, controlling events
that are unstructured or over-structured or which do not facilitate involvement of
significant others run the risk of undermining self-determination and impairing
development by restraining the satisfaction of the basic needs [17].
Research supports that autonomy supportive class environments are associated
with higher levels of intrinsic motivation than controlling classrooms [1], [18]. Further,
autonomy supportive social events, relative to controlling, are associated with greater
“conceptual learning”, more creativity, and more positive affect in regular and special
education settings [1], [3], [19]-[21].
30

1.3.3. LEARNING SELF-REGULATION
Learning self-regulation considers the reasons why people learn in a particular
setting and why they are engaged in learning related behaviors. Self-determination theory
differentiates a motivation on the degree to which it has been internalized and integrated
with one self. On the continuum from least integrated to fully internalized these
regulations are external, introjected, identified, and integrated. External and introjected
regulations are considered forms of extrinsic motivations whereas identified and
integrated form the intrinsic motivation. Learning self-regulation puts these regulations
under two “super” categories, controlled and autonomous and assesses the extent to
which an individual is autonomous versus controlled in performing particular behaviors
under certain circumstances [14], [16], [22]-[24]. This approach was developed by Ryan
and Connell (1989) and then adapted by Williams and Deci (1996) as the learning self-
regulation questionnaire to study the level of learning in universities [1], [14], [25].
1.3.4. PERCEIVED COMPETENCE
Self-determination theorizes the feeling or perception of competence to be one of
the fundamental psychological needs. Competence is perceived to be important in
facilitating people’s goal attainment and providing them with a sense of satisfaction from
engaging in a particular activity in which they feel effective. Analysis and usage of
perceived competence is done along with perceived autonomy to predict behavioral
change, effective performance, and internalization of ambient values [25], [26].
31

1.3.5. INTEREST AND ENJOYMENT
Interest & Enjoyment is considered to a be measure of intrinsic motivation. A
person with a higher level of interest and enjoyment for a particular field has a higher
intrinsic motivation to excel in that field. Further, it can also be said that the intrinsically
motivated activities are those in which people would not indulge for rewards but for their
own interest and enjoyment.
1.3.6. GRADE AND LEARNING ORIENTATION
Views of the students about their educational experience are either oriented
towards their learning experiences called the Learning Orientation (LO) or their attempts
to obtain the best grades called the Grade Orientation (GO) [27]. Students with a
learning orientation consider the classroom environment as a context where they would
learn new information and ideas that are both personally and professionally significant
[27], [28]. Students with a grade orientation, on the other hand, consider college as a
crucible where the tests and grades are considered necessary evils on the way of getting a
degree or certification in a profession [27], [28].
Regardless of the orientation, students show greater learning in a highly student
centered class, learning and grade orientation together contribute to the perception of the
students towards the instructor, themselves and the way they interact with their instructor
[27], [29], [30]. Further, studies show that students with lesser academic skills are
believed to be under more pressure to obtain “better grades”, thus making them more
grade oriented [27], [31]. Higher learning oriented students choose a college or a course
32

based on the curriculum it follows whereas students with a higher grade orientation tend
to be more concerned with their success at the college or in a course [27], [32].
2. THE PRESENT STUDY
The present study used an undergraduate and a graduate level course to collect
data for research. In this study, we hypothesize the following:
1. Students who take the course for relatively autonomous reasons and perceive their
instructor to be more autonomously supportive would tend to have greater perceived
competence, autonomous self-regulation, interest enjoyment for learning the course,
and lesser grade orientation. This is because students who take this course for
autonomous reasons realize the benefits of this course and its environment as
compared to the student who does not have an autonomous motivation to take the
course. These students who realize the importance of this course if given the
autonomy (by the instructor) to decide what to learn and how to learn,would show an
increased interest and enjoyment for the course and thus would feel competent about
the course material. Further, with a higher intrinsic motivation to learn the course,
they would have a lower grade orientation. Thus, we predict that the instructor’s
autonomy support acts a moderating factor in this process as depicted in Figure 1.
33

2. Students’ performance in this course is predicted to be directly related to their
autonomous behavior with their perceived autonomy support (towards their
instructor) acting as a mediating factor in the process. The students with higher
autonomous motivations (behavior) for the course would see their instructor’s
autonomy support as a method to learn more from the environment Whereas the
students who like to follow the traditional pattern of the class would feel
uncomfortable with the same environment. Thus, we predict that the students who are
comfortable with the class environment would be encouraged to see their instructor as
autonomy supportive and therefore, would have better performance in the class as
compared to others. This is depicted in Figure 2.
34
Student’s Autonomous
Behavior
Instructor’s Autonomy
Support
Increased - Perceived Competence
Autonomous Self-RegulationInterest/Enjoyment
Decreased - Grade Orientation
FIGURE 1: Instructor’s Autonomy Support As Moderating Variable

A study (Black and Deci) similar to the present one revealed that the instructor’s
autonomy support in a chemistry course predicted significant increase in student’s
autonomous regulation, their perceived competence and their interest in the course, thus
increasing their performance in the course. We expect that the support to the present
hypotheses would extend the results of Black and Deci.
3. METHOD
Participants are the students of a mid-western university taking courses in
management at the graduate and undergraduate level. They attend this course as a
standard class course under the same professor. The students are randomly assigned to
different departments where they apply the concepts taught in the class to accomplish the
tasks of their department. The organization is led by the senior manager (instructor) who
helps facilitate problem solving, surfaces difficult issues, and encourages active
engagement with the material.
35
Student’s Autonomous
BehaviorPerceived Autonomy
SupportStudents’
Performance in the course
FIGURE 2: Perceived Autonomy Support As Mediating Variable

The students in both the classes were asked to fill out two surveys pre & post
course at the start and end of the semester. They were informed that the participation in
this research was voluntary and if they chose not to participate, their grades would not be
affected in any way. Also, the instructor will not have access to the responses and names
of the students who chose to participate. Of 48 students, 23 students filled either one or
more surveys. The number of males and females in each course is shown in Table 1 (refer
to Appendix B, Table 1 for details). The first survey was requested in the first month of
the course and asked about the students’ feelings towards a typical course. Students were
asked to complete the second survey in the last one and a half month, and it dealt with
students’ reactions towards XB.
Course Session Males Females
314 Fall, 2007 10 4
313 Spring, 2008 3 2
314 Spring, 2008 4 0
36
TABLE 1: Number of Males & Females

4. MEASURES
The surveys contained the following measures:
4.1. THE GENERAL CAUSALITY ORIENTATION SCALE (GCOS)
There are three types of orientations including autonomy, controlled and
impersonal. Each is theorized to exist within an individual up to some degree [10]-[15].
These orientations are considered to be the “relative enduring aspects of
personality” [10]-[15]. The scale known as the General Causality Orientation Scale,
measures these three motivational orientations within an individual [10]-[15]. The
measure has three sub-scales to it, based on the three types of orientations.
The scale consists of 12 hypothetical vignettes, each describing a typical social or
achievement oriented situation (for example, planning an event or interacting with a
colleague) and is followed by three types of responses - autonomous, controlled, and
impersonal. Respondents (students) are asked to indicate, how true a response is for them
on a 7-point Likert scale [1], [10]-[15]. Thus, the score of each sub-scale is calculated by
summing the item corresponding to each scale. The scale has been analyzed by Deci and
Ryan to be reliable, with Cronbach alphas of about 0.75 and a test-retest coefficient of
0.74 over two months, and to correlate as expected with a variety of theoretically related
constructs [10]-[15].
37

4.2. PERCEIVED AUTONOMY SUPPORT: THE LEARNING CLIMATE
QUESTIONNAIRE (LCQ)
The Learning Climate Questionnaire as adapted by Williams and Deci (1996)
from the Health-Care Climate Questionnaire is used for this study [1], [24], [25]. This
scale concerns the degree to which the target individual (student) perceives people in
authority (instructor) to be autonomy supportive [1], [25], [33], [34]. This 15-item scale
asks the students to respond to the questions on a 7-point Likert scale and thus measures
the degree to which instructors are perceived to be autonomously supportive.
For the present study, the pre-course survey asks the students about their
perceived autonomy support towards their instructor in a typical course as compared to
the post-course survey where students answer questions in regards of their perception of
the XB course instructor. Comparisons are made among the responses of graduate and
undergraduate level students towards a typical course and XB.
4.3. THE LEARNING SELF-REGULATION QUESTIONNAIRE (LSRQ)
The Learning Self-Regulation Questionnaire (SRQ) was adapted from the original
SRQ designed for elementary students and the subsequent version adapted for students
studying organic chemistry [1], [14]. The questionnaire asks why the respondent (student)
performs a particular behavior (or a class of behavior) and then provides several possible
pre-selected reasons to represent different styles of regulations and motivations [14], [16],
[22]-[24]. The questionnaire is divided into analyzing two regulations, which are
measured as autonomous sub-scale and controlled sub-scale.
38

The pre-course survey asks questions about a typical course whereas the post-
course survey deals with the questions on the XB course. Students rate how true each of
the 12 reasons are for them to engage in a particular behavior while studying the course,
using the 7-point Likert scale. Five of the reasons are intrinsic, thus being considered
autonomous (e.g., “I will participate actively in the XB course because a solid
understanding of management concepts is important for my intellectual growth”). Seven
are external and were thus considered controlled (e.g., “The reason that I will work to
expand my knowledge in this subject is because a good grade in the course will look
positive on my record”) [14], [16], [22]-[24]. Sub-scale scores are the sum of the items on
each scale.
4.4. THE PERCEIVED COMPETENCE SCALE (PCS)
The Perceived Competence Scale is designed for specific behavior or domain
being studied [25], [26]. This scale assesses participant’s feelings of competence towards
the course they are taking [25], [26]. This scale was used to analyze students’ responses
(both graduate and undergraduate) towards a typical course as compared to XB. This
scale is a 5-item measure adapted from Williams and Deci (1996) [1], [25]. The score is
the sum of student’s rating on the truth of each felt-competence item [1].
4.5. THE INTEREST/ENJOYMENT (I/E) MEASURE
Similar to PCS, the Interest/Enjoyment Measure was also adapted from Williams
and Deci (1996) [1], [25]. Further, this measure was also taken by all the students twice
39

in the pre and post course to assess their reactions towards a typical course and XB
respectively. The scale asks the students to rate the truth of seven items (e.g., “This
course was fun to do”) on a 7-point Likert scale, the sum of which is the total score.
4.6. THE GRADE ORIENTATION SCALE (GOS)
The Grade Orientation Scale is a part of the 32-item Learning Orientation and
Grade Orientation (LOGO II) scale which assesses how students perceive their education
[27], [28]. The scale for the present study is a 16-item scale taken from a study conducted
by Bell and which is a 16-item scale [27]. It measures the extent to which students are
focused more on grades than on learning [1].
The respondents use a 5-point Likert scale to rate each of the 16 items, 8 of which
reflect Learning Orientation and the other 8 reflect Grade Orientation of the students
[27]. Unlike the above two scales, this scale does not concentrate on a typical course or
XB but it intends to analyze the difference in grade orientation of the students (graduate
vs. undergraduate) in the beginning and end of the course.
4.7. PERFORMANCE IN THE COURSE
Ordinal ranking of the performance of the students was received from the
instructor. The ranking was performed on a scale from 1 through 10 with 1 being the best
and 10 being the worst. Ranking was based on the student’s placement in the distribution
of the scores in the class.
40

5. RESULTS
The survey responses from the students over the two semesters were analyzed and
evaluated for result of the two hypotheses.
1. Students who take the course for relatively autonomous reasons and perceive their
instructor to be more autonomously supportive would tend to have greater perceived
competence, autonomous self-regulation, interest enjoyment for learning the course,
and lesser grade orientation.
To analysis to prove the moderating factor hypothesis regression analysis was
performed on the following relationships for graduate and undergraduate students
separately:
1. Relation of students’ autonomous behavior with the outcomes.
2. Relation of instructors’ autonomy support with the outcomes.
3. Relation of the product of students’ autonomous behavior and their perceived
autonomy support towards their instructor with the outcomes.
The relation of the product with the outcomes if significant will prove that
students’ autonomy support acts as a moderating variable to influence the outcomes.
The regression performed on the relation of graduate students’ autonomous
behavior, their autonomy support and the product with the outcomes is depicted in
Figure 3 and Figure 4. Consider Appendix B, Figure 1 - Figure 4 for details.
41

42
Autonomous Behavior
Instructorʼs Autonomy Support
Product
Perceived Competence
p = 0.00 R2 = 0.626
p = 0.021
R2 = 0.308
p = 0.001
R2 = 0.510
Autonomous Behavior
Instructorʼs Autonomy Support
Product
Autonomous Self-Regulation
p = 0.027 R2 = 0.285
p = 0.025
R2 = 0.294
p = 0.010
R2 = 0.368
FIGURE 3: Relation with Perceived Competence & Interest/Enjoyment for Graduate Students

43
Autonomous Behavior
Instructorʼs Autonomy Support
Product
Interest Enjoyment
p = 0.206 R2 = 0.104
p = 0.026
R2 = 0.289
p = 0.037
R2 = 0.258
Autonomous Behavior
Instructorʼs Autonomy Support
Product
Grade Orientation
p = 0.318 R2 = 0.066
p = 0.231
R2 = 0.094
p = 0.214
R2 = 0.101
FIGURE 4: Relation with Interest/Enjoyment & Grade Orientation for Graduate Students

The significance of relation between the product of students’ autonomous
behavior and their perceived autonomy support and the outcomes show that the
instructor’s autonomy support acts as a moderating variable to influence perceived
competence, autonomous self-regulation and interest/enjoyment of the graduate
students.
Similar analysis was performed for the undergraduate students. Figures 5 and
Figure 6 depict the relations and their significance. The analysis shows that the
instructor’s autonomy support does not act as a moderating variable to influence any
of the outcomes. Consider Appendix B, Figure 5 - Figure 8 for details.
Further, the means of student responses on different behaviors were computed
for the graduate and undergraduate students for pre and post course surveys.
Independent sample t-test was used for finding the means. The results are given in
Table 2.
Comparing autonomous behaviors of the graduates and undergraduates
depicts that the graduate students are more autonomously oriented towards the course
during both pre and post the course as compared to the undergraduates. The
significance of the mean comparison is 0.1615 and 0.1355, respectively, for pre and
post course data. Consider Appendix B, Figure 9 and Figure 10 for details.
Comparing the perceived autonomy support of the students towards their
instructor at the graduate and undergraduate level shows that the graduate students
consider their instructor more autonomously supportive. The significance of the mean
comparison is 0.0005. Consider Appendix B, Figure 11 for details.
44

45
Autonomous Behavior
Instructorʼs Autonomy Support
Product
Perceived Competence
p = 0.866 R2 = 0.011
p = 0.594
R2 = 0.105
p = 0.624
R2 = 0.090
Autonomous Behavior
Instructorʼs Autonomy Support
Product
Autonomous Self-Regulation
p = 0.962 R2 = 0.001
p = 0.962
R2 = 0.001
p = 0.945
R2 = 0.002
FIGURE 5: Relation with Perceived Competence & Interest/Enjoyment for Undergraduate Students

46
Autonomous Behavior
Instructorʼs Autonomy Support
Product
Interest Enjoyment
p = 0.601 R2 = 0.102
p = 0.379
R2 = 0.261
p = 0.392
R2 = 0.249
Autonomous Behavior
Instructorʼs Autonomy Support
Product
Grade Orientation
p = 0.959 R2 = 0.001
p = 0.807
R2 = 0.023
p = 0.816
R2 = 0.021
FIGURE 6: Relation with Interest/Enjoyment & Grade Orientation for Undergraduate Students

Behavior Pre/Post Graduates Undergraduates Significance
Autonomous Behavior
Perceived Autonomy Support
Perceived Competence
Autonomous Self-Regulation
Interest/Enjoyment
Grade Orientation
Pre-Course 75.4286 69.6667 0.1615
Post-Course 73.23 68.03 0.1355
Post-Course 6.03 4.09 0.0005
Post-Course 6.13 5.75 0.225
Post-Course 5.8941 4.68 0.07
Post-Course 5.5653 3.458 0.0004
Post-Course 26.6 21.2941 0.15
Comparison of perceived competence, autonomous self-regulation, and
interest/enjoyment for the graduates and undergraduates shows that the graduate
students have higher traits than the undergraduates in all the three behaviors. The
significance of comparison is 0.225, 0.07, and 0.0004, respectively, for perceived
competence, autonomous self-regulation and interest/enjoyment. Consider Appendix
B, Figure 12 for details.
A comparison of the grade orientation of the graduates and undergraduates
shows that the graduates are less grade oriented than the undergraduates. The
47
TABLE 2: Mean Comparisons Using t-Test

significance of the mean comparison is 0.15. Consider Appendix B, Figure 12 for
details.
The above results indicate that there is no significant difference between the
autonomous behaviors of graduate and undergraduate students (p>0.05). The
difference in perceived autonomy support for graduates and undergraduates is
significant (p<0.05). Further, the data does not show a significant increase in
perceived competence and autonomous self-regulation (p>0.05) for graduate students
as compared to undergraduates. However, there is a significant increase in the level of
interest/enjoyment for the graduate students (p<0.05). Grade orientation for graduate
and undergraduate students does not show a significant difference (p>0.05).
Therefore, the results show that graduate students show a higher perceived
autonomy support towards the instructor. Thus their interet/enjoyment increases
significantly as compared to the undergraduate by the end of the course.
2. Students’ performance in this course is predicted to be directly related to their
autonomous behavior with their perceived autonomy support (towards their
instructor) acting as a mediating factor in the process.
Regression analysis was used to test this hypothesis. The analysis required for
testing mediating hypothesis involves the following steps [35], [36] -
1. Showing significant relation between the predictor variable (student’s autonomous
behavior) and mediating variable (perceived autonomy support) using regression
analysis. Consider Appendix B, Figure 13 for details.
48

2. Showing significant relation between the mediating variable (perceived autonomy
support) and criterion variable (student’s performance in the course) using
regression analysis. Consider Appendix B, Figure 14 for details.
3. Showing less than significant relation between the predictor variable (students’
autonomous behavior) and criterion variable (student’s performance in the course)
using regression analysis. Consider Appendix B, Figure 15 for details.
The values of p-value and R2 (coefficient of determination) for each analysis
is shown in the Figure 7.
49
Student’s Autonomous
BehaviorPerceived Autonomy
SupportStudent’s
Performance in the course
FIGURE 7: Relation Significance Using Regression Analysis
p = 0.00
R2 = 0.487
p = 0.00
R2 = 0.796
p = 0.05
R2 = 0.328

The calculations performed for the steps in the analysis indicate that there is a
significant relation between students’ autonomous behavior and perceived autonomy
support and between perceived autonomy support and students’ performance in the
course. Also, there is less than significant relation between students’ autonomous
behavior and students’ performance in the course. Thus, we can state that perceived
autonomy support of the students towards their instructors acts as a mediating factor
in relating their autonomous behavior to their performance in the course.
6. DISCUSSION
There are some important differences in the present study and the research of
Black & Deci:
1. The course content of organic chemistry is considered to be orthogonal to
instructor’s style of teaching, whereas the course content of XB is considered to
be conceptually related to the construct of instructor’s autonomy support [1].
2. Some students dread organic chemistry, whereas management students typically
want to learn management skills, so there might be considerably less variability in
the relative autonomy of students in the present study (both graduate and
undergraduate) [1].
3. There is a considerable difference in the number of students who took the survey.
A total of 137 students took both the pre and post course survey in the organic
chemistry class as compared to a total of 23 students who either completed the
first or the second survey.
50

4. The perceived autonomy support towards the instructors is consistent with all the
students under six to eight different instructors in the organic chemistry course
whereas there a significant difference in the reaction of students at graduate and
undergraduate level.
Thus, the present study offers an opportunity to explore the reaction of students at
the graduate and undergraduate level and why they differ on the basis of autonomous
behavior and perceived autonomy support.
The cause of difference in reactions of the graduate and undergraduate students
towards the course and the instructor can be divided into three tiers related to students’
autonomous behavior, perceived autonomy support, and their trust in their instructor. We
consider these in turn.
First, understanding the relationship of students’ autonomous behavior to their
perceived competence, autonomous self-regulation, interest/enjoyment, and grade
orientation is important. Regression analysis was performed to determine the significance
of students’ autonomous behavior being related to perceived competence, autonomous
self-regulation, interest/enjoyment, and grade orientation. Figure 8 illustrates these
relationships.
1. Students’ autonomous behavior is significantly related to their perceived competence
and grade orientation towards the course (p<0.05). (Appendix B, Figure 16 and 19).
2. Students’ autonomous behavior is not significantly related to autonomous self-
regulation and their interest/enjoyment (p>0.05). (Appendix B, Figure 17 and 18).
51

Thus, the data confirms that the students’ level of autonomy would relate to their
increased perceived competence and lower grade orientation.
Second, understanding the relationship of students’ perceived autonomy support
with perceived competence, autonomous self-regulation, interest/enjoyment, and grade
orientation is also important.
Regression analysis performed on the data (Figure 9) shows that the students’
perceived autonomy support is significantly related to perceived competence,
autonomous self-regulation, interest/enjoyment, and grade orientation (p<0.05).
(Appendix B, Figures 20-23). The results relating autonomous behavior and perceived
52
Students’ Autonomous Behavior
Autonomous Self-Regulation
Perceived Competence
Interest Enjoyment
Grade Orientation
p = 0.000R 2 = 0.392p = 0.060
R2 = 0.113
p = 0.027R 2 = 0.153
p = 0.225
R2 = 0.049
FIGURE 8: Relationship Significance with Autonomous Behavior

autonomy support to adjustment variables are consistent with the findings of the Black
and Deci , as well as Williams and Deci [1], [25].
Third, the level of trust and ability to share feelings may be driving differences
between the graduates and undergraduates. Calculating the average scores given to the
53
Perceived Autonomy Support
Autonomous Self-Regulation
Perceived Competence
Interest Enjoyment
Grade Orientation
p = 0.015R 2 = 0.182p = 0.001
R2 = 0.316
p = 0.009R 2 = 0.205
p = 0.000
R2 = 0.386
FIGURE 9: Relationship Significance with Perceived Autonomy Support

questions 8 and 15 from the Learning Climate Questionnaire (Table 3) which ask about
the level of trust and ability to share feelings with the instructor shows that
undergraduates feel less trust and higher inability to share feelings with the instructor as
compared to the graduate students. Consider Table 2 in Appendix B for details on more
responses.
No Question 314 (Graduate) 313 (Undergraduate)
8 I feel a lot of trust in the instructor 5.6 3.2
15I feel able to share my feelings with
my instructor 6.2 3.4
7. CONCLUSION
As an investigation of the concept of experiential based learning, this study tested
the effect of instructor’s autonomy support on students’ performance and motivation. The
results that were found have the following implications.
Master level students as compared to bachelor level students show higher
autonomous self-regulation and interest/enjoyment. While not conclusive, there is higher
54
TABLE 3: Responses to Trust and Ability to Share Feelings

perceived competence and lower grade orientation. Data indicates that students’
performance in the course directly relates to their autonomous behavior and their
perceived autonomy support towards their instructor.
Further, the above results suggest that additional research is necessary to further
study the effects of students’ autonomous behavior and instructor’s autonomy support on
perceived competence and grade orientation. Some avenues to explore include:
1. Using experiential based learning to teach other engineering courses and study the
effect of this approach in comparison to those taught in traditional ways.
2. Using the data to study the root cause of difference in behavior of the students at
graduate and undergraduate levels.
3. Studying the effect of students’ previous work experience on their reactions in the
class would be beneficial, as students with work experience tend to react better to
ambiguity created in the classroom.
In light of these results and suggested future work, it appears that shifting towards
providing more autonomy support for students’ autonomy and active learning may hold
promising results for enhancing students’ achievement and psychological development
[1]. The present data falls short of providing more conclusive results on certain aspects.
However, the study’s findings on supporting students’ autonomy which facilitates the
learning and adjustment of the students in the class would likely be helpful in other
college-level engineering courses.
55

8. REFERENCES
[1] Black, A.E., and Deci, E.L., “The Effects of Instructors’ Autonomy Support and Students’ Autonomous Motivation on Learning Organic Chemistry: A Self-Determination Theory Perspective, Sci Ed., 84, 740-756, John Wiley & Sons, Inc., 2000.
[2] Deci, E.L., Eghrari, H., Patrick, B.C., and Leone, D.R., “Facilitating Internalization: The Self-Determination Theory Perspective”, University of Rochester, Journal of Personality, 62:1, 119-142, Duke University Press, 1994.
[3] Koestner, R., Ryan, R.M., Bernieri, F., and Holt, K., “Setting Limits on Children’s Behavior: The Differential Effects of Controlling versus Informational Styles on Intrinsic Motivation and Creativity”, Journal of Personality, 52, 233-248, 1984.
[4] Deci, E.L., Betley G., Kahle, J., Abrams, L., and Porac, J., “When Trying To Win: Competition and Intrinsic Motivation”, University of Rochester, Personality and Social Psychology Bulletin, Vol. 7, No. 1, 79-83, Society for Personality and Social Psychology, Inc., 1981.
[5] Deci, E.L., and Ryan, R.M., “The “What” and “Why” of Goal Pursuits: Human Needs and the Self-Determination of Behavior, Psychological Inquiry, 11, 227-268, 2000.
[6] Sheldon, K.M., Elliot, A.J., Kim, Y., and Kasser, T., “What is Satisfying about Satisfying Events?: Testing 10 Candidate Psychological Needs”, Journal of Personality and Social Psychology, 80, 325-339, 2001.
[7] Vansteenkiste, M., Simons, J., Lens, W., Sheldon, K.M., and Deci, E.L., “Motivating Learning, Performance, and Persistence: The Synergistic Effects of Intrinsic Goal Contents and Autonomy-Supportive Contexts”, Journal of Personality and Social Psychology, Vol. 87, No. 2, 246-260, The American Psychological Association, 2004.
[8] Lyubomirsky, S., and Ross, L., “Hedonic Consequences of Social Comparison: A Contrast of Happy and Unhappy people”, Journal of Experimental Social Psychology, 15, 285-294, 1997.
[9] Kernis, M.H., Brown, A.C., and Brody, G.H., “Fragile Self-Esteem in Children and its Associations with Perceived Patterns of Parent-Child Communication”, Journal of Personality, 68, 225-252, 2000.
56

[10] Deci, E.L., and Ryan, R.M., “The General Causality Orientation Scale: Self-Determination in Personality”, University of Rochester, Journal of Research in Personality, 19, 109-134, Academic Press, Inc., 1985.
[11] Koestner, R., Bernieri, F., and Zuckerman, M., “Self-Determination and Consistency between Attitudes, Traits, and Behaviors”, Personality and Social Psychology Bulletin, 18, 52-59, 1992.
[12] Hodgins, H.S., Koestner, R., and Ducan, N., “On the Compatibility of Autonomy and Relatedness”, Personality and Social Psychology Bulletin, 22, 227-237, 1996.
[13] King, K.B., “Coping with Cardiac Surgery”, Unpublished doctoral dissertation, University of Rochester.
[14] Ryan, R.M., and Connell, J.P., “Perceived Locus of Causality and Internalization: Examining Reasons for Acting in Two Domains”, Journal of Personality and Social Psychology, 96, 254-258, 1987.
[15] Strauss, J., and Ryan, R.M., “Autonomy Disturbances in Subtypes of Anorexia Nervosa”, Journal of Abnormal Psychology, 96, 254-258, 1987.
[16] Grolnick, W.S., and Ryan, R.M., “Perceived Styles Associated with Children’s Self-Regulation and Competence in School”, Journal of Educational Psychology, 81, 143-154, 1989.
[17] Deci, E.L., and Ryan, R.M., “A Motivational Approach to Self-Integration in Personality”, University of Rochester, Nebraska Symposium on Motivation, Vol. 38, 237-288, Perspective on Motivation, Lincoln, NE: University of Nebraska Press, 1990.
[18] Deci, E.L., Schwartz, A.J., Sheinman, L., and Ryan, R.M., “An Instrument to Assess Adults’ Orientations towards Control versus Autonomy with Children: Reflection on Intrinsic Motivation and Perceived Competence”, Journal of Educational Psychology, 73, 642-650, 1981.
[19] Grolnick, W.S., and Ryan, R.M., “Autonomy in Children’s Learning: An Experimental and Individual Difference Investigation”, Journal of Personality and Social Psychology, 52, 977-1077, 1987.
[20] Ryan, R.M., and Grolnick, W.S., “Origins and Pawns in the Classroom: Self-Report and Pro-jective Assessments of Individual Differences in Children’s Perceptions”, Journal of Personality and Social Psychology, 50, 550-558, 1986.
57

[21] Deci, E.L., Hodges, R., Pierson, L., and Tomassone, J., “Autonomy and Competence as Motivational Factors in Students with Learning Disabilities and Emotional Handicaps”, Journal of Learning Disabilities, 25, 457-471, 1992.
[22] Loevinger, J., “Objective Tests as Instruments of Psychological Theory”, Psychological Reports, Monograph Supplement, 9 (1, Serial No. 3), 1957.
[23] Ryan, R.M., and Deci, E.L., “Self-Determination Theory and the Facilitation of Intrinsic Motivation, Social Development, and Well Being”, American Psychologist, 55, 68-78, 2000.
[24] Williams, G.C., Grow, V.M., Freedman, Z., Ryan, R.M., and Deci, E.L., “Motivational Predictors of Weight Loss and Weight Loss Maintenance”, Journal of Personality and Social Psychology, 70, 115-126, 1996.
[25] William, G.C., and Deci, E.L., “Internalization of Biopsychological Values by Medical Students: A Test of Self-Determination Theory”, Journal of Personality and Social Psychology, 70, 767-779, 1996.
[26] William, G.C., Freedman, Z.R., and Deci, E.L., “Supporting Autonomy to Motivate Glucose Control in Patients with Diabetes”, Diabetes Care, 21, 1644-1651, 1998.
[27] Bell, L.M., “Instructors’ Message Variables and Students’ Learning Orientation/Grade Orientation and Affective Learning”, M.A. Thesis, West Virginia University, 2003.
[28] Milton, O., Pollio, H.R., and Eison, J.A., “Making Sense of College Grades”, p-126, San Francisco: Jossey-Bass, 1986.
[29] Lawrence, K.R., and Frymier, A.B., “ The Relationship of Student Centered and Instructor Centered Teaching with Learning and Grade Orientation,” Paper presented at the annual meeting of National Communication Association, New Orleans, LA, 2002.
[30] Pollio, H.R., and Beck, H.P., “Perception of Learning and Grade Orientation in, and by, contemporary College Students and Faculty”, The Journal of Higher Education, 71, 84-102, 2000.
[31] Johnson, B.G., and Beck, H.P., “Strict and Lenient Grading Scales: How do they Affect the Performance of College Students with High and Low SAT scores?”, Teaching of Psychology, 15, 127-131, 1988.
58

[32] Alexitch, L.R., and Page, S., “Educational Orientation and Students’ Perception of a University Education”, Guidance and Counseling, 17, 8-16, 2001.
[33] Williams, G.C., Saizow, R., Ross, L., and Deci, E.L., “Motivation Underlying Career Choice for Internal Medicine and Surgery”, Social Science and Medicine, 45, 1705-1713, 1997.
[34] Williams, G.C., Wiener, M.W., Markakis, K.M., Reeve, J., and Deci, E.L., “Medical Stident Motivation for Internal Medicine”, Journal of General Internal Medicine, 9, 327-333, 1994.
[35] Baron, R, M. & Kenny, D. A., “The moderator – mediator distinction”, Journal of Personality and Social Psychology, 1173-1182, 1986.
[36] Rajappa, V., “Argyris' Model II interventions, constructive controversy and team performance: the mediating role of constructive controversy”, M.S. Thesis, University of Missouri - Rolla, 2004.
59

FUTURE WORK
The research performed to study the two types of learning behaviors of students
shows that these approaches have promising effects on the students and their learning
behaviors and motivations. This piece of work is significant platform to further study the
behaviors of students and the variables that effect these behaviors. Paper 1 shows that
students learn the beneficial behavior of inquiry and, though not conclusive,
Observational Learning seems to take place. Paper 2 demonstrates that the graduate
students perceive their instructor as more autonomy supportive and have a higher trust in
their instructor as compared to the undergraduates. Also, the level of Interest/Enjoyment
towards the class is higher amongst the graduate students than the undergraduates.
With the present findings there were certain limitations that both the studies had.
These limitations for the two papers are listed below -
Paper 1:
1. The number of students who participated in the simulation games or the number of
teams included in the study were not sufficient.
2. Students were extrinsically motivated to become a part of this study. These
motivations were either the reward of grades or attendance.
3. The simulation exercises used for this study took longer to make decisions than the
time that was given to the teams.
Paper 2:
1. The number of students who took the survey were not sufficient.
2. The data does not consider individual responses of recipients on pre and post survey
for comparison.
3. The state and trait of individual students was not studied i.e., the survey did not ask
questions based on the State Trait Anxiety Inventory (STAI).
60

4. Students’ experience can be studied and associated with the reaction of the students
towards the class and the instructor.
While conducting these research studies we realized the following and thus would
want make some recommendations for any future research that is done based on this
work:
1. Students should be involved voluntarily to participate in the simulation exercises
rather than motivating them with the reward of extra points or attendance. This would
ensure their initial interest in the exercises.
2. The virtual facilitator should be used as a tool where the students can talk to other
members of their team and the conversation is intervened by the facilitator based on
their oral rather than written conversations.
3. More intervention rules should be added to the pool of rules. This pool can be
enhanced by adding the rules based on Marshall Rosenberg’s work of Non-Violent
Communication.
4. Diversity based on ethnicity, gender and academic level (for example, sophomore,
junior, senior etc) should be assured when making teams for the exercises.
5. Survey responses only of individual who take both pre and post course survey for the
XB course should be accepted. This helps in getting more accurate data.
6. Pre-course data should be collected in the first month of the semester and the post-
course data should be collected in the last one and a half month.
Based on the above recommendations we feel that there is scope for further
research. The approach to observational learning can be studied in more detail based on
the interventions provided by Marshall Rosenberg’s work. With higher number of
students participating in the exercises and the teams becoming more diverse would lead
to better data and understanding of the reaction of students to the virtual facilitator.
Other engineering courses which use experiential learning to teach students
should be considered for this research also. Studying the reaction of students based on
any prior experience they have in the corporate world would give a better understanding
of students’ reactions to ambiguity they find in XB. Further, we believe that it is
61

necessary to consider the data of only those students who fill both the pre and post course
surveys. This would help to measure the difference in the level of change in behaviors
that they would have during the course more accurately.
We also believe that the findings of this research should not only be limited to the
simulation exercises or the XB course but can be extended to other fields of education
also. These approaches will also be effective in teaching concepts of physics or
engineering as they were effective in teaching management concepts.
62

APPENDIX A.
PAPER-2 SURVEY QUESTIONNAIRE
63

1. Pre-Course (Typical Course) Survey
1.1. General Perspective on Situations
Please use the following scale to rate your responses –
1 2 3 4 5 6 7 very unlikely moderately likely very likely
1. You have been offered a new position in a company where you have worked for some time. The first question that is likely to come to mind is:
(a) What if I can't live up to the new responsibility?(b) Will I make more at this position?(c) I wonder if the new work will be interesting.
2. You have a school-age daughter. On parents' night the teacher tells you that your
daughter is doing poorly and doesn't seem involved in the work. You are likely to:
(a) Talk it over with your daughter to understand further what the problem is.(b) Scold her and hope she does better.(c) Make sure she does the assignments, because she should be working harder.
3. You had a job interview several weeks ago. In the mail you received a form letter,
which states that the position has been filled. It is likely that you might think:
(a) It's not what you know, but who you know.(b) I'm probably not good enough for the job.(c) Somehow they didn't see my qualifications as matching their needs.
4. You are a plant supervisor and have been charged with the task of allotting coffee
breaks to three workers who cannot all break at once. You would likely handle this by:
(a) Telling the three workers the situation and having them work with you on the schedule.
(b) Simply assigning times that each can break to avoid any problems.(c) Find out from someone in authority what to do or do what was done in the past.
64
5. A close (same-sex) friend of yours has been moody lately, and a couple of times has become very angry with you over "nothing." You might:
(a) Share your observations with him/her and try to find out what is going on for him/her.
(b) Ignore it because there's not much you can do about it anyway.(c) Tell him/her that you're willing to spend time together if and only if he/she makes
more effort to control him/herself.
6. You have just received the results of a test you took, and you discovered that you did very poorly. Your initial reaction is likely to be:
(a) "I can't do anything right," and feel sad.(b) "I wonder how it is I did so poorly," and feel disappointed.(c) "That stupid test doesn't show anything," and feel angry.
7. You have been invited to a large party where you know very few people. As you look
forward to the evening, you would likely expect that:
(a) You'll try to fit in with whatever is happening in order to have a good time and not look bad.
(b) You'll find some people with whom you can relate.(c) You'll probably feel somewhat isolated and unnoticed.
8. You are asked to plan a picnic for yourself and your fellow employees. Your style for approaching this project could most likely be characterized as:
(a) Take charge: that is, you would make most of the major decisions yourself.(b) Follow precedent: you're not really up to the task so you'd do it the way it's been
done before.(c) Seek participation: get inputs from others who want to make them before you
make the final plans.
9. Recently a position opened up at your place of work that could have meant a promotion for you. However, a person you work with was offered the job rather than you. In evaluating the situation, you're likely to think:
(a) You didn't really expect the job; you frequently get passed over.(b) The other person probably "did the right things" politically to get the job.(c) You would probably take a look at factors in your own performance that led you
to be passed over.
65

10. You are embarking on a new career. The most important consideration is likely to be:
(a) Whether you can do the work without getting in over your head.(b) How interested you are in that kind of work.(c) Whether there are good possibilities for advancement.
11. A woman who works for you has generally done an adequate job. However, for the
past two weeks her work has not been up to par and she appears to be less actively interested in her work. Your reaction is likely to be:
(a) Tell her that her work is below what is expected and that she should start working harder.
(b) Ask her about the problem and let her know you are available to help work it out.(c) It's hard to know what to do to get her straightened out.
12. Your company has promoted you to a position in a city far from your present location. As you think about the move you would probably:
(a) Feel interested in the new challenge and a little nervous at the same time.(b) Feel excited about the higher status and salary that is involved.(c) Feel stressed and anxious about the upcoming changes.
66
1.2. Perceived Autonomy Support
This questionnaire contains items that are related to your experience with your instructor in a typical class. Instructors have different styles in dealing with students, and we would like to know more about how you have felt about your encounters with your instructor in other courses. Your responses are confidential. Please be honest and candid. Please use the following scale to rate your responses - 1 2 3 4 5 6 7 strongly neutral strongly disagree agree
1. I feel that my instructor provides me choices and options.
2. I feel understood by my instructor.
3. I am able to be open with my instructor during class.
4. My instructor conveyed confidence in my ability to do well in the course.
5. I feel that my instructor accepts me.
6. My instructor made sure I really understood the goals of the course and what I need to do.
7. My instructor encouraged me to ask questions.
8. I feel a lot of trust in my instructor.
9. My instructor answers my questions fully and carefully.
10. My instructor listens to how I would like to do things.
11. My instructor handles people's emotions very well.
12. I feel that my instructor cares about me as a person.
13. I don't feel very good about the way my instructor talks to me.
14. My instructor tries to understand how I see things before suggesting a new way to do things.
15. I feel able to share my feelings with my instructor.
67

1.3. Learning in a Typical Course
Please use the following scale to indicate how true each reason is for you:
1 2 3 4 5 6 7 not at all somewhat very true true true
1. I will participate actively in a typical course:
(a) Because I feel like its a good way to improve my understanding of the material.(b) Because others might think badly of me if I didn’t.(c) Because I would feel proud of myself if I did well in the course.(d) Because a solid understanding of the material is important to my intellectual
growth.
2. I am likely to follow my instructor’s suggestions for studying for a typical course:
(e) Because I would get a bad grade if I didn’t do what he/she suggests.(f) Because I am worried that I am not going to perform well in the course.(g) Because it’s easier to follow his/her suggestions than come up with my own study
strategies.(h) Because he/she seems to have insight about how best to learn the material.
3. The reason that I will work to expand my knowledge of the subject is:
(i) Because its interesting to learn more about the material of the course.(j) Because it’s a challenge to really understand how to solve the course problems.(k) Because a good grade in the course will look positive on my record.(l) Because I want others to see that I am intelligent.
68

1.4. Perceptions on Learning
Please respond to each of the following items in terms of how true it is for you with respect to your learning in a typical course. Use the scale:
1 2 3 4 5 6 7 not at all somewhat very true true true
1. I feel confident in my ability to learn the material of the course.2. I am capable of learning the material in this course.3. I am able to achieve my goals in this course.4. I feel able to meet the challenge of performing well in this course.
1.5. Interest /Enjoyment Measure in a Typical Course
For each of the following statements, please indicate how true it is for you using the following scale:
1 2 3 4 5 6 7 not at all somewhat very true true true
1. I enjoy doing a typical course very much. 2. A typical course is fun to do.3. I think a typical course is a boring course.4. A typical course does not hold my attention at all. 5. I would describe a typical course as very interesting.6. I think a typical course is quite enjoyable.7. While I am doing a typical course, I think about how much I enjoy it.
69

2. Post-Course (XB) Survey
2.1. General Perspective on Situations
Please use the following scale to rate your responses –
1 2 3 4 5 6 7 very unlikely moderately likely very likely
1. You have been offered a new position in a company where you have worked for some time. The first question that is likely to come to mind is:
(a) What if I can't live up to the new responsibility?(b) Will I make more at this position?(c) I wonder if the new work will be interesting.
2. You have a school-age daughter. On parents' night the teacher tells you that your
daughter is doing poorly and doesn't seem involved in the work. You are likely to:
(a) Talk it over with your daughter to understand further what the problem is.(b) Scold her and hope she does better.(c) Make sure she does the assignments, because she should be working harder.
3. You had a job interview several weeks ago. In the mail you received a form letter,
which states that the position has been filled. It is likely that you might think:
(a) It's not what you know, but who you know.(b) I'm probably not good enough for the job.(c) Somehow they didn't see my qualifications as matching their needs.
4. You are a plant supervisor and have been charged with the task of allotting coffee
breaks to three workers who cannot all break at once. You would likely handle this by:
(a) Telling the three workers the situation and having them work with you on the schedule.
(b) Simply assigning times that each can break to avoid any problems.(c) Find out from someone in authority what to do or do what was done in the past.
70
5. A close (same-sex) friend of yours has been moody lately, and a couple of times has become very angry with you over "nothing." You might:
(a) Share your observations with him/her and try to find out what is going on for him/her.
(b) Ignore it because there's not much you can do about it anyway.(c) Tell him/her that you're willing to spend time together if and only if he/she makes
more effort to control him/herself.
6. You have just received the results of a test you took, and you discovered that you did very poorly. Your initial reaction is likely to be:
(a) "I can't do anything right," and feel sad.(b) "I wonder how it is I did so poorly," and feel disappointed.(c) "That stupid test doesn't show anything," and feel angry.
7. You have been invited to a large party where you know very few people. As you look
forward to the evening, you would likely expect that:
(a) You'll try to fit in with whatever is happening in order to have a good time and not look bad.
(b) You'll find some people with whom you can relate.(c) You'll probably feel somewhat isolated and unnoticed.
8. You are asked to plan a picnic for yourself and your fellow employees. Your style for approaching this project could most likely be characterized as:
(a) Take charge: that is, you would make most of the major decisions yourself.(b) Follow precedent: you're not really up to the task so you'd do it the way it's been
done before.(c) Seek participation: get inputs from others who want to make them before you
make the final plans.
9. Recently a position opened up at your place of work that could have meant a promotion for you. However, a person you work with was offered the job rather than you. In evaluating the situation, you're likely to think:
(a) You didn't really expect the job; you frequently get passed over.(b) The other person probably "did the right things" politically to get the job.(c) You would probably take a look at factors in your own performance that led you
to be passed over.
71

10. You are embarking on a new career. The most important consideration is likely to be:
(a) Whether you can do the work without getting in over your head.(b) How interested you are in that kind of work.(c) Whether there are good possibilities for advancement.
11. A woman who works for you has generally done an adequate job. However, for the
past two weeks her work has not been up to par and she appears to be less actively interested in her work. Your reaction is likely to be:
(a) Tell her that her work is below what is expected and that she should start working harder.
(b) Ask her about the problem and let her know you are available to help work it out.(c) It's hard to know what to do to get her straightened out.
12. Your company has promoted you to a position in a city far from your present location. As you think about the move you would probably:
(a) Feel interested in the new challenge and a little nervous at the same time.(b) Feel excited about the higher status and salary that is involved.(c) Feel stressed and anxious about the upcoming changes.
72

2.2. Perceived Autonomy Support
This questionnaire contains items that are related to your experience with your instructor in XB. Instructors have different styles in dealing with students, and we would like to know more about how you have felt about your encounters with your instructor in other courses. Your responses are confidential. Please be honest and candid. Please use the following scale to rate your responses - 1 2 3 4 5 6 7 strongly neutral strongly disagree agree
1. I feel that my instructor provides me choices and options.
2. I feel understood by my instructor.
3. I am able to be open with my instructor during class.
4. My instructor conveyed confidence in my ability to do well in the course.
5. I feel that my instructor accepts me.
6. My instructor made sure I really understood the goals of the course and what I need to do.
7. My instructor encouraged me to ask questions.
8. I feel a lot of trust in my instructor.
9. My instructor answers my questions fully and carefully.
10. My instructor listens to how I would like to do things.
11. My instructor handles people's emotions very well.
12. I feel that my instructor cares about me as a person.
13. I don't feel very good about the way my instructor talks to me.
14. My instructor tries to understand how I see things before suggesting a new way to do things.
15. I feel able to share my feelings with my instructor.
73

2.3. Learning in XB
Please use the following scale to indicate how true each reason is for you:
1 2 3 4 5 6 7 not at all somewhat very true true true
1. I will participate actively in XB:
(a) Because I feel like its a good way to improve my understanding of the material.(b) Because others might think badly of me if I didn’t.(c) Because I would feel proud of myself if I did well in the course.(d) Because a solid understanding of the material is important to my intellectual
growth.
2. I am likely to follow my instructor’s suggestions for studying for XB:
(e) Because I would get a bad grade if I didn’t do what he/she suggests.(f) Because I am worried that I am not going to perform well in the course.(g) Because it’s easier to follow his/her suggestions than come up with my own study
strategies.(h) Because he/she seems to have insight about how best to learn the material.
3. The reason that I will work to expand my knowledge of the subject is:
(i) Because its interesting to learn more about the material of the course.(j) Because it’s a challenge to really understand how to solve the course problems.(k) Because a good grade in the course will look positive on my record.(l) Because I want others to see that I am intelligent.
74

2.4. Perceptions on Learning
Please respond to each of the following items in terms of how true it is for you with respect to your learning in XB. Use the scale:
1 2 3 4 5 6 7 not at all somewhat very true true true
1. I feel confident in my ability to learn the material of the course.2. I am capable of learning the material in this course.3. I am able to achieve my goals in this course.4. I feel able to meet the challenge of performing well in this course.
2.5. Interest /Enjoyment Measure in XB
For each of the following statements, please indicate how true it is for you using the following scale:
1 2 3 4 5 6 7 not at all somewhat very true true true
1. I enjoy doing XB very much. 2. XB is fun to do.3. I think XB is a boring course.4. XB does not hold my attention at all. 5. I would describe XB as very interesting.6. I think XB is quite enjoyable.7. While I am doing XB, I think about how much I enjoy it.
75

APPENDIX B.
PAPER-2 REFERENCE TABLES & FIGURES
76

Student ID Course Session Gender
PRE-314F07-1
314 Fall, 2007
M
PRE-314F07-2 F
PRE-314F07-3 M
PRE-314F07-4 M
PRE-314F07-5 M
PRE-314F07-6 F
POST-314F07-2 F
POST-314F07-4 M
POST-314F07-6 M
POST-314F07-8 F
POST-314F07-9 M
POST-314F07-10 M
POST-314F07-11 M
POST-314F07-12 M
PRE-313S08-1
313 Spring, 2008
F
PRE-313S08-2 M
PRE-313S08-3 F
POST-313S08-4 M
POST-313S08-5 M
PRE-314S08-1
314 Spring, 2008
M
POST-314S08-1 M
POST-314S08-3 M
POST-314S08-4 M
77
TABLE 1: Number of Males & Females in the course

78
FIGURE 1: Relation with Perceived Competence for Graduate Students

79
FIGURE 2: Relation with Autonomous Self-Regulation for Graduate Students

80
FIGURE 3: Relation with Interest/Enjoyment for Graduate Students

81
FIGURE 4: Relation with Grade Orientation for Graduate Students

82
FIGURE 5: Relation with Perceived Competence for Undergraduate Students

83
FIGURE 6: Relation with Autonomous Self-Regulation for Undergraduate Students

84
FIGURE 7: Relation with Interest/Enjoyment for Undergraduate Students
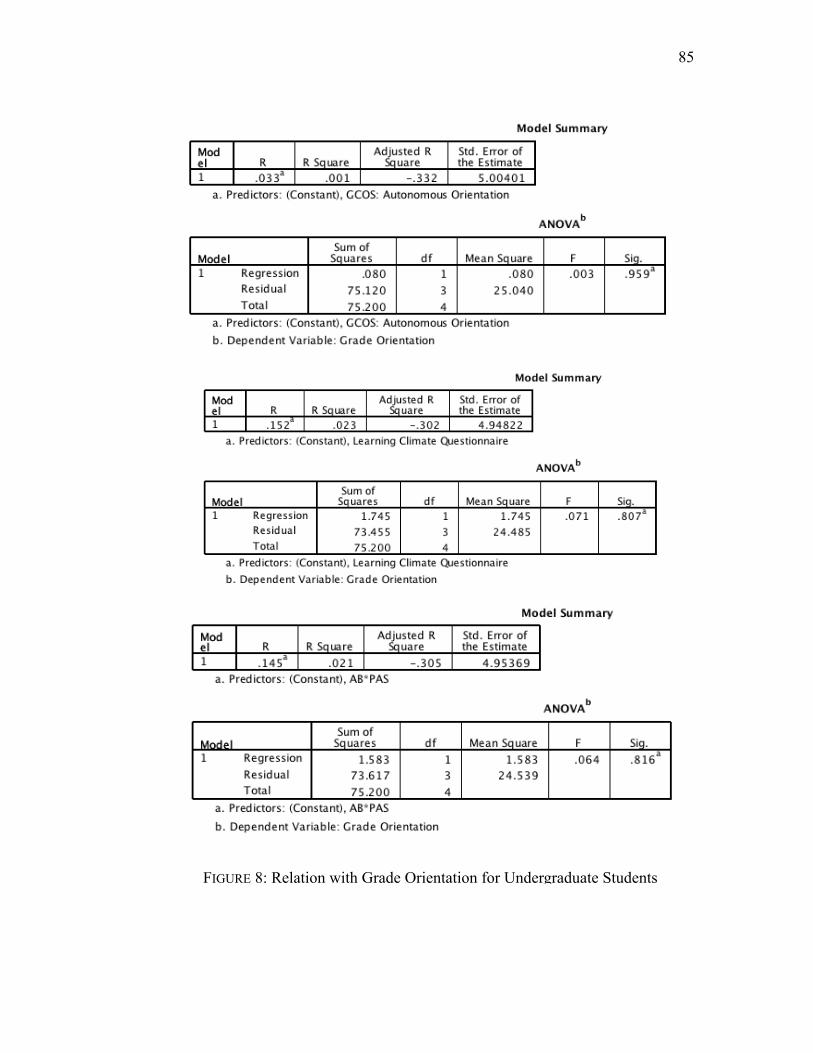
85
FIGURE 8: Relation with Grade Orientation for Undergraduate Students

86
FIGURE 9: Pre-Course Mean Comparison of Autonomous Behavior
FIGURE 10: Post-Course Mean Comparison of Autonomous Behavior

87
FIGURE 11: Post-Course Mean Comparison of Perceived Autonomy Support

88
FIGURE 12: Post-Course Mean Comparison

89
FIGURE 13: Relation Between Students’ Autonomous Behavior and Students’ Perceived Autonomy Support

90
FIGURE 14: Relation Between Students’ Perceived Autonomy Support and Students’ Performance in the Course

91
FIGURE 15: Relation Between Students’ Autonomous Behavior and Students’ Performance in the Course

92
FIGURE 16: Relation Between Students’ Autonomous Behavior & Perceived Competence

93
FIGURE 17: Relation Between Students’ Autonomous Behavior & Autonomous Self-Regulation

94
FIGURE 18: Relation Between Students’ Autonomous Behavior & Interest/Enjoyment

95
FIGURE 19: Relation Between Students’ Autonomous Behavior & Grade Orientation

96
FIGURE 20: Relation Between Perceived Autonomy Support & Perceived Competence

97
FIGURE 21: Relation Between Perceived Autonomy Support & Autonomous Self-Regulation

98
FIGURE 22: Relation Between Perceived Autonomy Support & Interest/Enjoyment

99
FIGURE 23: Relation Between Perceived Autonomy Support & Grade Orientation

No Question 314
(Graduate)313
(Undergraduate)
1 Provides choices and options 5.7 3.6
2 Feel understood by instructor 5.8 3.2
3 Able to open up with instructor 6.4 3
4 Instructor conveyed confidence 5.9 4.4
5 Instructor accepts me 5.7 5.6
6Instructor made sure that I understood the
goals 5.63 1.4
7 Instructor encouraged me to ask questions 6.3 6
8 I feel a lot of Trust in the instructor 5.6 3.2
9Instructor answers my questions fully and
carefully 5.2 4.2
10Instructor listens to how I would like to do
things 5.74 4.4
11Instructor handles people’s emotions very
well 5.6 3.8
12 Instructor cares about me as a person 5.8 4.2
13I don’t feel very good about the way my
instructor talks to me 2.4 3
14My instructor tries to understand how I see things before suggestion a new way to do
things.4.6 4.4
15I feel able to share my feelings with my
instructor 6.2 3.4
100
TABLE 2: Responses to Learning Climate Questionnaire

VITA
Raj Kanwar Singh was born in Chandigarh, India on September 11, 1983. He
completed his Bachelor of Technology in Mechanical Engineering at Punjab Technical
University in Punjab, India in May 2006. Raj started his Master of Science program with
the Engineering Management Department at Missouri University of Science &
Technology in August, 2006. While a graduate student with the Engineering Management
department, Raj served as the President of Graduate Student Body (Council of Graduate
Students) of Missouri S&T and had an opportunity to co-op with Monsanto Company in
St. Louis. Raj is proud to be a part of the Tau Beta Pi and the Engineering Management
Society at Missouri University of Science & Technology.
With a penchant in Organizational Behavior and Group Dynamics, Raj worked
under Dr. Ray Luechtefeld to write two papers, studying the learning behaviors of
students in a class environment. He received his Master of Science Degree in December
of 2008.
101

102