appraisal of real property - genesis land development
TRANSCRIPT

APPRAISAL OF REAL PROPERTY
Northeast Partnership Lands
SE; 19; 25; 28; W4M
NE, NW, SE; 18; 25; 28; W4M
Rocky View County, AB
IN A FULL NARRATIVE APPRAISAL REPORT
As of December 31, 2015
Prepared For:
Mr. Mark Scott
Genesis Land Development Corp.
7315 – 8 Street NE
Calgary, AB T2E 8A2
Prepared By:
Cushman & Wakefield Ltd.
Valuation & Advisory
111 – 5th Avenue SW, Suite 1730
Calgary, AB T2P 3Y6
C&W File ID: 15-213-00264.2
CONFIDENTIAL

CUSHMAN & WAKEFIELD LTD.
VALUATION & ADVISORY
111 – 5TH AVENUE SW, SUITE 1730
CALGARY, AB T2P 3Y6
Vacant Land
SE; 19; 25; 28; W4M & NE, NW, SE; 18; 25; 28; W4M
Rocky View County, AB

Cushman & Wakefield Ltd. Suncor Energy Centre
111 – 5th Avenue SW, Suite 1730
Calgary, AB T2P 3Y6
(403) 261 1147 Tel
(403) 261 1104 Fax
www.cushmanwakefield.com
December 22, 2015
Mr. Mark Scott
Genesis Land Development Corp.
7315 – 8 Street NE
Calgary, Alberta T2E 8A2
Re: SE; 19; 25; 28; W4M
SE, NE, NW; 18; 25; 28 W4M, Rocky View County, Alberta
C&W File ID: 15-213-900264.2
Dear Mr. Scott:
Cushman & Wakefield Ltd. is pleased to transmit this Narrative Appraisal Report, estimating the current market
value of the above referenced subject property.
By agreement, this is a Narrative Appraisal Report, which contains all of the data, reasoning and analysis upon
which our value conclusion is based. This document has been prepared in accordance with the Canadian Uniform
Standards of Professional Appraisal Practice (The Standards) as adopted by the Appraisal Institute of Canada.
The purpose of this appraisal is to provide an estimate of the current market value for the subject land. It is our
understanding that the intended use of the appraisal is for internal decision making and distribution to Limited
Partners. This report may not be reproduced, in whole or in part, without our prior written agreement. It is subject
to the Assumptions and Limiting Conditions contained in the Addenda, in addition to any in the report.
As a result of our analysis, the current market value of the land, subject to the assumptions, limiting conditions,
certifications and definitions contained herein at December 31, 2015, is estimated as follows:
TWENTY MILLION ONE HUNDRED FORTY THOUSAND DOLLARS
$20,140,000
This estimate of market value is based on an exposure time of six to twelve months.
MR. MARK SCOTT
GENESIS LAND DEVELOPMENT CORP
DECEMBER 22, 2015
PAGE 2
CUSHMAN & WAKEFIELD LTD.
The economy of Alberta is dominated by the oil and gas sectors, and the performance of real estate in many
markets across the province is directly and substantially linked to the health of these two resource-based
industries. Over the past 6 months, the price of oil has declined by approximately 45%, and there is concern
across the oil-producing communities as to the future direction and well-being of the oil industry in North America
generally, and in Alberta in particular. Cushman & Wakefield is unable to determine the long-term price of oil or its
impact on the future of the sector in Alberta, but caution the reader that any prolonged period of low oil prices
could have a negative impact on real estate, demand in the province and a possible material impact on the
subject valuation.
Respectfully submitted,
CUSHMAN & WAKEFIELD LTD.
Sheena Kereliuk, B.Comm, PGCV.
Consultant
Phone Office Direct 403.261.1129
Fax 403.261.1104
David Y.T. Shum, AACI, P.App.
Managing Director, Western Canada
Phone Office Direct 403.261.1147
Fax 403.261.1104
NORTHEAST PARTNERSHIP LANDS, ROCKY VIEW COUNTY, AB EXECUTIVE SUMMARY I
Legal Description Size (acres)
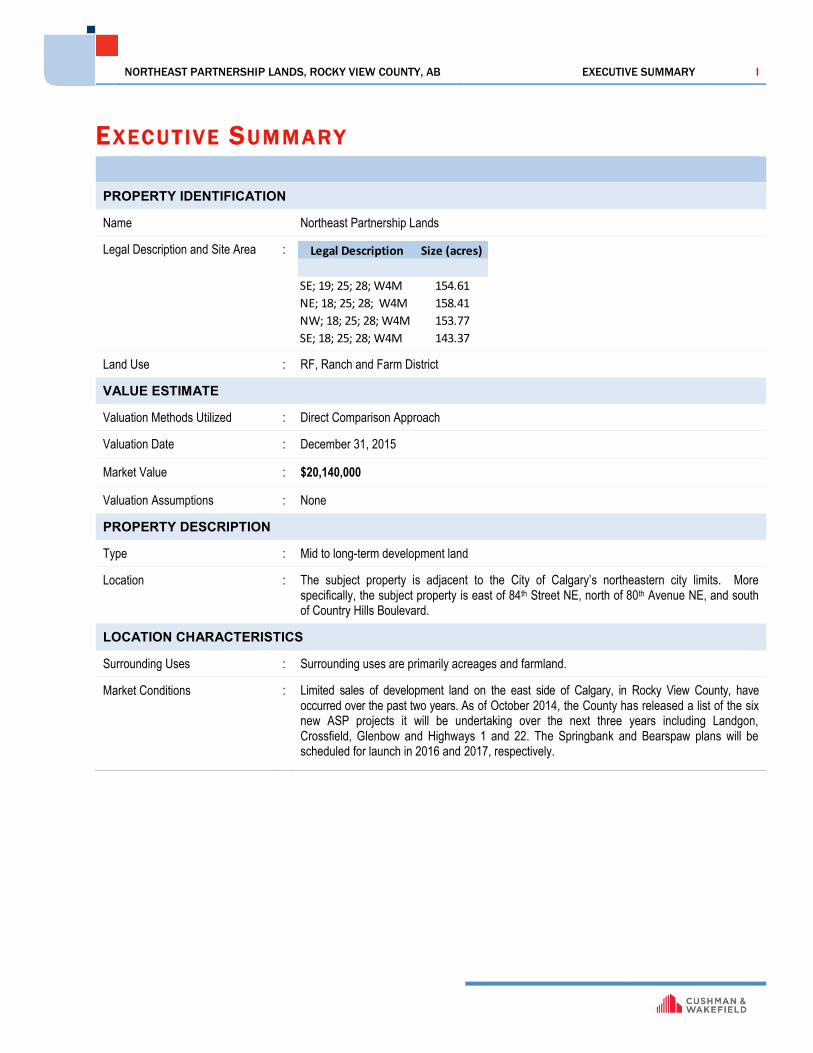
SE; 19; 25; 28; W4M 154.61
NE; 18; 25; 28; W4M 158.41
NW; 18; 25; 28; W4M 153.77
SE; 18; 25; 28; W4M 143.37
EXEC U T IV E SU M M ARY
PROPERTY IDENTIFICATION
Name Northeast Partnership Lands
Legal Description and Site Area :
Land Use : RF, Ranch and Farm District
VALUE ESTIMATE
Valuation Methods Utilized : Direct Comparison Approach
Valuation Date : December 31, 2015
Market Value : $20,140,000
Valuation Assumptions : None
PROPERTY DESCRIPTION
Type : Mid to long-term development land
Location : The subject property is adjacent to the City of Calgary’s northeastern city limits. More specifically, the subject property is east of 84th Street NE, north of 80th Avenue NE, and south of Country Hills Boulevard.
LOCATION CHARACTERISTICS
Surrounding Uses : Surrounding uses are primarily acreages and farmland.
Market Conditions : Limited sales of development land on the east side of Calgary, in Rocky View County, have occurred over the past two years. As of October 2014, the County has released a list of the six new ASP projects it will be undertaking over the next three years including Landgon, Crossfield, Glenbow and Highways 1 and 22. The Springbank and Bearspaw plans will be scheduled for launch in 2016 and 2017, respectively.

NORTHEAST PARTNERSHIP LANDS, ROCKY VIEW COUNTY, AB TABLE OF CONTENTS
TAB LE O F CON TENTS INTRODUCTION ------------------------------------------------------------------------------------------------------------------------------------------------- 1
PROPERTY DETAILS ----------------------------------------------------------------------------------------------------------------------------------------- 4
MARKET ANALYSIS ---------------------------------------------------------------------------------------------------------------------------------------- 10
VALUATION AND FINANCIAL ANALYSIS ------------------------------------------------------------------------------------------------------- 32
FINAL VALUE ESTIMATE -------------------------------------------------------------------------------------------------------------------------------- 41
ADDENDA CONTENTS ------------------------------------------------------------------------------------------------------------------------------------ 42
ASSUMPTIONS AND LIMITING CONDITIONS ----------------------------------------------------------------------------------------------- 43
GLOSSARY OF TERMS AND DEFINITIONS --------------------------------------------------------------------------------------------------- 46
CERTIFICATION OF APPRAISAL -------------------------------------------------------------------------------------------------------------------- 48

NORTHEAST PARTNERSHIP LANDS, ROCKY VIEW COUNTY, AB INTRODUCTION 1
Legal Size Assessment
Description (acres) 2012
SE; 19; 25; 28; W4M 154.61 38,110$
NE; 18; 25; 28; W4M 158.41 43,310$
NW; 18; 25; 28; W4M 153.77 36,750$
SE; 18; 25; 28; W4M 143.37 37,430$
Total 610.16 155,600$
INTRO D U C T IO N
P U R P O S E A N D I N T E N D E D U S E O F T H I S A P P R A I S A L
The purpose of this appraisal is to estimate the current market value of the subject property. It is our
understanding that the intended use of the appraisal is for internal decision making and distribution to Limited
Partners. This report may only be relied upon by Genesis Land Development Corp.
P R O P E R T Y I D E N T I F I C A T I O N
The subject property is legally described as follows:
A S S U M P T I O N S A N D L I M I T I N G C O N D I T I O N S
The report is subject to the Assumptions and Limiting Conditions contained in the Addenda, in addition to specific
assumptions which may be stated in the body of the report.
E X T R A O R D I N A R Y A S S U M P T I O N S
No Extraordinary Assumptions or Hypothetical Conditions have been employed.
P R O P E R T Y O W N E R S H I P
Based on title nos. 051335796, 071211529002, 071211529003 and 071211529004. The subject has been owned
by Genesis Land Development Corporation since May 2007. There have been no transfers of the subject property
in the three years preceding this valuation.
E F F E C T I V E D A T E O F A P P R A I S A L
The effective date of the appraisal is December 31, 2015.
P R O P E R T Y R I G H T S A P P R A I S E D
The legal interest appraised is the fee simple estate - defined as absolute ownership unencumbered by any other
interest or estate, subject only to the limitations imposed by the governmental powers of taxation, eminent
domain, police power and escheat.

NORTHEAST PARTNERSHIP LANDS, ROCKY VIEW COUNTY, AB INTRODUCTION 2
S C O P E O F T H E A P P R A I S A L
In forming our opinion as to the market value of the subject as of the valuation date, we have relied on information
which is detailed in this report, to the extent deemed appropriate, and carried out the following specific functions:
Made an inspection of the property that is the subject of this report before December 31, 2015;
Considered information with respect to sales and listings, at or about the valuation date, of properties
considered similar to the subject, where we have significant knowledge of such sales and listings and to
assess them as being relevant to our opinion, as set out herein. While we believe our review to be
reasonably complete, we cannot warrant that we have:
i) uncovered and assessed every real property transaction at or about the valuation date that might be
said to bear on the determination of the market value of the subject, or
ii) fully discerned the motives behind the sales, listings and lease information considered in our
analysis, such that our weighting of said information is without subjectivity;
Reviewed land use regulations, in particular the Land Use By-Law, applicable to the subject;
Examined the possibility of making any significant changes to the subject in terms of existing uses, land
severance and/or additional development of the site;
Ascertained the highest and best use of the property;
Examined market conditions and analyzed their potential effect on the property; and
Conducted discussions with market participants regarding the property.
D E F I N I T I O N O F M A R K E T V A L U E
The Canadian Uniform Standards of Professional Appraisal Practice (The Standards) adopted by the Appraisal
Institute of Canada define Market Value as:
The most probable price which a property should bring in a competitive and open market
under all conditions requisite to a fair sale, the buyer and seller each acting prudently and
knowledgeably, and assuming the price is not affected by undue stimulus.
Implicit in this definition is the consummation of a sale as of a specified date and the passing of title from seller to
buyer under conditions whereby:
Buyer and seller are typically motivated;
Both parties are well informed or well advised and acting in their own best interests;
A reasonable time is allowed for exposure in the market;
Payment is made in cash in Canadian dollars or in terms of financial arrangements comparable thereto;
and
The price represents the normal consideration for the property sold, unaffected by special or creative
financing or sales concessions granted by anyone associated with the sale.
NORTHEAST PARTNERSHIP LANDS, ROCKY VIEW COUNTY, AB INTRODUCTION 3
R E A S O N A B L E E X P O S U R E T I M E
Exposure time is always presumed to precede the effective date of the appraisal. It may be defined as:
The estimated length of time the property interest being appraised would have been
offered on the market prior to the hypothetical consummation of a sale at market value on
the effective date of the appraisal. It is a retrospective estimate based upon an analysis of
past events assuming a competitive and open market.
Based on discussions with various investors and real estate brokers familiar with assets such as the subject, and
based on an analysis of comparable sales utilized in this valuation and an analysis of current listings, it is our
estimate that the subject would require a six to twelve month exposure period.

NORTHEAST PARTNERSHIP LANDS, ROCKY VIEW COUNTY, AB PROPERTY DETAILS 4
PRO P ERTY DET A ILS
N E I G H B O R H O O D A N A L Y S I S
LOCATION
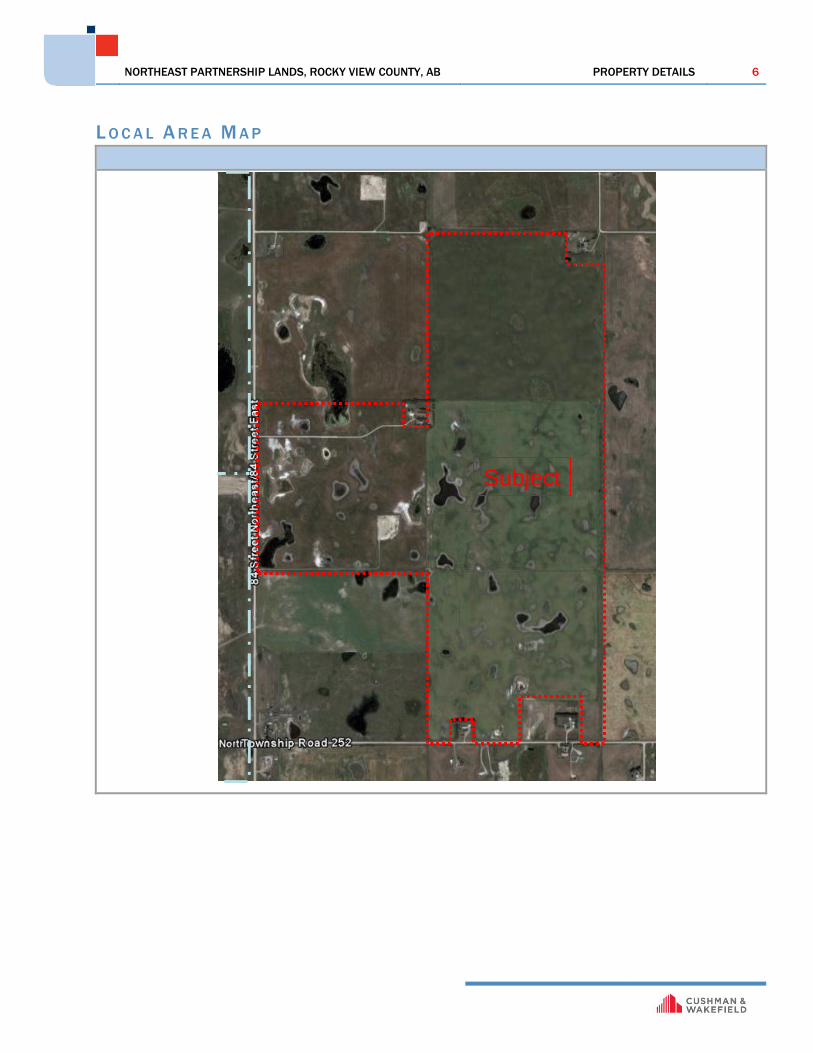
The subject property is adjacent to the city of Calgary’s northeastern city limits. Generally, the subject property is east of 84th Street NE, north of 80th Avenue NE, and south of Country Hills Boulevard.
TRANSPORTATION SYSTEMS (BUS, RAPID RAIL, ETC.)
This area is not serviced by the bus system.
TRAFFIC (TRAFFIC COUNTS, IF PERTINENT)
None
PLANNED CHANGES IN ROAD NETWORK
None
NEARBY AND ADJACENT USES
The subject’s local area is primarily composed of ranch and farmland, as well as acreages.
LOCAL AREA CHARACTERISTICS
Area has historically been used for agricultural purposes.
The subject property is in the Rocky View County/City of Calgary Inter-Municipal Development Plan Policy Area and is identified as a Residual Long-Term Growth Area. As per the Plan, these areas should be planned comprehensively through an Area Structure Plan and/or Regional Context Study with adjacent lands within Rocky View County.
LAND USE CHANGES
No land use changes are anticipated in the near future.

NORTHEAST PARTNERSHIP LANDS, ROCKY VIEW COUNTY, AB PROPERTY DETAILS 5
SubjectSubject
R E G I O N A L M A P
NORTHEAST PARTNERSHIP LANDS, ROCKY VIEW COUNTY, AB PROPERTY DETAILS 6
SubjectFuture
TUCSubject
Future
TUC
L O C A L A R E A M A P

NORTHEAST PARTNERSHIP LANDS, ROCKY VIEW COUNTY, AB PROPERTY DETAILS 7
S I T E D E S C R I P T I O N
SITE PLAN

NORTHEAST PARTNERSHIP LANDS, ROCKY VIEW COUNTY, AB PROPERTY DETAILS 8
Legal Description Size (acres)
SE; 19; 25; 28; W4M 154.61
NE; 18; 25; 28; W4M 158.41
NW; 18; 25; 28; W4M 153.77
SE; 18; 25; 28; W4M 143.37
Lot Details : Shape – Square, Quarter sections
Total Area :
Easements and/or Rights of Way : There are several instruments registered on the subject title and are
assumed not to have any impact on the marketability of the subject site.
For greater certainty, a legal opinion should be obtained.
Topography : The sites are mainly level with gentle undulations and are at grade with
adjacent properties and roadways.
Access : The site is currently accessed off of 84th Street Northeast and 80th
Avenue NE.
Sub Soil : No soil analysis has been made in conjunction with this report. Soil
bearing and drainage qualities are assumed to be adequate for the
residential development.
Municipal Services : Limited servicing is available to the subject property.
Environmental Matters : Cushman & Wakefield Ltd. has no expertise or responsibility regarding
environmental matters. A phase one environmental study has been
reportedly completed with no known issues. A copy of the environmental
report was not provided to the author of this report.

NORTHEAST PARTNERSHIP LANDS, ROCKY VIEW COUNTY, AB PROPERTY DETAILS 9
L A N D U S E B Y L A W
According to the current Land Use Bylaw, the subject property is classified as RF, Ranch and Farm District. The
purpose and intent of this district is to provide for agricultural activities as the primary land use on a quarter
section of land or on a large balance land from previous subdivisions. Permitted uses include accessory
buildings, general agriculture, accessory dwelling to agriculture uses, and home based business. Discretionary
uses include a variety of small businesses. The minimum parcel size is 160.0 acres or the area in title at the time
of passage of the bylaw.
A S S E S S M E N T
According to our investigations, the subject’s 2015 assessment is summarized as follows:
The assessment appears low considering our estimate of value contained herein, as the assessment is based on
the agricultural land value and does not consider the development potential.
NORTHEAST PARTNERSHIP LANDS, ROCKY VIEW COUNTY, AB MARKET ANALYSIS 10
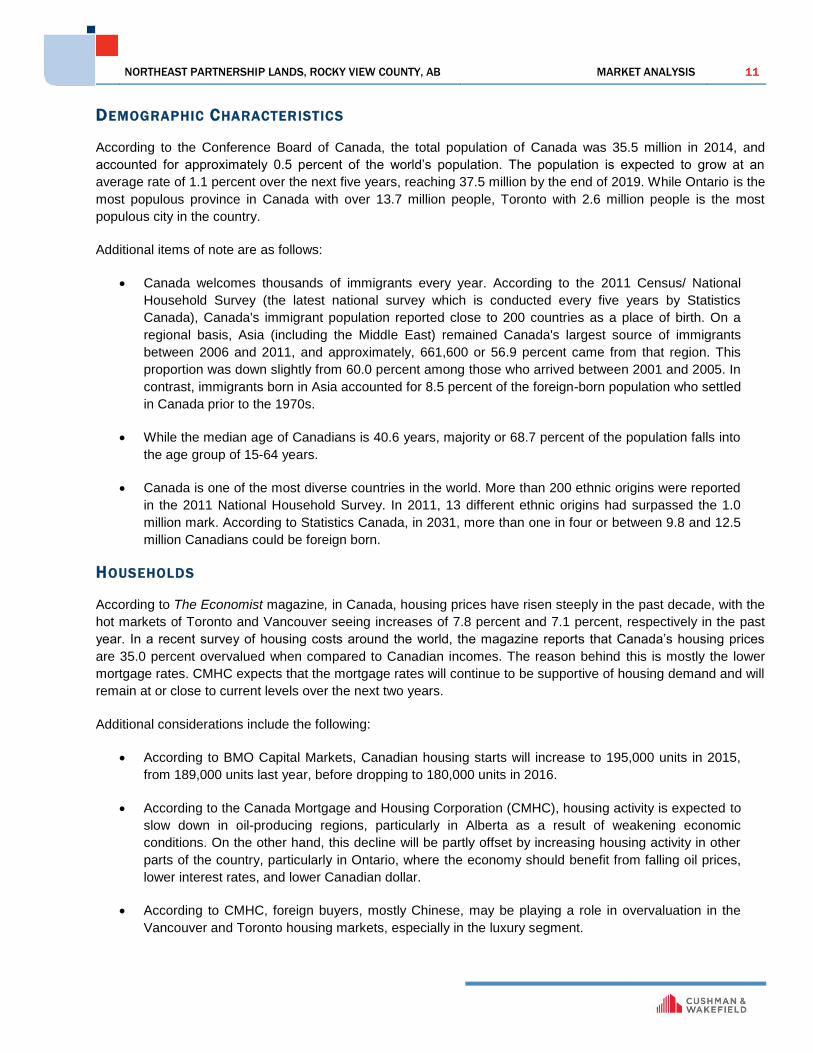
2015fY/Y
Change
GDP Grow th 1.20%
Unemployment Rate 6.90%
Employment Grow th 0.90%
Retail Sales Grow th 2.30%
Housing Starts (000’s) 195
CANADA
Economic Indicators
Q3 2015
Source: BM O Capital M arkets, TD Economics
MARK ET ANALYS IS
C A N A D A - E C O N O M I C O V E R V I E W
Geographically, Canada is the second largest country in the world at
almost 10.0 million km2 (or 3.9 million square miles), and has the longest
coastline and longest border with another country, the United States
(U.S.). The Canadian economy is the eighth largest in the world.
Known to be rich in natural resources, Canada has vast stores of iron ore,
nickel, zinc, copper, gold, lead, diamonds, silver, coal, petroleum, natural gas, and is a leading producer of
hydropower. Notably, with 180.0 billion barrels of proven oil reserves, Canada has the second largest reserve in
the world, next to Saudi Arabia.
CURRENT TRENDS
According to TD Economics, Canada fell into a mild technical recession
during the first half of 2015, as low oil prices dragged down investment, and
witnessed back-to-back contractions in economic activity of negative 0.8
percent and negative 0.5 percent at annual rates in the first and second
quarters, respectively. The Canadian dollar is still flat or underperforming
against most of its key currency counterparts, and was trading at U.S. $0.75
in early-November, 2015. In addition to the declining Canadian dollar,
slower Chinese economic activity also negatively affects crude oil prices as
China is a major driver of global prices. If Chinese growth surprises to the
downside, commodity prices would surely fall further. In addition, demand
for Canadian exports could suffer, as some of Canada’s trading partners
feel the effects of weaker Chinese growth.
The Canadian federal election was held on October 19, 2015, allowing the Liberal Party, led by Justin Trudeau, to
form a new majority government. With this change in the country, Canada is set to head in a new economic
direction. The new Prime Minister plans to spend an additional $5.0 billion annually to upgrade key infrastructure
in Canada such as transportation systems. While the increased spending will be worth an extra 0.2 to 0.3
percentage points in economic growth in the next two years, it will likely pose a drag on growth once it is
withdrawn.
Additional details regarding Canada are as follows:
According to the Conference Board of Canada, soft employment growth, fairly weak wage gains, and
high levels of household debt will combine to take some of the steam out of real consumer spending -
despite big savings at the gas pump and federal tax cuts. TD Economics expects that retail trade will
slow to 2.3 percent in 2015 from 4.6 percent last year. However, it will pick up in 2016 at 3.4 percent.
According to the Conference Board of Canada, business investment will be the weakest part of the
economy in 2015, held back by large cutbacks in the energy sector. Oil firms responded to the
dramatic decline in oil prices by slashing engineering projects and mineral exploration by 15.0
percent in the first quarter alone. For 2015 and 2016 as a whole, it is expected that oil and gas firms
will chop their capital budgets by almost one-third. Even outside the energy sector, firms have been
hesitant to invest. Purchases of machinery and equipment investment suffered a substantial decline
in the first quarter, and these declines are likely to continue throughout the year. Building construction
is also expected to see substantial declines through 2015.
NORTHEAST PARTNERSHIP LANDS, ROCKY VIEW COUNTY, AB MARKET ANALYSIS 11
DEMOGRAPHIC CHARACTERISTICS
According to the Conference Board of Canada, the total population of Canada was 35.5 million in 2014, and
accounted for approximately 0.5 percent of the world’s population. The population is expected to grow at an
average rate of 1.1 percent over the next five years, reaching 37.5 million by the end of 2019. While Ontario is the
most populous province in Canada with over 13.7 million people, Toronto with 2.6 million people is the most
populous city in the country.
Additional items of note are as follows:
Canada welcomes thousands of immigrants every year. According to the 2011 Census/ National
Household Survey (the latest national survey which is conducted every five years by Statistics
Canada), Canada's immigrant population reported close to 200 countries as a place of birth. On a
regional basis, Asia (including the Middle East) remained Canada's largest source of immigrants
between 2006 and 2011, and approximately, 661,600 or 56.9 percent came from that region. This
proportion was down slightly from 60.0 percent among those who arrived between 2001 and 2005. In
contrast, immigrants born in Asia accounted for 8.5 percent of the foreign-born population who settled
in Canada prior to the 1970s.
While the median age of Canadians is 40.6 years, majority or 68.7 percent of the population falls into
the age group of 15-64 years.
Canada is one of the most diverse countries in the world. More than 200 ethnic origins were reported
in the 2011 National Household Survey. In 2011, 13 different ethnic origins had surpassed the 1.0
million mark. According to Statistics Canada, in 2031, more than one in four or between 9.8 and 12.5
million Canadians could be foreign born.
HOUSEHOLDS
According to The Economist magazine, in Canada, housing prices have risen steeply in the past decade, with the
hot markets of Toronto and Vancouver seeing increases of 7.8 percent and 7.1 percent, respectively in the past
year. In a recent survey of housing costs around the world, the magazine reports that Canada’s housing prices
are 35.0 percent overvalued when compared to Canadian incomes. The reason behind this is mostly the lower
mortgage rates. CMHC expects that the mortgage rates will continue to be supportive of housing demand and will
remain at or close to current levels over the next two years.
Additional considerations include the following:
According to BMO Capital Markets, Canadian housing starts will increase to 195,000 units in 2015,
from 189,000 units last year, before dropping to 180,000 units in 2016.
According to the Canada Mortgage and Housing Corporation (CMHC), housing activity is expected to
slow down in oil-producing regions, particularly in Alberta as a result of weakening economic
conditions. On the other hand, this decline will be partly offset by increasing housing activity in other
parts of the country, particularly in Ontario, where the economy should benefit from falling oil prices,
lower interest rates, and lower Canadian dollar.
According to CMHC, foreign buyers, mostly Chinese, may be playing a role in overvaluation in the
Vancouver and Toronto housing markets, especially in the luxury segment.

NORTHEAST PARTNERSHIP LANDS, ROCKY VIEW COUNTY, AB MARKET ANALYSIS 12
The following graph presents historical and projected activity of housing starts in Canada:
GROSS DOMESTIC PRODUCT (GDP)
Canada is one of the largest exporters of automobile equipment and goods due to its position within NAFTA.
Leading equipment manufacturers and global automakers operate in Canada, among which include General
Motors, Toyota, and Ford. Leading bus and track manufacturers have also located in Canada, including Volvo
Bus, Motor Coach Industries, and Hino. In addition, a number of large original equipment suppliers operate in the
country, including Johnson Controls, Aisin Seiki, and Continental.
Additional items of note are as follows:
BMO Capital Markets expects that real GDP growth for Canada will slow to 1.2 percent in 2015 - half
the rate posted last year, before improving by 2.1 percent in the following year.
The anticipated real GDP growth in Canada in 2015 is primarily due to a pickup in exports thanks to
strong economic growth in the U.S. and a weaker Canadian dollar.
The recent slide in crude oil prices is likely to drive a sizeable near-term wedge in economic
performances between the three major oil-producing provinces and other regions. According to the
Conference Board of Canada, the sharp drop in oil prices will cost producers more than US$40.0
billion in lost revenue, resulting in a substantial decline in business investment that will ripple through
the economy.
The following graph presents further details of historical and projected GDP activity:

NORTHEAST PARTNERSHIP LANDS, ROCKY VIEW COUNTY, AB MARKET ANALYSIS 13
EMPLOYMENT AND UNEMPLOYMENT
Almost five years after the global recession, the global economic environment still remains fragile. However,
despite the challenging external environment, the Canadian economy and labour market have been strong.
Canada has experienced solid job creation performance since the beginning of the recovery, with over 1.0 million
more Canadians working today than in July 2009, an increase of 6.3 percent, according to Service Canada.
Canada has outperformed all other G-7 economies in job creation over this period.
Additional items of note are as follows:
According to BMO Capital Markets, Canadian employment grew at 0.6 percent in 2014, and will
improve slightly at 0.9 percent in both 2015 and 2016. The unemployment rate will remain unchanged
this year and next at 6.9 percent.
According to Statistics Canada, Canada’s employment was up by 44,400 net positions in October
2015, largely due to a surge in temporary public-administration work generated by this year’s federal
election. This increase pushed October’s unemployment rate down one tenth of a percentage point to
7.0 percent. The employment increase was seen across all provinces.
The following graph represents yearly historical and projected employment and unemployment rates for Canada:
RETAIL SALES
The retail sector plays a key role in bridging production and consumption, and as a result, the sector has
significant direct and indirect effects on the Canadian economy. According to TD Economics, Canadian retail
sales are expected to record a growth rate of 2.3 percent for 2015, down from 4.6 percent last year. Slow
economic growth in Canada in 2015, may be a significant factor for the decrease in retail sales this year. In
addition, the falling Canadian dollar, may raise consumer prices, especially for imports, and push down the GDP
growth. The rate will pick up in 2016 at 3.4 percent.
Additional details regarding retail trade in Canada are as below:
According to the Royal Bank of Canada (RBC), Canadian retail sales rose by 0.5 percent in August
2015, which was stronger than market expectations for a 0.1 percent increase, following a revised 0.6
percent (was 0.5 percent) increase in July and 0.4 percent gain in June.

NORTHEAST PARTNERSHIP LANDS, ROCKY VIEW COUNTY, AB MARKET ANALYSIS 14
While some major retailers closed doors over the past few years (Zellers, Target, Future Shop, and
Jacob), at least six other retailers (Sears Canada, Reitmans, Chapters Indigo, Aeropostale Canada,
Best Buy Canada, and Le Chateau) are at risk of disappearing from Canada in the medium term.
The following graph represents yearly historical and projected retail sales rates for Canada:
CONCLUSION
The Canadian economy experienced a mild recession through the first half of 2015 as a drop in oil prices led to a
substantial decline in business capital investment. The good news is that real GDP showed solid increases in
both June and July as the economy began to bounce back. Stronger growth forecast for the U.S. economy, which
is set to recover in the fourth quarter this year after a weak 1.5 percent growth in the third quarter, combined with
a weaker Canadian dollar, should have favorable effects on the Canadian economy. If the Canadian dollar
continues to fall, it may raise the prices for Canadian imports in sectors with high levels of trade integration, such
as auto and aircraft parts manufacturing. The import costs may exceed the profits from exports, and will limit the
anticipated benefits from the lower Canadian dollar; however, low oil prices may reduce manufacturing costs.
Final thoughts:
According to the CMHC, other than a modest amount of overvaluation at the national level, housing
market conditions are expected to remain balanced and broadly in line with key indicators such as
employment, personal disposable income, mortgage rates, and population growth, over the near
term.
According to TD Economics, the three oil-producing provinces are forecast to be in recession this
year as the impact from low oil prices resonates across these economies. Crude oil prices are
expected to begin a recovery next year. As such, Alberta and Saskatchewan are expected to record
only modest expansions over the next two years. In Newfoundland and Labrador, real GDP is
expected to contract further next year before stabilizing in 2017. Across all other regions, the medium
term outlook can be characterized as continued moderate and steady growth. British Columbia,
Ontario and Manitoba are projected to top the growth charts.
NORTHEAST PARTNERSHIP LANDS, ROCKY VIEW COUNTY, AB MARKET ANALYSIS 15
A L B E R T A – E C O N O M I C O V E R V I E W
THE ALBERTA ECONOMY
Alberta is known as Canada's "energy province”, with more than 80.0 percent of the
country's reserves of conventional crude oil, over 90.0 percent of its natural gas, and
all of its bitumen and oil-sands reserves. Furthermore, Alberta is the world’s second
largest exporter of natural gas, and the fourth largest producer. Not surprisingly,
Alberta's energy sector represents more than a quarter of the province's GDP proportionally, the largest of any of
the economic sectors. In addition to energy, Alberta has capitalized on its strengths in agriculture, forestry, and
industrial products to develop a dynamic and diverse economy.
Additional items of note regarding Alberta are as follows:
In 2014, Alberta’s economic diversity was driven by the energy sector at 25.5 percent of GDP,
followed by the finance and real estate sector at 13.5 percent, and the construction sector at 10.8
percent.
Alberta’s proximity to the western United States (U.S.) provides easy access to an overall market of
64.0 million people. This includes the ten states westbound from Colorado to the Pacific Coast. With
a fast growing economy in the U.S., Alberta may enjoy positive demand for its exports in 2015 and
2016.
A stable economy, low taxes, natural resources, and beautiful landscapes make Alberta a great place to do
business, live, and work. According to Canada’s Best Places to Live 2014, the top three cities were from Alberta,
namely: St. Albert, Calgary, and Strathcona County. In addition, St. Albert was ranked the best place to live in
Canada on MoneySense Magazine’s 2014 annual review, with Calgary in second place.
OVER ALL TRENDS
Alberta led all provinces in economic growth over the past twenty-one
years with an average GDP growth rate of 3.5 percent per year. The key
influencing factors, particularly in 2014, were: surging population growth
and a weaker Canadian dollar. Economic activity in Alberta is projected to
slow down significantly in 2015, and contract by 0.6 percent as the impact
of a low oil price environment ripples through the economy. Next year, a
moderate bounce back in crude oil prices is expected, and as a result, the
economy will expand by 1.9 percent.
According to Statistics Canada, employment was little changed in Alberta
in June 2015, and the unemployment rate was 5.7 percent. On a year-over-
year basis, the unemployment rate in the province increased by 0.9
percentage points and employment grew by 1.0 percent, with virtually no
growth in the first six months of 2015.
Additional details regarding the area are as follows:
Thousands of Albertans lost their jobs in the first six months of
2015. The cuts were deepest in the energy sector, as oil
producers, drilling contractors, and service companies reacted to
the sharp decline in oil prices that started last fall.
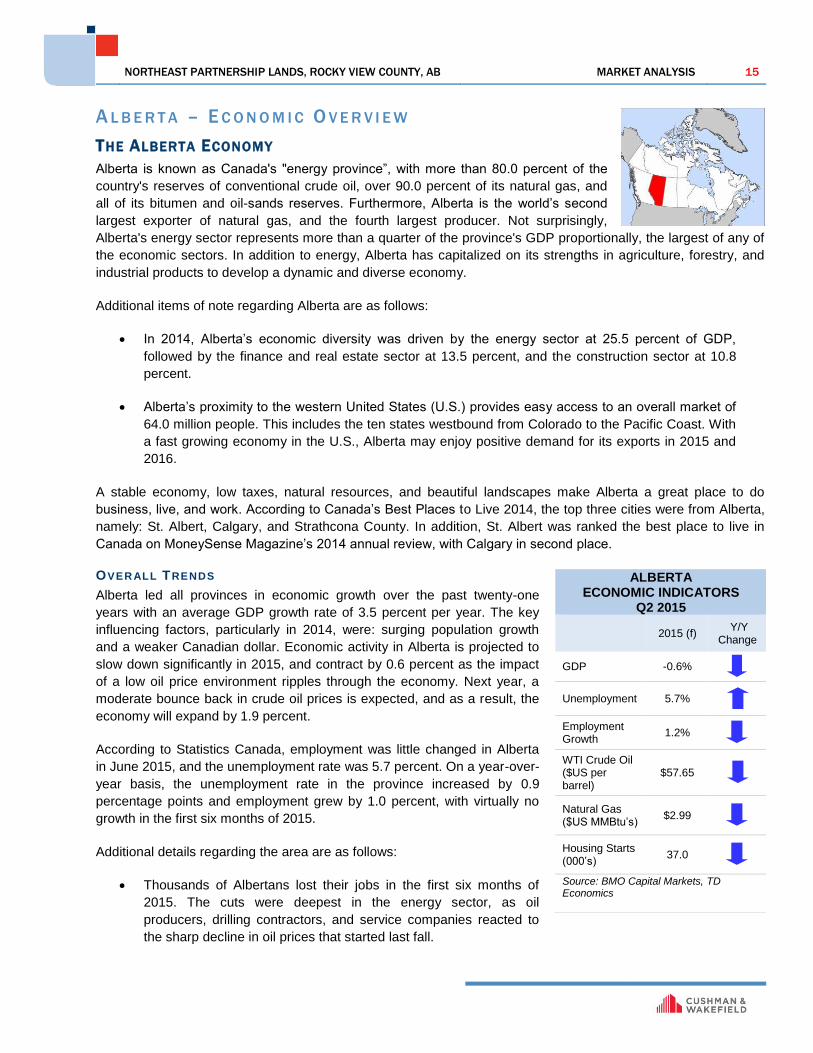
ALBERTA ECONOMIC INDICATORS
Q2 2015
2015 (f) Y/Y
Change
GDP -0.6%
Unemployment 5.7%
Employment Growth
1.2%
WTI Crude Oil ($US per barrel)
$57.65
Natural Gas ($US MMBtu’s)
$2.99
Housing Starts (000’s)
37.0
Source: BMO Capital Markets, TD Economics

NORTHEAST PARTNERSHIP LANDS, ROCKY VIEW COUNTY, AB MARKET ANALYSIS 16
According to the Canadian Association of Petroleum Producers, the total capital investment this year
in the oil and natural gas industry will be $45.0 billion, down nearly 40.0 percent from $73.0 billion in
2014. In the oil sands, capital investment is expected to be $23.0 billion this year, down from $33.0
billion in 2014.
Suncor Energy, one of the major oil producers in Alberta, announced in January 2015 that it plans to
shed 1,000 employees this year. In addition, in June, TransCanada Corp. laid off 185 people, the
majority of which were Calgary-based. However, the job losses do not tell the whole story, as
employment in Alberta actually grew by 38,000 positions between May 2014 and May 2015,
according to Statistics Canada.
DEMOGR APHIC CH AR AC TERISTICS
According to the Conference Board of Canada Spring 2015 update, Alberta’s population was 4.1 million in 2014,
a 2.9 percent increase on a year-over-year basis, the highest provincial rate of increase, and it was much higher
than the Canadian growth rate of 1.1 percent. Further, Alberta’s population gain of 114,493 in 2014 is the second
largest increase on record. Between 2004 and 2014, Alberta’s population increased by 27.0 percent, the highest
increase of any province or state in North America. The population in Alberta will continue to grow, however, at a
declining rate over the next few years, reaching 4.5 million by the end of 2019. Interprovincial migration, a strong
source of population growth in the province, is responsible for this slowdown. As Alberta’s economic activity is
expected to suffer due to declining oil prices, there will be less people migrating into the province moving forward.
Additional items of note are as follows:
Alberta is Canada’s fourth-most populous province, and its diverse population is comprised mainly of
Caucasians (80.3 percent), followed by visible minorities (13.9 percent), and aboriginals (5.8
percent).
Over 71.0 percent of Albertans identify themselves as Christian, while almost 24.0 percent of
residents identify with no religion.
HOUSEHOLDS
Alberta has been one of the best places to live in Canada, and the world for that matter, due to many
characteristics including: low unemployment rates, the highest income levels in the country, falling crime rates,
and beautiful landscapes. Alberta is also the sunniest province in Canada with more than 2,000 hours of sunshine
each year, and has four distinct seasons. Most people living and working in Alberta get universal access to
hospital and medical services under the Alberta Health Care Insurance Plan (AHCIP), which is free and covered
by the Government of Alberta. Most temporary foreign workers and their families are also eligible.
Additional items of note are as follows:
According to Alberta Treasury Board of Finance, Alberta’s housing starts averaged 40,700 starts
(annualized) over the first half of 2015, lifted by a 22.0 percent increase in apartment starts. On the
flip side, single‑unit starts have fallen 14.0 percent. In contrast, all segments of the Alberta resale
housing market have weakened, but the market in Edmonton has faired better than the rest of
Alberta.
Slow economic growth in Alberta is expected to hinder residential construction in the province. BMO
Capital Markets projects housing starts in Alberta to decrease to 37,000 units in 2015 from 40,500
units in 2014. It will further decline to 33,000 units in 2016.
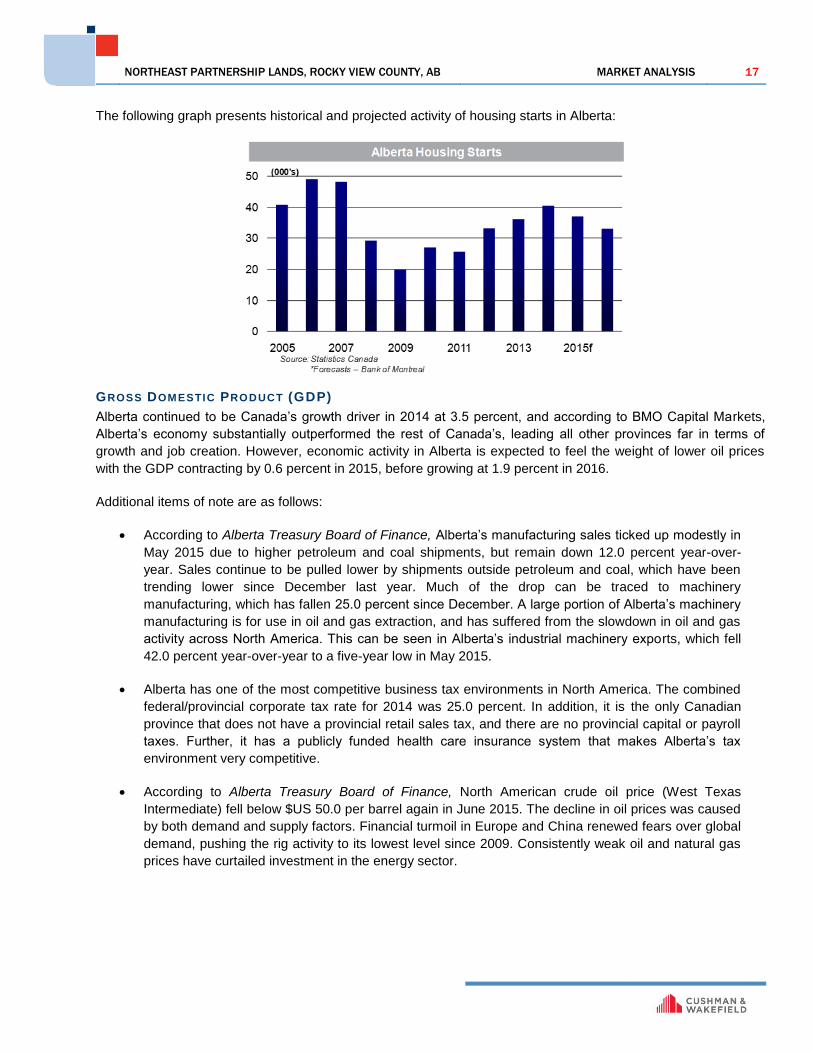
NORTHEAST PARTNERSHIP LANDS, ROCKY VIEW COUNTY, AB MARKET ANALYSIS 17
The following graph presents historical and projected activity of housing starts in Alberta:
GROSS DOMESTIC PRODUCT (GDP)
Alberta continued to be Canada’s growth driver in 2014 at 3.5 percent, and according to BMO Capital Markets,
Alberta’s economy substantially outperformed the rest of Canada’s, leading all other provinces far in terms of
growth and job creation. However, economic activity in Alberta is expected to feel the weight of lower oil prices
with the GDP contracting by 0.6 percent in 2015, before growing at 1.9 percent in 2016.
Additional items of note are as follows:
According to Alberta Treasury Board of Finance, Alberta’s manufacturing sales ticked up modestly in
May 2015 due to higher petroleum and coal shipments, but remain down 12.0 percent year-over-
year. Sales continue to be pulled lower by shipments outside petroleum and coal, which have been
trending lower since December last year. Much of the drop can be traced to machinery
manufacturing, which has fallen 25.0 percent since December. A large portion of Alberta’s machinery
manufacturing is for use in oil and gas extraction, and has suffered from the slowdown in oil and gas
activity across North America. This can be seen in Alberta’s industrial machinery exports, which fell
42.0 percent year-over-year to a five-year low in May 2015.
Alberta has one of the most competitive business tax environments in North America. The combined
federal/provincial corporate tax rate for 2014 was 25.0 percent. In addition, it is the only Canadian
province that does not have a provincial retail sales tax, and there are no provincial capital or payroll
taxes. Further, it has a publicly funded health care insurance system that makes Alberta’s tax
environment very competitive.
According to Alberta Treasury Board of Finance, North American crude oil price (West Texas
Intermediate) fell below $US 50.0 per barrel again in June 2015. The decline in oil prices was caused
by both demand and supply factors. Financial turmoil in Europe and China renewed fears over global
demand, pushing the rig activity to its lowest level since 2009. Consistently weak oil and natural gas
prices have curtailed investment in the energy sector.

NORTHEAST PARTNERSHIP LANDS, ROCKY VIEW COUNTY, AB MARKET ANALYSIS 18
The following graph presents further details of historical and projected GDP activity in Alberta:
EMPLOYMENT AND UNEMPLOYMENT
Alberta has been Canada’s employment powerhouse over the past few years. In the past year, Edmonton,
accounted for 40.0 percent of net new jobs in Canada, while Alberta, as a province, created 80.0 percent of new
jobs (net). Alberta’s job market is highly concentrated in energy and natural resources, advanced technologies,
agri-foods, forest products, and industrial and metal fabrication. In addition, Alberta’s strong economic growth
over the past decade has had major implications for its labour force. Shortages in skilled workers due to low
birthrates and an aging workforce encouraged immigration and migration to the province, which is a key
contributor to its population growth.
Additional items of note are as follows:
The labour market is feeling the pressure of declining activity in the province. According to Statistics
Canada, in June 2015, employment in the goods-producing sector has declined 1.4 percent over last
month and 4.3 percent over the past year. At the industry level, employment in the natural resources
industry has declined since June 2014, and has shed approximately 20,900 jobs over the past year.
Similarly, the professional and scientific services industry also recorded an 11.6 percent decline in
jobs on a year-over-year basis, shedding 21,500 positions.
BMO Capital Markets projects that last year’s employment growth rate of 2.2 percent will drop to 1.2
percent in 2015, and to 0.4 percent in 2016. As a result, the unemployment rate will rise to 6.0
percent by year-end 2016. The decline in the labour market activity is mainly due to the slowdown of
Alberta’s natural resources industry as a result of lower oil prices.
While falling oil prices negatively affect Alberta, they help the other Canadian provinces that are not
energy driven. The Conference Board of Canada projects that Alberta’s share of the national
employment gains will fall over the next few years as the fortunes of other provinces improve, driven
by declining oil prices.

NORTHEAST PARTNERSHIP LANDS, ROCKY VIEW COUNTY, AB MARKET ANALYSIS 19
The following graph represents yearly historical and projected employment and unemployment rates for Alberta:
RETAIL /COMMODITY SALES
Consumers have been a major source of economic growth since 2010. In 2014, retail sales in Alberta increased
to $78.7 billion from $73.1 billion in the previous year. However, retail sales in the province have reacted quickly
and sharply to the economic slowdown. Total sales at retail outlets dropped to $6.26 billion in January (seasonally
adjusted), down 6.5 percent from the record high set only four months prior in September 2014. TD Economics
expects retail trade in the province to contract by 1.8 percent in 2015, a drastic change from positive growth of 7.7
percent last year. Retail sales will bounce back to 3.4 percent in 2016.
Additional items of note are as follows:
Alberta's retail trade value declined by 1.7 percent in May 2015 compared to May 2014, to $6.3
billion, while Canada's retail sales value increased 2.7 percent over the same period. In Alberta, sales
at gasoline stations saw the largest decrease at 18.7 percent, driven by lower gasoline prices.
TD Economics expects the annual average price for natural gas to decrease to $2.99/MMBTU in
2015 from $4.36/MMBTU in 2014, before increasing to $3.30/MMBTU in 2016.
The following graph represents yearly historical and projected oil and natural gas prices for Alberta:

NORTHEAST PARTNERSHIP LANDS, ROCKY VIEW COUNTY, AB MARKET ANALYSIS 20
FUTURE CONSIDERATIONS
According to the Conference Board of Canada, Alberta’s economy may face a recession in 2015, contracting by
0.6 percent due to the plunging oil prices. Further, the Conference Board anticipates that if no new pipeline
projects are approved in the near future, oil sands investment may be lower than expected in the province.
Capital investments are a key driver of Alberta’s economy, and as a response to the falling oil prices, most of the
new capital projects are currently on hold.
Final thoughts:
Oil and gas investment moves with prices. The drop in oil prices is expected to lead to much lower
energy investment this year and a further decrease in 2016. The United States’ plan to be a net
exporter of natural gas beginning in 2018 will have adverse effects on Alberta’s natural gas industry
over the long term.
Alberta’s overall economic outlook for the next two years is under a dim light as most sectors
including employment, housing, and retail sales, are expected to slow down significantly in
comparison to recent history.

NORTHEAST PARTNERSHIP LANDS, ROCKY VIEW COUNTY, AB MARKET ANALYSIS 21
C A L G A R Y - E C O N O M I C O V E R V I E W
THE CALGARY ECONOMY
Calgary is the largest city in the Province of Alberta and the fourth largest municipality by
population in Canada. Economic activity in Calgary is mostly centered on the petroleum
industry; however, agriculture, tourism and high-tech industries also contribute to the
city’s strong economic climate. In addition, the nearby towns of Canmore, Banff, and
Lake Louise are also becoming increasingly popular as resort town destinations with
positive repercussions as a result.
The 2014 municipal census conducted by the City of Calgary indicates that the Calgary
CMA has an estimated population of 1,195,194, up 38,508 residents (3.3%) from the 2013 municipal census
which reported a population of 1,156,686.
According to the age distribution in Calgary, the first of
the baby boomers have started to reach the age of
retirement. Over the next 10 years, the number of
retirees in Calgary will double. Currently those who are
within the 5 to 20 years old age group will enter the
work force during the time when the number of retirees
is set to double. The youth of today may face a
challenging time supporting a large and growing retired
population, unless there is a shift in the demographic
migration relative to other economic regions.
KEY ECONOMIC INDICATORS
EMPLOYMENT VS . UNEMPLOYMENT
According to Statistics Canada, total employment in the Calgary Economic Region (CER) for February was
817,900, up 2,100 from January 2015, and up 26,100 from February 2014. The unemployment rate also saw a
marginal increase from 4.7% to 5.0% between January and February 2015. The participation rate in February
2015 remains steady, hovering at 73.0%, virtually unchanged from October 2014, above the national rate (65.8%)
and at par with the provincial rate (73.0%).
January
2015
February
2015
January 2015 -
February 2015
February 2014 -
February 2015
January 2015 -
February 2015
February 2014 -
February 2015
Population 1,163.4 1,166.1 2.7 38.5 0.2 3.4
Employment 815.8 817.9 2.1 26.1 0.3 3.3
Unemployment Rate (%) 4.7% 5.0% --- --- 0.3 0.2
Participation Rate (%) 73.6% 73.8% --- --- 0.2 0.1
Source: Statistics Canada, March 2015
thousands change (thousands) % change
Labour Force Characteristics - Seasonally Adjusted 3-Month Moving Average
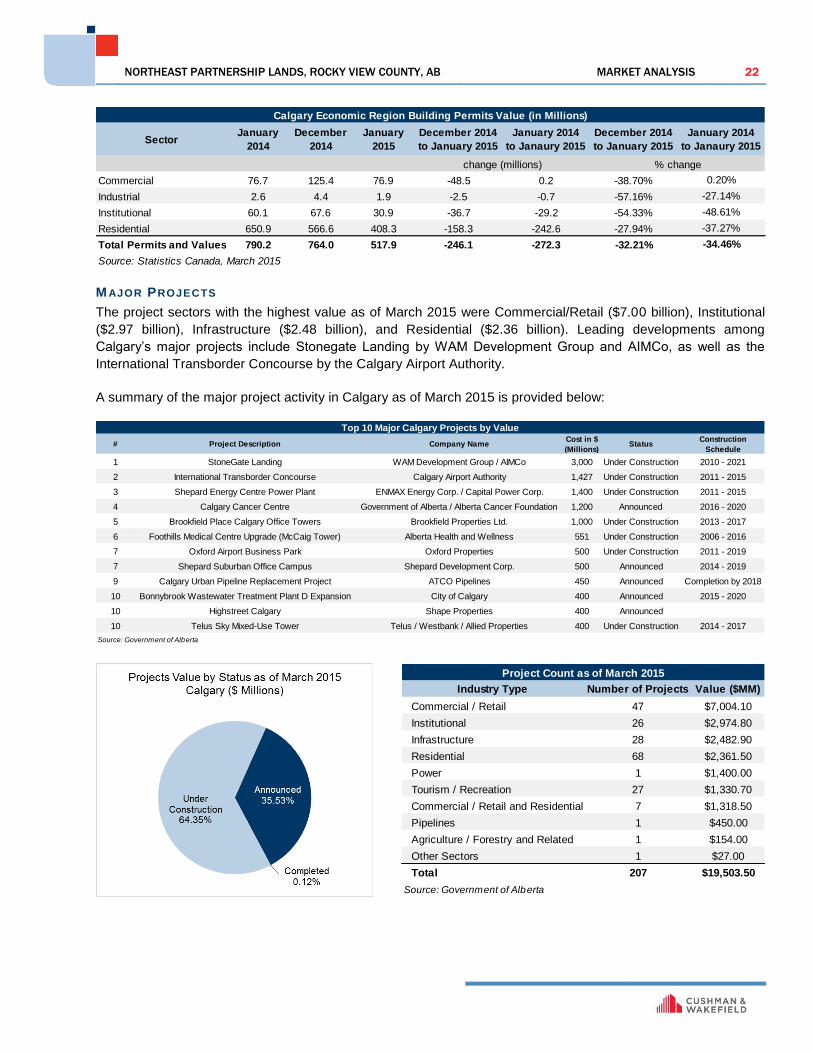
BUILDING PERMITS
Total value of building permits decreased 32.21% between December 2014 and January 2015, and decreased
34.46% year-over-year. A prominent reason is the significant decrease in institutional permit value on a month-
over-month and year-over-year basis at -54.33% and -37.27% respectively, as well as the significant decrease in
industrial permit value on a month-over-month basis (-57.16%).
NORTHEAST PARTNERSHIP LANDS, ROCKY VIEW COUNTY, AB MARKET ANALYSIS 22
SectorJanuary
2014
December
2014
January
2015
December 2014
to January 2015
January 2014
to Janaury 2015
December 2014
to January 2015
January 2014
to Janaury 2015
Commercial 76.7 125.4 76.9 -48.5 0.2 -38.70% 0.20%
Industrial 2.6 4.4 1.9 -2.5 -0.7 -57.16% -27.14%
Institutional 60.1 67.6 30.9 -36.7 -29.2 -54.33% -48.61%
Residential 650.9 566.6 408.3 -158.3 -242.6 -27.94% -37.27%
Total Permits and Values 790.2 764.0 517.9 -246.1 -272.3 -32.21% -34.46%
Source: Statistics Canada, March 2015
Calgary Economic Region Building Permits Value (in Millions)
change (millions) % change
M AJOR PROJECTS
The project sectors with the highest value as of March 2015 were Commercial/Retail ($7.00 billion), Institutional
($2.97 billion), Infrastructure ($2.48 billion), and Residential ($2.36 billion). Leading developments among
Calgary’s major projects include Stonegate Landing by WAM Development Group and AIMCo, as well as the
International Transborder Concourse by the Calgary Airport Authority.
A summary of the major project activity in Calgary as of March 2015 is provided below:
# Project Description Company NameCost in $
(Millions)Status
Construction
Schedule
1 StoneGate Landing WAM Development Group / AIMCo 3,000 Under Construction 2010 - 2021
2 International Transborder Concourse Calgary Airport Authority 1,427 Under Construction 2011 - 2015
3 Shepard Energy Centre Power Plant ENMAX Energy Corp. / Capital Power Corp. 1,400 Under Construction 2011 - 2015
4 Calgary Cancer Centre Government of Alberta / Alberta Cancer Foundation 1,200 Announced 2016 - 2020
5 Brookfield Place Calgary Office Towers Brookfield Properties Ltd. 1,000 Under Construction 2013 - 2017
6 Foothills Medical Centre Upgrade (McCaig Tower) Alberta Health and Wellness 551 Under Construction 2006 - 2016
7 Oxford Airport Business Park Oxford Properties 500 Under Construction 2011 - 2019
7 Shepard Suburban Office Campus Shepard Development Corp. 500 Announced 2014 - 2019
9 Calgary Urban Pipeline Replacement Project ATCO Pipelines 450 Announced Completion by 2018
10 Bonnybrook Wastewater Treatment Plant D Expansion City of Calgary 400 Announced 2015 - 2020
10 Highstreet Calgary Shape Properties 400 Announced
10 Telus Sky Mixed-Use Tower Telus / Westbank / Allied Properties 400 Under Construction 2014 - 2017
Source: Government of Alberta
Top 10 Major Calgary Projects by Value
Industry Type Number of Projects Value ($MM)
Commercial / Retail 47 $7,004.10
Institutional 26 $2,974.80
Infrastructure 28 $2,482.90
Residential 68 $2,361.50
Power 1 $1,400.00
Tourism / Recreation 27 $1,330.70
Commercial / Retail and Residential 7 $1,318.50
Pipelines 1 $450.00
Agriculture / Forestry and Related 1 $154.00
Other Sectors 1 $27.00
Total 207 $19,503.50
Source: Government of Alberta
Project Count as of March 2015

NORTHEAST PARTNERSHIP LANDS, ROCKY VIEW COUNTY, AB MARKET ANALYSIS 23
MLS HOUSING SALES
According to the Calgary Real Estate Board (CREB), in March 2015, there were 1,747 residential sales, a
decrease of 29.58% from March 2014. Year-to-date (as of March 2015) sales decreased 33.40% from 5,770 in
2014 to 3,843 in 2015. Decreases were seen across all housing sale categories, with single family down 32.18%,
apartments down 37.77%, and townhouses down 32.99% year-to-date. Total sales volume year-over-year saw
even more dramatic decreases, down 33.81%, 39.73%, and 35.76% respectively. Regardless, single family
homes saw a year-to-date increase of 12.73% over 2013 statistics.
The average price of a single family home fell 1.92% year-over-year to $547,253 in March 2015, from $557,976
the previous year. Comparatively, the average price of condominium townhouses fell 3.93% to $408,162 and the
average price of condominium apartments fell 1.29% to $306,781 year-over-year.
RETAIL SALES
January 2015 represented the fourth consecutive month of declining retail sales in Alberta, hitting their lowest
level since December 2013. Retail sales (adjusted) in Alberta fell 2.84% between December 2014 and January
2015, equating to a 2.31% year-over-year decrease. Additionally, December 2014 represented Canada’s largest
decline since April 2010 (2.0%), at $41.36 billion in retail sales. Alberta’s retail sales fared worse than the
national average in December, dropping 2.34% from $6.60 billion to $6.44 billion.
Impacted by the declining price of oil, Alberta has been replaced by British Columbia and Ontario as the
provinces with the highest levels of retail sales. Alberta’s retail sales decline for January 2015 was most
prominently attributed to decreased sales at gasoline stations. Coupled with weak income growth Canadians are
currently experiencing, savings and therefore disposable income levels have seen little growth.
CPI
As measured by Statistics Canada, the Consumer Price Index (CPI) for Calgary in February 2015 132.6, a
change of 0.7% from January 2015. This equates to a 1.1% increase on a year-over-year basis.
FUTURE CONSIDER ATIONS
The economy of Alberta, and Calgary more specifically, is dominated by the oil and gas sectors, and the performance
of real estate in many markets across the province is directly and substantially linked to the health of these two
resource-based industries. Over the past 6 months, the price of oil has declined by approximately 45%, and there is
concern across the oil-producing communities as to the future direction and health of the oil industry in North America
generally, and in Alberta in particular. Cushman & Wakefield is unable to determine the long-term price of oil or its
impact on the future of the sector in Alberta or Calgary more specifically, but caution the reader that any prolonged
period of low oil prices could have a negative impact on real estate demand in the province and a possible material
impact on property valuations.

NORTHEAST PARTNERSHIP LANDS, ROCKY VIEW COUNTY, AB MARKET ANALYSIS 24
I N D U S T R I A L
CURRENT TRENDS
In the second quarter of 2015, the overall vacancy rate in the Calgary industrial market was 5.0 percent, same as
it was year ago, however, increased 70 basis points over last quarter. Alberta’s slowing economy has resulted in
significantly lower leasing activity over the first half of the year, totaling only half the space leased during the
same period last year at 2.3 million square feet (msf). As a result, net absorption totaled only 975,795 square feet
(sf) for the first half of the year, down from 3.3 msf over the same period last year. In addition, the net asking rent
has dropped to $9.79 psf from $9.96 psf last quarter, although improved from the same quarter last year. While
many tenants are waiting to see the impact of the softening economy, renewal activity is still brisk.
Listed below are highlights in the Calgary industrial market in the second quarter of 2015:
The Central market remained as the tightest submarket in Calgary with a 2.2 percent vacancy rate,
unchanged over the past three quarters. With no new developments are currently underway in this
submarket, the vacancy rate is expected to remain tight in the medium term.
The Calgary industrial market was very active in the second quarter of 2015 with over 1.2 msf of
leasing activity. The North submarket led the way at 521,005 sf, followed by Southeast at 436,517 sf
of leased space.
Currently, a total of 2.3 msf of new developments are under construction in the Calgary industrial
market. Three buildings are fully vacant as of now, and is expected to add over 1.3 msf of vacant
space to North and Southeast submarkets. In contrast, the 640,000 sf, Home Depot building in
Southeast which is expected to be delivered in the final quarter of 2015 is fully preleased.
MARKET CHARACTERISTICS
Calgary, besides being the nation’s energy capital, is also a major logistics hub as approximately 70.0 percent of
its industrial real estate market is for logistics use. A fundamental advantage of doing logistics in Calgary is that it
is one of the most cost-effective places in Western North America.
Additional considerations regarding Calgary’s industrial market characteristics are as follows:
Calgary offers 120.0 msf of industrial space, generally located in the Northeast (aka. North),
Southeast, and Central areas of the city. Industrial inventory in Calgary is mainly composed of
industrial parks, intermodal facilities and on-airport logistics parks. In addition, over one third of the
total inventory was built in the past 10 years, providing significant energy efficiencies, and a wide
range of site amenities to accommodate current warehousing standards and transportation
equipment needs.
The Southeast market contains the largest amount of inventory in Calgary and approximately 46.0
percent of the total availabilities. In addition, the Southeast market has the most robust industrial
development with 1.1 msf of year-to-date construction completions and another 1.3 msf currently
underway. In contrast, there are no new supply currently underway in the Central market. Further,
with no new supply delivered over the first half of 2015, the Central market has the tightest vacancy
rate in Calgary at 2.2 percent.

NORTHEAST PARTNERSHIP LANDS, ROCKY VIEW COUNTY, AB MARKET ANALYSIS 25
The following graph demonstrates the Calgary industrial market’s breakdown in the second quarter of 2015:
The following map of Calgary provides approximate boundaries for each major industrial submarket:

NORTHEAST PARTNERSHIP LANDS, ROCKY VIEW COUNTY, AB MARKET ANALYSIS 26
SUPPLY ANALYSIS
VAC ANCY
In the first quarter of 2014, the overall vacancy rate in Calgary, at 7.4 percent, was the highest rate it’s been since
it reached 10.6 percent in 1987. In the second quarter of 2014, the vacancy rate dropped to 5.0 percent as the
market observed an unprecedented 3.0 msf of positive absorption due to strong leasing activity. After a quick 30
basis point jump in the third quarter to 5.3 percent, the vacancy rate steadily decreased over the past two
quarters, reaching 4.3 percent in the first quarter of 2015.
Additional considerations regarding vacancy trends in the Calgary industrial market in the second quarter of 2015
are as follows:
As a result of slowing Albertan economy, demand fundamentals in all Calgary industrial submarkets
have been weak in the second quarter of 2015, with the overall vacancy rate rising to 5.0 percent
from 4.3 percent last quarter. Both North and Southeast markets witnessed significant vacancy
increases at 1.0 percentage point and 80 basis points, respectively. In contrast, the Central market’s
vacancy remained unchanged at 2.2 percent during the first half of 2015.
The vacancy rate continued to be the highest in North at 6.2 percent in the second quarter of 2015,
one full percentage point increase over last quarter. This was primarily due to the completion of a
490,000 sf building in Northeast, and the 264,650 sf, CN Calgary Logistics Park in Conrich. Both
buildings arrived fully vacant, adding a total of 754,650 sf of vacant space to the North market in the
second quarter of 2015. In addition, the completion of two new buildings that are scheduled to be
delivered during the next two quarters, where no space has been preleased as yet, would add over
1.0 msf of vacant space to the North market. This would push up the vacancy rate significantly higher
by the end of 2015.
The following table shows Calgary’s submarket statistics for the second quarter of 2015:
CONS TRUCT ION
Approximately, 2.6 msf of new space was added to the Calgary industrial market in 2014, out of which only
10,800 sf was delivered to the Central area. In Calgary, the suburbs have been more attractive to developers of
industrial space during the past few years, particularly the Northeast market as it is close to other major markets
such as Red Deer and Edmonton. Approximately, 63.1 percent of new supply delivered in Calgary in 2014 was in
the Northeast market. Over the first half of 2015, the Southeast submarket looked to be more attractive to
developers where a total of 1.1 msf of new space got delivered, out of which 947,382 sf or 87.0 percent was
delivered in the second quarter.

NORTHEAST PARTNERSHIP LANDS, ROCKY VIEW COUNTY, AB MARKET ANALYSIS 27
Additional considerations regarding construction activity in the Calgary industrial market in the second quarter of
2015 are as follows:
In the second quarter, five buildings completed construction, adding a total of 1.4 msf to the Calgary
industrial market. The Southeast market accounted for majority of new space, totaling 947,382 sf,
followed by Northeast at 490,000 sf. In contrast, the Central market delivered zero new space.
In the second quarter, two buildings completed construction in North, adding 754,650 sf of vacant
space as both were fully vacant upon completion. As a result, the vacancy rate in this submarket rose
by one full percentage point over last quarter. In addition, the other two new developments that are
currently underway in North are also fully vacant as of now, and would add over 1.0 msf of vacant
space over the second half of the year, pushing the vacancy rate further up by year-end.
Out of three buildings that got completed in the second quarter of 2015 in the Southeast submarket,
two were fully available for lease, adding a total of 494,050 sf of vacant space. In contrast, the Home
depot building was fully preleased upon completion, adding 425,000 sf to this quarter’s positive
absorption.
As part of a $500.0 million national expansion project, Walmart Canada is building a second massive
distribution centre - the Walmart High Velocity Distribution Facility in the Balzac area in north of
Calgary. This is a 500,000 sf distribution centre with 84 loading bay doors, and will be located in the
Crosspointe Industrial Park near the 400,000 sf fresh food facility which opened in 2010.
The following graph shows a timeline of construction completions in the Calgary industrial market between 2005
and 2015:
ASK ING REN TS
After reaching the highest figure in history in the third quarter of 2014, at $9.96 psf, the average net asking rent in
the Calgary industrial market remained marginally unchanged until the first quarter of 2015. In the second quarter,
the asking rent dropped $0.17 psf, reaching $9.79 psf. Cushman & Wakefield forecasts that the rent will likely
decrease during the next year.
NORTHEAST PARTNERSHIP LANDS, ROCKY VIEW COUNTY, AB MARKET ANALYSIS 28
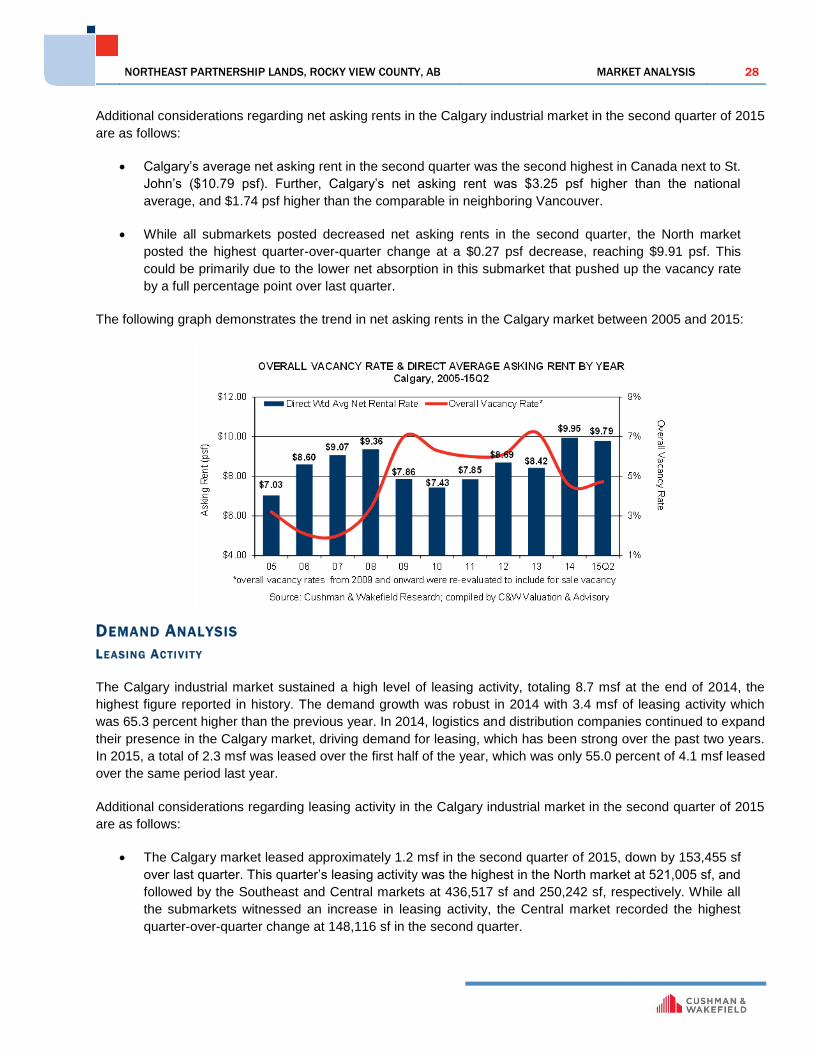
Additional considerations regarding net asking rents in the Calgary industrial market in the second quarter of 2015
are as follows:
Calgary’s average net asking rent in the second quarter was the second highest in Canada next to St.
John’s ($10.79 psf). Further, Calgary’s net asking rent was $3.25 psf higher than the national
average, and $1.74 psf higher than the comparable in neighboring Vancouver.
While all submarkets posted decreased net asking rents in the second quarter, the North market
posted the highest quarter-over-quarter change at a $0.27 psf decrease, reaching $9.91 psf. This
could be primarily due to the lower net absorption in this submarket that pushed up the vacancy rate
by a full percentage point over last quarter.
The following graph demonstrates the trend in net asking rents in the Calgary market between 2005 and 2015:
DEMAND ANALYSIS
LE ASING ACTI V I TY
The Calgary industrial market sustained a high level of leasing activity, totaling 8.7 msf at the end of 2014, the
highest figure reported in history. The demand growth was robust in 2014 with 3.4 msf of leasing activity which
was 65.3 percent higher than the previous year. In 2014, logistics and distribution companies continued to expand
their presence in the Calgary market, driving demand for leasing, which has been strong over the past two years.
In 2015, a total of 2.3 msf was leased over the first half of the year, which was only 55.0 percent of 4.1 msf leased
over the same period last year.
Additional considerations regarding leasing activity in the Calgary industrial market in the second quarter of 2015
are as follows:
The Calgary market leased approximately 1.2 msf in the second quarter of 2015, down by 153,455 sf
over last quarter. This quarter’s leasing activity was the highest in the North market at 521,005 sf, and
followed by the Southeast and Central markets at 436,517 sf and 250,242 sf, respectively. While all
the submarkets witnessed an increase in leasing activity, the Central market recorded the highest
quarter-over-quarter change at 148,116 sf in the second quarter.
NORTHEAST PARTNERSHIP LANDS, ROCKY VIEW COUNTY, AB MARKET ANALYSIS 29
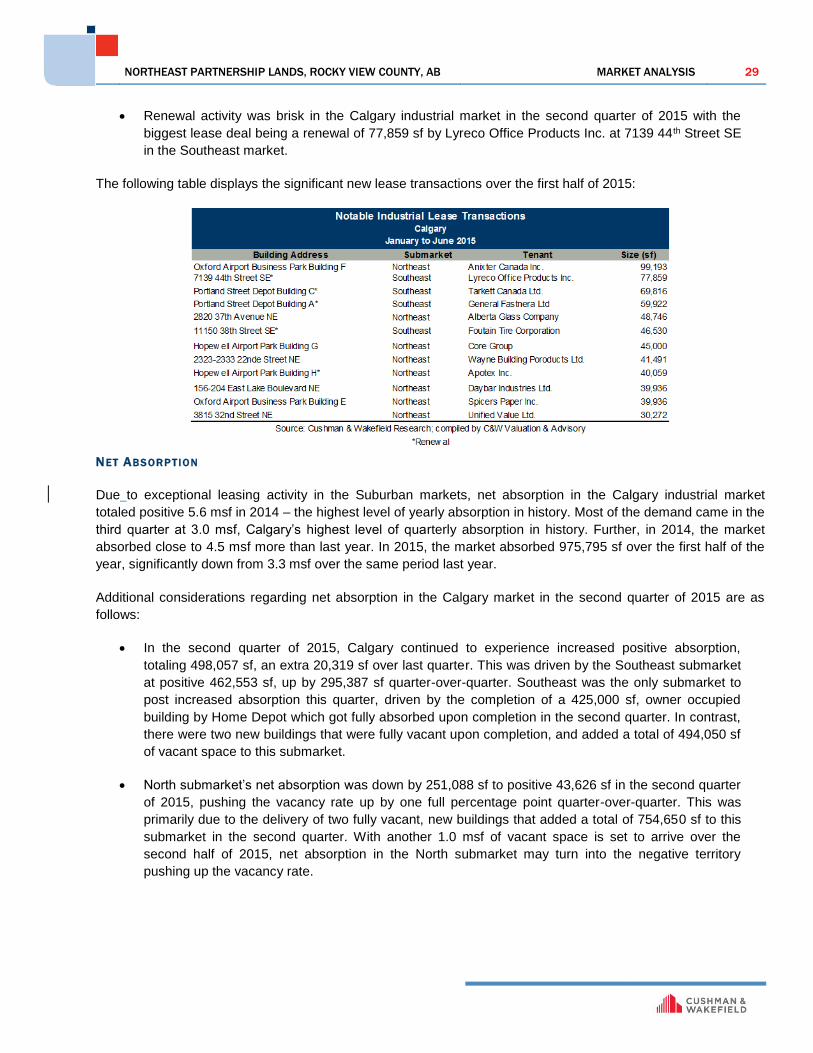
Renewal activity was brisk in the Calgary industrial market in the second quarter of 2015 with the
biggest lease deal being a renewal of 77,859 sf by Lyreco Office Products Inc. at 7139 44th Street SE
in the Southeast market.
The following table displays the significant new lease transactions over the first half of 2015:
NET ABS ORP TION
Due to exceptional leasing activity in the Suburban markets, net absorption in the Calgary industrial market
totaled positive 5.6 msf in 2014 – the highest level of yearly absorption in history. Most of the demand came in the
third quarter at 3.0 msf, Calgary’s highest level of quarterly absorption in history. Further, in 2014, the market
absorbed close to 4.5 msf more than last year. In 2015, the market absorbed 975,795 sf over the first half of the
year, significantly down from 3.3 msf over the same period last year.
Additional considerations regarding net absorption in the Calgary market in the second quarter of 2015 are as
follows:
In the second quarter of 2015, Calgary continued to experience increased positive absorption,
totaling 498,057 sf, an extra 20,319 sf over last quarter. This was driven by the Southeast submarket
at positive 462,553 sf, up by 295,387 sf quarter-over-quarter. Southeast was the only submarket to
post increased absorption this quarter, driven by the completion of a 425,000 sf, owner occupied
building by Home Depot which got fully absorbed upon completion in the second quarter. In contrast,
there were two new buildings that were fully vacant upon completion, and added a total of 494,050 sf
of vacant space to this submarket.
North submarket’s net absorption was down by 251,088 sf to positive 43,626 sf in the second quarter
of 2015, pushing the vacancy rate up by one full percentage point quarter-over-quarter. This was
primarily due to the delivery of two fully vacant, new buildings that added a total of 754,650 sf to this
submarket in the second quarter. With another 1.0 msf of vacant space is set to arrive over the
second half of 2015, net absorption in the North submarket may turn into the negative territory
pushing up the vacancy rate.

NORTHEAST PARTNERSHIP LANDS, ROCKY VIEW COUNTY, AB MARKET ANALYSIS 30
The following chart illustrates the overall net absorption in the Calgary market from 2005 to 2015:
The following chart illustrates the construction completions and annual net absorption, compared to overall
vacancy rates in the Calgary market from 2005 to 2015:
DEMAND DRI VER S
After benefiting tremendously over the past five years from strong energy prices that saw investments and people
pour in to the province, and lifting the overall real GDP above 4.0 percent a year, the good times in Alberta
appear to be over - at least for the medium term. According to the Conference Board of Canada’s Autumn 2015
Outlook, the economic activity in Calgary is expected to feel the weight of lower oil prices with the GDP shrinking
by 0.5 percentage points in 2015, before expanding by 1.8 percent in 2016.
Additional considerations regarding demand drivers in the Calgary market are as follows:
According to the Conference Board of Canada, retail sales in Calgary will contract by 1.5 percent in
2015 compared to the massive growth of 6.6 percent in 2014. Poor Weak consumer spending may
keep demand away from the Calgary industrial market in the near term. As a result, wholesale and
retail trade output may drop considerably in 2015, and thereby decreased demand for warehousing
and distribution space in Calgary.
According to the Conference Board of Canada, the decline in oil prices are also affecting activity in
the local manufacturing sector, particularly for companies that manufacture products for the oil and
gas extraction sector. Fortunately, the sector should avoid an outright decline thanks to a
strengthening U.S. economy, a weak Canadian dollar, and reduced shipping costs. All in all, growth
in manufacturing output is forecast to keep expanding in 2015 by a weaker 0.7 percent. Next year
looks better as a 2.1 percent expansion is anticipated.

NORTHEAST PARTNERSHIP LANDS, ROCKY VIEW COUNTY, AB MARKET ANALYSIS 31
The supply of both serviced and limited serviced land in Calgary, including the greater Calgary area,
remains scarce. Despite the weak economic conditions in the market, land values are not expected to
decline as much as other asset classes, as Calgary’s largest land developer, the City of Calgary,
does not usually cut prices.
CONCLUSION & OUTLOOK
Demand in the Calgary industrial market has been strong over the first half of 2015, with 975,795 sf of positive
absorption, thanks to a total of 2.3 msf of leasing activity. The overall vacancy rate, however, was up by 70 basis
points over last quarter, reaching 5.0 percent in the second quarter. The sale market has also been active thanks
to a still-low interest rate environment, and growing land values.
Final thoughts:
As of the second quarter of 2015, Calgary offered 120.0 msf of industrial space, with majority of that
space situated in the Southeast and Northeast quadrants of the city. This inventory is composed
mainly of transportation, logistics and manufacturing facilities. Approximately 35.0 percent of
industrial space in Calgary has been built in the past 10 years. Therefore, there are significant energy
efficiencies, building design, and site amenities to accommodate current warehousing standards, and
transportation equipment needs.
Compared to the office market, the industrial sector has significantly less exposure to the oil industry
and therefore occupancy levels are not immediately impacted by volatile oil prices.
Benefits of improving U.S. demand are expected to be felt in the coming quarters. However, U.S.’
plan to be a net exporter of natural gas beginning in 2018 will have adverse effects on Alberta’s
natural gas industry over the long term.
The Greater Calgary regional district is considered as the distribution and logistics hub of Western
Canada. The Calgary Logistics Park at Conrich, and the new expansion of Walmart Canada’s
distribution centre in Calgary will further emphasize the importance of Greater Calgary as a leading
distribution and logistics hub. Walmart is the world’s largest retailer, and this expansion
announcement is a huge strong vote of confidence in the Canadian marketplace.

NORTHEAST PARTNERSHIP LANDS, ROCKY VIEW COUNTY, AB VALUATION AND FINANCIAL ANLAYSIS 32
VALU A T IO N AND F INANC IAL ANALYS IS
H I G H E S T A N D B E S T U S E
DEFINIT ION OF H IGHEST AND BEST USE
Fundamental to the concept of value is the principle of highest and best use, which may be defined as:
The reasonably probable and legal use of vacant land or an improved property, which is
physically possible, appropriately supported, financially feasible, and that results in the
highest value. The four criteria the highest and best use must meet are legal
permissibility, physical possibility, financial feasibility, and maximum profitability
H IGHEST AND BEST USE CRITERIA
We have evaluated the site's highest and best use both as currently raw land and as serviced and subdivided and
ready for development. In both cases, the property’s highest and best use must meet four criteria. That use must
be (1), legally permissible (2) physically possible, (3) financially feasible, and (4) maximally profitable.
LEG AL L Y PERMI SSIB LE
According to the current Land Use By-law, the subject property is classified as RF, Ranch and Farm District. The
purpose and intent of this district is to provide for agricultural activities as the primary land use on a quarter
section of land or on large balance land from previous subdivisions. The minimum parcel size is 160.0 acres or
the area in title at the time of passage of the Bylaw. The existing use is agricultural production and is legally
permissible. The subject property is expected to transition to residential and/or industrial uses in the mid to long-
term.
A continuation of the existing use as agricultural land is legally permissible.
PH YS ICA LL Y POSS IBLE
The second test is what is physically possible. As discussed in the "Site Description," section of the report, the
site's size, soil, topography, etc. do not physically limit its use. The subject site is of adequate shape and size to
accommodate a comprehensively planned residential and/or industrial development when feasible.
F INANCIA L FE ASIB I L IT Y AND MAXIMUM PRODUC TI V IT Y
The third and fourth tests are what is financially feasible and what will produce the highest net return. After
analyzing the physically possible and legally permissible uses of the property, the highest and best use must be
considered in light of financial feasibility and maximum productivity. For a potential use to be seriously
considered, it must have the potential to provide a sufficient return to attract investment capital over alternative
forms of investment. A positive net income or acceptable rate of return would indicate that a use is financially
feasible. The subject site as a holding property until a comprehensively planned residential and/ or industrial
development would be financially feasible and would result in the maximum productive use of the site.
H IGHEST AND BEST USE CONCLUSION
Considering the subject site’s physical characteristics and location, as well as the state of the local market, it is
our opinion that the Highest and Best Use of the subject site as though vacant is a continuation of the existing
agricultural use until development is legally permissible and financially feasible.
NORTHEAST PARTNERSHIP LANDS, ROCKY VIEW COUNTY, AB VALUATION AND FINANCIAL ANLAYSIS 33
V A L U A T I O N M E T H O D S
There are six generally accepted methods of valuing vacant land: Direct Comparison; Abstraction; Extraction;
Subdivision Development; Land Residual; and Ground Rent Capitalization.
The Direct Comparison Approach is based upon the premise that a prudent purchaser would not pay more for a
property than what it would cost to acquire a suitable alternative property and that the market value of a property
can be estimated by comparing sales, offers, and listings of properties which have similar characteristics to the
property being appraised.
The Abstraction Method of valuing land is premised upon the Principal of Contribution. This method is premised
on the assumption that within each category and type of real estate, there exists a typical ratio of land value to
total property value. By knowing what this ratio is from data compiled from areas where land and building values
are available and applying it to the sales information regarding improved properties in a built up area, an estimate
of land value can be abstracted. The reliability of this method is diminished because it does not take into explicit
consideration such relevant criteria as building age or quality of construction.
A method of land valuation similar to the Abstraction Method but which implicitly recognizes differences in building
age and quality of construction is the Extraction Method. This method deducts the estimated depreciated
reproduction or replacement cost of the improvements of an improved property for which the total property value
is known to arrive at an estimate of land value as if vacant.
When valuing larger parcels for which the highest and best use is the parcel’s subdivision into smaller sites, and
for which sales information regarding similar larger sites is insufficient to undertake a Direct Comparison
Approach, the Subdivision Development Method may be employed. In applying this method, the first step is to
establish market values for the smaller sites as though subdivided, the length of the development period, and an
appropriate absorption period. The second step is to determine the costs required to create and market the
subdivided parcels which include engineering and construction costs associated with the site preparation,
roadways, sidewalks and servicing; carrying costs such as insurance and taxes; and marketing costs. These
costs are then deducted from the projected gross revenue of the lots to arrive at an estimate of the net proceeds
which, once discounted at an applicable rate to account for the risk associated with the time required to complete
such a development, are indicative of the present market value of the larger, un-subdivided site.
Another method that may be employed in the absence of adequate comparable information is the Land Residual
Technique. In this method the net income generated from the property is established. From this is deducted a
reasonable return on and recapture of capital invested in the improvements. The residual income is considered
to be ascribed from the land. This income is then capitalized at an appropriate rate to arrive at an estimate of land
value. An important assumption required in the application of this method is that the site is developed to its
highest and best use such that the income from land and improvements are of the same type and source.
A similar method as the Land Residual Technique is Ground Rent Capitalization. Undertaking this method of
site valuation requires the analysis of ground rents prevalent in the market and in consideration of the
characteristics of the site being appraised. From the analysis, a gross income is established from which any
requisite expenses or anticipated losses are deducted to arrive at a net operating income. This net operating
income is then capitalized at an applicable rate to arrive at an estimate of the vacant site.
Some important factors to be given consideration in this analysis include location, access, site size, site
configuration, topography, land use classification, servicing, etc. When enough unimproved and comparable
sales are available, the Direct Comparison Approach is the preferred technique and has been employed herein.
NORTHEAST PARTNERSHIP LANDS, ROCKY VIEW COUNTY, AB VALUATION AND FINANCIAL ANLAYSIS 34
D I R E C T C O M P A R I S O N A P P R O A C H
In the Direct Comparison Approach, we developed an opinion of value by comparing this property with similar,
recently sold properties in the surrounding or competing area. Inherent in this approach is the principle of
substitution, which states that when a property is replaceable in the market, its value tends to be set at the cost of
acquiring an equally desirable substitute property, assuming that no costly delay is encountered in making the
substitution.
By analyzing sales that qualify as arm’s-length transactions between willing and knowledgeable buyers and
sellers, we can identify value and price trends. The basic steps of this approach are:
1. Research recent, relevant property sales and current offerings throughout the competitive area;
2. Select and analyze properties that are similar to the property appraised, analyzing changes in
economic conditions that may have occurred between the sale date and the date of value, and
other physical, functional, or location factors;
3. Identify sales that include favorable financing and calculate the cash equivalent price;
4. Reduce the sale prices to a common unit of comparison such as price per square foot, price per
unit or effective gross income multiplier;
5. Make appropriate comparative adjustments to the prices of the comparable properties to relate
them to the property being appraised; and
6. Interpret the adjusted sales data and draw a logical value conclusion.
The Direct Comparison Approach is based on the Principle of Substitution which maintains that a prudent
purchaser would not pay more for a property than what it would cost to purchase a suitable alternative property,
one that exhibits similar characteristics, and functional utility, etc. Within this approach, the property being
appraised is compared to similar properties that have sold recently or are currently offered for sale. Typically, a
unit of comparison (i.e. sale price per square foot, sale price per unit, etc.) is used to facilitate the analysis. In the
case of properties similar to the subject lands, the sale price per acre is the most commonly used unit of
comparison.
In analyzing the comparable sales relative to the subject site, of particular relevance are characteristics such as
location, site size, topography, developability, and land use regulations. In this regard, the sales summarized in
following are thought to be reasonably comparable to the subject site and to provide a reliable indication as to its
current market value.
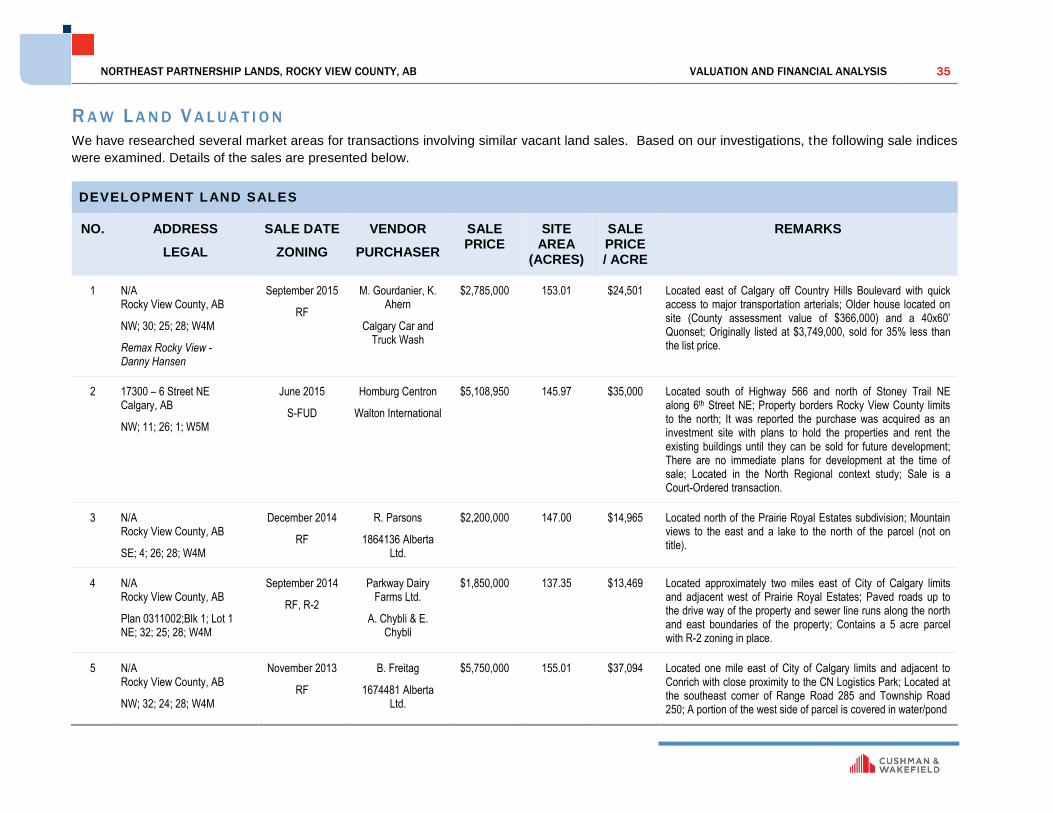
NORTHEAST PARTNERSHIP LANDS, ROCKY VIEW COUNTY, AB VALUATION AND FINANCIAL ANALYSIS 35
R A W L A N D V A L U A T I O N
We have researched several market areas for transactions involving similar vacant land sales. Based on our investigations, the following sale indices
were examined. Details of the sales are presented below.
DEVELOPMENT LAND SALES
NO. ADDRESS
LEGAL
SALE DATE
ZONING
VENDOR
PURCHASER
SALE PRICE
SITE AREA
(ACRES)
SALE PRICE / ACRE
REMARKS
1 N/A Rocky View County, AB
NW; 30; 25; 28; W4M
Remax Rocky View - Danny Hansen
September 2015
RF
M. Gourdanier, K. Ahern
Calgary Car and Truck Wash
$2,785,000 153.01 $24,501 Located east of Calgary off Country Hills Boulevard with quick access to major transportation arterials; Older house located on site (County assessment value of $366,000) and a 40x60’ Quonset; Originally listed at $3,749,000, sold for 35% less than the list price.
2 17300 – 6 Street NE Calgary, AB
NW; 11; 26; 1; W5M
June 2015
S-FUD
Homburg Centron
Walton International
$5,108,950 145.97 $35,000 Located south of Highway 566 and north of Stoney Trail NE along 6th Street NE; Property borders Rocky View County limits to the north; It was reported the purchase was acquired as an investment site with plans to hold the properties and rent the existing buildings until they can be sold for future development; There are no immediate plans for development at the time of sale; Located in the North Regional context study; Sale is a Court-Ordered transaction.
3 N/A Rocky View County, AB
SE; 4; 26; 28; W4M
December 2014
RF
R. Parsons
1864136 Alberta Ltd.
$2,200,000 147.00 $14,965 Located north of the Prairie Royal Estates subdivision; Mountain views to the east and a lake to the north of the parcel (not on title).
4 N/A Rocky View County, AB
Plan 0311002;Blk 1; Lot 1 NE; 32; 25; 28; W4M
September 2014
RF, R-2
Parkway Dairy Farms Ltd.
A. Chybli & E. Chybli
$1,850,000 137.35 $13,469 Located approximately two miles east of City of Calgary limits and adjacent west of Prairie Royal Estates; Paved roads up to the drive way of the property and sewer line runs along the north and east boundaries of the property; Contains a 5 acre parcel with R-2 zoning in place.
5 N/A Rocky View County, AB
NW; 32; 24; 28; W4M
November 2013
RF
B. Freitag
1674481 Alberta Ltd.
$5,750,000 155.01 $37,094 Located one mile east of City of Calgary limits and adjacent to Conrich with close proximity to the CN Logistics Park; Located at the southeast corner of Range Road 285 and Township Road 250; A portion of the west side of parcel is covered in water/pond
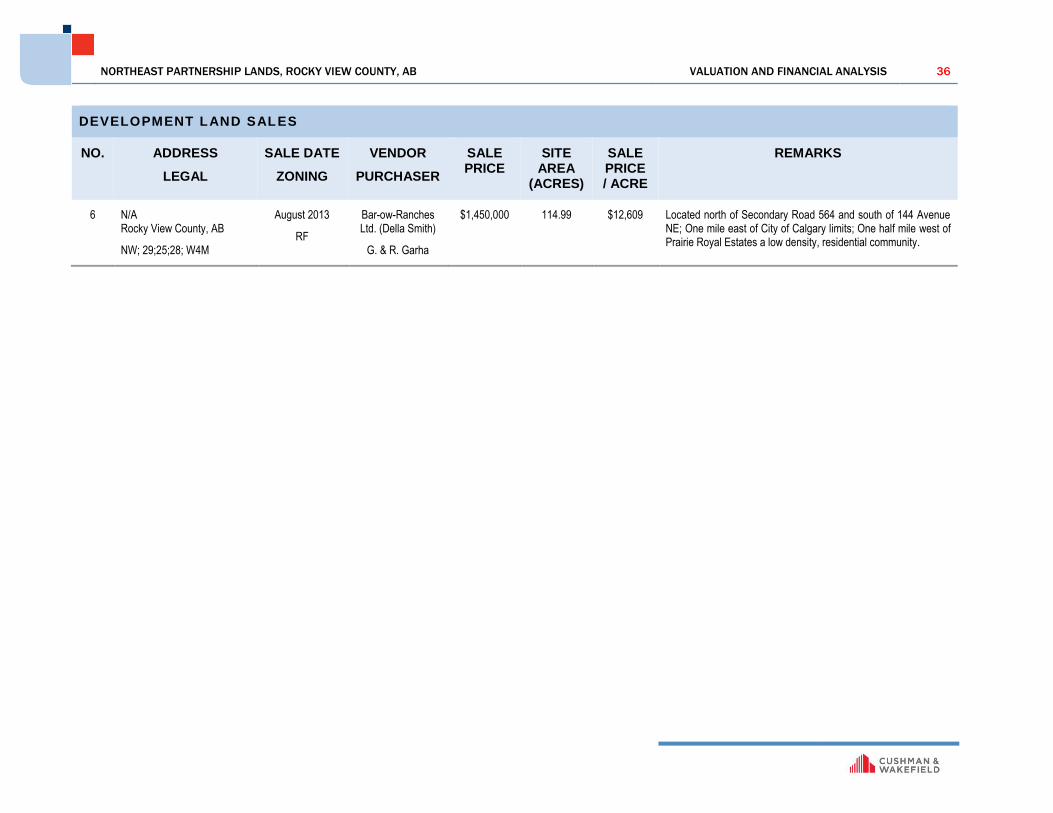
NORTHEAST PARTNERSHIP LANDS, ROCKY VIEW COUNTY, AB VALUATION AND FINANCIAL ANALYSIS 36
DEVELOPMENT LAND SALES
NO. ADDRESS
LEGAL
SALE DATE
ZONING
VENDOR
PURCHASER
SALE PRICE
SITE AREA
(ACRES)
SALE PRICE / ACRE
REMARKS
6 N/A Rocky View County, AB
NW; 29;25;28; W4M
August 2013
RF
Bar-ow-Ranches Ltd. (Della Smith)
G. & R. Garha
$1,450,000 114.99 $12,609 Located north of Secondary Road 564 and south of 144 Avenue NE; One mile east of City of Calgary limits; One half mile west of Prairie Royal Estates a low density, residential community.

NORTHEAST PARTNERSHIP LANDS, ROCKY VIEW COUNTY, AB VALUATION AND FINANCIAL ANALYSIS 37
COMPARABLE MAP

NORTHEAST PARTNERSHIP LANDS, ROCKY VIEW COUNTY, AB VALUATION AND FINANCIAL ANALYSIS 38
A N A L Y S I S
The major elements of comparison for an analysis of this type include the property rights conveyed, the financial
terms incorporated into a particular transaction, the conditions or motivations surrounding the sale, changes in
market conditions since the sale, the location of the real estate, its physical traits and the economic
characteristics of the property.
PROPERTY R IGHTS APPR AISED
All of the sales and listings utilized in this analysis involved the transfer of the fee simple interest.
F IN ANCI AL TERMS
To the best of our knowledge, all of the sales utilized in this analysis were accomplished with cash and/or cash
and market-oriented financing.
CONDITIONS OF SALE
Adjustments for conditions of sale usually reflect the motivations of the buyer and the seller. In many situations
the conditions of sale may significantly affect transaction prices. Index Nos. 1 and 2 are current listings and would
be expected to transfer at a lower value than the current list price. All remaining sales used in this analysis are
considered to be "arms-length" market transactions between both knowledgeable buyers and sellers on the open
market.
M ARKET CONDITIONS
The sales included in the analysis date between August 2013 and September 2015. In the past few years, there
have been very few transactions in this area of Rocky View County and there appears to have been an ongoing
shift in attitudes in the County towards development, which has made moving development projects forward
challenging.
LOC ATION
The subject property itself has a good location in close proximity to the City of Calgary and is adjacent to the
Transportation and Utility Corridor (Stoney Trail), which has been completed. The freeway provides good access
to the City of Calgary and is a positive feature. Index Nos. 3, 4 and 6 are located east of City of Calgary limits
surrounding the Prairie Royal Estates. Index No. 2 is located north of Stoney Trail and bordering Rocky View
County limits on the north side. Index No. 5 is located in the Conrich area and is considered to be a superior
location.
S IZE
The selected comparable sales range in size from 114.99 to 155.01 acres, compared to the subject property of
610.16 acres which consists of four, individually titled parcels. Smaller parcels generally trade for higher values
than larger parcels, therefore downward adjustments to the value per acre should be considered for all of the
indices. It should also be noted the subject property is divided into four separate parcels that could be sold
independently.
PUBLIC UTILITIES
The subject property does not currently have access to municipal services. The East Rocky View Wastewater
Transmission Line (ERVWTL) services this portion of Rocky View County with sewer services. The subject
property is located approximately 1.0 km west of the line. The comparable properties are generally similar in this
regard.
UTILITY
All of the selected sales are large and mainly level parcels that can accommodate future development.

NORTHEAST PARTNERSHIP LANDS, ROCKY VIEW COUNTY, AB VALUATION AND FINANCIAL ANALYSIS 39
LAND SALE ADJUSTMENT GRID
Economic Adjustments (Cumulative) Property Characteristic Adjustments (Additive)
No.
Price
per Acre
Property
Rights
Conveyed
Conditions
of Sale Financing
Market*
Conditions
Subtotal Per
Acre Location Size
Public
Utilities Utility**
Land Use/
Timing to
Development Overall
1 $18,201 Fee Simple/Mkt. Inferior None Similar $18,201 Inferior Similar Similar Similar Inferior $18,201
9/15 Similar Dow nw ard Adj. Similar Upw ard Adj. Higher Than
2 $35,000 Fee Simple/Mkt. Inferior None Similar $35,000 Similar Similar Similar Similar Similar $35,000
6/15 Similar Dow nw ard Adj. Similar Similar to
3 $14,966 Fee Simple/Mkt. Arms-Length None Similar $14,966 Inferior Similar Similar Similar Similar $14,966
12/14 Similar Similar Similar Upw ard Adj. Higher Than
4 $13,469 Fee Simple/Mkt. Arms-Length None Similar $13,469 Inferior Similar Similar Similar Similar $13,469
9/14 Similar Similar Similar Upw ard Adj. Higher Than
5 $37,094 Fee Simple/Mkt. Arms-Length None Similar $37,094 Superior Similar Similar Similar Similar $37,094
11/14 Similar Similar Similar Dow nw ard Adj. Low er than
6 $12,610 Fee Simple/Mkt. Arms-Length None Similar $12,610 Inferior Similar Similar Similar Inferior $12,610
8/13 Similar Similar Similar Upw ard Adj. Upw ard Adj. Higher Than
(OTHER) LAND USE
All of the properties have RF-Ranch Farm land uses in place and are considered comparable in this regard. A
portion of Index No. 4 also includes a 5.0 acre portion with R-2 zoning.
ADJUSTMENTS
The following qualitative adjustments have been made to the comparable properties based on the previous
analysis.

NORTHEAST PARTNERSHIP LANDS, ROCKY VIEW COUNTY, AB VALUATION AND FINANCIAL ANALYSIS 40
S U M M A R Y O F D I R E C T C O M P A R I S O N A P P R O A C H
The sales discussed are summarized in the preceding chart. The selected indices indicate a range of values from
a low of $12,610 to a high of $37,094 per acre. The locations of the indices are in Rocky View County including
Conrich. The comparable sales have a range of sizes from 114.99 to 155.01 acres and transferred between
August 2013 and September 2015, as recent sales in this area of the County were limited over the past few
years.
The low end of the displayed range is the sale of Index No. 6 which transferred in August 2013. This property is
located farther east from city limits than the subject, in close proximity to the low density, residential subdivision
known as Prairie Royal Estates. A higher value would be expected for the subject property, located adjacent to
Stoney Trail.
The high end of the range is displayed by Index No. 5 which is a November 2013 sale of a property located in the
Conrich area. Due to the close proximity to Conrich, where the CN Logistics Park is located, this property would
be expected to have a shorter time to development due to the proximity to services. The subject property would
be expected to transfer at a lower value compared to this property. The remaining indices display a more narrow
range of unit values between $13,469 and $35,000 per acre.
Index Nos. 1 and 2 are recent sales. Index No. 1 was listed on the market for over a year and transferred at
$18,201 per acre, approximately 35% lower than the original asking price of $24,500 per acre. Index No. 2 was a
recent court-ordered sale of a property which is located within City of Calgary limits on the north side, bordering
Rocky View County to the north. Overall, due to location with access to servicing, timing to development, a similar
to lower value would be anticipated for the subject land.
As of October 2014, the County had released a list of the six new ASP projects it will be undertaking over the next
three years including Landgon, Crossfield, Glenbow and Highways 1 and 22. The Springbank and Bearspaw
plans will be scheduled for launch in 2016 and 2017, respectively. The list of ASP priorities will be examined each
year by the County to “ensure that the greatest needs of the municipality are being met. New projects that are
consistent with the County Plan’s growth and financial goals may be considered in future planning efforts”. The
subject property is not located in one of the areas the County has as a priority for development in the near term.
Overall we would expect the subject to attain a value between $40,000 and $45,000 per acre for the portion of the
subject parcel which borders the City of Calgary limits, and a value between $27,500 and $32,500 per acre for the
remaining parcels, located one half mile east. Based on these values the total estimate of the subject property is:
610.16 Acres x $33,000 per acre = $20,135,280
$20,140,000 (Rounded)

NORTHEAST PARTNERSHIP LANDS, ROCKY VIEW COUNTY, AB FINAL VALUE ESTIMATE 41
F INAL VA LU E ES T IM ATE In the methodology section of this report we indicated that the Direct Comparison Approach is the preferred
approach when valuing the subject property, providing there is sufficient and comparable activity. Since there is
sufficient comparable activity, it was the only method employed.
Based on the data, analysis and reasoning contained within this report it is our opinion that the market value of
the subject site on an as is basis and subject to the assumptions set forth herein, at December 31, 2015 was:
TWENTY MILLION ONE HUNDRED FORTY THOUSAND DOLLARS
$20,140,000
This value estimate is based on an exposure period of six to twelve months.
The economy of Alberta is dominated by the oil and gas sectors, and the performance of real estate in many markets
across the province is directly and substantially linked to the health of these two resource-based industries. Over the
past 6 months, the price of oil has declined by approximately 45%, and there is concern across the oil-producing
communities as to the future direction and health of the oil industry in North America generally, and in Alberta in
particular. Cushman & Wakefield is unable to determine the long-term price of oil or its impact on the future of the
sector in Alberta, but caution the reader that any prolonged period of low oil prices could have a negative impact on
real estate demand in the province and a possible material impact on the subject valuation.
NORTHEAST PARTNERSHIP LANDS, ROCKY VIEW COUNTY, AB ADDENDA CONTENTS 42
AD D END A CON TENTS ADDENDUM A: ASSUMPTIONS AND LIMITING CONDITIONS --------------------------------------------------------------------- 43
ADDENDUM B: GLOSSARY OF TERMS AND DEFINITIONS ------------------------------------------------------------------------ 46
ADDENDUM C: CERTIFICATION OF APPRAISAL ----------------------------------------------------------------------------------------- 48

NORTHEAST PARTNERSHIP LANDS, ROCKY VIEW COUNTY, AB ASSUMPTIONS AND LIMITING CONDITIONS 43
AS S U MP T IO NS AND L IM IT IN G CO ND IT IONS "Report" means the appraisal or consulting report and conclusions stated therein, to which these Assumptions
and Limiting Conditions are annexed.
"Property" means the subject of the Report.
"C&W" means Cushman & Wakefield Ltd. or its subsidiary that issued the Report.
"Appraiser(s)" means the employee(s) of C&W who prepared and signed the Report.
The Report has been made subject to the following assumptions and limiting conditions:
This report has been prepared at the request of Mr. Mark Scott of Genesis Land Development Corp.
for the purpose of providing an estimate of the market value of the Northeast Partnership Lands in Rocky
View County, Alberta for internal decision making and distribution to Limited Partners. It is not reasonable
for any person other than Genesis Land Development Corp. to rely upon this appraisal without first
obtaining written authorization from the client and the author of this report. This report has been prepared
on the assumption that no other person will rely on it for any other purpose and all liability to all such
persons is denied.
This report has been prepared at the request of Mr. Mark Scott of Genesis Land Development Corp.
and for the exclusive (and confidential) use of the recipient as named herein for the specific purpose and
function as stated herein. All copyright is reserved to the author and this report is considered confidential
by the author and the client. Possession of this report, or a copy thereof, does not carry with it the right to
reproduction or publication in any manner, in whole or in part, nor may it be disclosed, quoted from or
referred to in any manner, in whole or in part, without the prior written consent and approval of the author
as to the purpose, form and content of any such disclosure, quotation or reference.
Without limiting the generality of the foregoing, neither all nor any part of the contents of this report shall
be disseminated or otherwise conveyed to the public in any manner whatsoever or through any media
whatsoever or disclosed, quoted from or referred to in any report, financial statement, prospectus, or
offering memorandum of the client, or in any documents filed with any governmental agency without the
prior written consent and approval of the author as to the purpose, form and content of such
dissemination, disclosure, quotation or reference.
The estimated current market value of the real property which is appraised in this report pertains to the
value of the fee simple interest in the real estate. The property rights appraised herein exclude mineral
rights, if any.
The estimate of value contained in this report is founded upon a thorough and diligent examination and
analysis of information gathered and obtained from numerous sources. Certain information has been
accepted at face value; especially if there was no reason to doubt its accuracy. Other empirical data
required interpretative analysis pursuant to the objective of this appraisal. Certain inquiries were outside
the scope of this mandate. For these reasons, the analyses, opinions and conclusions contained in this
report are subject to all of the assumptions and limiting conditions.
The property has been valued on the basis that title to the real property herein appraised is good and
marketable.
NORTHEAST PARTNERSHIP LANDS, ROCKY VIEW COUNTY, AB ASSUMPTIONS AND LIMITING CONDITIONS 44
The author of this report cannot accept responsibility for legal matters, questions of survey, opinions of
title, hidden or unapparent conditions of the property, toxic wastes or contaminated materials, soil or sub-
soil conditions, environmental, engineering or other technical matters which might render this property
more or less valuable than as stated herein. If it came to our attention as the result of our investigation
and analysis that certain problems may exist, a cautionary note has been entered in the body of the
report.
The legal description of the property and the area of the site were obtained from the Registry Office.
Further, the plans and sketches contained in this report are included solely to aid the recipient in
visualizing the location of the property, the configuration and boundaries of the site and the relative
position of the improvements on the said lands.
The property has been valued on the basis that the real property is free and clear of all value influencing
encumbrances, encroachments, restrictions or covenants except as may be noted in this report and that
there are no pledges, charges, lien or social assessments outstanding against the property other than as
stated and described herein.
The property has been valued on the basis that there are no outstanding liabilities except as expressly
noted herein, pursuant to any agreement with a municipal or other government authority, pursuant to any
contract or agreement pertaining to the ownership and operation of the real estate or pursuant to any
lease or agreement to lease, which may affect the stated value or saleability of the subject property or
any portion thereof.
The interpretation of the contractual agreements, pertaining to the operation and ownership of the
property, as expressed herein, is solely the opinion of the author and should not be construed as a legal
interpretation. Further, the summary of these contractual agreements are presented for the sole purpose
of giving the reader an overview of the salient facts thereof.
The property has been valued on the basis that the real estate complies in all material respects with any
restrictive covenants affecting the site and has been built and is occupied and being operated, in all
material respects, in full compliance with all requirements of law, including all zoning, land use
classification, building, planning, fire and health by-laws, rules, regulations, orders and codes of all
federal, provincial, regional and municipal governmental authorities having jurisdiction with respect
thereto. (It is recognized there may be work orders or other notices of violation of law outstanding with
respect to the real estate and that there may be certain requirements of law preventing occupancy of the
real estate as described in this report. However, such possible circumstances have not been accounted
for in the appraisal process.).
Investigations have been undertaken in respect of matters which regulate the use of land. However, no
inquiries have been placed with the fire department, the building inspector, the health department or any
other government regulatory agency, unless such investigations are expressly represented to have been
made in this report. The subject property must comply with such regulations and, if it does not comply, its
non-compliance may affect the market value of this property. To be certain of such compliance, further
investigations may be necessary.
The data and statistical information contained herein were gathered from reliable sources and are
believed to be correct. However, these data are not guaranteed for accuracy, even though every attempt
has been made to verify the authenticity of this information as much as possible.

NORTHEAST PARTNERSHIP LANDS, ROCKY VIEW COUNTY, AB ASSUMPTIONS AND LIMITING CONDITIONS 45
The estimated market value of the property does not necessarily represent the value of the underlying
shares, if the asset is so held, as the value of the shares could be affected by other considerations.
Further, the estimated market value does not include consideration of any extraordinary market value of
the property, unless the effects of such special conditions, and the extent of any special value that may
arise therefrom, have been described and measured in this report.
Should title to the real property presently be held (or changed to a holding) by a partnership, in a joint
venture, through a co-tenancy arrangement or by any other form of divisional ownership, the value of any
fractional interest associated therewith may be more or less than the percentage of ownership appearing
in the contractual agreement pertaining to the structure of such divisional ownership.
In the event of syndication, the aggregate value of the Limited Partnership interests may be greater than
the value of the freehold or fee simple interest in the real estate, by reason of the possible contributory
value of non-realty interests or benefits such as provision for tax shelter, potential for capital appreciation,
special investment privileges, particular occupancy and income guarantees, special financing or
extraordinary agreements for management services.
Should the author of this report be required to give testimony or appear in court or at any administrative
proceeding relating to this appraisal, prior arrangements shall be made therefore, including provisions for
additional compensation to permit adequate time for preparation and for any appearances which may be
required. However, both neither this nor any other of these assumptions and limiting conditions is an
attempt to limit the use that might be made of this report should it properly become evidence in a judicial
proceeding. In such a case, it is acknowledged that it is the judicial body which will decide the use of this
report which best serves the administration of justice.
Because market conditions, including economic, social and political factors, change rapidly and, on
occasion, without notice or warning, the estimate of market value expressed herein, as of the effective
date of this appraisal, cannot necessarily be relied upon as any other date without subsequent advice of
the author of this report.
The co-signing appraiser has not necessarily inspected the subject property or any other property
referred to in the report. The function of the co-signer's review was to check the reasonableness of the
analysis.
The value expressed herein is in Canadian Dollars.
Per our Letter of Engagement, the Client expressly agrees that its sole and exclusive remedy for any and
all losses or damages relating to this agreement or the appraisal shall be limited to the amount of the
appraisal fee paid by the Client. In the event that the Client, or any other party entitled to do so, makes a
claim against C&W or any of its affiliates or any of their respective officers or employees in connection
with or in any way relating to this engagement or the appraisal, the maximum damages recoverable from
C&W or any of its affiliates or their respective officers or employees shall be the amount of the monies
actually collected by C&W or any of its affiliates for this assignment and under no circumstances shall any
claim for consequential damages be made.
This report is only valid if it bears the original signature of the author.

NORTHEAST PARTNERSHIP LANDS, ROCKY VIEW COUNTY, AB GLOSSARY OF TERMS AND DEFINITIONS 46
GLO S S ARY O F TERM S AND DEF IN IT IO NS
DEFINIT IONS OF VALUE , INTEREST APPRAISED AND OTHER TERMS
M ARKET VALUE
The Canadian Uniform Standards of Professional Appraisal Practice (The Standards) adopted by the Appraisal
Institute of Canada define Market Value as:
“The most probable price which a property should bring in a competitive and open market under
all conditions requisite to a fair sale, the buyer and seller each acting prudently and
knowledgeably, and assuming the price is not affected by undue stimulus.”
Implicit in this definition is the consummation of a sale as of a specified date and the passing of title from seller to
buyer under conditions whereby:
1. Buyer and seller are typically motivated;
2. Both parties are well informed or well advised and acting in their own best interests;
3. A reasonable time is allowed for exposure in the market;
4. Payment is made in cash in Canadian dollars or in terms of financial arrangements comparable
thereto; and
5. The price represents the normal consideration for the property sold, unaffected by special or
creative financing or sales concessions granted by anyone associated with the sale.
M ARKET RENT
The most probable rent that a property should bring in a competitive and open market reflecting all conditions and
restrictions of the specified lease agreement including term, rental adjustment and revaluation, permitted uses,
use restrictions, and expense obligations; the lessee and lessor each acting prudently and knowledgeably, and
assuming consummation of a lease contract as of a specified date and the passing of the leasehold from lessor to
lessee under conditions whereby:
1. Lessee and lessor are typically motivated.
2. Both parties are well informed or well advised, and acting in what they consider their best
interests.
3. A reasonable time is allowed for exposure in the open market.
4. The rent payment is made in terms of cash in Canadian dollars, and is expressed as an amount
per time period consistent with the payment schedule of the lease contract.
5. The rental amount represents the normal consideration for the property lease unaffected by
special fees or concessions granted by anyone associated with the transaction.
NORTHEAST PARTNERSHIP LANDS, ROCKY VIEW COUNTY, AB GLOSSARY OF TERMS AND DEFINITIONS 47
CONDOMINIUM INTEREST
An estate in real property consisting of an individual interest in a condominium unit, together with an undivided
common interest in the common areas such as the land, parking areas, elevators, stairways, and the like.
VALUE AS IS
The value of specific ownership rights to an identified parcel of real estate as of the effective date of the appraisal;
relates to what physically exists and is legally permissible and excludes all assumptions concerning hypothetical
market conditions or possible rezoning.
CASH EQUIV ALENCE
A price expressed in terms of cash, as distinguished from a price expressed totally or partly in terms of the face
amounts of notes or other securities that cannot be sold at their face amounts. Calculating the cash-equivalent
price requires an appraiser to compare transactions involving atypical financing to transactions involving
comparable properties financed at typical market terms.
EXPOSURE T IME AND MARKETING T IME
EXPOSURE T IME
Under Paragraph 3 of the Definition of Market Value, the value opinion presumes that a reasonable time is
allowed for exposure in the open market. Exposure time is defined as: “The length of time the property interest
being appraised would have been offered on the market prior to the hypothetical consummation of a sale at the
market value on the effective date of the appraisal.” Exposure time is presumed to precede the effective date of
the appraisal.
The reasonable exposure period is a function of price, time and use. It is not an isolated opinion of time alone.
Exposure time is different for various types of property and under various market conditions. It is a retrospective
opinion based on an analysis of past events, assuming a competitive and open market. It assumes not only
adequate, sufficient and reasonable time but adequate, sufficient and a reasonable marketing effort. Exposure
time and conclusion of value are therefore interrelated.
Based on our review of investor surveys, discussions with market participants and information gathered during
the sales verification process, a reasonable exposure time for the subject property at the value concluded within
this report would have been three to nine months.
This assumes the current owner would have employed an active and professional marketing plan.
M ARKETING T IME
Marketing time is an opinion of the time that might be required to sell a real property interest at the concluded
market value level. Marketing time is presumed to start during the period immediately after the effective date of an
appraisal. (Marketing time is subsequent to the effective date of the appraisal and exposure time is presumed to
precede the effective date of the appraisal). The opinion of marketing time uses some of the same data analyzed
in the process of developing a reasonable exposure time opinion as part of the appraisal process and it is not
intended to be a prediction of a date of sale or a one-line statement.
We believe, based on the assumptions employed in our analysis and our selection of investment parameters for
the subject, that our value conclusion represents a price achievable within six (6) months.
NORTHEAST PARTNERSHIP LANDS, ROCKY VIEW COUNTY, AB CERTIFICATION OF APPRAISAL 48
CERT IF IC AT ION O F AP P RAIS AL We certify that, to the best of our knowledge and belief:
The statements of fact contained in this report are true and correct.
The reported analyses, opinions and conclusions are limited only by the reported assumptions and
limiting conditions, and are our personal, unbiased professional analyses, opinions and conclusions.
We have no present or prospective interest in the property that is the subject of this report, and we
have no personal interest or bias with respect to the parties involved.
Our compensation is not contingent upon the reporting of a predetermined value or direction in value
that favours the cause of the client, the amount of the value estimate, the attainment of a stipulated
result, or the occurrence of a subsequent event.
Our analyses, opinions and conclusions were developed, and this report has been prepared, in
conformity with the Canadian Uniform Standards.
Sheena Kereliuk inspected the property that is the subject of the report before December 31, 2015.
David Y.T. Shum did not inspect the subject property.
No one other than the undersigned provided significant professional assistance to the persons
signing this report.
The value estimate contained in this report applies as of December 31, 2015. This date may be
referred to as the effective date of valuation.
The Appraisal Institute of Canada has a Mandatory Recertification Program for designated members.
As of the date of this report, David Y.T. Shum, has fulfilled the requirements of the program, and is a
member in good standing. Sheena Kereliuk is a candidate member of the Appraisal Institute of
Canada.
David Y.T. Shum is a licensed appraiser under the Real Estate Act of Alberta. Sheena Kereliuk is a
licensed candidate appraiser under the Real Estate Act of Alberta.
The reader’s attention is specifically directed to the Valuation Assumptions outlined in the Executive
Summary as well as the Extraordinary Assumptions and Hypothetical Conditions outlined on Page 2.
F INA L ES TIMA TE O F VALUE
Having regard to all of the information contained in this report, it is our opinion that the current market value of the
subject property, at the effective date of valuation was:
TWENTY MILLION ONE HUNDRED FORTY THOUSAND DOLLARS
$20,140,000
This value estimate is based on an exposure period of six to twelve months.

NORTHEAST PARTNERSHIP LANDS, ROCKY VIEW COUNTY, AB CERTIFICATION OF APPRAISAL 49
The economy of Alberta is dominated by the oil and gas sectors, and the performance of real estate in many
markets across the province is directly and substantially linked to the health of these two resource-based
industries. Over the past 6 months, the price of oil has declined by approximately 45%, and there is concern
across the oil-producing communities as to the future direction and well-being of the oil industry in North America
generally, and in Alberta in particular. Cushman & Wakefield is unable to determine the long-term price of oil or its
impact on the future of the sector in Alberta, but caution the reader that any prolonged period of low oil prices
could have a negative impact on real estate, demand in the province and a possible material impact on the
subject valuation.
December 22, 2015
Sheena Kereliuk, B.Comm, PGCV. Date
Consultant
December 22, 2015
David Y.T. Shum, AACI, P.App. Date
Managing Director, Western Canada