applying process mining for loan approvals in a banking ... applying process mining for loan...
TRANSCRIPT

Applying Process Mining for Loan Approvals ina Banking Institution
Andres Carvallo, Cristobal Henning, Dasen Razmilic, Regina Reyes Lopez,Jonathan Lee, Juan P. Salazar Fernandez, and Michael Arias
Computer Science Department, School of EngineeringPontificia Universidad Catolica de Chile, Santiago, Chile
[afcarvallo, cahenning, dirazmilic, rreyes4, wllee, jpsalaza, m.arias]@uc.cl
Abstract. The BPI Challenge 2017 provides a real-life event log com-posed by loan applications and offers, generated by a bank to analyzethe data and improve their processes. This paper analyzes the through-put times of the process, in particular the difference between the timespent in the company’s systems waiting for processing by a user andthe time spent waiting for an input from the applicant. Moreover, weevaluated the influence of the frequency of incompleteness on the finaloutcome and if the quantity of offers requested by the customer matters.Other interesting trends are analyzed, such as efficient use of resources,business rules compliance and identification of behavioral patterns at dif-ferent times of the day. Results show that a lack of customer requests forcompletion does not improve the credit approval rate and that this ratedecreases when there are more offers. Also, the more the users engagein the case, the greater the approval rate, but the throughput times getlonger as well.
Keywords: process mining, process analysis, loan applications, behav-ioral patterns, business rules
1 Introduction
Companies are aware that better information management translates into in-creased productivity. With this objective in mind, tools and solutions are con-stantly being developed to allow them to speed up the management of data gen-erated everyday, allowing a better management of time and a greater use of theresources [1, 3, 6]. Process Mining can be seen as the bridge between data scienceand process science [4], where knowledge could be extracted from the recordsof events associated with a process. Although there are many available toolsthat support the process analysis, a detailed analysis would help to understanda prior implemented process, which could contribribute to reduce inefficienciesand improve the process performance.
The BPI Challenge 20171 is an opportunity to apply different tools andalgorithms to a real life process. This year, the challenge is focused on a bankinginstitution, which is particularly interested in answers to the following questions:
1 https://www.win.tue.nl/bpi/doku.php?id=2017:challenge

2
1. What are the throughput times per part of the process, in particular thedifference between the time spent in the company’s systems waiting for pro-cessing by a user and the time spent waiting on input from the applicant.
2. What is the influence on the frequency of incompleteness to the final out-come. The hypothesis here is that if applicants are confronted with morerequests for completion, they are more likely not to accept the final offer.
3. How many customers ask for more than one offer (where it matters if theseoffers are asked for in a single conversation or in multiple conversations)?How does the conversion compare between applicants for whom a single offeris made and applicants for whom multiple offers are made?
4. Any other interesting trends, dependencies etc.
The aim of this paper is to address the proposed questions and give detailedfeedback of the process, in order to provide another point of view of the processto the bank. This might prove useful if they want to make improvements in theirinternal processes, improve the allocation of resources, or even implement newcommunication strategies inside and outside the organization.
The paper is structured as follows. Section 2 provides a brief overview ofthe data description and filtering steps. Section 3 addresses the preliminary di-agnosis of the process through the data. The throughput times area analyzedin Section 4. The influence on the frequency of incompleteness to the final out-come are presented in Section 5. Section 6 shows the impact of multiple offersregarding loan applications. Section 7 describes the influence of the human fac-tor in the throughput times and application outcomes. Section 8 gives a list ofrecommended business rules for the process and checks their compliance. Rec-ommendations to improve the process are given in Section 9. Finally, Section 10presents the conclusions.
2 Log analysis, process familiarization and data filtering
The data is composed of offer applications and offers available in an event logcomprised of a total of 1,202,267 events, with 31,509 loan applications and 42,995offers over a period from 2016 to February 2017. Also, the contest gives additionaldata like the requested loan amount, application type, reason the loan was appliedfor, offered amount, initial withdrawal amount, number of payback terms agreedto, monthly costs, credit score of the customer, the employee who created theoffer, whether the offer was selected and whether the offer was accepted by thecustomer.
After a preliminary analysis it was found that each event passes throughdifferent stages. In the case of applications and offers, they only transit throughthe complete state, while workitems transit through seven states: schedule, start,suspend, resume, withdraw, complete and ate abort. Figure 1 helps to illustratethe transitions between states.
The data contains three types of events, namely Application state changes,Offer state changes and Workflow events. Table 1 shows the event types and the

3
Fig. 1: Transition of activitys states [2].
personal of the authors, also considering the ideas provided by domain expertsthrough the available forum about the topic of the challenge.
After analyzing the information and reviewing the clarifications made byexperts domain, we elaborated a process diagram with the aim of achieving abetter understanding of the process. The diagram is shown in Figure 2.
Fig. 2: General flow diagram of the process.
The first step afterwards was to analyze the log. Inicially, the given log wasreally complex and difficult to visualize. There was a lot of noise, activities thatwere redundant with others and even some incomplete cases. Therefore, in orderto simplify the data without losing crucial information, the log was preprocessedusing a custom made Python script that removed duplicated activities (activitiesthat occurred at the same time), for example as ocurred with O Created andO Create Offer.
As a second step, three endpoints were identified (see Figure 2). These end-points are: A Cancelled, A Denied and A Pending. As a result, the Python scriptwas also modified to remove all events following these endpoints. The removedactivities were mainly associated with the automated closing of other activities,so removing them did not affect the process. Finally, when filtering the log, 98

4
Table 1: Description of eventsEvent type Description
Application (A) Refers to the application itself. Indicates the application’s status.
Initial steps:Create application: Client or employee initiates an application.Submitted: Client submits an application through the website.Concept: Application gets an early evaluation.Accepted: Application is accepted after evaluations.
Development steps:Complete: Application is complete and ready to be offered.Incomplete: Application lacks or has erroneous information.Validating: After an offer is chosen, the application is reevaluated rigorously.
Final steps:Pending: Loan is approved.Denied: Application does not meet the acceptance criteria and is rejected.Cancelled: The client cancels the application or does not send the needed information.
Offer (O) Refers to the offers of an application. Indicates the offer’s status.
Initial steps:Created offer & Created: Offer is created. They are consecutive dependent events.
Development steps:Sent: Offer is sent by a communication channel.Returned: Offer is selected by the client and they have sent the information back tothe institution.
Final steps:Accepted: Offer is chosen by the client and the bank evaluated the approval criteriasatisfactorily.Refused: Application has been rejected by the bank, so any offer created is rejected.Cancelled: Offer is cancelled if the application is cancelled or approved but withanother offer.
Work flow (W) Refers to the manual work that employees must perform, whether through calls,research, evaluation or others.
Complete application: Employee calls the customer to complete the applica-tion after it has been evaluated.Validate application: Employee validates the information given for the application.Call: Employee calls the customer to remind offers have been sent or to ask formissing information.Assess potential fraud: Employee investigates an application suspicious of fraud.

5
incomplete cases were identified. After analyzing their dates, they were classi-fied as applications, that at the time of log extraction had not yet reached anendpoint, so they were also removed. After applying the aforementioned steps,a new log was generated, composed by 538,071 events, with 31,411 cases and4,036 execution variants. All further analysis is done using the preprocessed log,unless stated otherwise.
3 Process analysis: general overview
Our next step was discovering the process. To do that, we used Celonis2 tool. Theobtained process graph is shown in Figure 3. It can be seen that loan applicationsare sent to the bank through the web page (A Submitted) or directly from thebank offices. Then, there is a pre evaluation of the loan (A Concept) and a callto make the final evaluation (W Complete application). When the applicationreaches this point it is on an accepted status (A Accepted). Then, the clientasks for at least one offer. If it is possible, the bank makes one or more offers(O Create offer). After that, the customer is called to remind him of the offers,and from this point the application reaches the complete status (A Complete).Then, the process enters a second stage. In this part, the institution has to waitfor the clients response, if the client sends the information needed, the applicationpasses through different states (A Validating, A Incomplete, A Denied), whichinvolve some manual tasks like W Validate application and W Call incompletefiles. After this, the bank validates the application again and asks the client formore background for the credit loan, if it is necessary. Finally, if everything goeswell, the application reach the status approved (A Pending). If the client doesnot make contact after the application is complete (A Complete), the final resultis a cancelled application (A Cancelled).
It should be noted that some activities of the process are not shown in theprocess graph (Figure 3), such as: W Shortened completion (occurs 74 times),W Asses potential fraud (occurs 301 times) and W Personal Loan collection (oc-curs 2 times). These activities are not analyzed here, due to their low frequencyand because they are activities that are characteristic from the bank sector andevery institution has its own internal rules to handle. Also denied applications(those that pass through A Denied are not deeply analyzed because the bankhas its own policy to deny loans, aiming to protect their business interests.
3.1 Preliminary diagnosis of the process
In order to obtain interesting findings, an exploratory analysis of the process wasdone. This analysis consisted in getting the amount of cases that ended with eachof the endpoints defined in Section 2. Afterwards, a filter was applied to separatecases submitted by the client through the web application and cases submitted
2 http://www.celonis.com/

6
Fig. 3: General process graph of the offer complete process using Celonis.

7
by the bank, the first of these cases included the event A Submitted. The resultsare displayed in Table 2. It can be seen that there is a high cancellation rate,10,431 cases of 31,411 are cancelled, that is 33.2% of applications. Also, globally54.8% of cases end up being approved, but an interesting part of the results is tocompare Web applications with bank applications. Also, we can see that approvalrate is greater for bank applications (64.7% vs 49.5%), whereas cancellation rateis greater in web applications (37.2% vs 25.8%).
Table 2: Global statistics of the processGlobal % Web % Bank %
Approved 17,228 54.8 10,064 49.5 7,164 64.7
Cancelled 10,431 33.2 7,573 37.2 2,858 25.8
Denied 3,752 12 2,702 13.3 1,050 9.5
Total 31,411 20,339 11,072
In addition, the most frequent variations are analyzed using the Trace Align-ment plugin available in ProM tool3 (version 6.6.2). Figure 4 shows that themost frequent trace alignment with 11.44% of traces and starts with A Createapplication, A Submitted, A Concept, W Complete application and then if theapplication is accepted the offer is created and the email is sent to the client.After that, the bank tries to contact the customer through a phone call. Finally,the application is completed and in most cases the process finishes cancelled.
Fig. 4: Trace alignment of the process using ProM 6.6.2.
4 Throughput times
This section addresses the first question proposed in the challenge: What are thethroughput times per part of the process, in particular the difference betweenthe time spent in the company’s systems waiting for processing by a user andthe time spent waiting for input from the applicant?
3 http://www.promtools.org/

8
In order to analyze the applications processing times, we decided to ana-lyze them according to their endpoints. To do that, we used the Disco4 tool.The applications were grouped in two types using a filter: the satisfactory, allthose applications that were approved (ended up with A Pending), and unsat-isfactory, those that have been denied or cancelled (ended up with A Denied orA Cancelled).
As shown in Figure 5, the average time taken for an application to be approvedis 18.1 days. It was observed that one of the most demanding activities is theanalysis of fraud. However, this happens only in 104 occasions, thus it was notconsidered a bottleneck. However, when analyzing the waiting times related tothe client, it was observed that these are the ones that lengthen the processingtime. In approved cases, it can be seen that clients take 8.7 days (connectionbetween A Complete and W Complete application) on average to send the nec-essary information for the bank to validate the application. It takes as well 57.6hours (connection between A Incomplete and W Validate application) on aver-age for clients to send the pending information, if the application is tagged asincomplete.
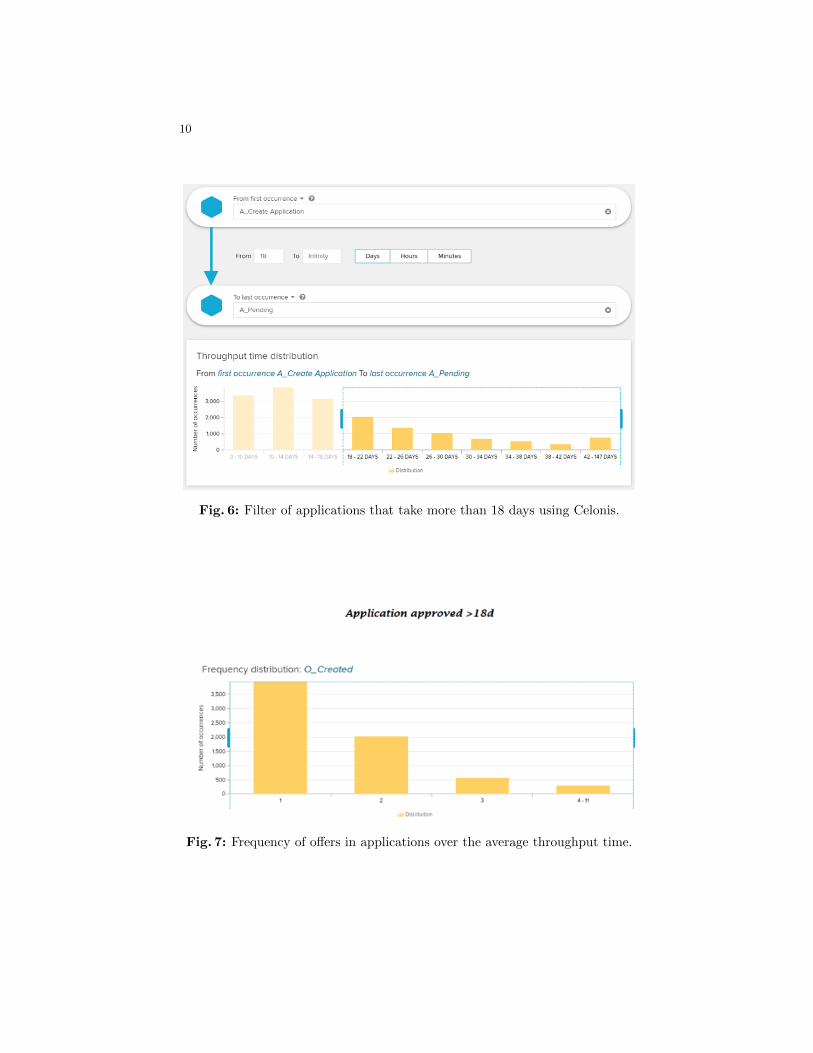
After getting these results a deeper analysis was done to identify whether ornot multiple offers influence processing times. To accomplish this, two filters wereapplied using Celonis. The first filter was used to separate cases with through-put times above the average of 18 days from those with throughput times belowthat average. The second filter was used to analyze the amount of offers createdin each case. When comparing approved cases that are above the average of 18days, (see Figure 6), an interesting finding was identified: applications that takethe longest time (see Figure 7) tend to have more offers than those that arebelow the average, as shown in Figure 8.
After analyzing cancelled applications, it was observed (see Figure 9) that theaverage time is 29.9 days. Additionally, in 76.74% of cases it takes 27.4 days(connection between A Complete and A Cancelled) on average to issue the can-cellation status, as noticed in Figure 9. This is mainly because customers donot send any response about the offers. Also it can be seen that there are otheractivities that consume a lot of time, like fraud analysis, but the frequency ofoccurrence of these is very low (104 occurrences), reason why they are not consid-ered as critical factors. It is recommended though not to neglect these activitiesif the times or frequencies change.
Although it has been pointed out that the biggest proportion of processing timeis due to waiting for client’s responses, it was decided to analyze the activ-ity W Validate application as it was noticed that it was a bottleneck both inapproved cases and cancelled ones. Figure 5 illustrates that W Validate appli-cation takes on average 14.2 hours for approved applications whereas Figure 9shows that the same activity takes 29.4 hours on average for cancelled applica-
4 https://fluxicon.com/disco/

9
Fig. 5: Statistics and process flow for approved applications using Disco.
10
Fig. 6: Filter of applications that take more than 18 days using Celonis.
Fig. 7: Frequency of offers in applications over the average throughput time.

11
Fig. 8: Frequency of offers in applications below the average throughput time.
tions. Also, the activity validation of the application requires contact with theclient and waiting for a response to obtain more background information to val-idate the correct delivery of the credit in process. These take an average of 8.7days (connection between A Complete and W Validate application) to receivean answer from the client. This shows that this particular part of the processis definitely inefficient. In order to reduce these waiting times and improve theprocess efficiency, it is recommended to improve communication with the client.The background information should be requested when the credit applicationbegins because most of the time it is returned for a new validation. Accordingto internal processes, there are really efficient tasks, like for example submittingloan applications, offer creation, and internal validation.
Additional analysis on the W Validate application activity presents that thisactivity comes from another validation in 97% of the cases and is performedmostly between 8:00 am and 2:00 pm, as shown in Figure 10. Perhaps, theschedule for requesting further background should be in the afternoon ratherthan between 8:00 am and 2:00 pm. This may be a good strategy to increasethe customer’s response rate. One alternative is adding more validation activitiesbetween 4:00 pm and 6:00 pm. As it can be seen in Figure 11, there are two loopsof activities. One of them is calling after credit offers that needs the approvalof the client to continue the process. The other is the one that was mentionedbefore related to the validating and return activities. Most of the time, the callsfor incomplete files come and go to the same activity. This means that there isno success in asking for a deeper customer background. These activities have asimilar behavior in the schedules of realization.
In summary, customers are the ones who contribute the most to the process-ing time of applications, mainly in activities that involve sending informationand taking a decision about an offer.

12
Fig. 9: Throughput time of cancelled applications.

13
Fig. 10: W Validate application times by hours of day.
Fig. 11: A Complete returned after W Call after offers and A Validating toO Returned loop using Celonis.

14
5 Influence on the frequency of incompleteness to thefinal outcome
This section addresses the following question: What is the influence on the fre-quency of incompleteness to the final outcome? The hypothesis presented by thebank is that if applicants are confronted with more requests for completion, theyare more likely not to accept the final offer. To answer the question, frequencyof incompleteness was defined as the amount of A Incomplete activities in eachcase. The first approach was filtering the log by the endpoints defined in Sec-tion 2, and by presence of incompleteness (at least 1). After filtering cases bythe three possible outcomes and the presence or absence of incompleteness thebank’s hypothesis was dismissed.
The results of the previous analysis that dismissed the bank’s hypothesis aredisplayed in Table 3. There it can be noticed that the percentage of cases endingcancelled (dropped by the client) is greater than the percentage of cases whichended in A Pending when there is no incompleteness, whereas in cases wherethere is presence of incompleteness, there are more cases ending with A Pendingthan cancelled.
Table 3: Global statistics of complete and incomplete casesIncomplete % Complete %
A Pending 12,647 84.5 4,581 27.8
A Cancelled 955 6.3 9,476 57.6
A Denied 1,356 9.2 2,396 14.6
Total 14,958 16,453
After analyzing the influence of the presence of incompleteness on the finaloutcome, it was necessary to analyze the influence of incompleteness frequency.To achieve this, a second filter was applied to the log using Disco. This time,cases were filtered by the amount of A Incomplete they had (multiple occurencesmean the application remains incomplete after additional information was given)and their outcome.
Results of this analysis are shown in Figure 12, where it can be seen thatthe amount of cases which end with A Pending decreases as the frequency ofA Incomplete increases (in cases where there is presence of incompleteness). Anearly conclusion to explain this might be that clients get tired of having to fetchextra documents and send them. But the reduction of approved cases can alsobe explained by the fact that cases with more A Incomplete are less likely to befound than cases with less of this activity. Cases with four or more A Incompleteare actually pretty rare.
In order to perform a deeper analysis, for each frequency of A Incomplete thepercentage of each outcome was calculated regarding the total amount of casesfor that frequency and interesting conclusions were drawn. As can be seen in Fig-

15
ure 13, the percentage of A Pending increases as the amount of A Incomplete in-creases, which is quite the opposite to the hypothesis presented by the challenge.It is also posible to see that the proportion of cases which end in A Cancelledhas its maximum where there are no A Incomplete activities, and drops downas the frequency of incompleteness increases. From this last observation it canbe concluded that clients do not get tired when the bank asks them to bring inmissing documents, or at least it does not affect the outcome of the case. It canalso be said that clients actually get more engaged with finishing the process(not dropping the application) as the frequency of incompleteness rises, as ifthey had already invested too much effort on the application to drop out of theprocess.
Fig. 12: Number of cases of each outcome for each frequency of incompleteness.
6 Impact of multiple offers in an application
The last questions proposed by the challenge were: How many customers askfor more than one offer (where it matters if these offers are asked for in a singleconversation or in multiple conversations)? How does the conversion comparebetween applicants for whom a single offer is made and applicants for whommultiple offers are made?
To analyze the offers, the behavior of the different offers for each applicationwas identified. The offer log was used to apply a rework filter using Celonis. Fig-ure 14 shows how offers vary from 1 to 10 per case. In addition, the relationshipbetween the number of offers and the final result of the process was identified.These relations can be seen in Figure 15. According to the obtained results, whenthere is a bigger amount of offers, clients tend to accept less offers and it takesthem more time to decide. The decision time was measured from the momentthe offer is created until the client returns the signed offer.

16
Fig. 13: Proportion of each outcome for each incompleteness frequency.
Fig. 14: Frequency of offers by applications.

17
Fig. 15: Multiple offers and throughput time (number of offers vs approvedapplications).
To check if there is any effect on the offers where they are requested during asingle or multiple conversations, applications of multiple offers were divided intwo groups: customers who wait a week to request another offer and those whotake more than a week. For this analysis, two filters using Celonis were applied,Rework and Throughput time selection. Figure 16 shows there is apparently norelationship between the acceptance of the offer and the time window when theyare requested. It can be seen that applications with multiple offers made in arapid succession have a rate of approval of 53.9% (of 8,280 total cases) while theother group has a rate of 66.7% (of 5,047 total cases). This means that raisingor limiting the number of calls per client is not needed, but instead is advisableto contact them earlier. More details about this phenomenon will be explainedin Section 7.
7 Human factor on process performance
There is an interest to characterize the influence of human factor on processperformance. Human factor is associated with high variability in the execution ofthe process [5]. Given the characteristics of the loan application process analyzed,two human roles can be identified: clients and bank employees. Thus, checkingthe influence of these roles on the process throughput time and final outcomewould be an interesting analysis. This section is divided in three parts. Thefirst part addresses the influence of clients’ behavior on the process. The secondone, the influence of employees. Finally, the third part gives an organizationalanalysis of resources.

18
Fig. 16: Offers relation with calls.
7.1 Clients behavior influence
One of the results obtained in Section 4 shows that a major proportion of cus-tomers abandoned the application after an offer was sent to them. For this reason,behavior patterns associated with customer response were analyzed. First, can-celled applications were analyzed, and it was observed that about 90% of themwere cancelled after 30 days, because once the offers have been sent and theapplication is completed, the client did not answer. Next, approved applicationswere analyzed and a simple but crucial observation was found: in these appli-cations clients have to contact back the bank at some point. A question thatsurged after that was: how long does it take for clients who are really interestedin finishing the application process, to contact back the bank after the offers aresent?
In order to perform this analysis, we used Celonis to apply the defined filters.The first of them was used to leave only the cases that had the W Validateapplication activity, because the presence of this activity means that the clientcontacted back the bank at least once. The next filter applied was throughputtime between activities, between the activity A Complete and the first occurrenceof W Validate application, to determine response times of clients.
Fig. 17: Clients’ decision time.

19
Results of the previous analysis are shown in Figure 17. It can be seen how inmost of the cases where clients gives an answer, they do it within 15 days afterthe offers were sent. Summarizing, 18,761 out of 21,825 applications (85%) wereanswered within those 15 days, with an average response time of 7 days. It canbe said that clients who do not contact back the bank within this time are likelynot to finish the process and less bank resources should be allocated to thosecases.
7.2 Resources influence
Considering that there is a large number of resources involved in the process andthe human factor is decisive in approaching the client, the influence of resources isanalyzed. With this goal in mind, two analysis were done. The first to determinethe resources’ influence in the throughput time and the second one to determinethe influence in the outcome of the process.
To perform this analysis, a Celonis filter was applied to leave only applica-tions that ended up being approved. Then a throughput time filter was appliedto group cases that were above the average time and those that were below it.Afterwards, to get how many resources intervene in each case, a social analysiswas done with Celonis, which has a tool fitting for this purpose. The resultsare shown in Figure 18, where it can be observed that slow cases tend to passthrough a range between 10 and 15 users with an average of 10. While in fastercases they are manipulated by a range between 7 and 8 resources.
Fig. 18: Development users per case for approved applications
To carry out the second analysis, cases were separated in two groups with afilter: approved and cancelled applications. Then, since the majority of approvedapplications pass through validation and incompleteness activities and cancelledapplications do not pass through these activities, we took only activities from

20
A Create application to A Complete. Then, for each group we separated the ap-plications according to the endpoint A Pending and A Cancelled, and a socialanalysis was performed. Results are shown in Figure 19, which shows that can-celled cases tend to have a lower diversity of resources with a number of 5, whilethose approved have an average of 9.
After considering the results of these two analysis, it can be inferred thatthere is a trade-off between the processing time and the success of the cases, interms of resource influence. Successful cases have a greater participation rate ofusers than those that were cancelled. Also, it is normal that the processing timeincreases when more users intervene. After all, the transfer of the case from oneuser to another implies higher response times due to work handover and queuedtime.
Fig. 19: Development users per case for complete applications
7.3 Organizational analysis of resources
As shown in Subsections 7.1 and 7.2, resources do influence the throughputtime of the process and the final outcome. Thus, we decided to analyze thejob distribution and performance analysis. To accomplish the job distributionanalysis, Celonis’s social analysis was used. It was sought to get the behaviorof resources inside the bank and how the different activities were distributedbetween the resources (see Figure 20). The first conclusion reached was thatUser 1 was the system, where all credit requests and loan results are enteredand passed to the resources, because they had a huge proportion of the workand at unusual times, outside office hours.
In addition, the resources are grouped by the activities that were executedby them in the process. To achieve this, ProM’s Mine of Handover of SocialNetwork plugin was used. As a result (see Figure 21), five clusters were found,which are: the system, fraud cluster, application cluster, offer cluster, and the

21
Fig. 20: Resource distribution of activities without considering User 1 usingCelonis.
user that connects the offer and application clusters. The labels give a generaldescription of the type of activities they perform.
Furthermore, the performance of the resources according to the identifiedroles was analyzed. Taking into account activities involving manual labor, threeactivities that are time-consuming were identified: W Validate application, W Callincomplete files and W Assess potential frauds, noting that the latter was nottaken in consideration. Using Disco, activities were filtered in an exclusive way,creating 2 sublogs, which only contained the selected activities. Then, Celoniswas used to perform the social analysis for each sublog (W Validate applicationin Figure 22a, and W Call incomplete files in Figure 22b. Three limiting re-sources were identified (Users 99, 68 and 30 ), since they used a greater amountof time in those activities compared to other resources. It is advisable to analyzein depth the internal steps of each activity, with the goal of being pragmaticenough to conclude that these resources must be trained to gain a better per-formance.

22
Fig. 21: Organization activity clusters using ProM.
(a) Number of cases (b) Number of resources
Fig. 22: Performance analysis
8 Business rules compliance
As demonstrated in Section 7, employees influence the two points analyzed(throughput time and final outcome). However, given the nature of the sector in

23
which the analyzed process is developed, it is highly vulnerable to corruption andmalpractice. We proceed in this section to analyze the compliance with possiblebusiness rules. Section 8.1 discusses business rules associated with resources, andSection 8.2 explores business rules associated with process flow.
8.1 Resources
An analysis was conducted to determine if there were resources who carried outactivities in the same case that can be provided to infringe compliance withethics and values. This analysis was performed over the 538,072 cases, wherethe activities of W complete and W validating were filtered, obtaining 69,390cases, corresponding to 12.8% of the total. Additionally, a filter is applied tocheck if the same resource and the same case id match for the previously filteredactivities and thus obtain if the same resource does the same act of completingand validating, which violates this business rule. The evaluation and validationof loan applications should be done by two different resources to avoid conflictsof interest.Similarly the presentation of the final offers and the validation of theloan applications should not be done by the same resource.
Table 4: Common resources for completing and validating activities.Common resources Case ID Activities
7575102102109100
927205634178687427411914083081582198848742871702454790674
W Complete applicationW Validating
Following with the previous analysis, W Create and O Created activities arefiltered, obtaining 72,821 cases. After that, the cases are filtered if the sameresource and the same case id do the same activity to detect if there is aninfringement of these business rule.
It can be seen in Table 4, that four resources do both assessment and vali-dation activities, which can be prone to frauds and infringes the business rule.Table 5 shows that 19 resources do both validation and final offer creation ac-tivities, violating this business rule.
8.2 Process flow
After analyzing the process flow (shown in Figure 2), as well as the logic of theprocess, the following hypothesis were proceeded to be validated. First, if allapplications that have been accepted were previously evaluated. Next, if W Callafter offers activity has an impact on process time and if there is a significant

24
Table 5: Common resources for completing and offer creation activities.Common resources Activities
3, 5, 14, 18, 19,24, 29, 30, 34, 35,41, 49, 75, 87, 95,99, 100, 102, 109
W Complete applicationO Created
difference between applications that pass through this activity and those whodo not.
Figure 23 shows a process graph where it can be seen that 1,861 cases donot comply with the first hypothesis. Meanwhile, it was found that 86 resourcesintervene in those cases (resources that accept the request even though it hasnot been evaluated).
To address the second hypothesis the data was analyzed and it was observedthat the vast majority of the applications pass through W Call after offers.Nevertheless, only 341 cases reach the complete state. Assuming that completingthis activity implies that it was possible to talk with the client, it was observedthat regardless of the endpoint at which the process arrives, the processing timedecreases to 8 days on average. As a result, it can be concluded, that completingthis activity adds value to the process, since clients tend to decide faster, eitherto accept or cancel an offer.
Another interesting finding, is that there is a positive relation to the incom-pleteness of information in the validation activity, as seen in Table 6. This conclu-sion is reached since 80.4% of these applications pass through the A Incompletestate, whereas the applications where they comply with the analyzed sequence,only 50% pass through the A Incomplete state. It can be concluded that the eval-uation of the application influences the completeness in information for the stepvalidation. In other words, a case that passes through W Complete applicationhas a positive impact on the completeness of the information in the W Validateapplication step.
Table 6: Cases where W Complete application are followed by A AcceptedItem Not followed by A Accepted % Followed by A Accepted %
Cases where W Complete 1,861 31,726Pass through A Incomplete Pass through A Incomplete
Cases where W Complete 1,496 80% 15,638 50%
9 Recommendations
In order to improve the loan applications process presented by the BPI Challenge2017, it would be interesting to take into account the following recommendations:

25
Fig. 23: Skipping of W Complete application.
1. Conduct surveys to clients whose applications end up cancelled, only if itcan be determined what caused the desertion of these. There are multipleattributes to measure the quality of a service, according to the human re-sources’ perspective: the executive’s ability to respond to customer doubts,kindness, treatment, or even related to the product itself: flexibility to cer-tain types of customers, costs compared to competitors, flexibility of offersin terms of monthly fees and costs, availability of information online forcustomer inquiries through the web or in person. In other words, to gatherinformation that complements the analysis of the desertion of customers,since the process is not designed with this approach.
2. Enrich the metadata with sociodemographic attributes such as occupation,age, net income, type of work contract, so that together with the existingdata from the bank, profile of offers can be made according to the type ofcredit requested. This way, the number of offers can be limited to a maxi-mum of 3, with a profile that has high acceptance in a certain segment ofcustomers.
3. With the data received from the bank it was identified that the number ofusers involved in an application was a minimum of 8 and a maximum of 14.It would be interesting to know in advance which users are more capableof getting the case to an acceptable outcome. To achieve this, the creationof a pilot tests is recommended, where users are selected for each test andtheir performance on each activity can be measured, and compared to otherusers who are more experienced or have a better performance. Thus, theycan focus on improving in the activities where they had a weak performanceor only focus in doing the activities that suits them best according to theirperformance.

26
10 Conclusions
This paper analyzed the three questions proposed by the BPI Challenge 2017.There was an interest in determining whether if longer times of the process areassociated with activities performed by the bank employees, or by the clients.The result obtained is that clients take a long time to answer applications andto solve this it is recommended to apply another communicational strategy.Furthermore, this paper analyzed whether if there is a relation between thecompleteness of the application and its approval. The results showed that loanswith pending documents were accepted more often. Complete applications aremore likely to be cancelled, either by clients or the bank. The last question wasrelated to the number of clients who ask multiple offers. The greater the numberof offers, the lesser the acceptance and longer the time taken. Social networkswere analyzed and results showed that there are three clusters present.
After the organizational analysis of resources it was discovered that thereis a trade-off between throughput time and chances of a favorable outcome,depending on the number of resources that work in the case.
Analyzing response times by customers, it was determined that the vastmajority of clients with approved applications make contact within the first 15days. Thus, a recommended way to improve the general performance of theprocess, is to create a communication strategy where emphasis is placed on the15 days after the offer.
While analyzing the questions proposed by the challenge, some different ques-tions arose. When taking a process focus and valuing the possible deviations of it,there were some activities that added value to the investigation, like W Completeapplication and W Call after offers. The first analyze activity has an influence inthe incompleteness of application, and the second activity do influence through-put time of the process.
References
1. van der Aalst, W. M.: Data scientist: The engineer of the future. Enterprise Inter-operability VI 13–26 (2014)
2. van der Aalst, W. M.: Event Logs: What kind of data does process mining require?DOI 10.1007/978-3-642-19345-3 2, Springer-Verlag Heidelberg 2011.
3. van der Aalst, W. M.: Process mining in the large: a tutorial. Business Intelligence33–76 (2014)
4. van der Aalst, W. M.: Process mining: Data Science in Action. Springer (2016)5. Harrison-Broninski, K.: Human Interactions: The Heart and Soul of Business Pro-
cess Management: How People Really Work and How They Can Be Helpful toWork Better (2005)
6. Leemans, S. J., Fahland, D., van der Aalst, W. M.: Exploring processes and devi-ations. International Conference on Business Process Management 304–316 (2014)