applying a face-centered central composite design to optimize the preferential co oxidation over a...
TRANSCRIPT

ww.sciencedirect.com
i n t e r n a t i o n a l j o u r n a l o f h y d r o g e n en e r g y 3 7 ( 2 0 1 2 ) 4 7 4 9e4 7 6 1
Available online at w
journal homepage: www.elsevier .com/locate/he
Applying a face-centered central composite design to optimizethe preferential CO oxidation over a PtAu/CeO2eZnO catalyst
Sangobtip Pongstabodee a,c,*, Sutarawadee Monyanon a, Apanee Luengnaruemitchai b,c
aDepartment of Chemical Technology, Faculty of Science, Chulalongkorn University, 254 Phayathai Road, Patumwan,
Bangkok 10330, ThailandbThe Petroleum and Petrochemical College, Chulalongkorn University, 254 Phayathai Road, Patumwan, Bangkok 10330, ThailandcCenter for Petroleum, Petrochemicals and Advanced Materials, Chulalongkorn University, 254 Phayathai Road, Patumwan,
Bangkok 10330, Thailand
a r t i c l e i n f o
Article history:
Received 11 October 2011
Received in revised form
24 November 2011
Accepted 4 December 2011
Available online 3 January 2012
Keywords:
H2O and CO2 content
Preferential oxidation of CO
Statistical design of experiment
Face-centered central composite
design
* Corresponding author. Department of ChPatumwan, Bangkok 10330, Thailand. Tel.: þ
E-mail addresses: [email protected],0360-3199/$ e see front matter Copyright ªdoi:10.1016/j.ijhydene.2011.12.023
a b s t r a c t
The catalytic performance for the preferential oxidation of CO over a 1% (w/w) PtAu/
CeO2eZnO catalyst prepared by co-precipitation was investigated using a full 2k factorial
design with three central points and a 95% confidence interval, in order to screen for the
importance of the operating temperature (�C) and the H2O and CO2 contents (%) in the
simulated reformate gas on the CO conversion and selectivity. The catalyst was charac-
terized by TEM, BET, XRD and FTIR. The temperature and CO2 content had a significant
influence on the conversion, whilst the selectivity depended on the temperature only. A
face-centered central composite design was then used to evaluate the optimal conditions
by simultaneously considering the maximal conversion, selectivity and constraints of the
composition of realistic reformate gas. The difference in the estimated response and the
experimental one was within �2% and �3% for routing simulated and realistic reformate
gases, respectively.
Copyright ª 2011, Hydrogen Energy Publications, LLC. Published by Elsevier Ltd. All rights
reserved.
1. Introduction and the carbon monoxide (CO) elimination unit. A H2-rich
Hydrogen is an environmentally friendly fuel of potentially
widespread use, especially for proton exchange membrane
fuel cells (PEMFCs), which are one of the candidate energy
sources for portable power appliances and powering vehicles.
Nevertheless, the requirement of pure hydrogen for PEMFCs
and the issue of the safety of a large capacity hydrogen storage
system are the main limitations of hydrogen applications.
Thus, recently considerable attention has focused upon
producing hydrogen on-board directly. Such technology
currently uses two major units, the hydrogen production unit
emical Technology, Facu662 218 7676; fax: þ662 [email protected], Hydrogen Energy P
stream can be obtained following catalytic conversion of
methane, methanol, hydrocarbons or liquid fuels via steam
reforming, partial oxidation or autothermal reforming. Of
these substrates, methanol has received themost attention as
a candidate substrate for producing pure hydrogen on-board
due to the fact that it does not require desulfurization or
pre-reforming processes [1]. Additionally, only minimal coke
formation is obtained during the steam reforming of meth-
anol (SRM) compared to that produced from the other
substrates. However, the H2-rich stream is always contami-
natedwith CO, although the CO concentration depends on the
lty of Science, Chulalongkorn University, 254 Phayathai Road,55 5831.(S. Pongstabodee).ublications, LLC. Published by Elsevier Ltd. All rights reserved.

i n t e rn a t i o n a l j o u r n a l o f h y d r o g e n en e r g y 3 7 ( 2 0 1 2 ) 4 7 4 9e4 7 6 14750
type of feedstock, operating procedure and the performance
of the catalysts used in the hydrogen production unit. The CO
elimination unit is required in the hydrogen-fuel processor
system since even trace levels of CO show strong chemi-
sorption on the anodic platinum (Pt) electrode of the PEMFC
and lower its performance dramatically. The wateregas shift
(WGS) reaction is then used to reduce the CO level from
w3e10% (v/v) to w1% (v/v), while the preferential oxidation
(PROX) of CO is further employed to clean-up the CO within
acceptable levels (<10 ppm).
Among the current methods in use for the CO elimination
unit, the PROX of CO seems to be one of the most effective
methods with an economic approach and minimal loss of H2.
The main reaction is as follows:
COþ 1=2O2/CO2 DH ¼ �283 kJ=mol (1)
and the undesired side reactions are hydrogen oxidation (Eq.
(2)), WGS reaction (Eq. (3)) and methanation (Eq. (4)):
H2 þ 1=2O2/H2O DH ¼ �241:8 kJ=mol (2)
COþH2O/CO2þH2 DH ¼ �41:2 kJ=mol (3)
COþ 3H2/CH4þH2O DH ¼ �206:1 kJ=mol (4)
The catalysts for the PROX of CO should exhibit a high CO
conversion including a high selectivity with respect to mini-
mization of the undesired side reactions. Furthermore, the
catalysts should be active in the presence of water and CO2
since they are some of the main components in the H2-rich
stream from hydrogen production unit. Therefore, the devel-
opment of catalysts with a suitable performance (rate, sensi-
tivity and selectivity) for the PROX of CO in the realistic
reformate gas is still needed. Catalysts are classified into the
two major categories of noble [2e12] and non-noble catalysts
[2,13e22]. The optimal catalytic activities of supported Pt
catalysts are shifted to a higher temperature when CO2 [5,6] or
water [5,7] or both [5,6] are present in the feedstream,
although some reports have claimed that the supported Pt
catalysts were not deactivated in the presence of CO2 and
water [2,8]. Moreover, adding excess O2 in the H2-rich stream
encourages not only a higher catalytic performance of the
supported Pt catalysts but also a higher level of hydrogen
consumption. Some research reports have highlighted
a significant decrease in the catalytic activities of supported
gold (Au) catalysts in the presence of CO2 alone [4,9] or in the
presence of CO2 and water [2,3,9], whereas the presence of
only a small amount of water enhanced the catalytic activity
of the Au catalysts [3,4]. In our previous work [10], we studied
catalytic performance of a series of PteAu catalysts prepared
by co-precipitation (CP) and single step sol-gel methods (SSG)
for selective CO oxidation. We found that the catalytic
performance over PtAu/Ce1Zn1O2 prepared by co-
precipitation was higher than that of PtAu/CeO2 and PtAu/
ZnO due to a higher metallic surface area and a smaller
particle size. The catalytic activity of supported Au catalysts
depends on the dispersion and size of the Au particles, the
type of support material and the preparation method. Sup-
ported copper [2,13e19,21,22] and manganese [20] catalysts
are effective for the PROX of CO but their activities are
decreased significantly in the presence of water and CO2.
Therefore, the presence of either water, CO2 or both has
a negative influence on the catalytic PROX of CO. However, it is
important to note that these studies have been investigated
on the assumption of no-interaction between the factors,
called a univariate (one-variable-at-a-time) experimental
approach.
A statistical design of experiment (DOE) was employed in
this work, since it is a powerful tool for process investigation
and optimization [17,23e26], by simultaneously considering
many factors at different levels and their potential interac-
tions. Thus, the catalytic activity for the PROX of CO over a 1%
(w/w) PtAu/CeO2eZnO catalyst was evaluated in terms of the
CO conversion and selectivity with respect to the operating
temperature (�C) and the presence of water (%) and CO2 (%) in
the simulating methanol reformate gas. The importance of
each factor and their interactions were evaluated by a full 23
factorial design. After screening the importance of each of the
three factorsand their interactionson the%COconversionand
selectivity, a face-centered central composite design (FCCCD)
falling under response surface methodology (RSM) was then
applied to optimize the responses. It is worth remarking that,
after determining the optimization, the validation of the
developed models was tested for both simulating reformate
gas and realistic methanol reformate gas. In addition, the
stability of the catalyst under realisticmethanol reformate gas
was evaluated over a continuous 10 h time period.
2. Experimental
2.1. Catalyst preparation
The 1% (w/w) PtAu/CeO2eZnO catalyst was prepared by co-
precipitation. The desired amount of Ce(NO3)3$6H2O (Merck),
Zn(NO3)2$4H2O (Merck), H2PtCl6$6H2O (Fluka) and
HAuCl4$3H2O (Fluka) were mixed simultaneously to make an
aqueous solution and stirred continuously. The mixed solu-
tionwas held at pH 8 by the dropwise addition of 0.5MNa2CO3
aqueous solution as required. Themolar ratios of Pt to Au and
of Ce to Zn were kept constant at 1:1. After aging for 1 h at
80 �C, the precipitated material in suspension was harvested
by filtration,washedwithwarmdeionizedwater several times
to remove the excess ions, dried at 110 �C for 12 h and then
calcined at 500 �C for 5 h.
2.2. Catalyst characterization
The particle morphology of the catalysts was observed by
transmission electronmicroscopy (TEM) using a JEM 2010 TEM
microscope operating at 200 kV in bright and dark fieldmodes.
The BrunauereEmmetteTeller (BET) method for evaluating
the surface area of the catalyst was examined by N2 adsorp-
tion/desorption at �196 �C (Micromeritics ASAP 2020). The
crystalline structure was determined by X-ray diffractometry
(XRD) using a Rigaku X-ray diffractometer system equipped
with a RINT 2000 wide-angle goniometer and using CuKa
radiation (l ¼ 1.54 A) and a power of 40 kV � 30 mA. The
particle diameter was calculated by the DebyeeScherrer
equation at the main X-ray line broadening in each phase.

i n t e r n a t i o n a l j o u r n a l o f h y d r o g e n en e r g y 3 7 ( 2 0 1 2 ) 4 7 4 9e4 7 6 1 4751
Fourier transform infrared spectrometry (FTIR) was used to
investigate the functional groups. Solid sample was milled
with potassium bromide (KBr) to form a very fine powder. The
powderwas then compressed into a thin pellet to be analyzed.
The spectra were collected on a PerkineElmer (Spectrum one)
spectrometer equipped with a mercury-cadmium-telluride
(MCT) detector to record wavenumber range of functional
group.
2.3. Catalytic activity measurement
The catalytic activity for the PROX of CO over a 1% (w/w) PtAu/
CeO2eZnO catalyst was investigated at atmospheric pressure.
A 100 mg catalyst sample was placed between two layers of
quartz wool in the middle of a 6 mm ID fixed-bed U-tube
reactor. The simulating reformate gas, which consisted of (all
(v/v)) 1% CO, 1% O2, 0%e10% H2O, 0%e20% CO2 and 40% H2
with the remainder made up of He, was routed to the reactor
at a flow rate of 50 cm3 min�1 by a mass flow controller. The
operating temperature was controlled in the range of
50 �Ce190 �C and monitored by a thermocouple placed in the
center of the catalyst bed. The influent and effluent gases
were routed to an ice-condenser to trap the water and then
analyzed by on-line gas chromatograph (Agilent Technolo-
gies, model 6890N) equipped with a carbosphere column and
a thermal conductivity detector (TCD). Heliumwas used as the
carrier gas. The catalytic activities are expressed in terms of
the % CO conversion and selectivity, which were calculated
based on the CO consumption, as shown below:
CO conversion ð%Þ ¼ ½CO�in � ½CO�out½CO�in
� 100 (5)
CO selectivity ð%Þ ¼ 0:5� �½CO�in � ½CO�out�
½O2�in � ½O2�out� 100 (6)
where [CO]in and [CO]out are the concentrations of CO (% (v/v))
in the feedstream and the effluent, respectively, [O2]in and
[O2]out are the concentrations of O2 (% (v/v)) in the feedstream
and the effluent, respectively.
2.4. Statistical design of experiments
2.4.1. A full 2k factorial designA factorial design was carried out to evaluate the effect of the
operating temperature (�C), H2O content (% (v/v)) and CO2
content (% (v/v)) in the reformate gas, and their interactions
on the catalytic activities for the PROX of CO in terms of the %
Table 1 e Physical properties of the prepared catalysts.
Catalyst Status BET surface areaa (m2 g�1)
PtAu/CeO2eZnO Fresh 58.6
PtAu/CeO2eZnO Spentc 54.7
a Determined by BET surface analyzer.
b Determined by XRD from the line broadening of CeO2 (1 1 1) and ZnO (
c Composition of the realistic reformate gas (all (v/v)) was 36.8% H2, 1.1%
CO conversion and selectivity. The other factors that likely
affect the catalytic activities, including the catalyst weight to
total gas flow rate (W/F), catalyst type and the reactor volume
were held constant throughout all the experiments. The
experimental matrix for a full 23 factorial design with three
central points was then designed and employed. The experi-
ments were done in a completely random order in order to
minimize errors due to systematic trends in the factors. The
DesigneExpert 5.0 software package (Stat Ease Inc. Minneap-
olis, USA) was employed to treat the experimental data and to
perform the statistical analysis at a 95% confidence interval,
such as the normal probability of the residues, the Pareto
chart of absolute standardized effect, analysis of variance
(ANOVA) and the % contribution.
2.4.2. Response surface methodology (RSM)After screening the three factors and their interactions for any
significant effect upon the CO conversion and selectivity with
the factorial design (Section 2.4.1), the factors found to be
important (significant influence) were then selected for RSM
analysis. To this end, FCCCDwith the above important factors
was applied sequentially to optimize the conditions for the
PROX of CO by simultaneously considering maximal CO
conversion, selectivity, the composition of realistic reformate
gas and temperature of the feedstream. A standard ANOVA at
a 95% confidence interval was then carried out to analyze the
response surface models.
2.4.3. Validation of the modelThe independent screened factors which were found to have
the major influence on the CO conversion and selectivity
(Section 2.4.1) were randomly selected within the given levels
to investigate the accuracy of the developed model as ob-
tained from the RSM (Section 2.4.2). The other less important
factors were held constant at their respective optimal level. A
set of six experiments were then designed and employed
under a feed condition of simulating and realistic reformate
gases. The residual distribution plot, a statistical analysis tool
for determining the validity of themodel, was then employed.
3. Results and discussion
3.1. Catalyst characterization
The physical properties of the fresh and spent 1% (w/w) PtAu/
CeO2eZnO catalysts are summarized in Table 1. No major or
Pore volumea (cm3 g�1) Crystallite sizeb (nm)
CeO2 ZnO
0.16 7.7 27.1
0.15 7.6 23.7
1 0 1).
CO, 1.1% O2, 8.2% H2O, 11.6% CO2 and 41.2% He.

Fig. 1 e Representative TEM images and derived PteAu particle size distribution for the (a) fresh and (b) spent 1% (w/w) PtAu/
CeO2eZnO catalyst. The composition of the realistic reformate gas was (all (v/v)) 36.8% H2, 1.1% CO, 1.1% O2, 8.2% H2O, 11.6%
CO2, and 41.2% He.
(d)
(e)
i n t e rn a t i o n a l j o u r n a l o f h y d r o g e n en e r g y 3 7 ( 2 0 1 2 ) 4 7 4 9e4 7 6 14752
significant difference between the fresh and spent catalysts in
their BET surface area, pore volume or the CeO2 and ZnO
crystallite size were observed. The average particle size of
catalyst and its size distribution were determined from the
2Theta [degree]
20 30 40 50 60 70 80 90
Inte
nsit
y [c
ps]
Cerianite Zincite
(a)
(b)
Fig. 2 e Representative XRD patterns for the (a) fresh and (b)
spent 1% (w/w) PtAu/CeO2eZnO catalyst. The composition
of the realistic reformate gas was (all (v/v)) 36.8% H2, 1.1%
CO, 1.1% O2, 8.2% H2O, 11.6% CO2 and 41.2% He.
Wavenumber (cm-1)
1000 1500 2000 2500 3000 3500 4000
% T
ran
sm
issio
n
(a)
(c)
(b)
Fig. 3 e Representative FTIR spectra for the (a) fresh 1% (w/
w) PtAu/CeO2eZnO catalyst and (bee) the spent catalyst
with varying (bed) simulated or (e) realistic reformate gas
compositions. The simulated reformate gas compositions
were all (v/v) 40% H2, 1% CO and 1% O2, and then
supplemented with (b) nothing, (c) 10% H2O or (d) 20% CO2.
The realistic reformate gas composition was 36.8% H2, 1.1%
CO and 1.1% O2, 8.2% H2O, 11.6% CO2. In all cases the
remaining proportion of the gas was He.

CO
con
vers
ion
(%)
and
sele
ctiv
ity
(%)
0
10
20
30
40
50
60
70
80
90
100
50
70
90
110
130
150
170
190 50
70
90
110
130
150
170
190 50
70
90
110
130
150
170
190 50
70
90
110
130
150
170
190
Temperature (°C)
(a) (b) (c) (d)
Fig. 4 e The catalytic performance (solid line for conversion; dashed line for selectivity) of the 1% (w/w) PtAu/CeO2eZnO
catalyst over the operating temperature range of 50e190 �C when feeding the feedstream with (all (v/v)) 40% H2, 1% CO and
1% O2 supplemented with (a) nothing, (b) 10% H2O, (c) 20% CO2 and (d) 10% H2O and 20% CO2. In all cases the residual gas
composition was He.
i n t e r n a t i o n a l j o u r n a l o f h y d r o g e n en e r g y 3 7 ( 2 0 1 2 ) 4 7 4 9e4 7 6 1 4753
TEM images (Fig. 1) when routing realistic reformate gas as the
feedstream. Black spots, whichwere dispersed throughout the
area, are the bi-metallic phase of Pt and Au, which implies
that the catalysts are well dispersed on the support, and
individual Pt-metallic phases could not be separated from the
Au-metallic phases. The mixed oxide support is visualized as
the grey area. However, the average size of the fresh metallic
particles was smaller, compared to that of the spent catalyst.
The XRD patterns of the fresh and spent catalysts are dis-
played in Fig. 2, where all the peaks correspond to the mixed
oxide support. There were no characteristic peaks of Pt
(2q ¼ 39.8� and 46.2�) or Au (2q ¼ 38.2�, 44.4� and 77.6�), which
suggests that the Pt and Au particles were highly dispersed on
surface of themixed oxide support and/or that the actual Pt or
Au loading level (<1%) in the catalysts is too low to be detec-
ted. Alternatively, the bi-metallic phase (Pt and Au) particles
could be too small to be detected by XRD. Regardless, these
Table 2 e Experimental matrix (full 23 factorial designwith threPROX of CO over a 1% (w/w) PtAu/CeO2eZnO catalyst.
Factors Variables Unit
A Temperature �CB H2O content %
C CO2 content %
Standard order Run order A B
1 9 �1 �1
2 10 1 �1
3 6 �1 1
4 3 1 1
5 11 �1 �1
6 2 1 �1
7 1 �1 1
8 4 1 1
9 5 0 0
10 7 0 0
11 8 0 0
results are consistentwith the TEM images. The peaks at 28.6�,33.2�, 47.5�, 56.3�, 59.1�, 69.4�, 76.7�, 79.1� and 88.4� correspondto the cerianite phase (CeO2), whereas the diffraction peaks at
31.8�, 34.6�, 36.2�, 62.9� and 68.0� are from the zincite phase
(ZnO). The intensity peak of the fresh catalyst was higher than
that of the spent ones, supporting that the fresh catalysts had
a higher crystalline contentwhen compared to the spent ones.
The crystallite size of the metal oxide phases (CeO2, and ZnO),
as calculated by the DebyeeScherrer equation from the X-ray
line broadening of the (1 1 1) diffraction peak for CeO2 and the
(1 0 1) diffraction peak for ZnO, are the same for the spent and
fresh catalysts except that the peak intensity is larger in the
fresh catalysts (Table 1; Fig. 2).
The functional group(s) on the surface of the fresh and
spent catalysts was evaluated by FTIR analysis, with an
example of the obtained spectra shown in Fig. 3. The fresh
catalyst showed an absorbance peak at around
e central points) for, and the results of, the evaluation of the
Low (�1) Medium (0) High (1)
50 120 190
0 5 10
0 10 20
C CO conversion (%) CO selectivity (%)
�1 25.7 70.0
�1 47.5 20.9
�1 22.6 70.5
�1 53.6 25.0
1 7.91 66.6
1 42.0 19.9
1 6.92 66.0
1 45.2 21.3
0 87.2 37.1
0 83.1 33.0
0 83.9 40.0

Fig. 5 e Normal probability plot of the effects for a full 23
factorial design with three central points when using the %
CO (a) conversion and (b) selectivity as the response.
0 10 20 30 40 50 60
A
B
C
AB
AC
BC
ABC
Curvature
5.65
8.72
0.41
0.93
0.80
1.37
3.16
1.35
46.52
Standardized Effect
0 10 20 30 40 50 60
A
B
C
AB
AC
BC
ABC
Curvature
7.50
55.67
1.28
0.18
4.91
3.38
11.82
1.30
31.30
Standardized Effect
a
b
Fig. 6 e The Pareto diagram for a full 23 factorial design
with three central points when using the % CO (a)
conversion and (b) selectivity as the response. The
absolute standardized value of the effect of each factor and
its interaction appear at the right of each bar.
i n t e rn a t i o n a l j o u r n a l o f h y d r o g e n en e r g y 3 7 ( 2 0 1 2 ) 4 7 4 9e4 7 6 14754
3100e3700 cm�1 with the center at w3500 cm�1, which
represents the OeH stretching mode [27,28]. The intensity of
this OeH peak in the fresh catalyst is higher than that of the
spent catalyst when no H2O was added to the feedstream. In
addition, the spectra of the spent catalysts displayed absor-
bance bands in two further regions; 1200e1700 cm�1 and
2852e2960 cm�1. The vibrational stretching frequencies at
1200e1700 cm�1 correspond to carbonate species, formed
from chemisorption of CO2 on the catalyst surface [28,29]. The
bands at 1520e1550 cm�1 and 1360e1385 cm�1 range repre-
sent the asymmetric and symmetric stretching of unidentate
carbonate species, respectively. The bands at 1610e1640 cm�1
are OeCeO asymmetric stretches of the bidentate carbonate
species. The CeH stretching peak at 2852 and 2960 cm�1
represents either formate [30] or methoxy groups [31]. These
results agree with the work reported by Martınez-Arias et al.
[32]. When H2O was added to the feedstream, the intensity of
the OeH peak in the spent catalyst was higher than that of the
fresh one (Fig. 3a and c), whilst the addition of CO2 (Fig. 3d) or
the co-addition of H2O and CO2 (Fig. 3e) to the feedstream
resulted in a broadened band for the OeH peak and a higher
intensity of the carbonateetype and formate peaks compared
to that seen in the fresh catalyst (Fig. 3a).
3.2. Catalyst activities
The catalytic activity of the 1% (w/w) PtAu/CeO2eZnO catalyst,
in terms of the % CO conversion and selectivity, at an oper-
ating temperature range of 50 �Ce190 �C when routing the
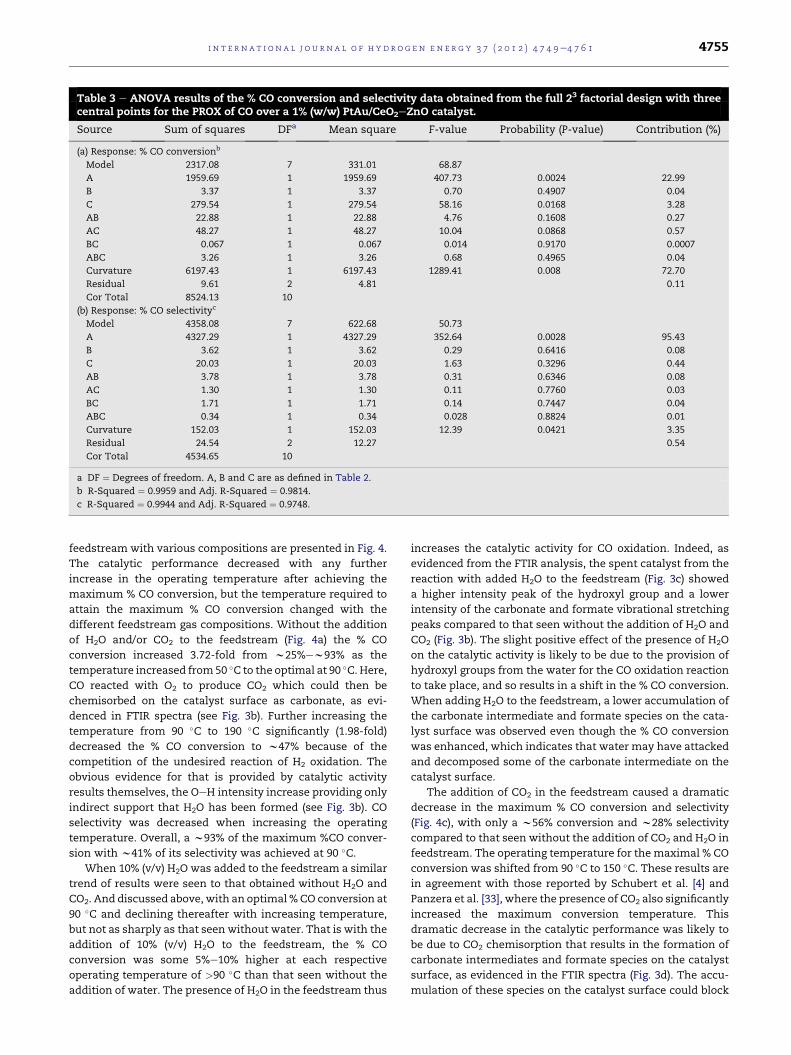
Table 3 e ANOVA results of the % CO conversion and selectivity data obtained from the full 23 factorial design with threecentral points for the PROX of CO over a 1% (w/w) PtAu/CeO2eZnO catalyst.
Source Sum of squares DFa Mean square F-value Probability (P-value) Contribution (%)
(a) Response: % CO conversionb
Model 2317.08 7 331.01 68.87
A 1959.69 1 1959.69 407.73 0.0024 22.99
B 3.37 1 3.37 0.70 0.4907 0.04
C 279.54 1 279.54 58.16 0.0168 3.28
AB 22.88 1 22.88 4.76 0.1608 0.27
AC 48.27 1 48.27 10.04 0.0868 0.57
BC 0.067 1 0.067 0.014 0.9170 0.0007
ABC 3.26 1 3.26 0.68 0.4965 0.04
Curvature 6197.43 1 6197.43 1289.41 0.008 72.70
Residual 9.61 2 4.81 0.11
Cor Total 8524.13 10
(b) Response: % CO selectivityc
Model 4358.08 7 622.68 50.73
A 4327.29 1 4327.29 352.64 0.0028 95.43
B 3.62 1 3.62 0.29 0.6416 0.08
C 20.03 1 20.03 1.63 0.3296 0.44
AB 3.78 1 3.78 0.31 0.6346 0.08
AC 1.30 1 1.30 0.11 0.7760 0.03
BC 1.71 1 1.71 0.14 0.7447 0.04
ABC 0.34 1 0.34 0.028 0.8824 0.01
Curvature 152.03 1 152.03 12.39 0.0421 3.35
Residual 24.54 2 12.27 0.54
Cor Total 4534.65 10
a DF ¼ Degrees of freedom. A, B and C are as defined in Table 2.
b R-Squared ¼ 0.9959 and Adj. R-Squared ¼ 0.9814.
c R-Squared ¼ 0.9944 and Adj. R-Squared ¼ 0.9748.
i n t e r n a t i o n a l j o u r n a l o f h y d r o g e n en e r g y 3 7 ( 2 0 1 2 ) 4 7 4 9e4 7 6 1 4755
feedstream with various compositions are presented in Fig. 4.
The catalytic performance decreased with any further
increase in the operating temperature after achieving the
maximum % CO conversion, but the temperature required to
attain the maximum % CO conversion changed with the
different feedstream gas compositions. Without the addition
of H2O and/or CO2 to the feedstream (Fig. 4a) the % CO
conversion increased 3.72-fold from w25%ew93% as the
temperature increased from50 �C to the optimal at 90 �C. Here,
CO reacted with O2 to produce CO2 which could then be
chemisorbed on the catalyst surface as carbonate, as evi-
denced in FTIR spectra (see Fig. 3b). Further increasing the
temperature from 90 �C to 190 �C significantly (1.98-fold)
decreased the % CO conversion to w47% because of the
competition of the undesired reaction of H2 oxidation. The
obvious evidence for that is provided by catalytic activity
results themselves, the OeH intensity increase providing only
indirect support that H2O has been formed (see Fig. 3b). CO
selectivity was decreased when increasing the operating
temperature. Overall, a w93% of the maximum %CO conver-
sion with w41% of its selectivity was achieved at 90 �C.When 10% (v/v) H2O was added to the feedstream a similar
trend of results were seen to that obtained without H2O and
CO2. And discussed above, with an optimal %CO conversion at
90 �C and declining thereafter with increasing temperature,
but not as sharply as that seen without water. That is with the
addition of 10% (v/v) H2O to the feedstream, the % CO
conversion was some 5%e10% higher at each respective
operating temperature of >90 �C than that seen without the
addition of water. The presence of H2O in the feedstream thus
increases the catalytic activity for CO oxidation. Indeed, as
evidenced from the FTIR analysis, the spent catalyst from the
reaction with added H2O to the feedstream (Fig. 3c) showed
a higher intensity peak of the hydroxyl group and a lower
intensity of the carbonate and formate vibrational stretching
peaks compared to that seen without the addition of H2O and
CO2 (Fig. 3b). The slight positive effect of the presence of H2O
on the catalytic activity is likely to be due to the provision of
hydroxyl groups from the water for the CO oxidation reaction
to take place, and so results in a shift in the % CO conversion.
When adding H2O to the feedstream, a lower accumulation of
the carbonate intermediate and formate species on the cata-
lyst surface was observed even though the % CO conversion
was enhanced, which indicates that water may have attacked
and decomposed some of the carbonate intermediate on the
catalyst surface.
The addition of CO2 in the feedstream caused a dramatic
decrease in the maximum % CO conversion and selectivity
(Fig. 4c), with only a w56% conversion and w28% selectivity
compared to that seen without the addition of CO2 and H2O in
feedstream. The operating temperature for themaximal % CO
conversion was shifted from 90 �C to 150 �C. These results are
in agreement with those reported by Schubert et al. [4] and
Panzera et al. [33], where the presence of CO2 also significantly
increased the maximum conversion temperature. This
dramatic decrease in the catalytic performance was likely to
be due to CO2 chemisorption that results in the formation of
carbonate intermediates and formate species on the catalyst
surface, as evidenced in the FTIR spectra (Fig. 3d). The accu-
mulation of these species on the catalyst surface could block

Fig. 7 e Main effect plot with its response for the % CO (a) conversion and (b) selectivity.
i n t e rn a t i o n a l j o u r n a l o f h y d r o g e n en e r g y 3 7 ( 2 0 1 2 ) 4 7 4 9e4 7 6 14756
the active sites for the PROX of CO. Thus, the presence of CO2
in the feedstream has a significant negative effect on the
performance of the catalyst.
The co-addition of 10% (v/v) H2O and 20% (v/v) CO2 to the
feedstream was somewhat intermediate between that seen
with the addition of either 10% (v/v) H2O or 20% (v/v) CO2 alone,
but potentially biasedmore toward that of 20% (v/v) CO2. From
Fig. 4d, the % CO conversion profile was much lower than that
obtained without the co-addition of CO2 and H2O, or the
addition of 10% (v/v) H2O, to the feedstream but was only
slightlyhigher than that seenwith theadditionof 20% (v/v) CO2
to the feedstream. It thus appears that the negative affect of
the addition of 20% (v/v) CO2 upon the % CO conversion by the
catalyst is greater then thepositive effect of the additionof 10%
(v/v) H2O, although this requires further counter-titrations for
confirmation. Themaximum%CO conversion and selectivity,
obtained at 130 �C, was aroundw63% andw30%, respectively.
The operating temperature for the maximal % CO conversion
was shifted lower compared to that seen with the addition of
CO2 (150 �C), as has been reported before [3e6,9,19,20,22].
Comparing the FTIR spectra (Fig. 3dee) suggests that a lower
level of formation of the carbonate intermediate and formate
species on the catalyst surface occurred when co-adding H2O
and CO2 to the feedstream than when adding only CO2. It is,
however, surprising that a higher intensity of the hydroxyl
regionwas observed compared towhen adding only CO2 to the
feedstream.The lowernegative effect of the co-additionofH2O
and CO2 to the feedstream on the catalytic activities compared
to that for the addition of CO2 only can probably be explained
by the fact that water can provide hydroxyl groups where the
reaction takes place. Carbonate intermediate on the catalyst
surface may be attacked and decomposed by water [34], and
results ina reducedaccumulationof the formatespecieson the
active sites of the catalyst.
3.3. Factors screening in a full 23 factorial design
Based on the catalytic activities for the PROX of CO, the
importance of the three independent factors (Section 3.2) on
the catalytic activity was evaluated by using a full 23 factorial
design with three central points and using the % CO conver-
sion and selectivity as responses. The factor levels on the
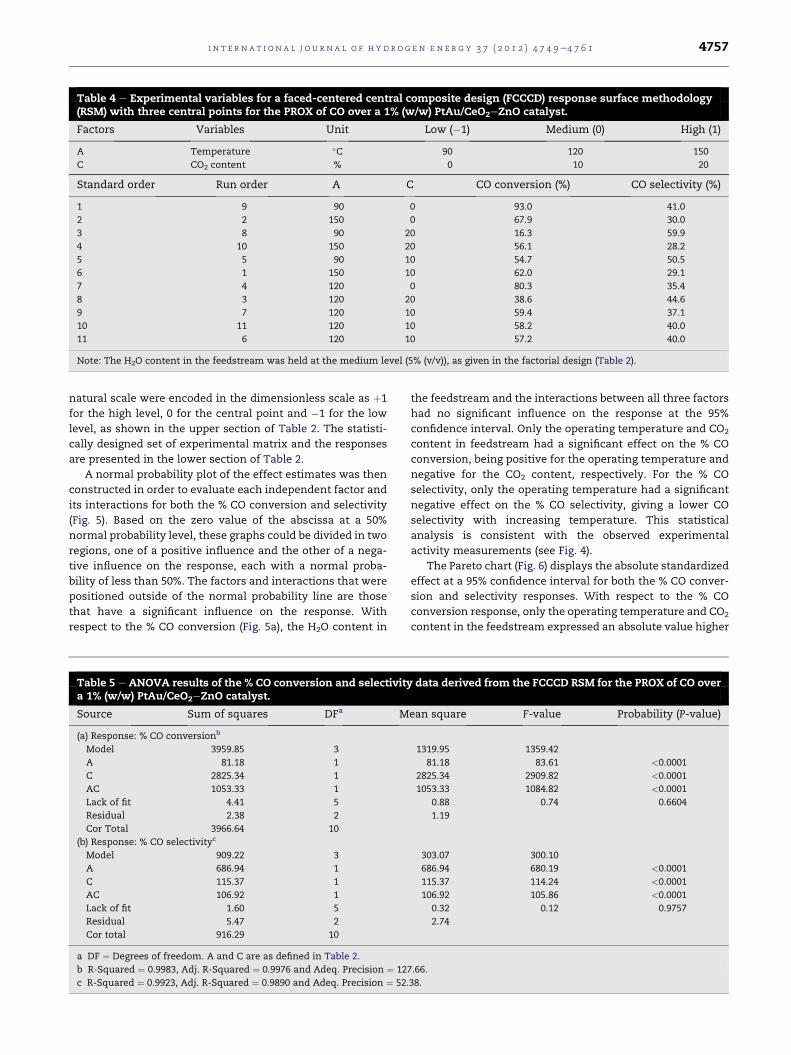
Table 4 e Experimental variables for a faced-centered central composite design (FCCCD) response surface methodology(RSM) with three central points for the PROX of CO over a 1% (w/w) PtAu/CeO2eZnO catalyst.
Factors Variables Unit Low (�1) Medium (0) High (1)
A Temperature �C 90 120 150
C CO2 content % 0 10 20
Standard order Run order A C CO conversion (%) CO selectivity (%)
1 9 90 0 93.0 41.0
2 2 150 0 67.9 30.0
3 8 90 20 16.3 59.9
4 10 150 20 56.1 28.2
5 5 90 10 54.7 50.5
6 1 150 10 62.0 29.1
7 4 120 0 80.3 35.4
8 3 120 20 38.6 44.6
9 7 120 10 59.4 37.1
10 11 120 10 58.2 40.0
11 6 120 10 57.2 40.0
Note: The H2O content in the feedstream was held at the medium level (5% (v/v)), as given in the factorial design (Table 2).
i n t e r n a t i o n a l j o u r n a l o f h y d r o g e n en e r g y 3 7 ( 2 0 1 2 ) 4 7 4 9e4 7 6 1 4757
natural scale were encoded in the dimensionless scale as þ1
for the high level, 0 for the central point and �1 for the low
level, as shown in the upper section of Table 2. The statisti-
cally designed set of experimental matrix and the responses
are presented in the lower section of Table 2.
A normal probability plot of the effect estimates was then
constructed in order to evaluate each independent factor and
its interactions for both the % CO conversion and selectivity
(Fig. 5). Based on the zero value of the abscissa at a 50%
normal probability level, these graphs could be divided in two
regions, one of a positive influence and the other of a nega-
tive influence on the response, each with a normal proba-
bility of less than 50%. The factors and interactions that were
positioned outside of the normal probability line are those
that have a significant influence on the response. With
respect to the % CO conversion (Fig. 5a), the H2O content in
Table 5 e ANOVA results of the % CO conversion and selectivitya 1% (w/w) PtAu/CeO2eZnO catalyst.
Source Sum of squares DFa M
(a) Response: % CO conversionb
Model 3959.85 3
A 81.18 1
C 2825.34 1
AC 1053.33 1
Lack of fit 4.41 5
Residual 2.38 2
Cor Total 3966.64 10
(b) Response: % CO selectivityc
Model 909.22 3
A 686.94 1
C 115.37 1
AC 106.92 1
Lack of fit 1.60 5
Residual 5.47 2
Cor total 916.29 10
a DF ¼ Degrees of freedom. A and C are as defined in Table 2.
b R-Squared ¼ 0.9983, Adj. R-Squared ¼ 0.9976 and Adeq. Precision ¼ 12
c R-Squared ¼ 0.9923, Adj. R-Squared ¼ 0.9890 and Adeq. Precision ¼ 52.
the feedstream and the interactions between all three factors
had no significant influence on the response at the 95%
confidence interval. Only the operating temperature and CO2
content in feedstream had a significant effect on the % CO
conversion, being positive for the operating temperature and
negative for the CO2 content, respectively. For the % CO
selectivity, only the operating temperature had a significant
negative effect on the % CO selectivity, giving a lower CO
selectivity with increasing temperature. This statistical
analysis is consistent with the observed experimental
activity measurements (see Fig. 4).
The Pareto chart (Fig. 6) displays the absolute standardized
effect at a 95% confidence interval for both the % CO conver-
sion and selectivity responses. With respect to the % CO
conversion response, only the operating temperature and CO2
content in the feedstream expressed an absolute value higher
data derived from the FCCCD RSM for the PROX of CO over
ean square F-value Probability (P-value)
1319.95 1359.42
81.18 83.61 <0.0001
2825.34 2909.82 <0.0001
1053.33 1084.82 <0.0001
0.88 0.74 0.6604
1.19
303.07 300.10
686.94 680.19 <0.0001
115.37 114.24 <0.0001
106.92 105.86 <0.0001
0.32 0.12 0.9757
2.74
7.66.
38.

0
5
10
15
20
90 105 120 135 150
A: Temperature
C: C
O2
cont
ent
29.55
42.20
54.84
80.12
67.48
54.56 49.27 43.98 38.69 33.40
Fig. 8 e Contour plot of the RSM model derived % CO ( )
conversion and ( ) selectivity and (shaded portion) the
optimal region. The plot was formed by overlaying the
yield of the w% CO conversion and selectivity responses,
the CO2 content in the realistic reformate gas and the
temperature of the feedstream.
i n t e rn a t i o n a l j o u r n a l o f h y d r o g e n en e r g y 3 7 ( 2 0 1 2 ) 4 7 4 9e4 7 6 14758
than 7.50, and so had a significant influence on the % CO
conversion. For the % CO selectivity, only the operating
temperature had an absolute standardized value higher than
5.65, and so had a significant influence on the CO selectivity.
These results were also confirmed by a normal probability plot
of the effect estimates. Moreover, an appearance of curvature
was observed in the % CO conversion and selectivity
responses. The absolute value of curvature was around 55.67
(7.43-fold) and 8.72 (1.54-fold) for the % CO conversion and
selectivity responses, respectively. However, it is surprising
that the addition of H2O in the feedstream had no significant
Table 6 e Validation of FCCCD using various operating temperrealistic reformate gas.
Operating condition CO co
Temperature (�C) CO2 content (%) Estimation
(a) Simulated reformate gas
90 10 54.8
120 10 58.5
130 0 76.0
150 0 67.7
150 20 56.7
170 0 59.3
(b) Realistic reformate gas
100 11.6 50.9
110 11.6 53.0
120 11.6 55.1
130 11.6 57.1
140 11.6 59.2
150 11.6 61.3
Note: The simulated reformate gas consisted of (all (v/v)) 40% H2, 1% CO, 1
rest as He, whilst the realistic reformate gas composition from the SRM u
CO2 and 41.2% He.
effect on the % CO conversion and selectivity responses at the
95% confidence interval.
The ANOVA of the catalytic performance is shown in Table
3. For the % CO conversion response, only the operating
temperature and CO2 content in the feedstream were signifi-
cant, their relative importance (% contribution) being w23.0%
and 3.28% for the operating temperature and CO2 content in
the feedstream, respectively. With respect to the % CO selec-
tivity response, only the operating temperature was an
important factor with a 95.43% contribution. In addition, the
relationship between the important factors and the response
was not linear, since the probability of a curvature was
P¼0.008and0.0421 (72.7%and3.35%contribution) for the%CO
conversion and selectivity responses, respectively. The
magnitude of the adjusted-R2 (Adj R-square) termwas close to
the coefficient of determination (R-square), which implies that
non-significant termshave been included in themodels [26,35]
for CO conversion and selectivity. In order to verify the
curvature, the mean changes that occurred in the response
when changing the level of the factor from a lower level
through the central point to a higher level were plotted (Fig. 7).
The average of the response value for all three factors studied
did not correspond to the average of the response value at the
central point,whichsuggested that there shouldbe aquadratic
term in the % CO conversion and selectivity models.
From the results of statistical analysis, it can be concluded
that an operating temperature and CO2 content in feedstream
have a significant effect on the CO conversion whist only
operating temperature has an influence on CO selectivity.
Therefore, the operating temperature and CO2 content in
feedstream were employed for a surface analysis design in
order to achieve an optimal CO conversion and CO selectivity.
3.4. Response surface methodology (RSM)
After screening for the important factor(s) that influence the%
CO conversion and selectivity responses using a full 23
atures and CO2 contents when feeding (a) simulated and (b)
nversion (%) CO selectivity (%)
Experiment Estimation Experiment
54.7 50.3 50.5
59.4 39.6 40.0
76.4 33.4 33.7
67.9 29.7 30.0
56.1 28.1 28.2
58.3 26.0 25.7
49.4 48.0 46.9
53.7 44.1 45.2
56.3 40.3 39.9
56.3 36.6 35.7
60.0 32.6 33.2
62.4 28.8 28.4
% O2, 5% H2O, the indicated amount of CO2 (shown in Table) and the
nit consisted of (all (v/v)) 36.8% H2, 1.1% CO, 1.1% O2, 8.2% H2O, 11.6%

Predicted value (%)
0 10 20 30 40 50 60 70 80 90 100
Res
idua
l (%
)
-5
-4
-3
-2
-1
0
1
2
3
4
5
Predicted value (%)
0 10 20 30 40 50 60 70 80 90 100
Res
idua
l (%
)
-5
-4
-3
-2
-1
0
1
2
3
4
5a
b
Fig. 9 e Residual plots of the response surfacemodel for the
% CO (a) conversion and (b) selectivity when routing ( )
simulated and ( ) realistic reformate gases.
i n t e r n a t i o n a l j o u r n a l o f h y d r o g e n en e r g y 3 7 ( 2 0 1 2 ) 4 7 4 9e4 7 6 1 4759
factorial design with central points, a FCCCD with two inde-
pendent screened factors was performed in order to achieve
the optimum condition for CO conversion and selectivity. The
criterion of this design and the level of the screened factors
were chosen based on the previous full 23 factorial design
(Section 3.3), as shown in Table 4. Based on the components of
the realistic reformate gas from the SRM unit, the statistical
analysis and catalytic activities, the H2O content in the feed-
stream was held constant at a medium level. An appropriate
RSM model was generated in coded terms, as shown in Eq. (7)
for the % CO conversion and Eq. (8) for the % selectivity
responses:
CO conversion ð%Þ ¼ þ58:52þ 3:68A� 21:70Cþ 16:23AC (7)
CO selectivity ð%Þ ¼ þ39:60� 10:70Aþ 4:38C� 5:17AC (8)
whereA is the operating temperature (�C), C is the CO2 content
in the feedstream (% (v/v)) and AC is the interaction between
the operating temperature and the CO2 content in the feed-
stream. The conditions that yielded the optimal CO selectivity
(59.9%), at 90 �C and 20% (v/v) CO2, however, yielded the lowest
% CO conversion (16.3%). Conditions that then lead to an
improved % CO conversion typically yield a reduced % CO
selectivity, but not in a linear manner. Thus, the optimization
of conditions for both % CO conversion and selectivity is dis-
cussed below using overlay plots.
ANOVA analysis of the FCCCD results revealed that both
the temperature and the CO2 content and their interaction
were a significant influence on the % CO conversion and
selectivity (Table 5). Note that the lack of fit in the developed
models was not significant, implying that the independent
factors studied were adequate to represent the actual rela-
tionship between these two factors and the responses within
the selected range. The R-Squared value provides a variability
measurement in the estimated response valuewhen using the
factors and their interaction. The Adj R-Squared values of
0.9976 and 0.9890 for the % CO conversion and selectivity
response, respectively, being very close to 1 revealed the
accuracy of the response surface quadratic model [36,37].
Indeed, only 0.24% and 1.1% of the total variation in the % CO
conversion and selectivity responses, respectively, could not
be explained by the models. Accordingly, there was very little
difference between the R-Squared and Adj R-Squared values.
When monitoring the signal to noise ratio by adequate
precision (Adeq Precision), it has been suggested that the
signal is adequate when the ratio was greater than 4. Here the
signal to noise ratio for the % CO conversion and selectivity
were 127.66 and 52.38, respectively, and so displayed an
adequate model perception, and explained the good agree-
ment between the estimated and experimental response
values for both the CO conversion and selectivity.
A relatively straightforward approach to optimizing the
counter trending CO conversion and selectivity (Table 4) is to
overlay the contour plot for each response, as shown in Fig. 8.
To achieve the optimal condition, the CO2 content in the
realistic reformate gas (9%e12%) and temperature of the
feedstream (w100 �Cew120 �C) were also used as constraints
for optimizing the responses. The optimal condition, which
was estimated by simultaneously considering the CO
conversion and selectivity responses and constraints, is in the
operating temperature range of w100 �Cew115 �C and a CO2
content of 9%e11% (v/v) in the feedstream (shaded portion of
Fig. 8). Under these optimal conditions the maximal CO
conversion and selectivity were in the range of w55%ew61%
and w44%ew48%, respectively, which are in good agreement
with the experimental results.
3.5. Validation of the RSM models
To investigate the accuracy of the above RSM models (Section
3.4), the effect of the operating temperature and CO2 content
in the feedstream were experimentally varied, whilst the H2O
content in the simulated reformate gas was held constant at
5% (v/v). Table 6 shows the % CO conversion and selectivity of
an individual representative experiment along with the esti-
mated responses under the simulated and realistic reformate

Time (min)
0 50 100 150 200 250 300 350 400 450 500 550 600
CO
con
vers
ion
(%)
and
sele
ctiv
ity
(%)
0
10
20
30
40
50
60
70
80
90
100
CO conversionCO selectivity
Fig. 10 e Stability test of the PROX of CO unit over a 1% (w/
w) PtAu/CeO2eZnO catalyst under realistic SRM conditions
(36.8% H2, 1.1% CO, 1.1% O2, 8.2% H2O, 11.6% CO2, and 41.2%
He, all (v/v)) at the optimum condition (obtained from
statistical analysis). (PROX unit condition: operating
temperature [ 120 �C).
i n t e rn a t i o n a l j o u r n a l o f h y d r o g e n en e r g y 3 7 ( 2 0 1 2 ) 4 7 4 9e4 7 6 14760
gases. The realistic reformate gas composition from the SRM
unit was comprised of (all (v/v)) 36.8% H2, 1.1% CO, 1.1% O2,
8.2% H2O, 11.6% CO2 and 41.2% He. The realistic reformate gas
was routed directly from the SRM unit to the PROX of CO unit.
The estimated responses were found to be very close to the
experimentally derived ones in all cases. Indeed, when the
difference in the estimated and experimental response
values, in terms of their % residuals, were plotted against the
predicted value, the distribution of the residuals with regard
to the response does not follow a trend for either response
(Fig. 9). For the simulated and realistic reformate gases, all the
residuals were within �2% and �3%, respectively, for both the
CO conversion and selectivity responses, indicating a high
degree of accuracy for the models. Since the RSM analysis
provided an adequate approximation of the true response
function, and so the analysis is approximately equivalent to
analysis of the actual system, then the experimental design in
this work can be applied to optimize the CO conversion and
selectivity over a 1% (w/w) PtAu/CeO2eZnO catalyst.
3.6. Stability test
The stability test of the PROX of CO unit under the realistic
condition was performed at an operating temperature of
120 �C (detailed in Fig. 10). The catalytic activity of the 1% (w/
w) PtAu/CeO2eZnO catalyst was found to be stable at this
operating condition for 10 h, with no significant difference
being observed in the % CO conversion or selectivity between
the fresh and spent catalysts (Figs. 1 and 2; Table 1).
4. Conclusions
The effects of the operating temperature (�C) and the H2O and
CO2 contents (%) in the simulated reformate gas on the
catalytic performance for the preferential oxidation of CO over
a 1% (w/w) PtAu/CeO2eZnO catalyst that was prepared by co-
precipitation was investigated. The % CO conversion profile
from the co-addition of 10% (v/v) H2O and 20% (v/v) CO2 was
much lower than that obtainedwithout the co-addition of CO2
and H2O or the addition of 10% (v/v) H2O to the feedstream but
was only slightly higher than that seen with the addition of
20% (v/v) CO2 to the feedstream. As evidenced from the FTIR
spectra, a lower level of formation of the carbonate interme-
diate and formate species with a higher intensity of the
hydroxyl region on the catalyst surface occurred when co-
adding H2O and CO2 to the feedstream than when adding
only CO2. For screening the importance of these factors on the
catalytic activity, a full 23 factorial design with three central
points was applied. Statistical analysis at a 95% confidence
interval revealed that the operating temperature and CO2
content in the feedstream had a significant influence on the
CO conversion response, whilst only the operating tempera-
ture was significant for the CO selectivity. However, a curva-
ture was observed, which suggests a quadratic term in the
models of the CO conversion and selectivity responses is
required. Therefore, variation of the two important factors
(temperature and CO2 content) and FCCCD with three central
points were performed to evaluate the optimal condition by
the simultaneous consideration of the maximal % CO
conversion and selectivity, the constraint of the CO2 content
in the realistic reformate gas (9e12% (v/v)) and temperature of
the feedstream (w100e120 �C). The optimal condition was
found to be at w100e115 �C and 9e11% CO2 content in the
feedstream, yielding a maximal CO conversion and selectivity
ofw55e61% andw44e48%, respectively. The difference in the
estimated and the experimental response was within �2%
and�3% for routing the simulated and realistic reformate gas,
respectively. No decrease in the catalyst performance was
observed over a 10 h test period. The physical properties of the
fresh catalysts were not different from the spent one. The
experimental design in this work can be applied to optimize
the CO conversion and selectivity over PtAu/CeO2eZnO
catalysts.
Acknowledgments
The authors are grateful to the Center for Petroleum, Petro-
chemicals and Advanced Materials, Chulalongkorn Univer-
sity, the National Research University Project of CHE, the
Ratchadaphiseksomphot Endowment Fund (Project code:
EN276B), the Department of Chemical Technology and The
Petroleum and Petrochemical College, Chulalongkorn
University, Thailand, for financial support.
r e f e r e n c e s
[1] Brown LF. Comparative study of fuels for on-board hydrogenproduction for fuel-cell-powered automobiles. Int J HydrogenEnergy 2001;26:381e97.
[2] Avgouropoulos G, Ioannides T, Papadopoulou Ch, Batista J,Hocevar S, Matralis HK. A comparative study of Pt/g-Al2O3,

i n t e r n a t i o n a l j o u r n a l o f h y d r o g e n en e r g y 3 7 ( 2 0 1 2 ) 4 7 4 9e4 7 6 1 4761
Au/a-Fe2O3 and CuOeCeO2 catalysts for the selectiveoxidation of carbon monoxide in excess hydrogen. CatalToday 2002;75:157e67.
[3] Luengnaruemitchai A, Osuwan S, Gulari E. Selective catalyticoxidation of CO in the presence of H2 over gold catalyst. Int JHydrogen Energy 2004;29:429e35.
[4] Schubert MM, Venugopal A, Kahlich MJ, Plzak V, Behm RJ.Influence of H2O and CO2 on the selective CO oxidation in H2-rich gases over Au/a-Fe2O3. J Catal 2004;222:32e40.
[5] Ayastuy JL, Gil-Rodrıguez A, Gonzalez-Marcos MP, Gutierrez-Ortiz MA. Effect of process variables on Pt/CeO2 catalystbehaviour for the PROX reaction. Int J Hydrogen Energy 2006;31:2231e42.
[6] Zhou S, Yuan Z, Wang S. Selective CO oxidation with realmethanol reformate over monolithic Pt group catalysts:PEMFC applications. Int J Hydrogen Energy 2006;31:924e33.
[7] Ko E-Y, Park ED, Seo KW, Lee HC, Lee D, Kim S. Acomparative study of catalysts for the preferential COoxidation in excess hydrogen. Catal Today 2006;116:377e83.
[8] S‚ ims‚ek E, Ozkara S‚ , Aksoylu AE, Onsan ZI. Preferential COoxidation over activated carbon supported catalysts in H2-rich gas streams containing CO2 and H2O. Appl Catal A 2007;316:169e74.
[9] Naknam P, Luengnaruemitchai A, Wongkasemjit S.Preferential CO oxidation over Au/ZnO and Au/ZnOeFe2O3
catalysts prepared by photo-deposition. Int J HydrogenEnergy 2009;34:9838e46.
[10] Monyanon S, Luengnaruemitchai A, Pongstabodee S.Preferential oxidation of carbon monoxide in simulatedreformatted gas over PtAu/CexZnyO2 catalysts. Int J HydrogenEnergy 2010;35:3234e42.
[11] Monyanon S, Pongstabodee S, Luengnaruemitchai A.Preferential oxidation of carbon monoxide over Pt, Aumonometallic catalyst, and PteAu bimetallic catalystsupported on ceria in hydrogen-rich reformate. J Chin InstChem Eng 2007;38:435e41.
[12] Parinyaswan A, Pongstabodee S, Luengnaruemitchai A.Catalytic performances of PtePd/CeO2 catalysts for selectiveCO oxidation. Int J Hydrogen Energy 2006;31:1942e9.
[13] Avgouropoulos G, Ioannides T. Selective CO oxidation overCuOeCeO2 catalysts prepared via the ureaenitratecombustion method. Appl Catal A 2003;244:155e67.
[14] Ratnasamy P, Srinivas D, Satyanarayana CVV,Manikandan P, Kumaran SRS, Sachin M, et al. Influence ofthe support on the preferential oxidation of CO in hydrogen-rich steam reformates over the CuOeCeO2eZrO2 system. JCatal 2004;221:455e65.
[15] Park JW, Jeong JH, Yoon WL, Kim CS, Lee DK, Park Y-K, et al.Selective oxidation of CO in hydrogen-rich stream overCueCe catalyst promoted with transition metals. Int JHydrogen Energy 2005;30:209e20.
[16] Chen Y-Z, Liaw B-J, Chang W-C, Huang C-T. Selectiveoxidation of CO in excess hydrogen over CuO/CexZr1�xO2.Al2O3 catalysts. Int J Hydrogen Energy 2007;32:4550e8.
[17] Sirichaiprasert K, Ponstabodee S, Luengnaruemitchai A.Single- and double-stage catalytic preferential CO oxidationin H2-rich stream over an a-Fe2O3-promoted CuOeCeO2
catalyst. J Chin Inst Chem Eng 2008;39:597e607.[18] Ramaswamy V, Malwadkar S, Chilukuri S. CueCe mixed
oxides supported on Al-pillared clay: effect of method ofpreparation on catalytic activity in the preferential oxidationof carbon monoxide. Appl Catal B 2008;84:21e9.
[19] ChenY-Z, LiawB-J,Wang J-M,HuangC-T. Selective removal ofCO from hydrogen-rich stream over CuO/CexSn1-xO2eAl2O3
catalysts. Int J Hydrogen Energy 2008;33:2389e99.
[20] Guo Q, Liu Y. MnOx modified Co3O4-CeO2 catalysts for thepreferential oxidation of CO in H2-rich gases. Appl Catal B2008;82:19e26.
[21] Gamarra D, Martınez-Arias A. Preferential oxidation of CO inrich H2 over CuO/CeO2: Operando-DRIFTS analysis ofdeactivating effect of CO2 and H2O. J Catal 2009;263:189e95.
[22] Wu Z, Zhu H, Qin Z, Wang H, Ding J, Huang L, et al. COpreferential oxidation in H2-rich stream over a CuO/CeO2
catalyst with high H2O and CO2 tolerance. Fuel; 2010.doi:10.1016/j.fuel.2010.03.001.
[23] Erickson PA, Liao C. Statistical validation and an empiricalmodel of hydrogen production enhancement found byutilizing passive flow disturbance in the steam-reformationprocess. Exp Therm Fluid Sci 2007;32:467e74.
[24] Hajjaji N, Renaudin V, Houas A, Pons MN. Factorial design ofexperiment (DOE) for parametric exergetic investigation ofa steam methane reforming process for hydrogenproduction. Chem Eng Process 2010;49:500e7.
[25] Thouchprasitchai N, Luengnaruemitchai A, Pongstabodee S.Statistical optimization by response surface methodology forwateregas shift reaction in a H2-rich stream over CueZneFecomposite-oxide catalysts. J Taiwan Inst Chem Eng 2011;42:632e9.
[26] Montgomery DC. Design and analysis of experiments. 7th ed.U.S.A: John Wiley & Sons, Inc.; 2009.
[27] Zaki MI, Hasan MA, Al-Sagheer FA, Pasupulety L. In situ FTIRspectra of pyridine adsorbed on SiO2eAl2O3, TiO2, ZrO2 andCeO2: general considerations for the identification of acidsites on surfaces of finely divided metal oxides. Colloids SurfA 2001;190:261e74.
[28] Chowdhury A, Thompson PR, Milne SJ. TGAeFTIR study ofa lead zirconate titanate gel made from a triol-based solegelsystem. Thermochimica Acta 2008;475:59e64.
[29] Liao L-F, Lien C-F, Shieh D-L, Chen M-T, Lin J-L. FTIR study ofadsorption and photoassisted oxygen isotopic exchange ofcarbonmonoxide, carbon dioxide, carbonate, and formate onTiO2. J Phys Chem B 2002;106:11240e5.
[30] Boccuzzi F, Chiorino A, Manzoli M. FTIR study of methanoldecomposition on gold catalyst for fuel cells. J Power Sources2003;118:304e10.
[31] Larrubia Vargas MA, Busca G, Costantino U, Marmottini F,Montanari T, Patrono P, et al. An IR study of methanol steamreforming over ex-hydrotalcite CueZneAl catalysts. J MolCatal A 2007;266:188e97.
[32] Martınez-Arias A, Hungrıa AB, Fernandez-Garcıa M,Conesa JC, Munuera G. Preferential oxidation of CO in a H2-rich stream over CuO/CeO2 and CuO/(Ce, M)Ox (M ¼ Zr, Tb)catalysts. J Power Sources 2005;151:32e42.
[33] Panzera G, Modafferi V, Candamano S, Donato A, Frusteri F,Antonucci PL. CO selective oxidation on ceria-supported Aucatalysts for fuel cell application. J Power Sources 2004;135:177e83.
[34] Date M, Okumura M, Tsubota S, Haruta M. Statisticaloptimization of key process variables for enhanced hydrogenproduction by newly isolated Clostridium tyrobutyricum JM1.Angew Chem Int Ed 2004;43:2129e32.
[35] Vining G, Kowalski SM. Statistical methods for engineers. 3rded. U.S.A: Brooks/Cole Cengage Learning; 2011.
[36] Jo JH, Lee DS, Park D, Park JM. Statistical optimization of keyprocess variables for enhanced hydrogen production bynewly isolated Clostridium tyrobutyricum JM1. Int J HydrogenEnergy 2008;33:5176e83.
[37] Long C, Cui J, Liu Z, Liu Y, Long M, Hua Z. Statisticaloptimization of fermentative hydrogen production fromxylose by newly isolated Enterobacter sp. CN1. Int J HydrogenEnergy 2010;35:6657e64.