applications software developed by fao for management of ... expert meeting washington 2000... · 1...
TRANSCRIPT

1
Chapter 8
World Meteorological Organization
Expert Group Meeting on Software
for Agroclimatic Data Management
Washington, DC, USA, 16-20 October 2000
Applications Software developed by FAO
for Management of Soils and Crops Data
Michele Bernardi
Food and Agriculture Organization of the United Nations
Environment and Natural Resources Services
Research, Extension and Training Division
Sustainable Development Department
Viale delle Terme di Caraclla
00100 Rome, Italy
__________________________
Corresponding author: Michele Bernardi, Fax: 39 06 57055731, Tel.: 39 06 57052442,
Email: [email protected]

2
Abstract
The Food and Agriculture Organization, the largest specialized agency of the UN, manages
various databases, including world-wide agricultural statistics, world-wide data on climate,
soils, plant and animal diseases, environmental satellite imagery. The global community has
un-restricted access to the databases through the World Agricultural Information Centre. The
main purpose of the information management on agricultural-related databases is to: organize
and link information to facilitate user access; provide systems for visualizing information; and
provide decision-support systems at the national level to help achieve food security through
use of information. A central role is played by FAO in developing applications software for
agrometeorology and remote sensing, particularly to support “Early Warning Systems for
Food Security.” However, FAO has also developed a wide range of applications software for
agricultural information management, in which soils and crops data management can also be
performed. Given this background, this paper briefly describes four groups of software,
which make use of those databases to extract soil and crop data for different purposes. Some
considerations on the file standardisation also precede the main topics.
8.1 Introduction
Recognizing that knowledge is a basic tool for agriculture1 development, FAO not only
promotes the direct transfer of skills and technology through field projects, but also
undertakes a variety of information and support services. Computer databases are maintained
on topics ranging from fish marketing information to trade and production statistics and
records of current agricultural research. FAO's Geographic Information System (GIS)
provides data on soils, vegetation cover and other aspects of land use. Satellite imagery is
among the many tools used by the Global Information and Early Warning System on Food
and Agriculture (GIEWS) to monitor conditions affecting food production and to alert
governments and donors to any potential threats. The information gathered by FAO is un-
restricted and made available to the global community through modern technology such as
Internet. FAO's strategic inter-departmental programme on information management and
dissemination is the World Agricultural Information Centre (WAICENT).
1 As per FAO basic texts, the word agriculture includes crop agriculture, livestock husbandry, forestry and
fisheries.

3
WAICENT provides a corporate information platform for the acquisition, updating and
dissemination of FAO information. Using state-of-the-art technologies, WAICENT facilitates
the exchange of information within the organization, its decentralised offices and Member
Nations. To ensure information reaches the widest possible audience, including those without
Internet access, alternative formats are used to distribute information, such as CD-ROM,
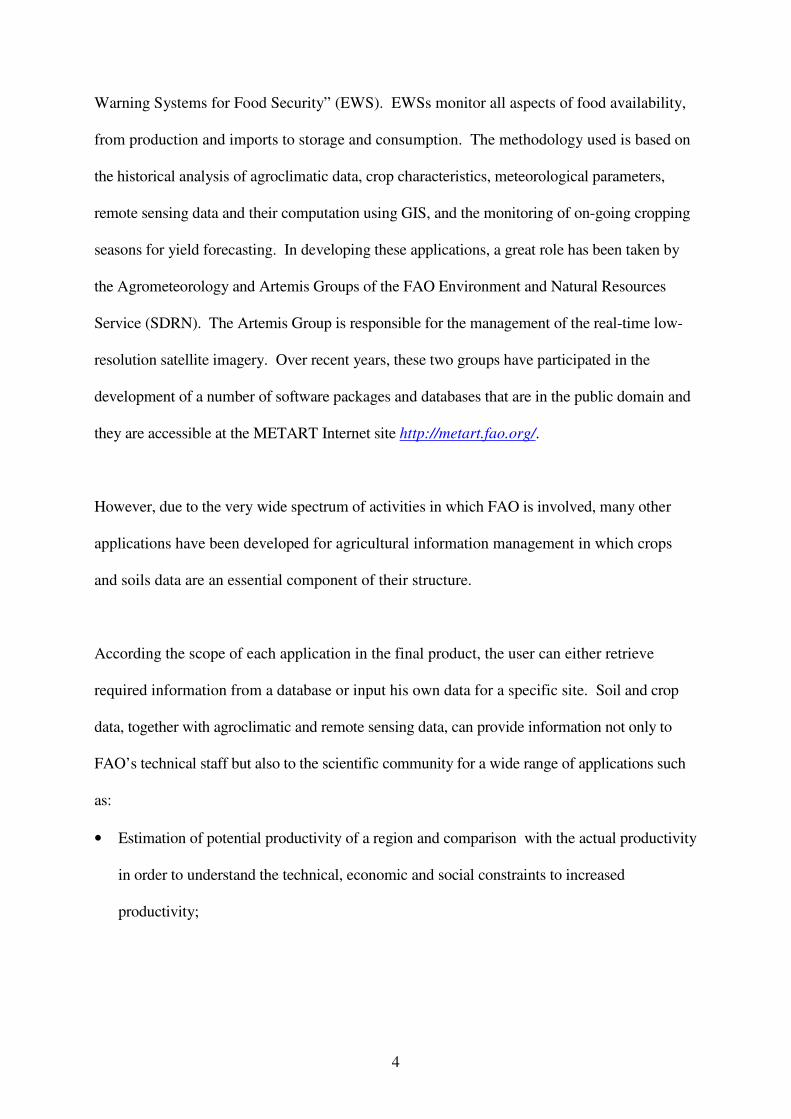
diskette and print (Figure 1). The most important FAO database FAOSTAT, is the on-line and
multilingual global agricultural database containing over 1 million time-series records, including
national statistics of area and production data. An exhaustive list of the FAO databases and of
statistical and geographical information is provided in Annex 1.
Figure 1. WAICENT information platform.
Concerning the applications software for agricultural information management, FAO certainly
continues to play a central role in developing computer programmes to support the “Early
4
Warning Systems for Food Security” (EWS). EWSs monitor all aspects of food availability,
from production and imports to storage and consumption. The methodology used is based on
the historical analysis of agroclimatic data, crop characteristics, meteorological parameters,
remote sensing data and their computation using GIS, and the monitoring of on-going cropping
seasons for yield forecasting. In developing these applications, a great role has been taken by
the Agrometeorology and Artemis Groups of the FAO Environment and Natural Resources
Service (SDRN). The Artemis Group is responsible for the management of the real-time low-
resolution satellite imagery. Over recent years, these two groups have participated in the
development of a number of software packages and databases that are in the public domain and
they are accessible at the METART Internet site http://metart.fao.org/.
However, due to the very wide spectrum of activities in which FAO is involved, many other
applications have been developed for agricultural information management in which crops
and soils data are an essential component of their structure.
According the scope of each application in the final product, the user can either retrieve
required information from a database or input his own data for a specific site. Soil and crop
data, together with agroclimatic and remote sensing data, can provide information not only to
FAO’s technical staff but also to the scientific community for a wide range of applications such
as:
• Estimation of potential productivity of a region and comparison with the actual productivity
in order to understand the technical, economic and social constraints to increased
productivity;
5
• Inventory of natural resources such as length of growing period, water availability, water,
solar and wind energy, biomass, and their spatial and temporal variability;
• Calculations of soil erosion, loss of soil fertility, land degradation in terms of soil fertility
and soil loss, forest and grassland ecosystem degradation, crust formation, leaching of
nutrients, and soil salinization;
• Identification of new crop management techniques and agrometeorological strategies for
improved application of information on the climatic factors and their annual variability;
• Planning land reclamation projects on the basis of climate and soil patterns to improve the
utilization of natural resources, limit the constraints of adverse conditions both on a local
and on a regional basis;
• Planning reforestation, windshelter, trees or hedges to control wind erosion and
microclimate and increased wood availability as fuel;
• Improving the knowledge of ecophysiology of main crops of economic interest to develop
resistance to thermal and water stress;
• Evaluation of the impact of CO2 on agricultural production.
Concerning crop data, the user would have information on: (i) phenology, (ii) ecophysiology,
(iii) morphology, (iv) management. While, for soils data, several physical and chemical
characteristics of soils and their spatial variability are relevant for agroclimatic applications, such
as: (i) depth, (ii) texture and structure, (iii) water characteristic curve describing the
moisture/potential relationships, (iv) thermal conductivity and diffusivity, (v) water
conductivity, (vi) organic matter. Also, although the soil chemical data cover a range of
elements, for most modeling purposes, information of soil organic matter status and the initial
nitrogen, phosphorus and potassium levels in the surface to -30cm soil depth could be required.

6
With regard to the management of crops and soils data, in particular, four main groups of
FAO applications software can be distinguished:
• Agrometeorology utilities, including crop water balance models: FAOINDEX, FAOMET
and CROPWAT;
• Agricultural and environmental databases: CPSZ and AGDAT;
• Plants environmental databases: ECOCROP-1 and ECOCROP-2;
• Soils databases and related applications: Digital Soil Map of the World and Derived
Properties, Multi-lingual Soil Database WORLD-SOTER.
8.2 Standards
One of FAO's main routine tasks is to facilitate the development and adoption of standards and
guidelines to improve the effectiveness of programmes in agricultural development and food
security world-wide. The adoption of standards is fundamental to ensure quality, accessibility,
usefulness and timeliness of agricultural information. Standardization has been applied mainly
to agrometeorology and remote sensing applications software in order to accommodate different
operational practices in each country such as different time intervals (days, pentads, weeks...)
used to report crop and weather data. Standardization considerably reduces the software
development and training. File and data management and analysis (processing) can be treated
separately. Two important steps towards standardization were the promotion, by WMO, of 10-
day intervals ("dekads") for operational agrometeorology, and the Climate Computing
(CLICOM) project.
The standardization applies to both file names and "styles." The "style" includes: (i) file
structure, i.e. the way in which the information is arranged in the file; (ii) format, i.e. the type of
coding (ASCII, binary, etc); (iii) contents, i.e. the type of data: rainfall, camel prices, NDVI...;
7
and (iv) auxiliary information, like the standard code for "missing data". A sample of a file
naming convention and style used by FAO in the agrometeorology applications software are
provided in Annexes 3 and 4, respectively.
8.3 FAOINDEX
FAOINDEX2 is a simple weather-based crop monitoring software based on the FAO crop
specific soil water balance deriving several parameters which are then subsequently used for
crop monitoring and forecasting. The derived parameters include crop actual evapotranspiration
(ETA), surplus or deficit of water, and the FAO water requirement satisfaction index (WRSI),
expressing the percentage of crop water requirements. More details can be found in the standard
publication by Frère and Popov (1986).
The programme’s outputs, from soil moisture content to ETA, are written to files where they are
further processed for crop monitoring and forecasting purposes. Input files (as ASCII text) are
prepared with commonly available standard software (spreadsheet or text editor). The
programme uses dekads as time-step and all calculations are performed up to the end of the crop
cycle. Missing rainfall and potential evapotranspiration (PET) values are systematically replaced
by the corresponding normal.
Crop parameters include planting date, cycle length from planting to maturity, water-holding
capacity, and effective rainfall. These parameters are taken from a file ("crop inputs file") which
allows the user to experiment with different soil water capacities or planting dates. The crop
coefficients can be read as "built-in" in the programme or the user can list all the crop
coefficients in the same file as the other crop parameters. In the first option, crop specific
2 developed by FAO-Agrometeorology Group of Environment and Natural Resources Service (SDRN)

8
coefficients to estimate crop water requirements cannot be modified by the operator, but they are
listed in the TXT format output file. The procedure followed for the calculation is presented by
Gommes (1983) and the absolute values are taken from Doorenbos and Pruitt (1984) Doorenbos
and Kassam (1986).
Concerning soil characteristics, the only parameter taken into consideration is the water holding
capacity which is usually defined as the difference between "field capacity" (the water content of
a water saturated soil after the excess has been drained off) and the water stored in the soil at the
"permanent wilting point." It is a parameter empirically derived from field observations or
laboratory tests.
8.4 FAOMET
FAOMET3 (1993) performs a series of calculations
4 which are frequently required in
agrometeorological operations. The "statistical options" include the interpolation of missing
data, rainfall probabilities with the incomplete gamma distribution, correlation analysis, and the
identification of trend changes in yield series. The four "agrometeorological options" are the
calculation of day and night temperatures from the extremes, the estimation of dekad normals
from monthly normals, the new standard FAO recommended Penman-Monteith reference crop
evaporation (1991), and growing season characteristics.
The length of the growing period (LGP), as defined by the FAO Agro-Ecological Zones
methodology (AEZ), is the period (in days) during a year when precipitation exceeds half the
potential evapotranspiration, plus a period required to evapotranspire an assumed 100 mm of
water from excess precipitation stored in the soil profile.
3 developed by FAO-Agrometeorology Group of Environment and Natural Resources Service (SDRN)
4 FAOMET implements most of the algorithms given in FAO (1983)

9
The LGP is a useful concept for calculating agricultural potential. It can be used as a criterion
for classifying areas, and, for approximately determining crop cycle lengths. The calculation of
the growing period is based on a simple water balance model, comparing precipitation with
PET, using monthly values. This utility obtains specific information on a "normal" growing
period, start and end of the growing period, and the length of the humid period.
8.5 CROPWAT
CROPWAT5 is an applications software for irrigation planning and management. Its main
functions are: to calculate reference evapotranspiration, crop water requirements, and crop
irrigation requirements; to develop irrigation schedules under various management conditions
and water supply scheme; to estimate rainfed production and drought effects; and, to evaluate
the efficiency of irrigation practices.
CROPWAT is a practical tool to help agrometeorologists, agronomists and irrigation engineers
to carry out standard calculations for evapotranspiration and crop water use studies, and, more
specifically, the design and management of irrigation schemes. It allows the development of
recommendations for improved irrigation practices, the planning of irrigation schedules under
varying water supply conditions, and the assessment of production under rainfed conditions or
deficit irrigation.
CROPWAT, developed in MS-DOS and MS-Windows, uses a revised method for estimating
reference crop evapotranspiration, adopting the approach of Penman-Monteith as
recommended by the FAO Expert Consultation held in May 1990 in Rome (1991).
5 developed by FAO- Water Resources, Development and Management Service (AGLW)

10
These estimates are used in crop water requirements and irrigation scheduling calculations.
Calculations of crop water requirements and irrigation requirements are carried out with
inputs of climatic and crop data. Standard crop data are included in the program and climatic
data can be obtained for 144 countries through the CLIMWAT-database.
Crop characteristics, used for calculations of water requirements, can be entered by the user or
retrieved by existing default files. They are: planting date, length of the individual growing
stages, crop factors, rooting depth, allowable depletion, and yield response factor. For rice,
some supplementary crop data can be entered. They include: length of nursery period, length
of land preparation, nursery area, land preparation depth, and percolation rate.
Soil parameters, used by CROPWAT, include: total available soil moisture content, initial soil
moisture depletion, maximum rooting depth, and maximum rain infiltration rate. By
providing these soil characteristics, the user can define a description of soil type for a specific
site.
8.6 CPSZ Database
The IGAD6 Crop Production System Zones
7 (CPSZ) database brings together information on
physical environment, agronomy, livestock and occurrence of biotic and abiotic hazards to
agricultural production. One of the main purposes of the CPSZ database is to interface
statistical data by administrative units with geo-referenced physical, agronomic and livestock
data. For planning purposes and to ensure the compatibility with other background data (such
6 Inter-government Agency on Development is composed of Djibouti, Eritrea, Ethiopia, Sudan, Uganda , Kenya
and Somalia
7 developed under the FAO GCPS/RAF/256/ITA Project in co-operation with the FAO-Agrometeorology Group of
Environment and Natural Resources Service (SDRN)

11
as demography and agricultural statistics), the information is presented according to geographic
units largely following administrative boundaries. The region is subdivided into 1220
homogeneous map units, which correspond to administrative units, or subdivisions thereof,
whenever steep ecological gradients occur. These map units constitute the basic elements in the
database. For each of the map units, up to 502 variables describing the physical and biological
environment, as well as the prevailing agricultural practices (including livestock) have been
assembled. Based on the above-mentioned variables, 44 relatively homogeneous CPSZ were
defined using mainly statistical clustering techniques.
The CPSZ describe actual farming in the region, not potential crop zones. The main
subdivisions are: (i) arid and hyper-arid areas, (ii) marginally productive lowland, (iii)
productive lowland, (iv) marginally productive highland, (v) productive highland and (vi)
irrigated areas. Class (i) covers mainly desert and pastures. Additional subdivisions of classes
(ii) to (v) are according to the main crops grown, the number of growing periods and other
environmental characteristics. The CPSZ Database Viewer software gives the user a more
direct access to the actual data. In addition to displaying the mapped data on the screen, it also
permits data extraction for further processing. The CPSZs represent homogeneous zones in
terms of agro-ecological conditions and current distribution of agricultural land use.
12
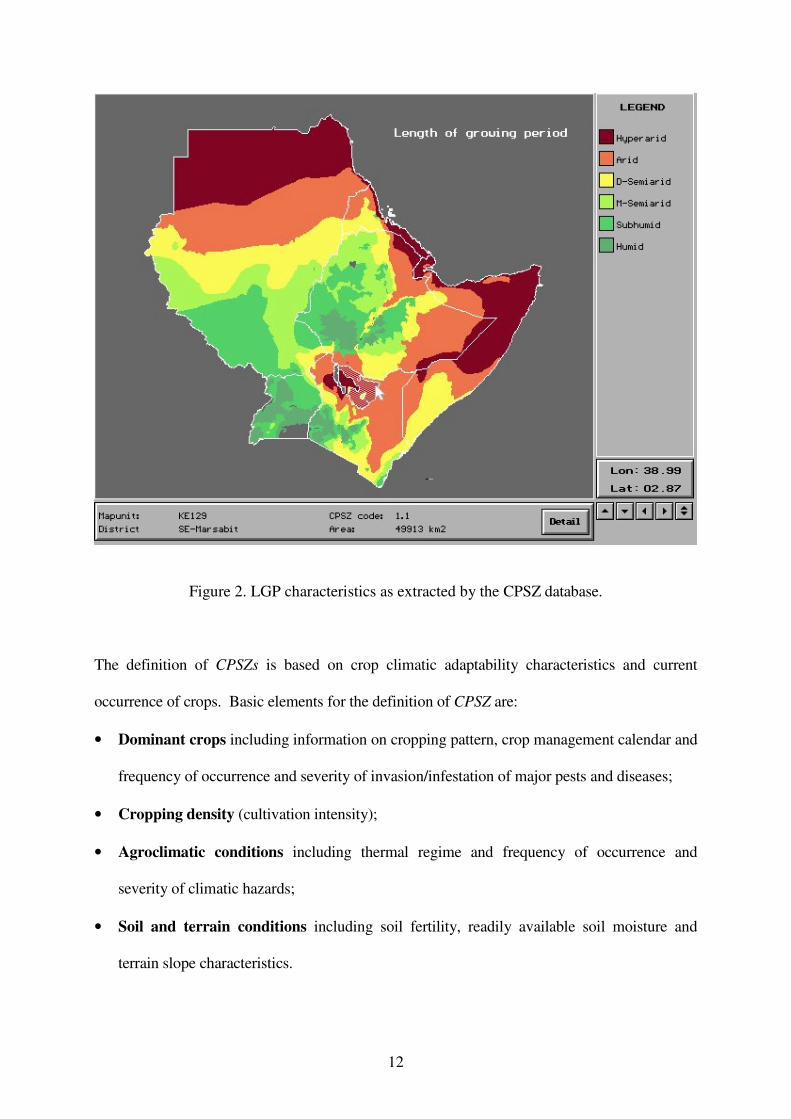
Figure 2. LGP characteristics as extracted by the CPSZ database.
The definition of CPSZs is based on crop climatic adaptability characteristics and current
occurrence of crops. Basic elements for the definition of CPSZ are:
• Dominant crops including information on cropping pattern, crop management calendar and
frequency of occurrence and severity of invasion/infestation of major pests and diseases;
• Cropping density (cultivation intensity);
• Agroclimatic conditions including thermal regime and frequency of occurrence and
severity of climatic hazards;
• Soil and terrain conditions including soil fertility, readily available soil moisture and
terrain slope characteristics.
13
Soil and terrain information of the CPSZ map units is included in the physical environment data
matrix. An assessment of selected soil and terrain properties was made for soil mapping units
occurring in each CPSZ. Soil data were extracted from the Soil Map of the World (FAO, 1990).
A GIS attribute file was constructed for each CPSZ that contains a code number, the extent of
soil mapping units occurring in it, the proportional extent of each soil map unit in the CPSZ, and
the total extent of the CPSZ. This data file was used to analyze the composition of each soil
map unit in terms of topsoil texture, dominant slope and soil phase.
Based on established relationships between soil properties, soil classification unit names and
other factors (texture, slope, phase), algorithms were developed in order to estimate the
proportional extent of the following attributes in each CPSZ map unit (Nachtergaele and
Zanetti, 1993):
• Maximum readily available soil moisture storage capacity;
• Terrain slope;
• Inherent soil fertility;
• Potential waterlogging and ponding risk.
Further analysis of the data by CPSZ map unit resulted in the following parameters:
• Weighted average maximum readily available soil moisture (mm/m)
• Standard deviation of maximum readily available soil moisture
• Inherent soil fertility class (relative occurrence low; medium and high fertility)
• Weighted average terrain slope (%)
• Standard deviation of terrain slope (%)
• Potential waterlogging/ponding hazard (percentage occurrence of total area)
14
8.7 AGDAT Database
AGDAT8 is a set of sub-national agricultural data in Africa to be used as background
information for crop monitoring purposes by the FAO Agrometeorology Group. The data
collection started in the early Nineties, and it adopts the years 1986-1990 as the reference
period. The database also includes some demographic data, environmental information such
as topography, climate and NDVI9, as well as a qualitative description of current cropping
patterns based on the other data. AGDAT contains the proper database as well as the software
for displaying and exporting data.
The data in the AGDAT database refer mostly to the sub-national administrative units, the
names of which include province, region, district, préfecture, wilaya, woreda etc. AGDAT
provides information on area and population data, as well as agricultural “statistics” on coarse
grains, roots and tubers, pulses, maize, sorghum, millet, rice, wheat, cassava, taro and yams,
white potatoes, common bean, groundnuts, cotton. Additional information includes
topography, annual rainfall, monthly temperature, monthly NDVI, potential biomass,
cropping typology.
8 developed by FAO-Agrometeorology Group of Environment and Natural Resources Service (SDRN)
9 Normalized Difference Vegetation Index as measured by NOAA polar satellites

15
Figure 3. Maize yield as extracted by the AGDAT database.
8.8 ECOCROP-1
ECOCROP-110
is a tool to identify plant species for given environments and uses. The
database contains basic crop environmental information and permits the identification of 1710
plant species of economic importance whose most important climate and soil requirements
match the information on soil and climate entered by the user. It also permits the
identification of plant species for defined uses. It can be used as a library of crop
environmental requirements and it can provide plant species attribute files on crop
10 developed by FAO-Land and Water Development Division (AGL)
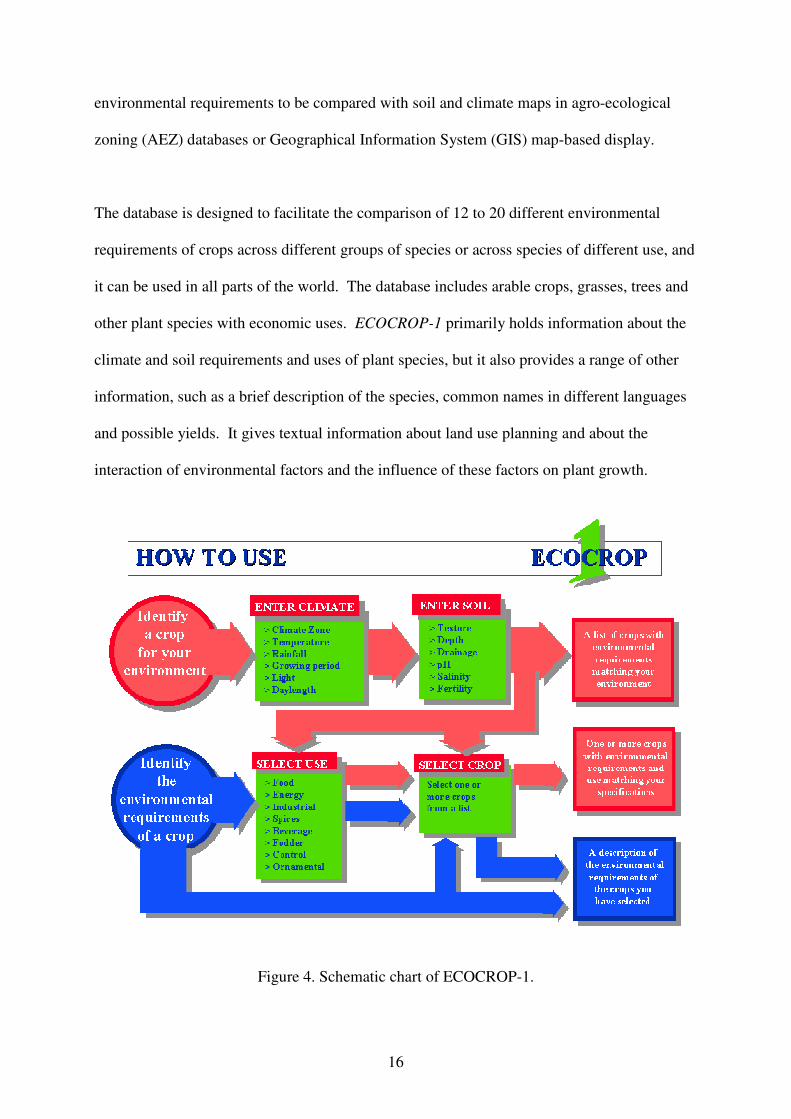
16
environmental requirements to be compared with soil and climate maps in agro-ecological
zoning (AEZ) databases or Geographical Information System (GIS) map-based display.
The database is designed to facilitate the comparison of 12 to 20 different environmental
requirements of crops across different groups of species or across species of different use, and
it can be used in all parts of the world. The database includes arable crops, grasses, trees and
other plant species with economic uses. ECOCROP-1 primarily holds information about the
climate and soil requirements and uses of plant species, but it also provides a range of other
information, such as a brief description of the species, common names in different languages
and possible yields. It gives textual information about land use planning and about the
interaction of environmental factors and the influence of these factors on plant growth.
Figure 4. Schematic chart of ECOCROP-1.

17
ECOCROP-1 allows the user to perform the following tasks:
• Identify suitable crop or tree species for a specified environment;
• Enter information about local climate and soil conditions, such as temperature, rainfall,
light soil texture, depth, pH, salinity and fertility. ECOCROP-1 then identifies the plant
species with key climate and soil requirements that match the data entered;
• Identify crop or tree species for a defined use;
• Specify one or more use(s) and ECOCROP-1 identifies according to selected plant species
for food, fodder or pasture, green manure, energy, fibre, timber, paper pulp, shelter and
shade, industrial purposes, erosion control, ornamentals and many other uses;
• Be a library of crop environmental requirements;
• Use ECOCROP-1 as a checklist or library to look up the optimum and minimum-
maximum ranges of crop environmental requirements for 1710 species.
8.9 ECOCROP-2
ECOCROP-211
is a tool to record, organize, compare and use crop response studies to
environmental and management factors. The database holds crop response information for
varieties of 20 crops of worldwide economic importance. ECOCROP-2 is designed as a
library of studies on crop responses in relation to environmental and management factors.
It has been created to provide information for crop modeling and is intended especially as a
tool to help researchers and scientists record, organize, handle and retrieve their own
experimental findings and specific information on plant species of interest to them. The crop
files follow the DSSAT (Decision Support System for Agrotechnology Transfer) format and
are therefore widely applicable. The database holds information on varieties of 20 crops of
worldwide importance. Each crop file contains on average 200 to 220 separate crop
11 developed by FAO-Land and Water Development Division (AGL)

18
environmental response studies or data sets extracted from 40 to 50 sources. The user can
select certain environmental or management factors and crop responses, for which the
information can be displayed in the form of response curves or in tabular form.
ECOCROP-2 allows the user to perform the following tasks
• To find environmental response information for 20 crops of global importance;
• To find information for crop modeling, including the facility to graph the plant responses;
• To record, organize and compare additional crop response information.
Figure 5. Schematic chart of ECOCROP-2.

19
8.10 Soil Databases and Related Applications
There are two basic types of soil data: soil profile data and soil maps. The first is a list of
observable and analytical parameters at a given point and time. It is representative of an area of
only a few square metres, known as a pedon. Soil maps are constructed using data from a large
number of profile descriptions. The mapping process uses a variety of information and
interpretative models, including topography, vegetation and an understanding of soil-forming
processes. Maps are spatial representations in which the fundamental soil properties, which are
continuous on the ground, are combined into discrete classes.
There is only one map which covers the entire land surface of the world at a resolution
appropriate to problems to be tackled at continental, regional and global scales, namely the 1:5
million scale FAO/UNESCO Soil Map of the World. It was published during the 1970's in 18
sheets and the legend forms the basis for the FAO soil classification system. In 1996, FAO
produced its own raster version which had the finest resolution with a 5' x 5' cell size (9 km x 9
km at the equator) and which had a full database completely corresponding with the paper map
in terms of soil units, topsoil texture, slope class and soil phase. The present version of the
Digital Soil Map of the World12
(DSMW), published on CD-ROM, contains two types of files:
(i) DSMW map sheets and (ii) derived soil properties files with images derived from the Soil
Map of the World.
The DSMW consists of ten map sheets: Africa, North America, Central America, Europe,
Central and Northeast Asia, Far East, Southeast Asia, and Oceania. The maps are available in
three different formats: one vector format (ARC/INFO Export) and two raster formats called
ERDAS and IDRISI (or flat raster) formats. The DSMW contains direct information on the
12 developed by FAO-Land and Water Development Division (AGL)

20
composition of each mapping unit in terms of the soil type that is dominant, associated or
included, the topsoil texture of the dominant soil type (three classes: coarse, medium and fine),
the slope of the unit (three classes: 0-8%, 8-30% and > 30%) and the eventual soil phase present
(saline, sodic, depth phases, etc.).
The Derived Soil Properties files consist of interpretation programs and related data files.
Included are programs that interpret the maps in terms of agronomic and environmental
parameters such as pH, organic carbon content, C/N ratio, clay mineralogy, soil depth, soil and
terrain suitability for specific crop production, soil moisture storage capacity and soil drainage
class. The output is given in the form of maps and data files, which can be stored for later
retrieval. Special country analyses can be made for specific soil inventories, problem soils and
fertility capability classification for every country in the world. The output is in tabular form.
Also included are maps of classification units of the World Soil Reference Base units and
topsoil distribution, which can facilitate the teaching of soil science. In addition there is a soil
database developed specifically for environmental studies on a global scale, which includes soil
moisture storage capacity, soil drainage class and effective soil depth.
Another important application software for soil data management is the Multi-Lingual Soil
Database13
(SDBm). This is a database tool useful for storage of primary soil information
assembled at national level, or data collected in a soil survey at sub-national and local level.
SDBm data are used in the computerized AEZ land evaluation systems. It is useful to soil
scientists, agricultural extension officials and environmental modellers.
13 developed by FAO-Land and Water Development Division (AGL)

21
SDBm is a collection of programs languages incorporated into a menu-based interactive user
interface to enter data and manage the database. The coding system used in the database
conforms to FAO Guidelines for Soil Profile Description. Data storage is greatly facilitated by
the multilingual function which provides "assist menus" in three languages: English, French
and Spanish. Options for simple statistical analysis: calculation of weighted averages or
dominant values of selected variables by soil unit, depth range and group of soil profiles;
graphic presentation of soil analysis data, such as pie chart image of relative percentages of
variable groups of attributes in a given soil profile. SDBm has been used to create a global soil
profile database linked with the FAO digitized soil map of the world. SDBm is being used by
soil and land use planning institutions in various countries.
The SOTER14
(SO for Soil, TER for Terrain) program provides an orderly arrangement of
natural resource data in such a way that these data can be readily accessed, combined and
analysed from the point of view of potential use and production, in relation to food
requirements, environmental impact and conservation. Fundamental in the SOTER approach is
the mapping of areas with a distinctive, often repetitive pattern of landform, morphology, slope,
parent material and soils at 1:1 million scale (SOTER units). Each SOTER unit is linked
through a geographic information system with a computerized database containing, in theory,
all available attributes on topography, landform and terrain, soils, climate, vegetation and land
use. In this way, each type of information or each combination of attributes can be displayed
spatially as a separate layer or overlay or in tabular form. The SOTER concept was originally
developed for application at country (national) scale and national SOTER maps have been
prepared, with the assistance of the International Soil Reference and Information Centre
(ISRIC). The original idea of SOTER was to develop this system worldwide at an equivalent
14 developed jointly by FAO-Land and Water Development Division (AGL) and ISRIC
22
scale of 1:1 million scale in order to replace the paper Soil Map of the World. More information
is available from the website at http://www.isric.nl/SOTER.htm.
8.11 Conclusions
Some of the agroclimatic applications software developed by FAO have been presented. Due to
the wide range of activities in which FAO is involved, the scope of these applications differs
extremely one from the other. Five groups of software can be distinguished from purely
agrometeorological purposes to the more general crop environmental response. The main
problem is that, among these applications, data format also differs and therefore data exchange
is not an easy task. The potential offered by GIS has sometime stressed the problem instead of
simplifying it as the developer has the tendency to introduce a new data format for the specific
application without any relationship with existing formats. Most of the recommendations made
during the Expert Consultation held in Rome in 1995 on the “Coordination and Harmonisation
of Databases and Software for Agroclimatic Applications" (FAO, 1995) still have to be
implemented. This is due to the lack of coordination among the groups that have the major
management responsibility for each of the four databases; climate, crops, soils and remotely
sensed data. Most of agroclimatic applications software developed world-wide are intended for
research purposes and only a few (mainly developed by FAO) are oriented towards the
operational users, such as the national agrometeorological services in developing countries.
References
Doorenbos, J and W.O. Pruitt, 1984. “Guidelines for predicting crop water requirements” (un-
modified reprint of revised 1977 edition). FAO Irrigation and drainage paper 24. FAO, Rome,
144 pp.
Doorenbos, J and A.H.Kassam, 1986. “Yield response to water” (un-modified reprint of 1979
edition). FAO Irrigation and drainage paper 33. FAO, Rome, 193 pp.

23
FAO, 1971-1981. “The FAO-UNESCO Soil Map of the World”. Legend and 9 volumes.
UNESCO, Paris
FAO. 1978. Report on the agro-ecological zones project. Vol 1: Results for Africa. World Soil
Resources Report 48/1. FAO, Rome, 158pp. and 8 tables.
FAO , 1990. FAO/Unesco Soil Map of the World, Revised Legend. Volume VI. Africa. Soils
Bulletin no. 60, 123 p.
FAO, 1991. “The Digitized Soil Map of the World”. World Soil Resources Report 67 (10
Diskettes). FAO, Rome.
FAO. 1991. Revision of FAO Methodologies for Crop Water Requirements, Report on the
Expert consultation held at Rome, 28-31 May 1990. M. Smith (Ed.). FAO, Land and Water
Development Division, Rome, 54 pp.
FAO. 1994. . “ECOCROP, the adaptability level of the FAO crop environmental requirements
database” by Sims, D., P. Diemer and U. Woods-Sichra. AGLS, FAO, Rome (two diskettes).
FAO, 1995. “The Digitized Soil Map of the World Including Derived Soil Properties”.
(version 3.5) FAO Land and Water Digital Media Series 1. FAO, Rome.
FAO. 1995. "Coordination and Harmonisation of Databases and Software for Agroclimatic
Applications". Proceedings of an Expert Consultation held in FAO, Rome, Italy, from 29
November to 3 December 1993. FAO Agrometeorology Series Working Paper n.13. 313 pp.
FAO. 1995. “FAOCLIM 1.2 - CD-ROM with World-wide Agroclimatic Data”. FAO
Agrometeorology Working Paper Series N. 11. FAO, Rome. 68 pp. and one CD-ROM.
FAO. 1995. “Crop production System Zones of the IGAD sub-region”. FAO Agrometeorology
Working Papers Series No. 10, by Van Velthuizen, H., L. Verelst and P. Santacroce. FAO,
Rome. 89 pp, one A0-sized map and one diskette.
Frère M. and Popov G.F., 1986. “Early Agrometeorological crop yield forecasting”. FAO Plant
Production and Protection paper No. 73. FAO, Rome, 150 pp.
Gommes R., 1983. “Pocket computers in agrometeorology”. FAO Plant Production and
Protection paper No. 45. FAO, Rome, 140 pages.
Gommes, R. and See L., 1993. “FAOMET - Agrometeorological Crop Forecasting Tools”. FAO
Agrometeorology Working Paper Series N. 8. FAO, Rome. 59 pp.
IGAD, 1992. A quick reference to project's filenames and Conventions. IGAD EWFIS for food
security, FAO/GCPS/RAF/256/ITA, Manuals and methodologies N. 3. Djibouti, 25 pp.
Nachtergaele, F. , Zanetti M. 1993. “Technical report on the extraction of soil characterisitcs
from the Soil Map of the world for the IGAD region”, FAO, Rome. 23 p.
24
Annex 1
FAO DATABASES, STATISTICAL AND GEOGRAPHICAL INFORMATION
(Last Revision: 11 April 2000)
This list does not include GIS databases available at FAO Regional Offices and at country
level GIS projects.The following URL contains information about the availability of the maps
in various formats: and contact persons:
http://www.fao.org/WAICENT/FAOINFO/SUSTDEV/EIdirect/gis/EIgis000.htm, while the
following URL provides information about the availability of the maps on CD-ROM:
http://www.fao.org/AG/AGL/lwdms.htm.
Global Datasets
1. Digital Soil Map of the World
Digital Soil Map of the World and Derived Soil Properties in Arc/Info Format (separate coverages for
each continent). Also available in IDRISI and ERDAS Imagine format. The derived soil properties
maps include many images in IDRISI format, such as soil pH, soil moisture storage capacity, organic
carbon, specific problem soils etc.
Source: FAO/UNESCO Scale: 5,000,000
2. FAO World Soil Resources
Simplified Soil Map of the World with 28 classes.
Source: FAO Scale: 25,000,000
25
3. Distribution of Major Soil Types
33 maps, derived from the Digital Soil Map of the World and using the IUSS Reference Classification
(WRB), showing the global distribution of the following soil types:- Acrisols, Albeluvisols, Alisols,
Andosols, Arenosols, Calcisols, Cambisols, Chernozems, Cryosols, Durisols, Ferralsols, Fluvisols,
Gleysols, Gypsisols, Histosols, Kastanozems, Leptosols, Lixisols, Luvisols, Nitisols, Phaeozems,
Planosols, Plinthosols, Podzols, Regosols, Solonchaks, Solonetz, Umbrisols and Vertisols.
Source: FAO Scale: 25,000,000
4. Soil Organic Carbon Pool
Derived from the FAO/UNESCO Digital Soil Map of the World (DSMW). (Separate coverages for each
continent).
Source: FAO Scale: 5,000,000
5. World Food Summit Maps
A series of 19 maps depicting national statistics for the following food security indicators: - Chronic
undernutrition, Population Growth, Dietary patterns, Dietary Energy Supply, Vitamin A Deficiency,
Economic Importance of Agriculture, Food Production Growth, Food Production Growth / Person,
Growth in Yield 1963-5 to 1993-5, Irrigated Land, Water Utilisation Intensity, Human Induced Soil
Degradation, Fish as Food, Forests and Other Woodlands, Import Dependency, Rural and Urban
Population, Role of Trade, Refugees and Food Aid.
Source: FAO Scale: 25,000,000
Developing World
1. World Climate and Length of Growing Period
Length of Growing Period, LGP (in days) and Major Climatic Zones.
Source: FAO Scale: 10,000,000
26
6. Coastal Lowlands of the Developing World
Coastal Lowlands of the Developing World. Seven files covering South America, Central America,
Africa, the Near East, South Asia, South East Asia and Far East Asia. Polygon features depicting eolian
or wave built sediment bodies (including beaches), tidal flats, coastal plain, low lying fluvitile areas,
Swampy areas (mangrove and non mangrove) and sebkha or extremely saline fluvitile areas. Line
features depicting the 200m bathymetric contour, coral reef and sandy beaches. Digitized in 1995 from
original manuscripts at scales ranging between 1:3800000 and 1:10000000.
Source: FAO Scale: 5,000,000
7. Nutrition Profiles for 40 Countries
Country Profiles prepared to date:- Argentina, Bangladesh, Belize, Bhutan, Bolivia, Brazil, Burkina
Faso, Cambodia, Chad, China, Chile, Colombia, Costa Rica, Ecuador, Ethiopia, Fiji, Guinea, Haiti,
India, Indonesia, Jamaica, Laos, Malaysia, Mali, Mauritania, Marocco, Myanmar, Nepal, Niger,
Pakistan, Papua New Guinea, Paraguay, Peru, Senegal, Sri Lanka, Togo, Uruguay, Venezuela, Vietnam
and Zimbabwe.
Source: FAO Scale:Various national scales
Africa Datasets
2. Sub National Boundaries of Africa (1999)
Updated version of the Sub National Boundaries of Africa, as of June 1999. Contains first and second
level boundaries for all countries and third level for some.
Source: FAO Scale: Various national scales
3. Sub National Boundaries of Africa (1993)
Administrative map of Africa clipped with coast line, and contains water bodies, double-lines rivers and

27
islands.
Source: Various Scale: Various national scales
4. Road Network of Africa
Road network of Africa, prepared for the Desertification Assessment 1985..
Source: FAO Scale: 5,000,000
5. Hydrological Basins of Africa
Hydrological Basins of Africa, with major basins and sub basins, derived from USGS topographic data,
March 2000.
Source: USGS/FAO Scale: 5,000,000
6. Hydrological Basins of Africa
Hydrological basins of Africa (primary and secondary), prepared for the Desertification Assessment
1985.
Source: FAO Scale: 5,000,000
7. Major Rivers of Africa
Major Rivers of Africa (with RNK = 2), prepared for the Desertification Assessment 1985.
Source: FAO Scale: 5,000,000
8. Rivers of Africa
Africa rivers (all), prepared for the Desertification Assessment 1985.
Source: FAO Scale: 5,000,000
28
9. Geomorphology of Africa
Coverage of the morphological regions of Africa, prepared for the Desertification Assessment 1985.
Source: FAO Scale: 5,000,000
10. Soil and Terrain Database for North-eastern Africa
Soil and Terrain Database and Crop Production Zones for 10 countries in north-eastern Africa, also
attributes for other themes, countries covered are as follows:- Burundi, Djibouti, Egypt, Eritrea,
Ethiopia, Kenya, Rwanda, Somalia, Sudan and Uganda.
Source: FAO / ISRIC Scale:1,000,000 – 2,000,000
11. Physiographic map of Africa
Physiographic map of Africa, according to SOTER principals.
Source: FAO / ISRIC Scale: 5,000,000
12. Cities of Africa
Cities of Africa, prepared for the Desertification Assessment 1985.
Source: FAO Scale: 5,000,000
Asia Datasets
13. Physiographic map of Asia
Physiographic map of Asia (in three coverages; Near East, South East and Far East Asia).
Source: FAO/ISRIC Scale: 10,000,000
14. Problem Soils of Asia

29
Dominant and Secondary Soil Constraints, derived from the FAO/UNESCO Digital Soil Map of the
World.
Source: FAO Scale: 5,000,000
15. Sub National Boundaries of Asia
Ungeneralised version of 1999 dataset with full coding.
Source: FAO Scale: Various national scales
16. Soil and Physiographic Database for North and Central Eurasia
Soil and Physiographic Database for North and Central Eurasia.
Source: FAO Scale: 5,000,000
Latin America and Caribbean Datasets
17. Sub National Boundaries of South and Central America
Published on the SOTER CD-ROM
Source: CIAT Scale: 5,000,000
18. SOTER database for Latin America and the Caribbean
Soil and Terrain information for Latin America and the Caribbean at 1:5000000. Incorporates national
level data which has been completed since the production of the Digital Soil Map of the World in the
1070's. Information is stored and linked according to the Soil and Terrain (SOTER) principals.
Source: FAO/UNEP/ISRIC/CIP Scale: 5,000,000

30
19. Vegetation Map of South America
Vegetation map of South America, prepared by Université Paul Sabatier, originally in raster format.
Source: Université Paul Sabatier/FAO Scale: 5,000,000
National Level Datasets
20. SOTER database for Tanzania
Soil and Terrain database for Tanzania.
Source: FAO/UNEP/ISRIC/LIP Scale: 2,000,000
Databases and Statistical Information
One of the functions of FAO is to collect, analyse, interpret and disseminate information
relating to nutrition, food, agriculture and fisheries. The central unit within FAO who deals
with statistical databases is the World Agricultural Information Centre (WAICENT).
WAICENT ‘s main database is called FAOSTAT.
FAOSTAT is an on-line and multilingual database currently containing over 1 million time-
series records covering international and national statistics in the following areas:
• Production
• Trade
• Food Balance Sheets
• Food Aid Shipments
• Fertilizer and
• Land Use and Irrigation
• Forest Products
• Fishery Products
• Population
• Agricultural Machinery

31
Pesticides
32
Annex 2
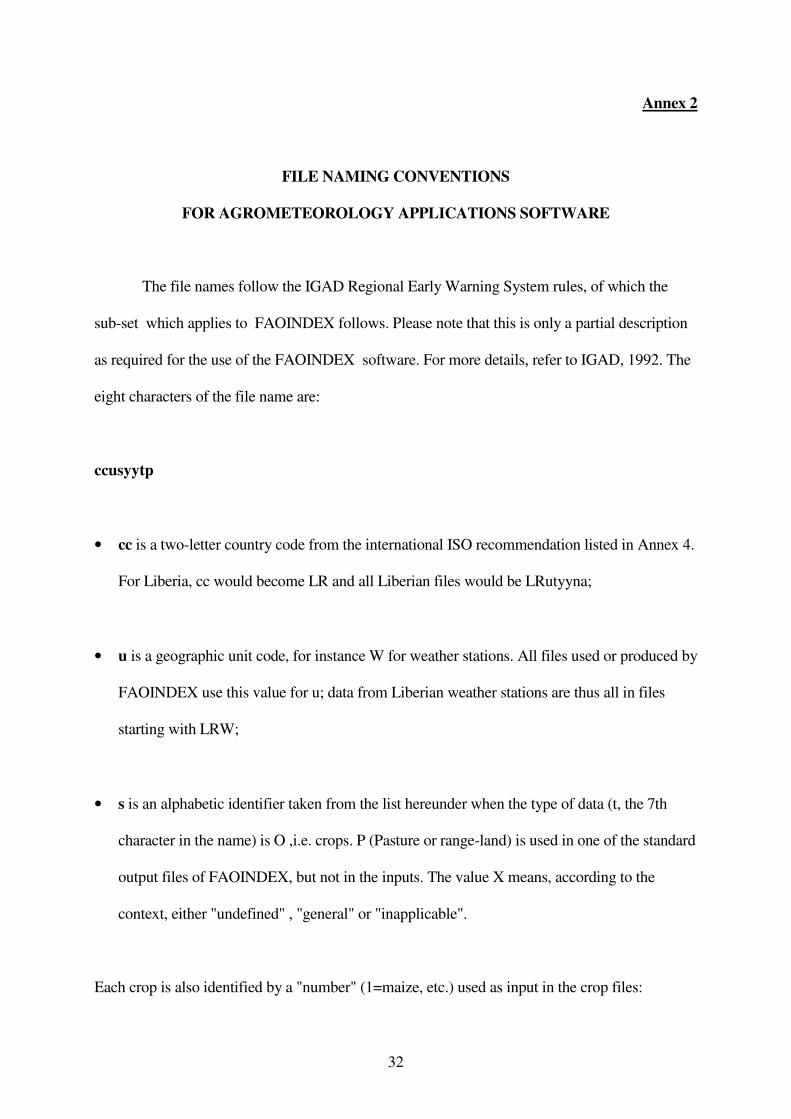
FILE NAMING CONVENTIONS
FOR AGROMETEOROLOGY APPLICATIONS SOFTWARE
The file names follow the IGAD Regional Early Warning System rules, of which the
sub-set which applies to FAOINDEX follows. Please note that this is only a partial description
as required for the use of the FAOINDEX software. For more details, refer to IGAD, 1992. The
eight characters of the file name are:
ccusyytp
• cc is a two-letter country code from the international ISO recommendation listed in Annex 4.
For Liberia, cc would become LR and all Liberian files would be LRutyyna;
• u is a geographic unit code, for instance W for weather stations. All files used or produced by
FAOINDEX use this value for u; data from Liberian weather stations are thus all in files
starting with LRW;
• s is an alphabetic identifier taken from the list hereunder when the type of data (t, the 7th
character in the name) is O ,i.e. crops. P (Pasture or range-land) is used in one of the standard
output files of FAOINDEX, but not in the inputs. The value X means, according to the
context, either "undefined" , "general" or "inapplicable".
Each crop is also identified by a "number" (1=maize, etc.) used as input in the crop files:
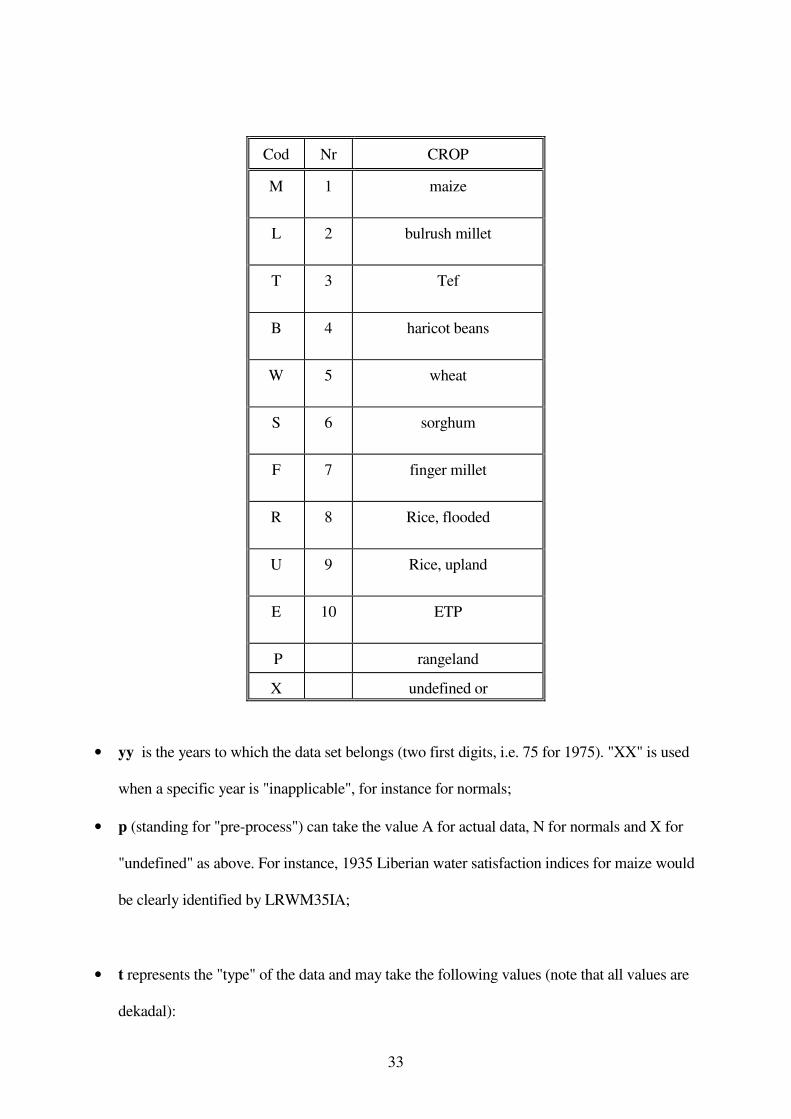
33
Cod Nr CROP
M 1 maize
L 2 bulrush millet
T 3 Tef
B 4 haricot beans
W 5 wheat
S 6 sorghum
F 7 finger millet
R 8 Rice, flooded
U 9 Rice, upland
E 10 ETP
P rangeland
X undefined or
• yy is the years to which the data set belongs (two first digits, i.e. 75 for 1975). "XX" is used
when a specific year is "inapplicable", for instance for normals;
• p (standing for "pre-process") can take the value A for actual data, N for normals and X for
"undefined" as above. For instance, 1935 Liberian water satisfaction indices for maize would
be clearly identified by LRWM35IA;
• t represents the "type" of the data and may take the following values (note that all values are
dekadal):

34
Type Parameter (15)
O Crop data, qualified by s
R Rainfall (mm)
E Potential evapotranspiration (mm)
I FAO water satisfaction Index (%)
U Water surplus or deficit (mm)
S Soil moisture (mm)
In practice, to run FAOINDEX, it is necessary to replace, in the filenames below, cc by
the actual country code, yy by the current years value (89, 90, 91...) and s by the appropriate crop
code:
ccWXyyRA.DAT current dekad rainfall
ccWXXXRN.DAT dekad rainfall normal
ccWXyyEA.DAT current dekad potential evapotranspiration
ccWXXXEN.DAT normal dekad potential evapotranspiration
ccWsyyOA.DAT crop parameters of current year
The user has to prepare the files above, but 6 output files are created by FAOINDEX in
DAT format:
15 Additional elements can be coded in this system: A, average maximum temperature; C, cold cloud duration; D
sunshine duration in hours per day (average over the dekad); F, sunshine fraction (0-1); H, water vapour pressure (kPa);
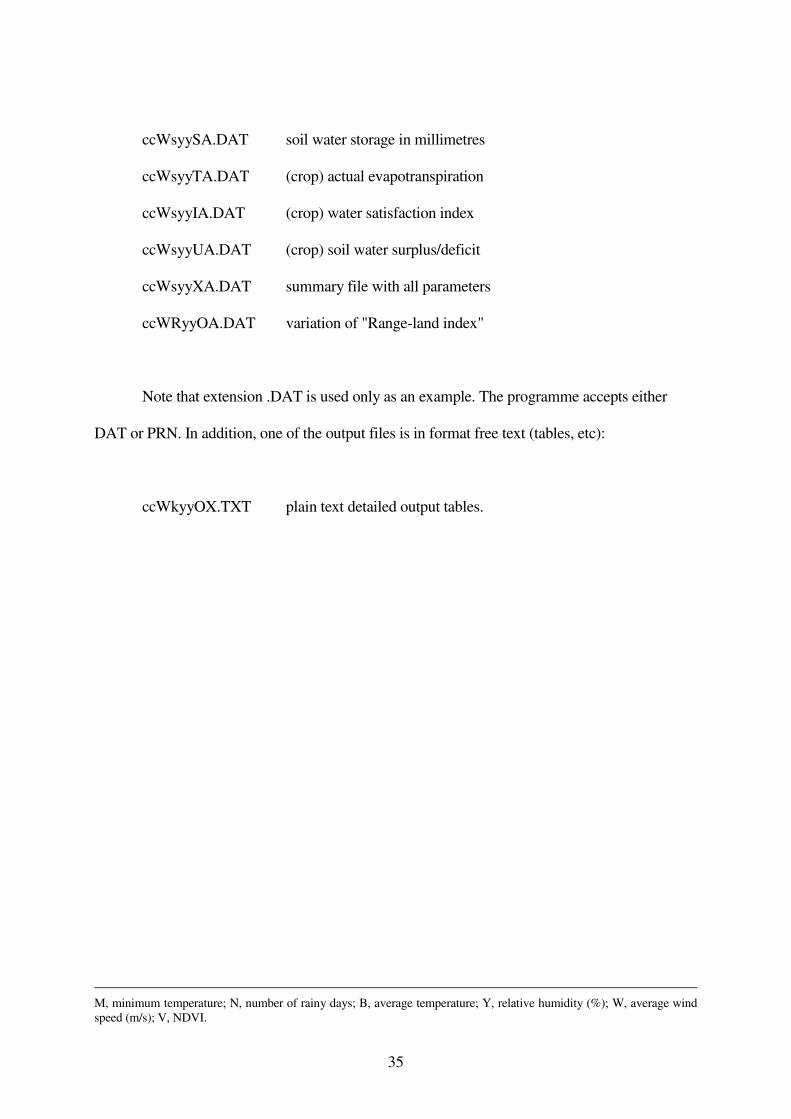
35
ccWsyySA.DAT soil water storage in millimetres
ccWsyyTA.DAT (crop) actual evapotranspiration
ccWsyyIA.DAT (crop) water satisfaction index
ccWsyyUA.DAT (crop) soil water surplus/deficit
ccWsyyXA.DAT summary file with all parameters
ccWRyyOA.DAT variation of "Range-land index"
Note that extension .DAT is used only as an example. The programme accepts either
DAT or PRN. In addition, one of the output files is in format free text (tables, etc):
ccWkyyOX.TXT plain text detailed output tables.
M, minimum temperature; N, number of rainy days; B, average temperature; Y, relative humidity (%); W, average wind
speed (m/s); V, NDVI.

36
Annex 3
FILE STYLE FOR AGROMETEOROLOGY APPLICATIONS SOFTWARE
The IGAD files are ASCII files with the following general structure:
one title line
one line with V variable names
L lines with an optional "label" and V data items
where characters (as opposed to numbers) can be quoted or not, and the items on each line can be
separated by spaces or commas. The "comma separated, quoted character string" is also known
as MAILMERGE format. The two files below are thus equivalent:
Mali 1990, Sorghum
WSI YLD LAT Lon
Kayes 95.8 758 14.5 -11.0
Bafoulabe 92.6 843 14.0 -10.0
Diema 88.7 792 14.5 -19.5
Kenieba 98.8 760 13.0 -11.1
Kita 95.5 787 13.5 -9.5

37
(empty) lines or lines containing only commas are ignored, and so are spaces in excess of 1
between data or variables; character strings must imperatively contain no spaces nor commas,
as spaces or commas are used as separators between items. Variable names and line labels must
start with an alphabetic character. WMO station numbers, for instance, should not be given as
60.135, but X60.135 or WMO-60.135
The first line is any text to identify the contents of the file. The second line identifies the
variables contained in the columns. Again, variable names must not contain spaces, thus, do not
use Normal PET, but rather NormalPET, PET(normal), Normal-PET...
Programmes assume that the number of data items in lines 3 onwards is the same as on
line 2. For instance, if line 2 lists 4 variables, as above, all data items in excess of 4 will be
ignored. If, on the other hand, a data line contains insufficient data items, the programmes
reading the file should issue a warning and either skip the record or stop altogether. Each line
may also begin with an optional string of characters which contain a line identifier (the line
label), typically station names.
"Mali 1990 Sorghum yield"
"","WSI","YLD","LAT","Long"
"Kayes",95.8,758,14.5,-11
"Bafoulabe",92.6,843,14,-10
"Diema",88.7,792,14.5,-9.5
"Kenieba",98.8,760,13,-11.1
"Kita",95.5,787,13.5,-9.5