applications of remote sensing and gis in soil...
TRANSCRIPT

Vol. 34, No. 6, 2016 1481
Applications of Remote Sensing and GIS in Soil ScienceNational Academy of Agricultural Science (NAAS)Rating : 3. 03
© Serials Publications
Applications of Remote Sensing and GIS in Soil Science
P.D. Sreekanth1* and Debarup Das1
Abstract: Soil plays a very crucial role in supporting ecosystems and human civilization. Besides being a non-renewableand valuable resource, it has high variability in its properties and behaviour all over the World.Soil survey helps to prepareinventory of different kinds of soils and extent of distribution for the prediction of their characteristics and potentialities.Such knowledge is required for making better utilization of soils in a sustainable way. Traditional soil survey techniquesare time consuming, labour intensive and costly. Recent advancements in computer and information technology havebrought new techniques of soil resource mapping. Remote sensing (RS), Geographical Information System (GIS)andGlobal Positioning System (GPS) are such techniques for analysis the different features of soils over space and time.Present paper describes the role of RS, GIS and GPS technologies for mapping and characterizing soils at various scales.The spectral behaviour of soil and its components, which is fundamental to deriving information from RS data is alsodiscussed.
Keywords: RS, GIS, GPS, Soil studies, Suitability mapping, Soil Moisture, Soil texture, Soil Erosion and Conservation.
1 ICAR-National Academy of Agricultural Research Management, Hyderabad.* E-mail: [email protected]
INTRODUCTION
Soil plays a very crucial role in supportingecosystems and human civilization. Besides beinga non-renewable and valuable resource, it has highvariability in its properties and behaviour all overthe World. Non-judicious exploitation of resourcesby mankind has not only resulted in the depletionof finite land resources but also deteriorated theirperformance. All the production systems have theirbase in soil, so it is very much important for us toknow its properties, extent and spatial distribution.Sustenance of ecosystem depends on soil (Gessler,1996). Thus, characterization and mapping of soilsand their interpretation is of great significance. Forthis, one has to evaluate the quantity as well asquality of resources based on accurate baselineinformation and methods (Laake, 2000). Soil surveyhelps to prepare inventory of different kinds of soilsand extent of distribution for the prediction of theircharacteristics and potentialities (Mandal andSharma, 2005). Such knowledge is required for
making better utilization of soils in a sustainableway. Traditional soil survey techniques are timeconsuming, labour intensive and costly. Recentadvancements in computer and informationtechnology have brought new techniques of soilresource mapping. RS, GIS and GPS are suchtechniques for analysis the different features of soilsover space and time (Yeung and Lo, 2002; Shrestha,2006).
These geospatial tools are very valuable forpreparation of soil resource inventory at local toglobal scales. RS provides spatially explicit, digitaldata representing the surface features of earth thatcan be pooled with digitized maps in GIS forefficient characterization and analysis of vastamounts of data. In natural resource management,satellite RS along with GIS can be very much useful.According to Karla et al. (2010), RS integrated withGIS database can enhance data collection andinterpretation for soil survey in much lesser timeand with lesser expenses as compared to

1482 International Journal of Tropical Agriculture © Serials Publications, ISSN: 0254-8755
P.D. Sreekanth and Debarup Das
conventional methods. The high precision andsynoptic coverage of RS data and GIS analysisprotocols have made soil mapping very effectivetool in managing the soil resource and environment(Srinivasan, 1988).
RS FOR SOIL STUDIES
RS is a process by which one can draw inferenceabout the surface properties of soils frommeasurements of electromagnetic (EM) radiationemitted or reflected from the land surface. Thenature of this radiation emitted or reflected fromthe surface varies with the physical and chemicalcharacteristics of the soil matrix (Anderson andCroft, 2009; Mulder et al., 2011). For this reason, it ispossible to study soil properties and processes anddifferentiate between various soils using themeasured radiation (Dewitte et al., 2012).
RS systems can be divided into passive andactive based on the light source used. In passive RS,such as in imaging spectrometers and multispectralinstruments visible, near-infrared (VNIR),shortwave infrared (SWIR), thermal infrared (TIR),and microwave portions of EM spectrum are used.On the other hand, most of the active sensors usethe microwave portion. There are four types ofsensors for passive remote sensing. These are opticalmultispectral sensors (land use and mineralogicalstudies), optical imaging spectroscopy sensors(retrieving soil properties like mineralogicalcomposition, Fe-oxides, organic matter), optical TIRsensors (soil temperature estimation), and passivemicrowave sensors (soil moisture estimation). Inactive remote sensors, there are synthetic apertureradar (SAR) sensors (soil moisture, texture andsalinity estimations), radar scatter meter sensors(soil moisture estimation), and LiDAR sensors(terrain analysis).
Based on the platform, RS could be groundbased, air-borne or space-borne. Air- and space-borne sensors provide greater area coverage ascompared to the ground-based sensors. RADARand passive microwave systems mainly provide soilrelated data at regional- or catchment-scale.Airborne systems (LiDAR, multi-spectral andhyperspectral) can monitor at finer spatialresolutions. They can also identify variables like
mineralogy, moisture, elevation etc. Proximalsensing (PS) like laboratory laser profiling works atthe finest spatial scale in assessing soil parameters(Jester and Klik, 2005).
Interpretation of RS data is very important ifproper inference regarding soil properties has to bedrawn. During interpreting the RS data, one shouldkeep in mind the general limitations of RStechniques. There are some issues regarding thespatial and temporal resolution of air- and space-borne observations. Generally, polar orbitingsatellites have revisiting times varying from daysto weeks based on their observation geometry,orbital and energy constraints and downlinkcapacity. Intensity of the acquired radiation andmeasuring distance affect the spatial resolution.Spatial resolutions of passive microwave sensors arein tens of km, whereas that of optical airbornesensors ranges from cm to m. Remotely sensed datarequire many corrections due to geometric,topographic, atmospheric and radiometric effects.In case of soils, vegetation coverage and presenceof lichens can hamper investigations by opticalsensors. Spectral signatures of these items shouldbe masked before interpreting the data. But, suchmasking leads to incomplete coverage of the studyarea. Majority of the RS data only denote the surfaceproperties or of shallow soil depths, which may notrepresent the deeper layers.
In optical and microwave remote sensingtechniques, much advancement has emergedrecently. This advancement made possible the studyof many soil parameters like mineralogicalcomposition of soils, soil texture, soil moisture, soilorganic C, soil salinity, Fe content, carbonates,erosion and finally digital soil mapping (DSM). Forland use planning at different levels, soil maps atvarious scales are needed. With increase in scale,availability of information increases. For soil mapson 1:250,000 or smaller scale, coarse resolution dataobtained from IRS LISS-I, AWiFs and LANDSAT-MSS sensors can be used. For 1:50,000 scale soilmaps medium resolution data collected byLANDSATTM, IRS LISS-II and SPOT-MLA areuseful. Detailed characterization of soil resourceson 1:10,000 or larger scale can be done from IRS-P6(LISS-IV sensor), Cartosat-1 and Cartosat- 2 andIKONOS data (Dwivedi, 2001).

Vol. 34, No. 6, 2016 1483
Applications of Remote Sensing and GIS in Soil Science
GIS FOR SOIL STUDIES
GIS can be defined as a collection of tools forgathering, storing, retrieving at will, transformingand displaying spatial data from real world forpredetermined purposes (Burrough, 1986). Itconsists of four software function, viz. input,storage, manipulation and output of spatialinformation. The GIS system is so designed thathuge amount of spatially distributed data fromdifferent sources can be fed to it. GIS can storeinformation obtained from satellite data andtopographical maps. GIS enables efficient andeffective manipulation of non-spatial and spatialdata for mapping and characterization of soils (Staret al., 1997). Using GIS, one can avoid problemsrelated to data integration caused by variousgeographic units from diverse data sets.
The primary objective of GIS is to transformraw data into new information through overlay orother operations to support decision-making. Useof GIS has increased widely in recent years. Itsapplications have expanded very fast in accordancewith developments in RS to provide infrastructurefor the study of complex spatial problems in betterways (Asadi et al., 2012). Various authors havereported the applications of GIS in soil resourceinventory (Dwivedi 2001,), soil suitabilityassessment (Velmurugan and Carlos, 2009), landcapability classification (Panhalkar, 2011), landproductivity assessment (Patil et al., 2010) andquantification of soil loss (Reddy et al., 2004).
APPLICATIONS OF REMOTE SENSING ANDGIS IN SOIL RELATED STUDIES
Soil Survey
Enhancement in GPS capability and its bondingwith GIS has increased the aptitude of collectingmore accurate spatial and temporal data for soilsurvey, thus has revolutionized the entire process.Panhalkar (2011) reported the use of GPS forcollection of training site data and ground trothingof classified datasets. The geographic coordinateslink the information from the field to thecorresponding area on the satellite image, which inturn leads to classification and interpretation. Incombination with metadata, coordinates are savedwhich can be examined with the help of GIS andimage processing tools (Reddy et al., 2012).
The surface features on satellite imageryprovide sufficient information for correctdelineation of boundaries. This can be effectivelyachieved by systematic interpretation of satellitedata (Velmurugan and Carlos, 2009). Preliminarytraversing of the study area can be done with thehelp of topo-sheets and satellite images prior toactual fieldwork (Natarajan et al., 2009). Informationgathered from various satellite data whenreferenced with that of GPS can be used to suggestmanagement strategies (Liaghat and Balasundram,2010). Combination of GPS and GIS has madepossible site-specific farming to be developed andimplemented. Such techniques enable the linkingof real-time data collection with accurate positioninformation, resulting better manipulation andanalysis of large volume of geo-spatial data (Barneset al., 1998). Hand held GPS can be used to locaterepresentative soil profiles and examination ofmorphological properties. Details of the location canthen be transferred to GIS for creating thematicmaps. Soil spatial variations can be easily depictedin GIS maps with the help of point marking basedon overall uniformity of soil properties. Hugevolume of spatial information can be well managedwith the surface and overlay analysis abilities of GIS(Ekanayaki and Dayawansa, 2003). Based on landuse, soil texture, slope, land capability classification(Ali, 2008), soil resource mapping (Velmurugan andCarlos, 2009), land degradation maps (Wang et al.,2006) have been done in the past.
Soil Suitability Mapping
Optimal use of land resources for stable andsustainable agricultural production requires priorknowledge about the suitability of soils for variousactivities (Ekanayake and Dayawansa, 2003). Dueto the development of fine resolution satelliteimagery and GIS techniques, soil suitabilitymapping has become less expensive and moreefficient. This approach assumes that climate, landuse, topography and soil attributes continuouslyvary with space (Lagacherie and McBratney, 2007).Such approach gives spatial information that canbe easily analysed and represented using GIS. Landsuitability maps have been prepared using IRS-P6LISS III (Mustafa et al., 2011) and soil suitabilitymaps using Multi criteria evaluation, Quick Bird(60cm) and LISS-IV data (Ceballos- Silva and Lopez-Blanco, 2003).
1484 International Journal of Tropical Agriculture © Serials Publications, ISSN: 0254-8755
P.D. Sreekanth and Debarup Das
Soil Erosion and Conservation
Soil erosion severely affects many parts of the worldin terms of land degradation and deterioration ofenvironment. It affects soil fertility, water quality,agriculture productivity, and also reservoir capacity(Demirci and Karaburun, 2011; Xu et al., 2013).Appropriate information is necessary for selectionof suitable, technically sound, and economicallyeffective measures for conservation of soil andwater. Formulation of holistic measures for soilconservation and water harvesting requires accurateand timely information on the natural resources(Renard et al., 1997). Some reports suggestedconservation measures viz. contour bunding,contour trenching, levelling of gullies etc. using LISSIV satellite data for conservation of resources at theparcel level (Chandrashekhar and Govindappa,2009; Kumaraswami et al., 2011). To conserve soilmoisture and avert soil erosion, vegetation wallswere suggested after using combined highresolution satellite data of LISS III and PAN. In asimilar way, percolation tanks and check-dams havebeen advocated at different areas across farm pondsand streams to preserve water (Singh and Singh2009, Sankar et al., 2012). Some workers reportedthe use of contour trenching, contour bunding, gullylevelling etc. as conservation measures employingLISS IV satellite data (Chandrashekhar andGovindappa 2009; Kumaraswami et al., 2011).
Mineralogy
Spectral images of bare in-situ soils and rocks canbe used to determine the mineralogical compositionof the surface. Different minerals can be distinguishedfrom the differences in the spectral signatures inVNIR to TIR range. Such estimations require finespectral resolution of airborne or space-borne data.High spatial resolution is also helpful in minimizingthe mixing effects of different spectra from landcovers. Due to high spectral and spatial resolution,images from air-borne sensors (e.g. AVIRIS,HyMAP) are very much appropriate for such task(Green et al., 1998). For estimation of weatheringstage of soil, SiO2 and Al2O3 have been mapped fromAVIRIS data (Galvao, 2008; Bedini et al., 2009).Combinations of multispectral satellite data havealso been employed to estimate mineralcompositions. For instance, Landsat TM data andASTER data have been used in synergy to
differentiate mineral types based on ASTER andlithological variation based on Landsat TM. ASTERGeoscience Products have also revealed similarresults (Cudahy, 2012). Spectra in TIR region candiscern minerals like quartzites, silicates, carbonatesin rocks. Spectral libraries having signatures ofmany minerals are available in several institutes.
The ASTER spectral library version 2.0 is oneof such libraries that has over 2400 spectra ofminerals, rocks, vegetation and manmade materialsin the range of 0.4 to 15.4 �m (Baldridge et al., 2008).Another such library is USGS Spectral Library thathas a large variety of mineral spectra (Clark et al.,2007). Algorithm based expert systems like PRISMand Tetracorder tool can be used for soil and terrainmapping. These systems compare spectra ofunknown materials with reference spectra ofmaterials with known composition. From all overthe world, spectral properties of soil minerals andland cover types are listed in the USGS library,which allows the identification and characterizationof unknown materials through spectroscopic studies(Kokaly, 2011).
Soil Texture
Soil texture, in routine analysis, is determined fromrelative proportions of sand, silt and clay estimatedby tedious and time consuming procedures, whilein RS, specific absorption characteristics are usedto differentiate quartz-rich soils from clay-rich ones(Figure 1).
Hydroxyl groups of clay minerals typicallyabsorb radiation at 2.2 µm; ASTER bands 5 and 6can capture this feature and give SWIR Clay Index(Chabrillat, 2002). Thermal bands from 8 to 9.5 µmcan be used to detect quartz due to the occurrenceof reflectance peak of silica in this EM range; thiscorrespond to ASTER bands 10 and 14. Thermal IRbands 10 and 14 along with ASTER SWIR bands 5and 6 have been used to separate bright sandy soilsand dark clayey soils from non-photosyntheticvegetation on a limited scale, but presence of organicmatter affects the accuracy (Breunig et al., 2008).Multispectral imagery from ASTER can also be usedfor determination of broad textural classes with thehelp of principal components analysis (PCA) (Apanet al., 2002). However, in most of the cases,multispectral sensors are not suitable to gather

Vol. 34, No. 6, 2016 1485
Applications of Remote Sensing and GIS in Soil Science
necessary information for soil texture estimation.Multiple linear regression (MLR) or partial least-square regression (PLSR) can be used to retrieve soiltexture from PS data. Though these methodsshowed promising results in soil texture prediction,they cannot give accurate results beyond the extentof calibration (Minasny et al., 2008; Mulder et al.,2011). Radar data have also been used to retrievesoil texture, though in a much lesser extent thanoptical imagery. From dielectric constant obtainedfrom backscatter data of ERS-2 SAR, Singh andKathpalia (2007) retrieved soil texture along withmoisture and roughness using Genetic Algorithmbased empirical modelling.
Soil Moisture
Soil moisture is a crucial component in land-atmosphere interactions (Pielke, 2001). It plays animportant role in hydrology, environmentalsciences and agriculture. In earlier days, watershedstudies have used soil moisture data retrieved frommicrowave observations like Special SensorMicrowave Imager (SSM/I) (Lakshmi, 1998).Wagner et al., (2013) retrieved soil moisture fromAdvanced Scatter meter (ASCAT) and reported itsmain features and applicability. Dielectric constantof dry soil differs from that of water. Based on this,soil moisture content can be determined from thebackscatter data obtained from microwave RS.
There is an index called Soil Water Index (SWI)that considers ERS/ASAR along with METOP datato get temporal resolution of one day for each 1 kmspace (Figure 2) (Wagner et al., 2007).
The index is mainly useful to detect temporalchanges in soil moisture content, but not suitablefor quantification of soil moisture content (Wagneret al., 2007). Paulik et al., (2014) reported poorcorrelation between in situ soil moisture data andSWI data. The passive microwave Soil Moisture andOcean Salinity satellite gives a global coverage at 1km spatial resolution and 3 to 5 days’ temporalresolution. The predicted surface soil moisture (0-3cm) is expected to be precise to within 4% soilmoisture content on volume basis (Panciera, et al.,2009).
Based on reflectance data in SWIR portion ofEMS, soil water have been estimated by imagingspectroscopy indices (Haubrock et al., 2008).Nonetheless, presence of vegetation has limited theretrieval accuracy of most algorithms. Spengler etal,. (2013) could remove this problem by taking intoaccount the vegetation-cover interference of up to75%. There is another way of estimating soilmoisture that relies on energy balance models.Studies on such approaches have been conductedon plots to local scale and generated spatio-temporalpredictions for evapotranspiration in connectionwith soil moisture. Among various models of soilmoisture estimation based on RS data, the mostpopular are
1. SEBAL (Soil Energy Balance) that aggregatescontributions from soil and vegetation toestimate ET(Bastiaanssen et al., 2005);
2. TSEB (Two-Source Energy Balance) thatseparates soil from vegetation (Aly et al., 2007);and
Figure 1: Nominal clay content (%) for distinct soil units based on predictions using Bayesian belief networks (Left). Soil texturebased on regression kriging (Right).

1486 International Journal of Tropical Agriculture © Serials Publications, ISSN: 0254-8755
P.D. Sreekanth and Debarup Das
3. SEBs (Surface Energy Balance System) thatestimates surface evaporation and turbulentatmospheric fluxes using optical and thermalregions of EMS (Van Der Kwast, 2009).
From the interactions of soil moisture withvegetation and land surface temperature, soil waterdownscaling algorithms have been derived (Mallicket al., 2009). Other types of algorithms rely on soilevaporation efficiency model and have been usedto downscale SMOS soil moisture (Merlin et al., 2011;Merlin et al., 2012) and AMSR-E soil moisture (Fangand Lakshmi, 2013). Based on NormalizedDifference Vegetation Index, Land SurfaceTemperature and brightness temperature, analgorithm has been developed to differentiate SMOSsoil moisture (Piles et al., 2009), AMSR-E soilmoisture (Kim and Hogue, 2012). A differentcategory of models chains active radar data withpassive radiometer observations. Earlier works havealso employed L-band microwave radarobservations with passive microwave radiometer
data for disaggregating soil water (Das et al., 2011;Piles et al., 2011).
Soil Organic C
Soil organic C (SOC) is the key factor indicatingfertility and plant growth and to a negotiable extent,affects CO2 concentration in atmosphere. It makessoil healthy and maintains productivity. Faster,more practical, precise and less expensive methodsare needed to better characterize and monitor SOCchanges (Izaurralde et al., 2013). Proximal soilsensing gives many tools to build a multi-sensorsystem to competently determine the organic Cstock of soil profiles (ViscarraRossel et al., 2011). Forinstance, gamma radiometers, electromagneticinduction sensors, and precise global navigationsystems can produce multivariate secondaryinformation to design sampling strategies and mapsoil C (Miklos et al., 2010). Soil visible–near infrared(vis–NIR) spectroscopy can be used to measure soilorganic C in the laboratory and in situ in the field.
Figure 2: Surface soil moisture maps of Oklahoma retrieved from ERS scatterometer in a 50 km spatial resolution (left) andASAR GM measurements in 1 km spatial resolution for three different dates in spring 2005 (right).
Vol. 34, No. 6, 2016 1487
Applications of Remote Sensing and GIS in Soil Science
Before we can start measuring with sensorshowever, we need to know where to sample.Locations can be selected by probability sampling(random sampling with known inclusionprobabilities) or by non-probability sampling,giving rise to two widely used philosophies: thedesign- and the model-based approaches (Papritzand Webster, 1995; de Gruijter et al., 2006). In thedesign-based approach, the source of randomnessof an observation is the random selection of thesampling sites. In the model-based approach,randomness originates from a random term in themodel of the spatial variation, which is added tothe model because our knowledge of the spatialvariation is imperfect. Thus, probability samplingis a requirement for the design-based approach,whereas it is not for the model-based. Choosing themost suitable approach depends, amongst other, onthe motivation (Brus and de Gruijter, 1997). Forexample, the design based approach might be moresuitable if the aim is to obtain estimates of the‘global’ mean or total stock and their accuracies foran area, whose quality is not dependent on thecorrectness of modelling assumptions. The model-based approach might be preferable if we want toproduce a ‘local’ map of the soil organic C stock inthe area. However, deciding which approach to useis often more complicated because the design basedapproach can also be used for estimation of localmeans, and the model-based approach can be usedfor global estimation.
Soil Salinity
In arid and semi-arid areas, scarce precipitationcannot maintain a regular percolation of rainwaterthrough the soil leading to accumulation of salts atthe surface affecting soil structure and landsuitability. Based on dielectric constant of soil,microwave RS can sense salinity (Aly et al., 2007).Soil salinity classes have been successfully derivedon a local scale (< 500 km2) with the C-, P-, andL-bands of airborne and space borne radar systems;best results are obtained using L-band data as longerwavelengths are more effective in penetrating soiland vegetation than higher frequencies (Lasne et al.,2008). Salt scalds and severely salinized soils exhibitadditional absorption features at 680, 1180 and 1780
nm. These help in recognizing minerals, such asbassanite, gypsum, and polyhalite, which can beused as salinity indicators. At 2200 nm, whensamples are more saline hydroxyl features becomeless pronounced. Using RS on a local scale (<104km), broad salinity classes can be mapped withASTER (Melendez-Pastor et al., 2010), HyMAP(Dehaan and Taylor, 2003), Landsat TM and ALIimagery - the latter two using the Salinity Index andthe Normalized Salinity Index (NSI) (Odeh andOnus, 2008). Weng et al., (2008) were able todiscriminate five classes of saline soils withHyperion data for an area of about 1200 km2.Alternative methods for mapping saline areas arebased on detecting the presence of salt scalds andhalophytic vegetation. However, the spectralresolution must be high in order to detect thedifferent vegetation types.
Soil Degradation
Imaging spectroscopy enables the assessment ofimportant soil erosion variables, such as watercontent and surface roughness (Haubrock et al.,2008). Furthermore, spectroscopic data can be usedto map post-fire soils and pin point water repellentsoil areas that tend to be potentially highly erodible(Lewis et al., 2004). The spectral difference betweenseverely eroded soils and intact topsoil haspreviously been used to map surface erosionprocesses. In a study area in southern France,various soil erosion states have been identifiedbased on the ratio between developed substratesand components of the parent material. Theircorresponding end-member spectra weresubsequently used to parameterize a spectralmixture model to map the spatial extent of soilerosion. The results highlighted that differenterosion levels could be mapped with an accuracyof about 80%, which proved superior to applyingthe approach of Landsat-TM imagery (Hill et al.,1995). Another approach to assess soil erosion andsoil degradation status is based on quantitativeestimates of specific soil chemical properties. In astudy area in south-eastern Spain imagingspectroscopy data have been used to identify SOCconcentrations indicating soil deposition anderosion states; high SOC concentrations in sedimentsinks provide favourable soil conditions, owing to
1488 International Journal of Tropical Agriculture © Serials Publications, ISSN: 0254-8755
P.D. Sreekanth and Debarup Das
their higher infiltration and water retentioncapacity, better aggregation, and increased nutrient
availability; the corresponding source areasrepresent active erosion and transport zones with
low organic carbon concentrations (Hill and Schütt,2000).
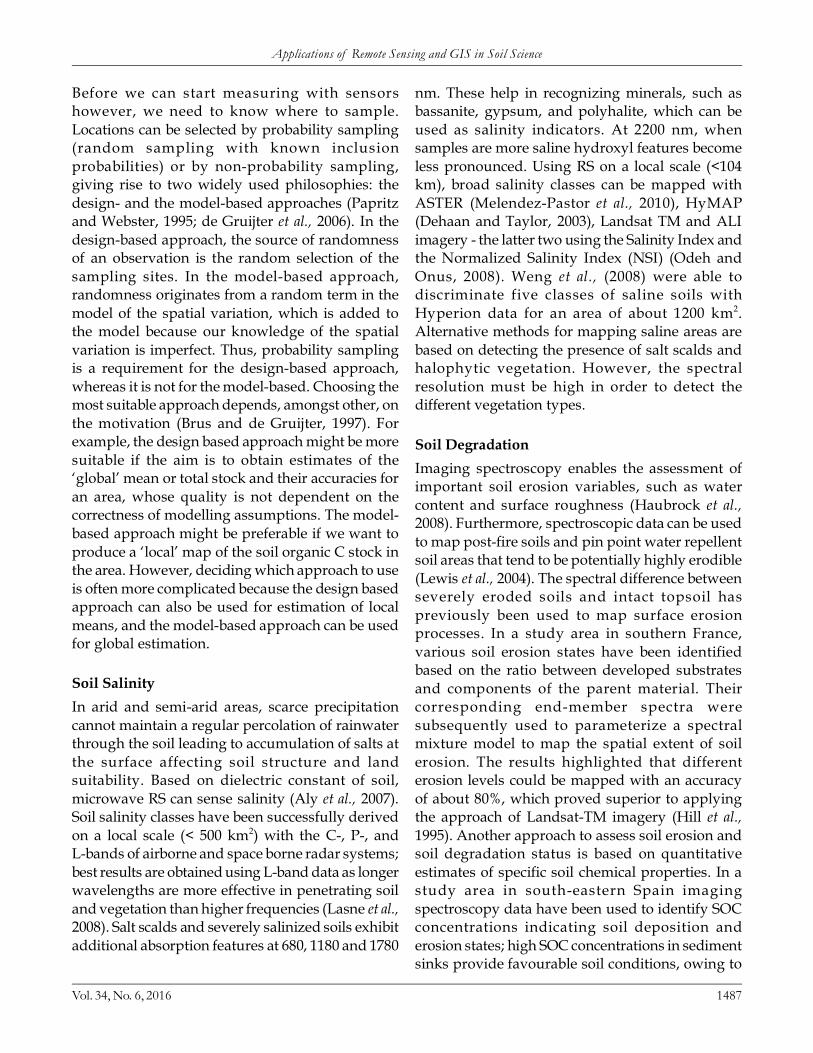
In the event of a collapsed dam for minetailings in southern Spain in 1999 the heavy metal
contamination of soils was explored using HyMAPimaging spectroscopy data (Figure 3). Based on
chemical and spectroscopy analysis of soil samples,prediction of heavy metals (As, Cd, Cu, Fe, Hg, Pb,
S, Sb, and Zn) was achieved by stepwise MLRanalysis and an artificial neural network approach.
It was possible to predict six out of nine elementswith high accuracy, using this approach. The best
coefficients of determination (R2) between the
predicted and chemically analysed concentrationswere As, 0.84; Fe, 0.72; Hg, 0.96; Pb, 0.95; S, 0.87;
and Sb, 0.93, respectively. Results for Cd (0.51), Cu(0.43), and Zn (0.24) were not significant (Kemper
and Sommer, 2002). In addition to the PS analysis, aVariable Multiple Endmember Spectral Mixture
Analysis (VMESMA), (García-Haro et al., 2005) wasused to estimate the sludge abundance derived from
the HyMap data. Furthermore, the analysis ofresidual pyrite-bearing material could be used to
assess acidification risk and the distribution ofresidual heavy metal contamination. This assessment
was based on an artificial mixture experiment andderived simple stoichiometric relationships. As a
result, the spatial sludge abundance distributionand associated heavy metals could be used to assess
the acidification potential and to plan counteracting
Figure 3: Sludge abundance map based on HyMap data from 1999 in Aznalcollar, Spain. The sludge affected area (blackbackground) is superimposed on the HyMap false color image.

Vol. 34, No. 6, 2016 1489
Applications of Remote Sensing and GIS in Soil Science
remediation measures (Kemper and Sommer, 2002).In summary, it can be concluded that the reflectance
properties of soils enable the assessment of variouscontaminants in their environment and that imaging
spectroscopy technology proved to be promising forthat purpose.
CONCLUSION
In summary, remote sensing provides data
1. supporting the segmentation of the landscape
into rather homogeneous soil-landscape unitswhose soil composition can be determined by
sampling or that can be used as a source ofsecondary information,
2. allowing measurement or prediction of soil
properties by means of physically-based andempirical methods, and
3. supporting spatial interpolation of sparselysampled soil property data as a primary or
secondary data source.
Emerging technologies like high resolutionsatellite data can be utilized successfully for deriving
the spatial and temporal agricultural informationat micro level. Organizing the satellite derived
spatial data and ground observations andnon-spatial attribute data, in a remote sensing, GPS
and GIS environment, would be highly desirable tofacilitate the sustainable development of the specific
region. The advent of high resolution satellite datain recent years has considerably contributed for
better management of resources, as it gives merereal time information and repetitive basis which is
important for monitoring.
The resources particularly soil and land needs
not only protection and reclamation but also ascientific basis for the management on a sustainable
manner so that the changes proposed to meet theneeds of development are brought without
diminishing the potential for their future use.Depending on the suitability of agro-ecological areas
for alternative uses based on the detailedinformation, optimum way can be suggested taking
into account the socio-economic conditions of thefarming community and political will. The review
on application of high resolution remote sensingdata in conjunction with GPS and GIS shows that
soil resource mapping and their characterization iscost and time effective for their efficient
management and use on sustainable basis.
ReferencesAli, R.R. (2008), Digital Soil Mapping for Optimum Land Uses
in some Newly Reclaimed Areas West of the Nile Delta,
Egypt. Australian Journal of Basic and Applied Sciences 2,
165-173.
Aly, Z., F. J. Bonn, and R. Magagi (2007), Analysis of the
Backscattering Coefficient of Salt-Affected Soils Using
Modeling and RADARSAT-1 SAR Data. Geoscience andRemote Sensing, IEEE Transactions on 45, 332-341.
Anderson, K. and H. Croft, (2009), Remote sensing of soil surface
properties. Progress in Physical Geography 33, 16.
Apan, A., R. Kelly, T. Jensen, D. Butler, W. Strong, and B. Basnet
(2002), Spectral discrimination and separability analysis
of agricultural crops and soil attributes using ASTER
imagery., in 11th ARSPC, edited, Brisbane, Australia.
Asadi, S.S., B.V.T. Vasantha Rao, and S. Sekar, (2012), Creation
of physical characteristics information for Natural
Resources Management Using Remote sensing and GIS:
A Model study. International Journal of Modern EngineeringResearch 2, 226-232.
Baldridge, A.M., S.J. Hook, C. I. Grove, and G. Rivera (2008),
The ASTER Spectral Library Version 2.0 Rep., 1-18 pp,
Jet Propulsion Laboratory.
Barnes, G.B., D. Chaplin, D. Moyer, E. Des Roche, M. Eckl, and
M. Santori, (1998), GPS methodology for cadastral
surveying and mapping in Albania, working paper no.17,
Albania Series, Land Tenure Centre, University of
Wisconsin- Madison.
Bastiaanssen, W. G. M., E.J.M. Noordman, H. Pelgrum, G.
Davids, B. P. Thoreson, and R. G. Allen (2005), SEBAL
Model with Remotely Sensed Data to Improve Water-
Resources Management under Actual Field Conditions.
Journal of Irrigation and Drainage Engineering 131, 85-93.
Bedini, E., F. van der Meer, and F. van Ruitenbeek (2009), Use
of HyMap imaging spectrometer data to map mineralogy
in the Rodalquilar caldera, southeast Spain. InternationalJournal of Remote Sensing 30, 327-348.
Breunig, F.M., L.S. Galvão, and A.R. Formaggio (2008),
Detection of sandy soil surfaces using ASTER-derived
reflectance, emissivity and elevation data: potential for
the identification of land degradation. International Journalof Remote Sensing 29, 1833 - 1840.
Brus, D.J., J.J. de Gruijter (1997), Random sampling or
geostatistical modelling? Choosing between design-based
and model-based sampling strategies for soil with
discussion. Geoderma 80,1-59.
Burrough, P.A. (1986), Principles of Geographic Information
Systems for Land Resource Assessment. Clarendon,
Oxford.
1490 International Journal of Tropical Agriculture © Serials Publications, ISSN: 0254-8755
P.D. Sreekanth and Debarup Das
Ceballos-Silva, A. and J. Lopez-Blanco, (2003), Delineation of
suitable areas for crops using a multi-criteria evaluation
approach and land use/cover mapping: a case study in
Central Mexico. Agricultural Systems 77, 117-136.
Chabrillat, S., A.F.H. Goetz, L. Krosley, H.W. Olsen, (2002), Use
of hyperspectral images in the identification and mapping
of expansive clay soils and the role of spatial resolution.
Remote Sensing of Environment 82, 431-445.
Chandra Sekhar, B. and K. Govindappa, (2009), Wastelands
development in Andhra Pradesh with particular
reference to Ananthapur District. My Forest 45, 251-260.
Clark, R. N., G. A. Swayze, R. Wise, E. Livo, T. Hoefen, R.
Kokaly, and S. J. Sutley (2007), USGS digital spectral
library splib06a, edited by U. S. G. Survey. Kokaly, R. F.
(2011), PRISM: Processing routines in IDL for
spectroscopic measurements (installation manual and
user’s guide, version 1.0), in U.S. Geological Survey Open-File Report edited, p. 432.
Cudahy, T. (2012), Satellite ASTER Geoscience Product Notes
for Australia, Version 1, edited by CSIRO, ePublish.
Das, N.N., D. Entekhabi, E.G. Njoku (2011), An algorithm for
merging SMAP radiometer and radar data for high-
resolution soil-moisture retrieval. IEEE Transactions onGeoscience and Remote Sensing 49, 1504-1512.
de Gruijter, J.J, D.J. Brus, M.F.P. Bierkens, M. Knotters (2006),
Sampling for Natural Resource Monitoring. Springer-
Verlag, Berlin Heidelberg.
Dehaan, R. L., and G. R. Taylor (2003), Image derived spectral
endmembers as indicators of salinization. InternationalJournal of Remote Sensing 24, 775-794.
Demirci, A., and A. Karaburun, (2011), Estimation of soil erosion
using RUSLE in a GIS framework: a case study in the
BuyukcekmeceLakewatershed, northwest Turkey.
Environmental Earth Science 66, 903-913.
Dewitte, O., A. Jones, H. Elbelrhiti, S. Horion, and L.
Montanarella (2012), Satellite remote sensing for soil
mapping in Africa: An overview. Progress in physicalgeography 36, 514-538.
Dwivedi, R.S. (2001), Soil resource mapping: a remote sensing
perspective. Remote Sensing Reviews 20, 89-122.
Dwivedi, R.S. (2001), Soil resource mapping: a remote sensing
perspective. Remote Sensing Reviews 20: 89-122.
Ekanayake, G.K. and N.D.K. Dayawansa, (2003), Land
Suitability Identification for a Production Forest through
GIS Technique. Forestry and Biodiversity. Map India
Conference.
Fang, B., and V. Lakshmi (2013), AMSR-E soil moisture
disaggregation using MODIS and NLDAS data (2013),
AGU Books.
Galvao, L. S., A.R. Formaggio, E.D. Couto, D.A. Roberts, (2008),
Relationships between the mineralogical and chemical
composition of tropical soils and topography from
hyperspectral remote sensing data. ISPRS Journal ofPhotogrammetry and Remote Sensing 63, 259-271.
García-Haro, F. J., S. Sommer, and T. Kemper (2005), A newtool for variable multiple endmember spectral mixtureanalysis (VMESMA). International Journal of RemoteSensing, 26, 2135-2162.
Gessler, P. E. (1996). Statistical soil–landscape modelling forenvironmental management. Doctoral Dissertation, TheAustralian National University, Canberra, Australia.
Green, R. O., et al. (1998), Imaging Spectroscopy and theAirborne Visible/Infrared Imaging Spectrometer(AVIRIS). Remote sensing of environment65, 227-248.
Haubrock, S., S. Chabrillat, C. Lemmnitz, and H. Kaufmann(2008), Surface soil moisture quantification models fromreflectance data under field conditions. InternationalJournal of Remote Sensing 29, 3-29.
Haubrock, S., S. Chabrillat, C. Lemmnitz, and H. Kaufmann,(2008), Surface soil moisture quantification models fromreflectance data under field conditions. Internationaljournal of remote sensing 29, 3-29.
Hill, J., J. Megier, and W. Mehl (1995), Land degradation, soilerosion and desertification Hill, M.O., D.B. Roy, J.O.Mountford, and R.G.H. Bunce (2000), ExtendingEllenberg’s Indicator Values to a New Area: AnAlgorithmic Approach. Journal of Applied Ecology 37, 3-15.
Izaurralde, R.C., C.W. Rice, L. Wielopolski, M.H. Ebinger, J.B.Reeves III, A.M. Thomson, R. Harris, B. Francis, S. Mitra,A.G. Rappaport, J.D. Etchevers, K.D. Sayre, B. Govaerts,G.W. McCarty (2013), Evaluation of three field-basedmethods for quantifying soil carbon. PLoS One 8,e55560 01.
Jester, W., and A. Klik (2005), Soil surface roughnessmeasurement-methods, applicability, and surfacerepresentation. Catena 64, 174-192.
Kalra, N.K., L. Singh, R. Kachhwah, and D.C. Joshi, (2010),Remote sensing and GIS in identification of soilconstraints for sustainable development in Bhilwaradistrict, Rajasthan. Journal of the Indian Society of RemoteSensing 38, 279-290.
Kemper, T., and S. Sommer (2003), Mapping and monitoringof residual heavy metal contamination and acidificationrisk after the Aznalcóllar mining accident (Andalusia,Spain) using field and airborne hyperspectral data, paperpresented at 3rd EARSeL Workshop on ImagingSpectroscopy, Herrsching, Germany, May 13-16 2003.
Kim, J., and T.S. Hogue (2012), Improving spatial soil moisturerepresentation through integration of AMSR-E andMODIS products. IEEE Transactions on Geoscience andRemote Sensing 50, 446-460.
Kumaraswami, G., K.M. Reddy, and G.M. Baba, (2011), Largescale wasteland mapping using IRS P-6 LISS IV data forintegrated wasteland development programme-A casestudy of Devarkonda block, Nalgonda district, A.P.International Journal of Earth Science and Engineering 4,89-93.
Laake, P. E. (2000), Spatial tools for Laymen, Natural ResourceManagement by experts. International Archives ofPhotogrammetry and Remote Sensing 33, 1593-1600.
Vol. 34, No. 6, 2016 1491
Applications of Remote Sensing and GIS in Soil Science
Lagacherie, P. and A.B. McBratney, (2007), Spatial soil
information systems and spatial soil inference systems:
Perspectives for digital soil mapping. Developments in SoilScience 31, 3-22.
Lakshmi, V., (1998), Special sensor microwave imager data in
field experiments: FIFE- 1987. International Journal ofRemote Sensing 19, 481-505.
Lasne, Y., P.H. Paillou, G. Ruffié, C. Serradilla, F. Demontoux,
A. Freeman, T. Farr, K. McDonald, and B. Chapman
(2008), Effect of salinity on the dielectric properties of
geological materials: Implication for soil moisture
detection by means of radar remote sensing. IEEETransactions on Geoscience and Remote Sensing 46,
1674-1688.
Lewis, S. A., P. R. Robichaud, W. J. Eillot, B. E. Frazier, and J.
Q. Wu (2004), Hyperspectral remote sensing of postfire
soil properties remote sensing for field users. Proceedingsof the 10th Forest Service Remote Sensing ApplicationConference, Salt Lake City, Utah, 1-9.
Liaghat, S. and S.K. Balasundram, (2010), A Review: The Role
of Remote Sensing in Precision Agriculture. AmericanJournal of Agricultural and Biological Sciences 5, 50-55.
Mallick, K., B.K. Bhattacharya, N.K. Patel (2009), Estimating
volumetric surface moisture content for cropped soils
using a soil wetness index based on surface temperature
and NDVI. Agricultural and Forest Meteorology 149,
1327-1342.
Mandal, A.K. and R.C. Sharma, (2005), Computerization
database on salt affected soils of Haryana state. Journal ofthe Indian Society of Remote Sensing 33, 447-455.
Marchetti, A., C. Piccini, R. Francaviglia, S. Santucci, and I.
Chiuchiarelli (2010), Estimating Soil Organic Matter
Content by Regression Kriging, in Digital Soil Mapping,
edited by J. Boettinger, D. Howell, A. Moore, A.
Hartemink and S. Kienast-Brown, pp. 241-254, Springer
Netherlands.
Mayr, T., and B. Palmer (2006), Chapter 26 Digital Soil Mapping:
An England and Wales Perspective, in Developments inSoil Science, edited by A. B. M. P. Lagacherie and M. Voltz,
pp. 365-618, Elsevier.
Melendez-Pastor, I., J. Navarro-Pedreño, M. Koch, and I. Gómez
(2010), Applying imaging spectroscopy techniques to
map saline soils with ASTER images. Geoderma 158, 55-65.
Merlin, O., A. Al Bitar, V. Rivalland, P. Béziat, E. Ceschia, G.
Dedieu (2011), An analytical model of evaporation
efficiency for unsaturated soil surfaces with an arbitrary
thickness. Journal of Applied Meteorology and Climatology50, 457-471.
Merlin, O., C. Rudiger, A. Al Bitar, P. Richaume, J.P. Walker,
Y.H. Kerr (2012), Disaggregation of SMOS soil moisture
in South-eastern Australia. IEEE Transactions on Geoscienceand Remote Sensing 50, 1556-1571.
Miklos, M., M.G. Short, A. McBratney, B. Minasny (2010),
Mapping and comparing the distribution of soil carbon
under cropping and grazing management practices in
narrabri, north-west New South Wales. Australian Journalof Soil Research 48, 248-257.
Minasny, B., and A. B. McBratney (2008), Regression rules as a
tool for predicting soil properties from infrared
reflectance spectroscopy, Chemometrics and IntelligentLaboratory Systems 94, 72-79.
Monitoring in Mediterranean ecosystems. Remote sensing reviews12, 107-130.
Mulder, V. L., S. de Bruin, M. E. Schaepman, and T. R. Mayr
(2011), The use of remote sensing in soil and terrain
mapping - A review. Geoderma 162, 1-19.
Mulder, V. L., S. de Bruin, M. E. Schaepman, and T. R. Mayr
(2011), The use of remote sensing in soil and terrain
mapping - A review. Geoderma 162, 1-19.
Mustafa, A.A., M. Singh, R.N. Sahoo, N. Ahmed, M. Khanna,
A. Sarangi, and A.K. Mishra, (2011), Land suitability
analysis for different crops: A multi-criteria decision
making approach using RS and GIS. Researcher 3,1-24.
Natarajan, A., R.S. Reddy, and J.P. Sharma, (2009), Soil survey
and mapping. Soil Survey Manual. Chapter-6, 72-82.
Odeh, I. O. A., and A. Onus (2008), Spatial analysis of soil
salinity and soil structural stability in a semiarid region
of New South Wales, Australia. Environmental Management42, 265-278.
Panciera, R., J.P. Walker, J.D. Kalma, E.J. Kim, K. Saleh, and J.-P.
Wigneron, (2009), Evaluation of the SMOS L-MEB passive
microwave soil moisture retrieval algorithm. RemoteSensing of Environment113, 435-444.
Panhalkar, S. (2011), Land capability classification for integrated
watershed development by applying RS and GIS
techniques. Journal of Agricultural and Biological Sciences6, 46-55.
Panhalkar, S. (2011), Land capability classification for integrated
watershed development by applying RS and GIS
techniques. Journal of Agricultural and Biological Sciences6, 46-55.
Papritz, A. and R. Webster (1995), Estimating temporal change
in soil monitoring: I. Statistical theory. European Journalof Soil Science 46, 1-12.
Pathe, C., W. Wagner, D. Sabel, M. Doubkova, and J.B. Basara
(2009), Using ENVISAT ASAR Global Mode Data for
Surface Soil Moisture Retrieval Over Oklahoma, USA.
Geoscience and Remote Sensing, IEEE Transactions on 47,
468-480.
Patil, S.S., V.C. Patil, and A.A. Khalid, (2010), Wheat Acreage,
Productivity and Production Estimation through Remote
Sensing and GIS Techniques. Australian Journal of Basicand Applied Sciences 4, 3132-3138.
Paulik, C., W. Dorigo, W. Wagner, and R. Kidd (2014),
Validation of the ASCAT Soil Water Index using in situ
data from the International Soil Moisture Network,
International journal of applied earth observation andgeoinformation 30, 1-8.
1492 International Journal of Tropical Agriculture © Serials Publications, ISSN: 0254-8755
P.D. Sreekanth and Debarup Das
Pielke, R.A., (2001), Influence of the spatial distribution ofvegetation and soils on the prediction of cumulusconvective rainfall. Reviews of Geophysics 39, 151-177.
Piles, M., A. Camps, M. Vall-Llossera, I. Corbella, R. Panciera,C. Rudiger et al. (2011), Downscaling SMOS-derived soilmoisture using MODIS visible/infrared data. IEEETransactions on Geoscience and Remote Sensing 49,3156-3166.
Reddy, G.P.O., A.K. Maji, and S. GajbhiyeKothiram, (2004),Drainage Morphometry and Its Influence on LandformCharacteristics in Basaltic Terrain–A Remote Sensing andGIS Approach. International Journal of Applied EarthObservation and Geoinformatics 6, 1-16.
Reddy, G.P.O., M.S.S. Nagaraju, I.K. Ramteke, and D. Sarkar,(2012), Terrain Characterization for Soil ResourceMapping Using IRS-P6 Data and GIS -A Case Study FromBasaltic Terrain of Central India. Journal of the IndianSociety of Remote Sensing 41, 331-343.
Renard, K.G., G.R. Foster, G.A. Weesies, D. K. McCool, andD.C. Yoder, (1997), Predicting soil erosion by water: Aguide to conservation planning with the revised universalsoil loss equation (RUSLE); USDA Handbook, 703, U.S.Department of Agriculture, Washington, DC.
Shrestha, H.L. (2006), Using GPS and GIS in participatorymapping of community forest in Nepal. Electronic Journalof Information Systems in Developing Countries 25,1-11.
Singh, D., and A. Kathpalia (2007), An efficient modeling withGA approach to retrieve soil texture, moisture androughness from ERS-2 SAR data. Progress inElectromagnetics Research 77, 121- 136.
Singh, S.K. and U.L. Singh, (2009), Water resource evaluationand management for Morar river basin, Gwalior district,M.P., using GIS. Earth Science India 2, 174-186.
spectroscopy in soil science. Advances in Agronomy 107, 163-215.
Spengler, D., T. Kuester, A. Frick, D. Scheffler, and H. Kaufmann(2013), Correcting the influence of vegetation on surfacesoil moisture indices by using hyperspectral artificial 3D-canopy models.
Srinivasan, P. (1988), Use of RS techniques for detail hydromorphological investigation in part of Narmadasagarcommand area. M.P. Journal of the Indian Society of RemoteSensing 16, 55-62.
Star, J.L., J.E. Estes, and K.C. McGwire, (1997), Integration ofGeographic Information Systems and Remote Sensing.University Press. New York: Cambridge.
Van Der Kwast, J. (2009), Quantification of top soil moisture
patterns Evaluation of field methods, process-based
modelling, remote sensing and an integrated approach,
Ph.D. Thesis., 1-317 pp, Utrecht Univeristy, Utrecht.
Velmurugan, A. and G.G. Carlos, (2009), Soil resource
assessment and mapping using remote sensing and GIS.
Journal of the Indian Society of Remote Sensing 37, 511-525.
Velmurugan, A. and G.G. Carlos, (2009), Soil resource
assessment and mapping using remote sensing and GIS.
Journal of the Indian Society of Remote Sensing 37, 511-525.
ViscarraRossel, R.A. and R. Webster (2012), Predicting soil
properties from the Australian soil visible–near infrared
spectroscopic database. European Journal of Soil Science 63,
848-860.
Wagner, W., C. Pathe, D. Sabel, A. Bartsch, C. Kunzer, and K.
Scipal (2007), Experimental 1 km soil moisture products
from ENVISTAT ASAR for Southern Africa, SHARE
project and the MISAR project. European Space Agency.
Wagner, W., S. Hahn, R. Kidd, T. Melzer, Z. Bartalis, S.
Hasenauer, J. Figa, P. de Rosnay, A. Jann, S. Schneider, J.
Komma, G. Kubu, K. Brugger, C. Aubrecht, J. Zuger, U.
Gangkofner, S. Kienberger, L. Brocca, Y. Wang, G.
Bloeschl, J. Eitzinger, K. Steinnocher, P. Zeil, F. Rubel,
(2013), The ASCAT soil moisture product: specifications,
validation results, and emerging applications.
Meteorologische Zeitschrift 22, 5-33.
Wang, G., J. Chen, Q. LI, and H. Ding, (2006), Quantitative
assessment of land degradation factors based on remotely
sensed data and cellular automata: A case study of Beijing
and its neighbouring areas. Environmental Science 3,
239-253.
Weng, Y., P. Gong, and Z. Zhu (2008), Reflectance spectroscopy
for the assessment of soil salt content in soils of the Yellow
River Delta of China. International Journal of Remote Sensing29, 5511-5531.
Xu, L., X. Xu, and X. Meng, (2013), Risk assessment of soil
erosion in different rainfall scenarios by RUSLE model
coupled with Information Diffusion Model: a case study
of Bohai Rim, China. Catena 100, 74-82.
Yeung, A.K.W. and C.P. Lo, (2002), Concepts and Techniques
of Geographic Information Systems. International Journalof Geographical Information Science 17, 819-820.