remote sensing, gis and disaster management · remote sensing, gis and disaster ... the paper deals...
TRANSCRIPT

3rd INTERNATIONAL CONFERENCE ON CARTOGRAPHY AND GIS 15-20 June, 2010, Nessebar, Bulgaria
REMOTE SENSING, GIS AND DISASTER MANAGEMENT
Antoanetta Frantzova
Head of Aerospace Monitoring Center at the Civil Protection Directorate General, Ministry of Interior, 30, St. Nikola Gabrovski, Sofia 1172, Bulgaria
[email protected], [email protected]
Abstract: Aerospace Monitoring Center (ASMC) is a first satellite data receiving center built up in Bulgaria. The Center is opened in the end of July 2007 and its main aims and tasks are focused on monitoring, risk and disaster analysis as well as damage assessment. The center is equipped with two receiving satellite ground stations for real time data receiving and processing - one of them is the for meteorological satellites NOAA (AVHRR) and Feng-Yun (MVISR) and second for Earth Observing Satellites TERRA and Aqua (MODIS). In addition, satellite images from Disaster Monitoring Constellation (DMC) with 32 meters ground resolution are delivered to ASMC by Internet after downlink and processing. The ASMC use the leading image processing software and geographic information systems (ERDAS, ENVI, LPS Core and ArcGIS). The paper deals with the application of technology (remote sensing and GIS) in disaster management in Bulgaria. 1. INTRODUCTION The paper deals with the application of remote sensing and GIS in disaster management in Bulgarian and shows the ways in which they are applied in daily work. The data and information from ASMC every day is given to the Situation Center at the Civil Protection. For that purpose a daily bulletins are prepared, which are given via the District Communication Information Centers (CIC) to the local and regional level. Also we use GIS portal for data dissemination to the local level, as well as to all intuitions involved in risk management process of natural hazards in Bulgaria.
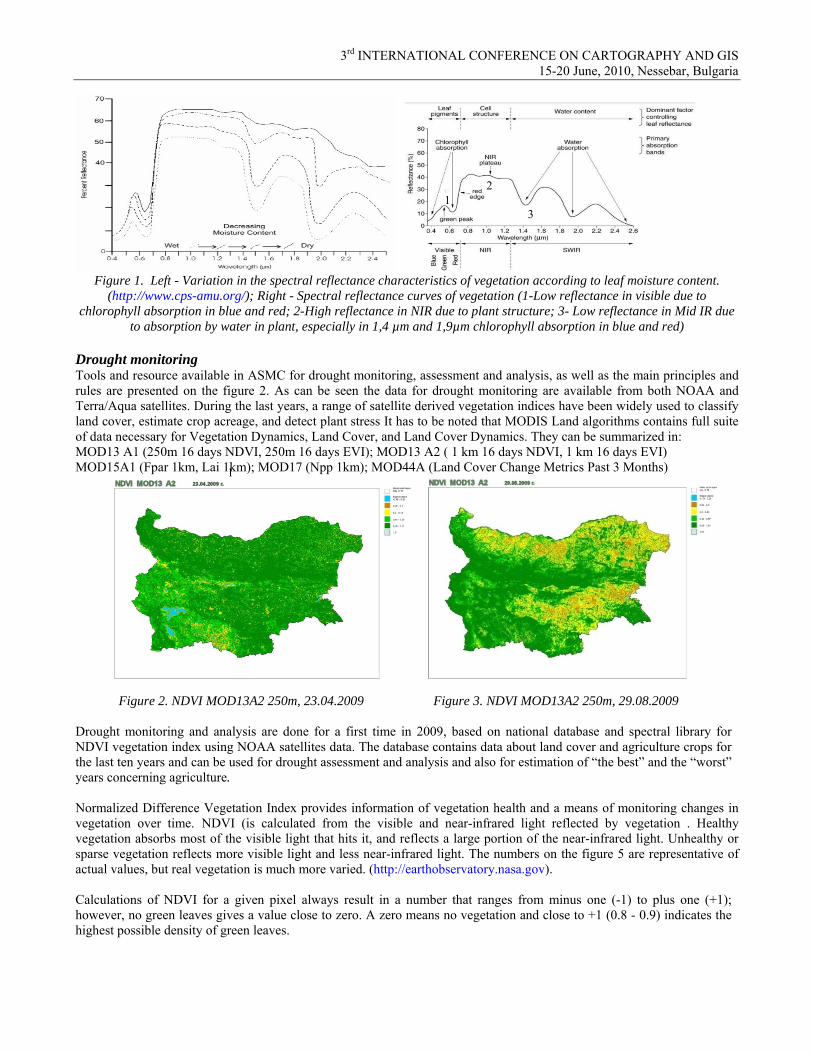
2. NATURAL HAZARDS AND REMOTE SENSING DATA – SOME EXAMPLES 2.1. Drought Theoretical Description of Vegetation Indices The theoretical basis for ‘empirical-based’ vegetation indices is derived from examination of typical spectral reflectance signatures of leaves. The reflected energy in the visible is very low as a result of high absorption by photosynthetically active pigments with maximum sensitivity in the blue (470 nm) and red (670 nm) wavelengths. Nearly all of the near-infrared radiation is scattered (reflected and transmitted) with very little absorption, in a manner dependent upon the structural properties of a canopy (LAI, leaf angle distribution, leaf morphology). As a result, the contrast between red and near-infrared responses is a sensitive measure of vegetation amount, with maximum red - NIR differences occurring over a full canopy and minimal contrast over targets with little or no vegetation. For low and medium amounts of vegetation, the contrast is a result of both red and NIR changes, while at higher amounts of vegetation, only the NIR contributes to increasing contrasts as the red band becomes saturated due to chlorophyll absorption. Spectral Characteristics of Vegetation The spectral reflectance of vegetation can be detected in three major EMS regions: 1. Visible region (400-700 nm) – Low reflectance, high absorption, and minimum transmittance. The fundamental control of energy-matter interactions with vegetation in this part of the spectrum is plant pigmentation. 2. NIR (700-1350 nm) – High reflectance and transmittance, very low absorption. The physical control is internal leaf structures. 3. MIR (1350-2500 nm) – As wavelength increases, both reflectance and transmittance generally decrease from medium to low, while absorption increases from low to high.
3rd INTERNATIONAL CONFERENCE ON CARTOGRAPHY AND GIS 15-20 June, 2010, Nessebar, Bulgaria
21
3
Figure 1. Left - Variation in the spectral reflectance characteristics of vegetation according to leaf moisture content. (http://www.cps-amu.org/); Right - Spectral reflectance curves of vegetation (1-Low reflectance in visible due to
chlorophyll absorption in blue and red; 2-High reflectance in NIR due to plant structure; 3- Low reflectance in Mid IR due to absorption by water in plant, especially in 1,4 µm and 1,9µm chlorophyll absorption in blue and red)
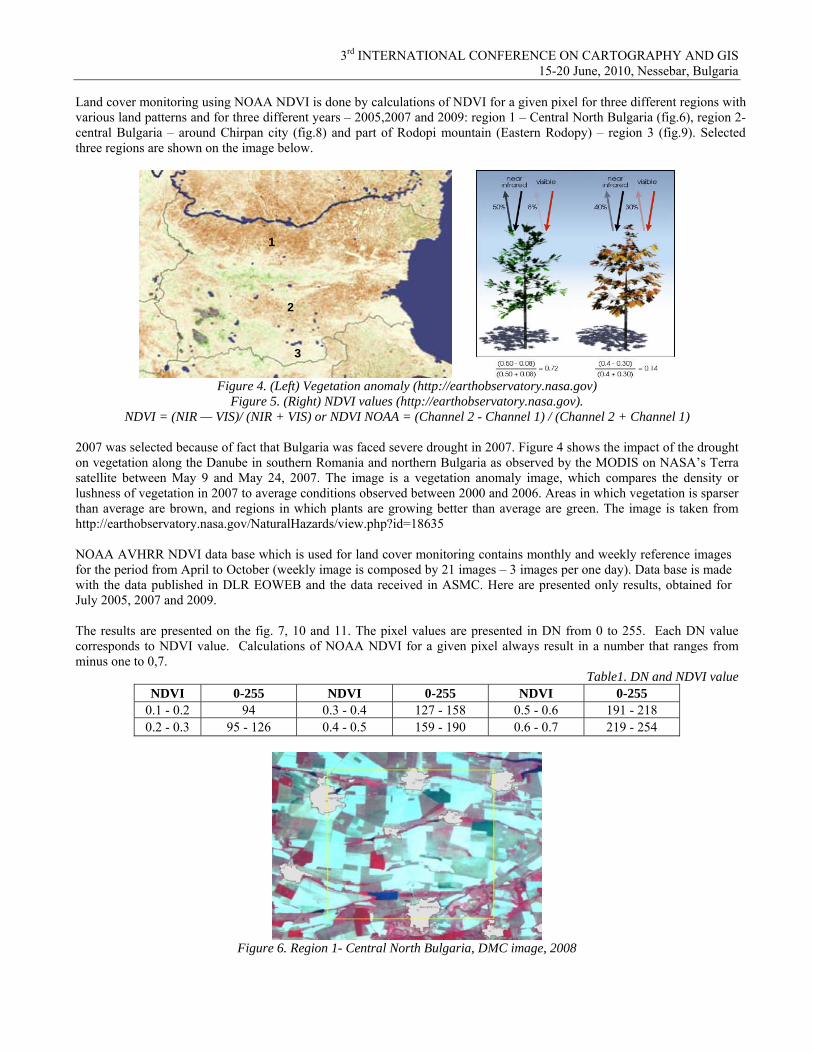
Drought monitoring Tools and resource available in ASMC for drought monitoring, assessment and analysis, as well as the main principles and rules are presented on the figure 2. As can be seen the data for drought monitoring are available from both NOAA and Terra/Aqua satellites. During the last years, a range of satellite derived vegetation indices have been widely used to classify land cover, estimate crop acreage, and detect plant stress It has to be noted that MODIS Land algorithms contains full suite of data necessary for Vegetation Dynamics, Land Cover, and Land Cover Dynamics. They can be summarized in: MOD13 A1 (250m 16 days NDVI, 250m 16 days EVI); MOD13 A2 ( 1 km 16 days NDVI, 1 km 16 days EVI) MOD15A1 (Fpar 1km, Lai 1km); MOD17 (Npp 1km); MOD44A (Land Cover Change Metrics Past 3 Months)
1
Figure 2. NDVI MOD13A2 250m, 23.04.2009 Figure 3. NDVI MOD13A2 250m, 29.08.2009
Drought monitoring and analysis are done for a first time in 2009, based on national database and spectral library for NDVI vegetation index using NOAA satellites data. The database contains data about land cover and agriculture crops for the last ten years and can be used for drought assessment and analysis and also for estimation of “the best” and the “worst” years concerning agriculture. Normalized Difference Vegetation Index provides information of vegetation health and a means of monitoring changes in vegetation over time. NDVI (is calculated from the visible and near-infrared light reflected by vegetation . Healthy vegetation absorbs most of the visible light that hits it, and reflects a large portion of the near-infrared light. Unhealthy or sparse vegetation reflects more visible light and less near-infrared light. The numbers on the figure 5 are representative of actual values, but real vegetation is much more varied. (http://earthobservatory.nasa.gov). Calculations of NDVI for a given pixel always result in a number that ranges from minus one (-1) to plus one (+1); however, no green leaves gives a value close to zero. A zero means no vegetation and close to +1 (0.8 - 0.9) indicates the highest possible density of green leaves.
3rd INTERNATIONAL CONFERENCE ON CARTOGRAPHY AND GIS 15-20 June, 2010, Nessebar, Bulgaria
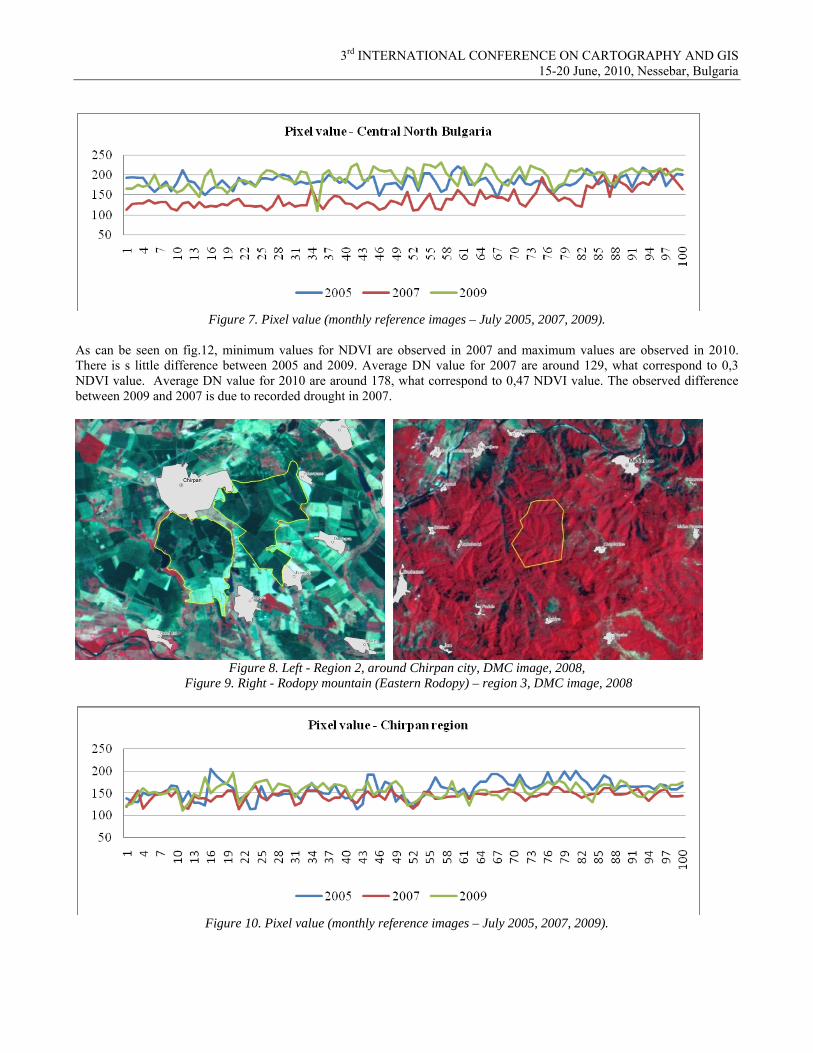
Land cover monitoring using NOAA NDVI is done by calculations of NDVI for a given pixel for three different regions with various land patterns and for three different years – 2005,2007 and 2009: region 1 – Central North Bulgaria (fig.6), region 2- central Bulgaria – around Chirpan city (fig.8) and part of Rodopi mountain (Eastern Rodopy) – region 3 (fig.9). Selected three regions are shown on the image below.
1
2
3
Figure 4. (Left) Vegetation anomaly (http://earthobservatory.nasa.gov) Figure 5. (Right) NDVI values (http://earthobservatory.nasa.gov).
NDVI = (NIR — VIS)/ (NIR + VIS) or NDVI NOAA = (Channel 2 - Channel 1) / (Channel 2 + Channel 1)
2007 was selected because of fact that Bulgaria was faced severe drought in 2007. Figure 4 shows the impact of the drought on vegetation along the Danube in southern Romania and northern Bulgaria as observed by the MODIS on NASA’s Terra satellite between May 9 and May 24, 2007. The image is a vegetation anomaly image, which compares the density or lushness of vegetation in 2007 to average conditions observed between 2000 and 2006. Areas in which vegetation is sparser than average are brown, and regions in which plants are growing better than average are green. The image is taken from http://earthobservatory.nasa.gov/NaturalHazards/view.php?id=18635 NOAA AVHRR NDVI data base which is used for land cover monitoring contains monthly and weekly reference images for the period from April to October (weekly image is composed by 21 images – 3 images per one day). Data base is made with the data published in DLR EOWEB and the data received in ASMC. Here are presented only results, obtained for July 2005, 2007 and 2009. The results are presented on the fig. 7, 10 and 11. The pixel values are presented in DN from 0 to 255. Each DN value corresponds to NDVI value. Calculations of NOAA NDVI for a given pixel always result in a number that ranges from minus one to 0,7.
Table1. DN and NDVI value NDVI 0-255 NDVI 0-255 NDVI 0-255
0.1 - 0.2 94 0.3 - 0.4 127 - 158 0.5 - 0.6 191 - 218 0.2 - 0.3 95 - 126 0.4 - 0.5 159 - 190 0.6 - 0.7 219 - 254
Figure 6. Region 1- Central North Bulgaria, DMC image, 2008
3rd INTERNATIONAL CONFERENCE ON CARTOGRAPHY AND GIS 15-20 June, 2010, Nessebar, Bulgaria
Figure 7. Pixel value (monthly reference images – July 2005, 2007, 2009).
As can be seen on fig.12, minimum values for NDVI are observed in 2007 and maximum values are observed in 2010. There is s little difference between 2005 and 2009. Average DN value for 2007 are around 129, what correspond to 0,3 NDVI value. Average DN value for 2010 are around 178, what correspond to 0,47 NDVI value. The observed difference between 2009 and 2007 is due to recorded drought in 2007.
Figure 8. Left - Region 2, around Chirpan city, DMC image, 2008,
Figure 9. Right - Rodopy mountain (Eastern Rodopy) – region 3, DMC image, 2008
Figure 10. Pixel value (monthly reference images – July 2005, 2007, 2009).

3rd INTERNATIONAL CONFERENCE ON CARTOGRAPHY AND GIS 15-20 June, 2010, Nessebar, Bulgaria
Figure 11. Pixel value (monthly reference images – July 2005, 2007, 2009).
For the region of Eastern Rodopy, there is s little difference between selected years. The average values according to 2005, 2007, 2009 are 223,248, 237 what is corresponding to NDVI value around 0,6 – 0,64. What is interesting here is the effects of drought in 2007 are unnoticeable for the deciduous forest in this region and what is more - the pixel values are the higher. As is shown on fig. 10 in this region plants are growing better than average. The higher values are probably due to prolonged heavy rain rates in the first half of June, caused massive floods in South Bulgaria. 2.2. Snow cover monitoring Snow is unusual in that it has a high reflectance in the visible region (where most of the downwelling energy is during the day) and very low reflectance in NIR The near-IR albedo is sensitive to grain size and zenith angle; the visible albedo is sensitive to snow depth and impurities observed 30% differences in between clean and dusty snow (Dozier at all, 2004; Hall at all, 1995). In additional, albedo in VIS is much higher then albedo in NIR at the same solar zenith angel. The albedo is dependent on snow cleanness and presence of different impurities and increase with increasing the depth and purity of snow. Ice is very weakly absorptive in the visible (minimum absorption at 0.46 μm) but has strong absorption bands in the near infrared. The near-IR solar irradiance thus plays an important role in snowmelt and in the energy balance at a snow surface. The near-IR albedo is very sensitive to snow grain size and moderately sensitive to solar zenith angle (Warren at all,1982). The visible albedo (for pure snow) is not sensitive to these parameters. Grain size normally increases as the snow ages, causing a reduction in albedo. In the visible wavelengths ice is highly transparent, so the albedo of snow is sensitive to small amounts of absorbing impurities. In the near-infrared wavelengths ice is more absorptive, so the albedo depends primarilyon grain size (Dozier,1989). In the 8–14 μm region snow emissivity decreases with both increasing particle size and increasing density due to packing or grain welding, while snow emissivity increases due to the presence of meltwater (Warren at all,1982). Water, ice, and snow generally have a high emissivity in 0.86 to 0.99 μm, across the thermal infrared region. Snow emissivity is in the range 0.9 - 1.00 μm for all grain sizes and viewing angles. However, there is a conflict between the published theories of the emissivity of snow. Moreover, accompanying measurements show a decrease in emissivity in the presence of liquid water (Dozier at all, 1984). Distinguish between snow and cloud cover In visible satellite images, clouds can usually be discriminated from snow by texture, but there is a many cases when discrimination between snow and clouds may be difficult and inaccurately. In the thermal wavelengths clouds may be either warmer or colder than the snow surface, but in most cases the snow and clouds have the same spectral characteristic. As is stated above, the snow has very low albedo, (around 0-6 %) in NIR region (NOAA channel 3), as the albedo decrease with increasing of snow depth. The differences in albedo values between snow and clouds can be reached over 40 – 50 % (fig.12) In this region of electromagnetic spectrum, snow and clouds have different spectral signatures and consequently this wavelengths can be used for of snow and cloud cover distinguish. The relevant information for the snow and clouds discrimination may be obtained in the short-wave infrared parts of the spectrum (i.e., MODIS bands 6 (1.6 μm) and MODIS band 7 (2.1 μm ) that are excellent as snow/cloud discriminator bands.

3rd INTERNATIONAL CONFERENCE ON CARTOGRAPHY AND GIS 15-20 June, 2010, Nessebar, Bulgaria
Figure 12. NOAA image (left) and NOAA image channel 3 albedo product, 30.01.2008, 10:50 h. Normalized Difference Snow Index (NDSI) The NDSI is a measure of the relative magnitude of the characteristic reflectance difference between the visible and short-wave IR reflectance of snow. The usefulness of the NDSI is based on the fact that snow and ice are considerably more reflective in the visible than in the shortwave IR part of the spectrum, and the reflectance of most clouds remains high in the short-wave IR, while the reflectance of snow is low (Riggs at all, 2006). A suite of normalized band differences for mapping snow (with Landsat TM band) are presented in Dozier, 1989. The current scheme in NASA’s Earth Observing System (EOS) applies this method to the MODIS (Moderate-Resolution Imaging Spectrometer) instrument for its standard snow map product. The NDSI helps distinguish snow from similarly bright soil, rock and cloud and has been shown to be an effective index for mapping snow cover in rugged terrain (Dozier, 1989; Hall at all, 1995; Hall at all, 2000). A normalized difference snow index (NDSI) is calculated from reflectance in bands at wavelengths where snow is bright (AVHRR band 1) and where it is dark (AVHRR band 3):
NDSI = AVHRR band 1 – AVHRR band 3 / AVHRR band 1 + AVHRR band 3 (1) NDSI = AVHRR band 2 – AVHRR band 3 / AVHRR band 2 + AVHRR band 3 (2) NDSI = AVHRR band 2 + AVHRR band 3 / AVHRR band 2 - AVHRR band 3 (3) NDSI = AVHRR band 1 + AVHRR band 3 / AVHRR band 1 - AVHRR band 3 (4)
Figure 13. NOAA HRPT, 30.01.2008, 10:50:25 (GMT + 2:00), NDSI product. A pixel is mapped as snowcovered when
NSDI>0, formula 2( left) and when NSDI>0.9, formula 4( right).
Satellite and ground data integration for snow cover and floods monitoring Because the floods are ones of the most disastrous events for the territory of Bulgaria, snow cover monitoring is of great importance in the beginning of the springtime. The data used for snow cover monitoring in Aerospace monitoring center are presented on the fig.14. They can be summarized in: satellite data, ground data and Sat Rain products. (SatRain is software for rain rates probability estimation on the basis of the data from NOAA meteorological satellites. The software is made for ASMC specific needs and requirements). Ground data usually are presented in GIS maps (fir. 15 and fig.16). Such kinds of maps were the one of the most important tools for analyses done in the middle of February when southeastern Bulgaria was subjected by floods caused by torrential rains. It is very easily to see that snow has less contribution to floods happened in February than precipitations - as can be seen on fig. 9 the amount of monthly precipitation is several times bigger than average climate values.

3rd INTERNATIONAL CONFERENCE ON CARTOGRAPHY AND GIS 15-20 June, 2010, Nessebar, Bulgaria
NOAA AVHRR
NOAA AVHRR Sat Rain product
Figure 14. Data used for snow cover monitoring in Aerospace monitoring center.
Figure 15. Snow cover depth. Yellow – 09.02; Blue – 10.02.2010. With black rectangle are presented areas affected by
bloods in the middle of February.
Figure 16. Monthly precipitation for February 2010 (blue) and average climate values (yellow).
Satellite images Albedo
Temperature NDSI
Image enhancement Density slicing
Ground data Snow depth Rain rates Forecast
Hydrological data
GIS maps
TERRA/Aqua MODIS Image processing ERDAS, ENVI Images – MOD02QKM,
MOD02HKM MOD10_L2 Snow Product
MOD10A1 Daily Snow Cover MOD10A2 Eight-day Snow Cover

3rd INTERNATIONAL CONFERENCE ON CARTOGRAPHY AND GIS 15-20 June, 2010, Nessebar, Bulgaria
2.3. Wildfires Physics of the problem The essence of fire detection lies in significantly enhanced radiance emitted in the mid-infrared region (ch.3 - AVHRR) for typical fire temperatures, as governed by the Planck function. Temperature measured on the site of biomass fires is usually in range around 500 – 1100 K . According to Wien’s displacement law the wavelength of the maximal radiation coming from the body with average temperature about 700-800 body will be around 3,6 – 4,1 μm. The mid-infrared channel is thus most useful for fire detection. It is highly sensitive to the presence of fires, which also poses a problem for fire detection. A very small fire within the 1-km pixel can easily saturate the channel. For example, a fire with a temperature of 1000 K located within a non-reflective background of 300 K, needs only be 13x13 m to saturate the 3.75 μm channel (Li, et al., 2000). For moderate resolution satellite data, fires usually have varying temperature within the pixel, rendering unusually large differences in brightness temperature. In a given fire pixel we may have areas that are not burned, areas that are smoldering and areas that are in flames. Dealing with wild fires monitoring it is important to be able to distinguish between flaming and smoldering fire stages. The distinct flaming and smoldering fire stages are characterized by different fire intensity, temperature, and emission ratios. The fire intensity and structure affect the fire temperature and the spatial extent of the hot zone. Smoldering and flaming can be distinguished using infrared remotely-sensed measurements only if the fire temperatures vary significantly between these two stages. Based on information given in Algorithm Technical Background Document, MODIS fire products flaming temperature can be anywhere between 800 K and 1200 K, and as hot as 1800 K. Smoldering should be under 850 K and above 450 K. The actual range is probably smaller (Christopher J., et al.,2006). The 1.65 μm channel is very sensitive to flame and the flaming energy and not very sensitive to smolder and its energy. The 2.13 μm channel is very sensitive to flame and somewhat sensitive to smolder. Since the thermal energy is more concentrated in the flaming fire, the sensitivity to thermal energy is independent of smoldering or flaming. Unfortunately the MODIS 2.13 μm channel saturates at a reflectance of 0.8, which for the low solar brightness corresponds to less than 1% of the 500 m pixel being in flames. The importance of this channel is therefore limited. The 4 μm channel is sensitive to both flame and smolder, and is five times more sensitive to the thermal energy emitted from flaming than from smoldering. (Christopher J., et al., 2006) Detecting, monitoring and localization of thermal anomaly As is stated above, for a first time in Bulgaria a satellite- based Automatic Fire Detection and Analysis Tool is installed in ASMC. The Software downloads real time data directly from the satellites and uses the powerful software to process the data into maps that show the location and estimated size and intensity of wildfires. In additional the maps contain information about wind speed and direction and atmospheric pressure. The system disseminates the data by e-mail. The different satellites have different application in disaster studies as well as in risk assessment and risk management process of wildfires. For instance, the data from AVHRR (NOAA) and Multichannel Visible and Infrared Scan Radiometer (MVISR, Fen-Yung satellite) have great application and usefulness for wildfires detection and monitoring, while the data from small satellites (Disaster Monitoring Constellation) are in great help in damage assessment. Brief description of the tools used for detecting, monitoring and localization of thermal anomaly are described below.
1. Detecting of thermal anomaly with NOAA AVHRR HRPT Heat source – band 3, Land surface temperature – band 4 и 5, Smoke – band 1, 2
2. Detecting of thermal anomaly with FY 1 MVISR HRPT Heat source – band 3, Land surface temperature – band 4 и 5, Smoke – band 6,7,8,9
3. Detecting of thermal anomaly with MODIS Terra EOS/AM-1, Aqua EOS/PM-1 MOD02HKM, MOD021KM, MOD14_L2
Heat source – band 7, 20, 21, 22; Land surface temperature – band 31, 32 Smoke – band 1,2,3,4, 8-15 4. A satellite - Based Automatic Fire Detection and Analysis Tool – Vulcan.
Localization of thermal anomaly GIS, DMC and Corine Land Cover are used are used for localization of detected hot spots and display the place of the detected hot spots (thermal anomaly). Image processing of MODIS HDF is performed with ENVI and ERDAS software.

3rd INTERNATIONAL CONFERENCE ON CARTOGRAPHY AND GIS 15-20 June, 2010, Nessebar, Bulgaria
Figure 17. Thermal anomaly localization. Right: Upper left – thermal anomaly (image from NOAA satellite. Thermal
anomaly is presented in white); Upper right – DMC image; Below left – Corine Land cover
Damage assessment Burned area can be accessed from reflectance differences between the visible and NIR channels. The DMC images with 32 m. ground resolution are very useful and applicable for damage assessment. Moreover, damage assessment can be done with MODIS images. An analysis of the ability of the MODIS land surface reflectance bands to discriminate between recently burned and unburned vegetation (Roy et al., 2002) has shown that MODIS bands 5 and 2 provide the highest burned-unburned discrimination and MODIS band 7 provides little discrimination. Bands 5, 2 and 6 reflectance decreases immediately, and for many days, after burning, and band 7 reflectance changes relatively less (Christopher J., 2006).
Figure 18. Before, during and after disaster. Damage assessment (Dubavo, Stara Zagora Municipality; DMC image)

3rd INTERNATIONAL CONFERENCE ON CARTOGRAPHY AND GIS 15-20 June, 2010, Nessebar, Bulgaria
3. CONCLUSION The report demonstrates the applicability of remote sensing data in disaster management in Bulgaria and shows the way in which they are put in practice. There is a good correlation between results obtained and actual environmental condition. Since the consequences of the natural hazards depend not simply on theirs magnitude, but also on what happened before, satellite data along with ground data affording an opportunity for better decisions, reducing the risk and protect the population. References Algorithm Technical Background Document, MODIS FIRE PRODUCTS, (Version 2.3, 1 October 2006), (EOS ID# 2741) (MODIS Science Team), October 6, 2006 Christopher J., Louis Giglio, Luigi Boschetti, David Roy, Ivan Csiszar, Jeffrey Morisette, and Yoram Kaufman., 2006: MODIS ATBD. Cracknell, A.P., L.W.B. Hayes, Introduction to remote Sensing, Taylor and Francis, 1993. Dozier, J.,1981: A method for satellite identification of surface temperature fields of subpixel resolution, Remote Sensing of Environment, 11:221-229. Dozier, J. Spectral Signature of Alpine Snow Cover from the Landsat Thematic Mapper, Rem. Sens. of Env.(1989), 28:9-22. [8] J. Dozier, T. H. Painter, Multispectral and hyperspectral remote sensing of alpine snow properties, Annu. Rev. Earth Planet. Sci. (2004), 32:465–94. Hall, D.K., G.A. Riggs, V.V. Salomonson, 1995, Development of methods for mapping global snow cover using moderate resolution imaging spectroradiometer data. Remote Sens. Environ.(1995), 54:127–40. Hall, D.K., G.A.Riggs, V.V Salomaonson, DiGirolamo, N., Bayr., MODIS snow-cover product. Remote sensing of environmental, (2000) 83:181-194. Hall, D.K., Riggs, Vincent V. Salomonson Algorithm Theoretical Basis Document (ATBD) for the MODIS Snow and Sea Ice-Mapping Algorithms, 2001. Kaufman, Y.J., Justice, C.O., Flynn, L.P., Kendall, J.D., Prins, E.M., Giglio, L., Ward, D.E., Menzel, W.P., and Setzer, A.W., 1998: Potential global fire monitoring from EOS-MODIS.Journal of Geophysical Research, 103:32,215-32,238. Li, Z., Y. J. Kaufman, C. Ichoku, R. Fraser1, A. Trishchenko, L. Giglio, J. Jin, X. Yu., 2000: A Review of AVHRR-based Active Fire Detection Algorithms: Principles, Limitations, and Recommendations, Canada Centre for Remote Sensing, NASA Goddard Space Flight Center, September, 2000, http://www.fao.org/ Matson, M., Dozier J., 1981: Identification of subresolution high temperature sources using a thermal IR sensor, Photo. Engr. and Remote Sensing, 47(9):1311-1318. Riggs, G.A., D.K. Hall, V.V. Salomonson, MODIS Snow Products User Guide for Collection 4 Data Products, 2006 http://modis-snow-ice.gsfc.nasa.gov/sugkc2.html Roy, D., Borak, J, Devadiga, S., Wolfe, R., Zheng, M., Descloitres, J., 2002: The MODIS land product quality assessment approach, Remote Sensing of Environment, 83:62-76. Salisbury, W., M. D'Aria, A.Wald, Measurements of thermal infrared spectral reflectance of frost, snow, and ice, Journal of geophysical research, vol. 99, no. B12, 24,235–24, 240, (1994). Warren, S. G., Optical Properties of Snow, 1982, http://stinet.dtic.mil/, The Defense Technical Information Center (DTIC)'s Scientific and Technical Information Network (STINET). eng.Antoanetta Frantzova, Ph.D Head of Aerospace Monitoring Center at the DG Civil protection, Ministry of Interior, Bulgaria 6, St. Nedelya Sq. Sofia 1000, Bulgaria [email protected]; [email protected] Tel.+359 2 960 10 371, fax.+ 359 2 960 10 223; + 00359 884 009 363; +359 888 44 66 68
Personal data: Born on 15.02.1972 in Sofia, Bulgaria. Education skills: M.Sc - Mechanical engineer M.Sc in ecology - Aerospace methods and technology in environmental Specialization in Crisis management Scientific degree: Ph.D Last job before ASMC - Institute of Space Research at the Bulgarian Academy of Sciences Professional experience: In the fields of remote sensing, risk assessment and management of natural hazards, satellite system and technology, Geographical Information System (GIS)