applications of population genetics to conservation of chinook
TRANSCRIPT

Contributions to the Biology of Central Valley Salmonids 45
Applications of Population Genetics to Conservationof Chinook Salmon Diversity in the Central Valley
D. Hedgecock, M.A. Banks, V.K. Rashbrook, C.A. Dean,and S.M. Blankenship
Uses of Modern Population Genetics in Conservation
Population genetics is playing an increasingly important role in the conserva-tion of salmonid resources in the Pacific Northwest. The National MarineFisheries Service considers a salmon population worthy of conservation underthe U.S. Endangered Species Act if it represents an Evolutionary SignificantUnit (ESU), “…a population (or group of populations) that (1) is substantiallyreproductively isolated from other conspecific population units, and (2) repre-sents an important component in the evolutionary legacy of the species”(Waples 1991, 1995). Genetic data provide an important, though indirectmeans for establishing the degree of reproductive isolation between conspe-cific populations. Indeed, numerous studies of electrophoretically detectableprotein polymorphisms carried out over the past 30 years on Pacific salmonspecies have shown that a high degree of spatial substructure and reproduc-tive isolation results from their homing behavior (Utter 1991). With the adventof DNA markers, particularly mitochondrial and microsatellite DNA markers,resolution of reproductively isolated or partially isolated populations hasbecome more precise. Here, we describe progress resolving chinook salmondiversity and stock structure in the Central Valley of California.
Modern tools of population genetics, for example, using polymorphic proteinmarkers, also allow us to address problems that could not formerly beapproached. Whereas protein markers had long supported the statistical allo-cation of catch in mixed ocean fisheries to contributing spawning populations(Utter and Ryman 1993), highly polymorphic microsatellite DNA markersnow enable us to ascertain the origins of individual fish. We describe howindividual assignment of salmon, first achieved for Central Valley chinooksalmon, has become an integral part of a hatchery supplementation programfor the endangered Sacramento River winter chinook salmon. Individualassignment is also being used to the identify winter-run juvenile migrationpatterns through the Sacramento-San Joaquin Delta and in assigning oceancatches to various Central Valley stocks, some of which are threatened orendangered.

46 Fish Bulletin 179: Volume One
The use of highly polymorphic DNA markers has also enabled tremendousimprovements in identifying parentage and kinship. Indeed, determining theparentage of hatchery-reared winter chinook in the supplementation programwas our original motivation for developing microsatellite DNA markers.Since then, microsatellite markers have provided, aside from a description ofgenetic diversity within and among Central Valley stocks, an important vali-dation of the demographic model used to assess the genetic effect of the hatch-ery supplementation program for winter run. Microsatellite markers alsoallow the assessment of kinship in juvenile samples, which often are the onlymaterial that can be collected from small, threatened, or endangered popula-tions. In the past, population geneticists advised against using juvenile sam-ples because of the potentially confounding effects of family structure on theestimation of adult allele frequencies (Allendorf and Phelps 1981). Now, how-ever, highly polymorphic markers enable the kinship of juveniles to bedetected and the effects of family structure to be removed. Such data not onlyallow the genotypes and allele frequencies of the unobserved adult popula-tion to be reconstructed but also shed light on the reproductive behavioralecology of salmon populations.
Genetic Diversity of Chinook Salmon in the Central Valley
Phenotypic DiversityMajor spawning subpopulations among California’s Central Valley chinooksalmon have very similar anatomical and morphological features but markeddifferences in timing of spawning, juvenile emergence, early rearing andmigration from the freshwater habitat to the ocean. Four runs have beennamed—winter, spring, fall, and late-fall—based on the season when mostindividuals from a subpopulation return to freshwater for spawning (Stone1874; Fry 1961). Spawning not only occurs at a distinct time for each run, withonly partial overlap between temporally adjacent runs, but, historically atleast, often in a distinct habitat (for example, major rivers compared withhigher elevation streams; see Fisher 1994). This natural, spatial and temporalisolation of the various spawning habitats has been greatly perturbed byhuman activity. For example, 150 years ago, spring and fall runs overlappedin spawning time but were geographically isolated; spring run spawned in theupper headwaters and fall run, in rivers and major streams of the lower valleyfloor. Forced co-existence of these two runs caused by substantial dammingand loss of habitat in recent years, however, has lead to concern for theirgenetic integrity (Cope and Slater 1957; Banks and others 2000).

Contributions to the Biology of Central Valley Salmonids 47
Several studies have focused on genetic characterization of California's Cen-tral Valley chinook salmon using of a variety of genetic marker types. Resultswill be presented for each type, separately, followed by a synthesis acrossmarker types. Wright’s (1931) standardized variance of allele frequenciesamong subpopulations, FST, is used to measure genetic diversity among runsand to compare results from different marker classes.
AllozymesA study of 39 allozyme loci (Bartley and others 1992) revealed little diver-gence between fall and winter-run chinook salmon, with Wright’s standard-ized allele-frequency variance, FST = 0.01. However, the authenticity ofwinter-run samples used in this study has been questioned (D. Teel and G.Winans, personal communication, see “Notes”). A more recent study (Winansand others forthcoming), based on more extensive sampling, indicates signifi-cant genetic structure among Central Valley chinook runs, in accord withresults based on other marker types (Figure 1A).
Mitochondrial DNANielsen and others (1994) reported substantial divergence in frequencies of sixmtDNA haplotypes (FST = 0.24) among recognized Central Valley chinookstocks (Figure 1B). However, the probability that any two Central Valley chi-nook haplotypes are identical is 0.7, precluding use of this marker alone forindividual identification. Further, maternal inheritance of mtDNA limits useof this marker type for genetic inference related to family structure.
MicrosatellitesThe listing of winter run under the federal and California endangered speciesacts increased the need to discriminate among subpopulations of Central Val-ley chinook. Banks and others (1999) cloned and developed ten new microsat-ellites for this task, verifying that their inheritance was Mendelian. Asubsequent study used these and other microsatellites from the literature tocharacterize 41 population samples taken throughout the valley between 1991and 1997 (Banks and others 2000; Figure 2). Samples encompassed geographicand temporal variation within subpopulations. Maximum likelihood methodswere used to correct for family structure among samples comprised of juve-niles (see “Parentage and Kinship”), as well as to correct for run admixture inadult samples (see “Avoiding Hybridization in the Winter Run Supplementa-tion Program”). This extensive sampling and sample adjustments establisheda database of accurate and precise estimates of microsatellite allele frequenciesfor Central Valley chinook.

48 Fish Bulletin 179: Volume One
Figure 1 Genetic distances among subpopulations of Central Valley chinook salmon calculated from data on four genetic markers, (A) allozymes or proteins (after Winans and Teal, unpublished); (B) control region sequences of mitochondrial DNA (after Nielsen and others 1994); (C) microsatellite DNA markers (after Banks and others 2000); (D) a class II member of the Major Histocompatibility Complex (after Kim and others 1999). Numbers next to nodes in (A) and (C) are the percentages of 1,000 bootstrapped trees showing that same node.
Winter
Spring
Fall
Late-Fall0.1
Winter
Spring (Butte Creek)
Spring (Mill & Deer Creeks)
Fall
Late-fall99
71
100
C
Winter
Spring
Fall
Late-Fall
100
99 BA
D

Contributions to the Biology of Central Valley Salmonids 49
The most important finding of this study is that chinook salmon of the CentralValley in California have substantial genetic diversity and structure(Figure 1C). Except for discovery of two distinct lineages of spring run, thisstudy revealed a genetic structure congruent with the recognized winter,spring, fall and late-fall spawning runs (Fisher 1994). It is, perhaps, surprisingbut encouraging that such biological diversity has survived more than 100years of massive habitat destruction, exploitation, and artificial propagation(Yoshiyama and others 1998, this volume). Moreover, the data retrospectivelysupport the designation of winter run and spring run as Evolutionary Signifi-cant Units protected under the U.S. Endangered Species Act (Waples 1995;NMFS 1994, 1999). Winter run, whose blend of ocean- and stream-type life-history characteristics is unique in the species (Healey 1991), is the most dis-tinctive of the subpopulations in the Central Valley. The next most distinctivesubpopulations are the spring runs, particularly those in Butte Creek, whichhave unique life-history adaptations (Yoshiyama and others 1996). Formerlythe most abundant chinook salmon throughout the Central Valley, spring chi-nook are presently found in only a few tributaries of the Sacramento River,primarily those considered in this study (Fisher 1994; Yoshiyama and others1996, 1998). Finally, fall and late-fall runs, though closely related, are signifi-cantly different at 10 microsatellite markers (Figure 1C) and differ in geo-graphic range, run timing, and size at maturity (Fisher 1994).
Winter run, and to a lesser extent spring run from Butte Creek, show lowerlevels of allelic diversity than other runs, suggesting that these populationsexperienced past reductions in size (bottlenecks). This may also explain a partof their divergence from the other runs in the Central Valley (Hedrick 1999).Despite spatial and temporal overlap of chinook salmon spawning runs in theCentral Valley, no evidence for natural hybridization among runs was foundby Banks and others (2000). A commonly held view is that most spring-runpopulations have hybridized with fall run and that Butte Creek spring run, inparticular, has hybridized with the Feather River fall hatchery stock(Yoshiyama and others 1998). However, two observations contradict thishypothesis. First, genotypic proportions in the Butte Creek spring run mostlyconform to random mating expectations. Second, Butte Creek spring clustersfarther from the fall run than does spring run from Deer and Mill creeks (Fig-ure 1C), not closer as expected under the hybridization hypothesis. Run-admixture can nevertheless occur and appears a likely cause for significantlinkage disequilibrium in hatchery populations (see “Avoiding Hybridizationin the Winter Run Supplementation Program”) and, to a lesser extent, in sam-ples from certain populations spawning in the wild.

50 Fish Bulletin 179: Volume One
Figure 2 Map of the Central Valley, showing the localities from which chinook salmon were sampled for genetic analysis (from Banks and others 2000). The open arrow indicates the general location of the SWP and CVP water pumping plants in the Sacramento-San Joaquin Delta.

Contributions to the Biology of Central Valley Salmonids 51
Nielsen and others (2000) also characterized Central Valley chinook using 10microsatellites, five of which were in common with those used by Banks andothers (2000). Overall relationships between major subpopulations revealedby this study were the same as described by Banks and others (2000), the twostudies both verifying the distinctiveness of winter and spring runs. In con-trast to Banks and others (2000), however, Nielsen and others (2000) foundthat year-to-year variation within runs was substantial (nearly 11% of the totalvariance) though not significant. Moreover, they found significant heteroge-neity within fall-run hatchery samples as well as within spring run samplesfrom Mill, Deer, and Butte creeks. However, Nielsen and others (2000) usedsamples of juveniles and did not correct for the potential effects of kinshipwithin such samples.
A Class II Gene of the Major Histocompatibility ComplexCharacterization of class II MHC variation for Central Valley chinook salmonalso found significant frequency differences among runs (FST = 0.129) exceptbetween fall and late-fall (Kim and others 1999). Thus, in consensus with othermarker types, MHC variation demonstrates the distinctiveness of the endan-gered winter run (Figure 1D), with no evidence for significant variationamong winter run samples from different years.
Concordance Across Marker TypesThe pictures of divergence among chinook salmon runs in the Central Valleypainted by the above marker types are concordant. Winter run is the most dis-tinctive subpopulation, followed by spring run, then fall and late fall. There issubstantially less variation among the geographic samples within a subpopu-lation than among subpopulations, even for the fall run, which is presentlythe most widely distributed. Finally, most studies have not detected signifi-cant temporal variation within a spawning population.
Mitochondrial DNA and MHC appear, at first glance, to show greater diver-gence among runs than do microsatellite markers (compare Figures 1B and 1Dwith 1C). The average 0.078 FST estimate for 10 microsatellite loci from Banksand others (2000) is less than the FST of 0.24 from the mtDNA data of Nielsenand others (1994) or the 0.129 estimate from the MHC class II b1 exon (Kimand others 1999). However, some microsatellite markers do show comparablelevels of divergence (for example, Ots-2 with FST of 0.169). Another differenceamong microsatellites, MHC, and mitochondrial DNA, which may accountfor different levels of among-subpopulation divergence, is in numbers of alle-les. The last two marker types have substantially fewer alleles than is typicalof microsatellites. Several researchers (Hedrick 1999 and references therein)have shown that, for highly variable loci such as microsatellites, FST is con-strained by high within-population diversity. This problem can be overcome

52 Fish Bulletin 179: Volume One
to some extent by using different distance metrics, including the percentage ofindividuals correctly assigned to their sample of origin, as discussed in thenext section.
Mixed Stock Analysis and Individual Assignment
Mixed Stock Analysis vs. Individual AssignmentDistinguishing among the five morphologically similar subpopulations (fall,winter, late fall, Butte Creek, and Mill and Deer Creek springs) of chinooksalmon in the Central Valley is important in fisheries management and con-servation, particularly because some stocks are protected and others are not.Population genetics has been applied to this problem, in several different con-texts, involving adult and juvenile phases of the life cycle. Run identificationis made possible by the baseline survey of microsatellite DNA variation inpopulation samples from the Central Valley (Banks and others 2000). Twopopulation genetic methods are used to distinguish among the differentspawning runs: mixed stock analysis (MSA) and individual assignment topopulation of origin. MSA is a population-based method that has been widelyused to estimate the relative contributions of salmon stocks to random sam-ples of adults taken in mixed ocean harvests (Milner and others 1985; Utterand Ryman 1993). In the Central Valley, MSA can be applied to mixtures ofchinook salmon juveniles from different spawning populations, which co-mingle in the Sacramento-San Joaquin Delta during emigration from thefreshwater habitat. Individual assignment, on the other hand, estimates themost likely population of origin for an individual, based on the odds that itsgenotype belongs to one rather than to another subpopulation (Paetkau andothers 1994; Banks and Eichert 2000). Individual assignment is useful whenadults are collected for hatchery propagation or when the presence of pro-tected runs must be ascertained in small samples from fish salvage operationsat Delta pumping facilities. Actually, as we shall illustrate, a combination ofthe two methods is needed to analyze mixtures in the Delta and the oceanfishery.
The Central Valley chinook baseline can be used in computer simulations toillustrate the two methods and to demonstrate their relative merits and effec-tiveness. The baseline data are randomly permuted to produce 200 individu-als from each of the five populations: winter, spring from Mill and Deercreeks, spring from Butte Creek, fall and late fall. Each individual has beengenotyped for seven of the 10 markers studied by Banks and others (2000).This creates a mixed stock of 1,000 individuals of known population descent,with which to evaluate the characteristics and performance of each method.MSA uses the Statistical Package for Analysis of Mixture (SPAM, version 3.2,available at http://www.cf.adfg.state.ak.us/geninfo/research/genetics/soft-
Contributions to the Biology of Central Valley Salmonids 53
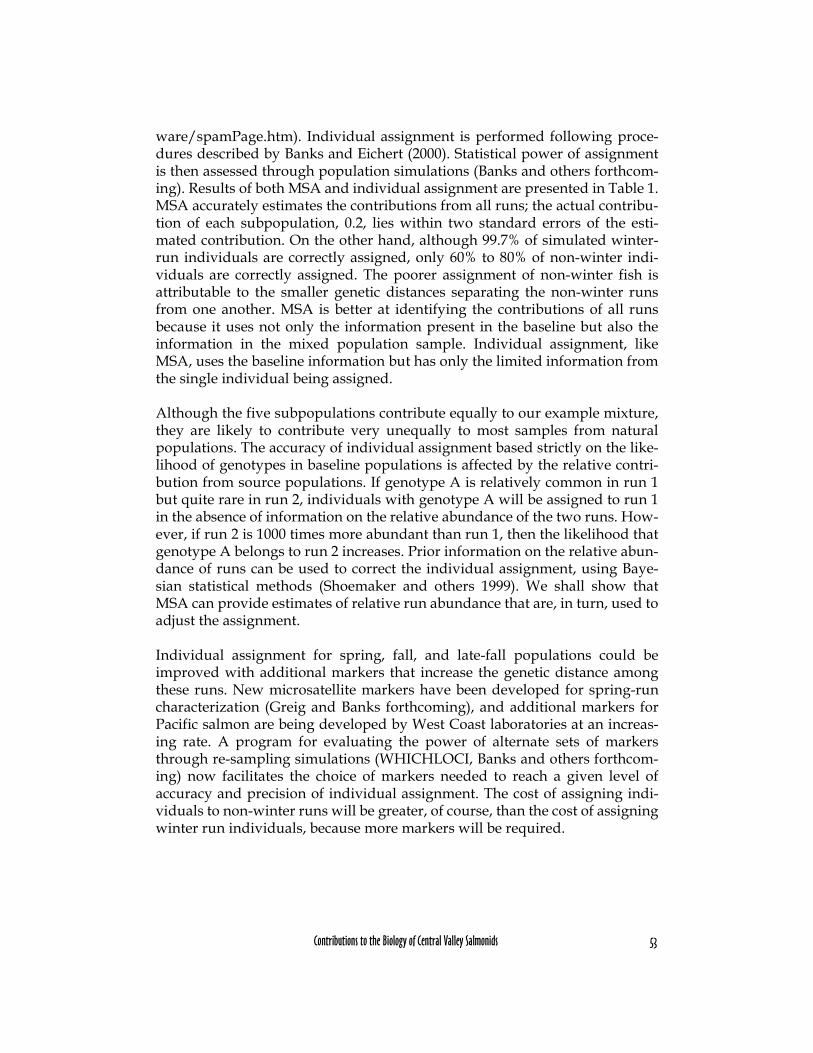
ware/spamPage.htm). Individual assignment is performed following proce-dures described by Banks and Eichert (2000). Statistical power of assignmentis then assessed through population simulations (Banks and others forthcom-ing). Results of both MSA and individual assignment are presented in Table 1.MSA accurately estimates the contributions from all runs; the actual contribu-tion of each subpopulation, 0.2, lies within two standard errors of the esti-mated contribution. On the other hand, although 99.7% of simulated winter-run individuals are correctly assigned, only 60% to 80% of non-winter indi-viduals are correctly assigned. The poorer assignment of non-winter fish isattributable to the smaller genetic distances separating the non-winter runsfrom one another. MSA is better at identifying the contributions of all runsbecause it uses not only the information present in the baseline but also theinformation in the mixed population sample. Individual assignment, likeMSA, uses the baseline information but has only the limited information fromthe single individual being assigned.
Although the five subpopulations contribute equally to our example mixture,they are likely to contribute very unequally to most samples from naturalpopulations. The accuracy of individual assignment based strictly on the like-lihood of genotypes in baseline populations is affected by the relative contri-bution from source populations. If genotype A is relatively common in run 1but quite rare in run 2, individuals with genotype A will be assigned to run 1in the absence of information on the relative abundance of the two runs. How-ever, if run 2 is 1000 times more abundant than run 1, then the likelihood thatgenotype A belongs to run 2 increases. Prior information on the relative abun-dance of runs can be used to correct the individual assignment, using Baye-sian statistical methods (Shoemaker and others 1999). We shall show thatMSA can provide estimates of relative run abundance that are, in turn, used toadjust the assignment.
Individual assignment for spring, fall, and late-fall populations could beimproved with additional markers that increase the genetic distance amongthese runs. New microsatellite markers have been developed for spring-runcharacterization (Greig and Banks forthcoming), and additional markers forPacific salmon are being developed by West Coast laboratories at an increas-ing rate. A program for evaluating the power of alternate sets of markersthrough re-sampling simulations (WHICHLOCI, Banks and others forthcom-ing) now facilitates the choice of markers needed to reach a given level ofaccuracy and precision of individual assignment. The cost of assigning indi-viduals to non-winter runs will be greater, of course, than the cost of assigningwinter run individuals, because more markers will be required.

54 Fish Bulletin 179: Volume One
Avoiding Hybridization in the Winter-run Supplementation ProgramIn 1991, the U.S. Fish and Wildlife Service initiated a hatchery supplementa-tion program aimed at helping to prevent the Sacramento River winter chi-nook salmon from going extinct. Research on the genetic effect of the programis described in the next section. Here, we consider a problem that becameapparent in 1995, namely, how to distinguish winter run from non-winter runin selecting broodstock for the hatchery supplementation program.
In 1995, 38 of 85 fish collected by the USFWS for the winter-run supplementa-tion program failed to mature in the hatchery. These non-maturing fishappeared to have phenotypic and genotypic affinities with spring chinook. Are-investigation of 140 winter-run brood stock that had been used for winter-run supplementation from 1991 to 1995 revealed strong, non-random associa-tions (called gametic-phase or linkage disequilibria or LD) of allelic combina-tions at pairs of microsatellite loci. Typically, adults from naturally spawningpopulations show random associations of allelic combinations at pairs of loci,because mating of Pacific salmon occurs randomly with respect to genetic
Table 1 Results for assigning components of a mixed stock to population origin using mixed stock analysis and individual assignmenta
Mixed Stock Analysis
Population Expected Estimate Standard Error
Winter 0.2000 0.2009 0.0126
SP-MD 0.2000 0.2185 0.0122
SP-B 0.2000 0.1899 0.0122
Fall 0.2000 0.1874 0.0093
Late fall 0.2000 0.2033 0.0122
Individual Assignment
Population % Correct Standard Deviation
Winter 99.7226 0.508
SP-MD 77.5115 4.0626
SP-B 90.4935 2.9192
Fall 69.7285 4.5995
Late fall 80.0215 4.0677
a A mixed stock was composed of 200 individuals from each of five populations created through permuta-tion of baseline populations. The mean, standard deviation, and standard error estimated from 1,000 bootstrap samples.

Contributions to the Biology of Central Valley Salmonids 55
markers (Figure 3). One significant cause of LD in samples from salmon popu-lations, particularly hatchery populations, is admixture of non-interbreedingpopulations (Waples and Smouse 1991). Mixture was already evident fromthe spring-run affinities of non-maturing brood fish captured in 1995. Theimplication of finding significant levels of LD in the spawning fish was thatspring run had been hybridized with winter run in the supplementation pro-gram and that possibly all samples of winter-run had actually been mixturesof two or more distinct runs.
By identifying and removing individuals with multiple, pairwise allelic com-binations typical of spring run, it was possible to divide the mixture into win-ter and spring components, each of which is in linkage equilibrium. A multi-factorial analysis of individual genotypes confirms the separation based onanalysis of LD (Figure 4). Nineteen of the 140 winter brood fish clearly clusterwith 37 of 38 non-maturing 1995 brood fish (one of the non-maturing fishclusters with the true winter-run fish). The remaining 121 “true” winters showonly 2% of loci-pairs with significant gametic-phase disequilibria when 5% areexpected by chance (Figure 4). The winter-run baseline population now com-prises these “true” winters plus samples of carcasses obtained from the Sacra-mento River, which were similarly purged of a few, admixed non-winters.
Figure 3 The proportion of loci-pairs with significant associations (linkage disequilibrium or LD) in 36 samples of non-winter chinook salmon from the Central Valley (black bars). The extremely high proportion of significant associations in winter chinook captured for a hatchery supplementation program (white bar) is greatly reduced after likely non-winter fish are removed from the sample (dotted arrow).
0
5
10
15
20
25
0.00 0.10 0.20 0.30 0.40 0.50
Proportion of Loci-Pairs with LD
No.
of L
oci-P
airs

56 Fish Bulletin 179: Volume One
Figure 4 Genetic clustering of chinook salmon captured for hatchery-propagation of the winter run. Scores of each fish on the first and third factors derived from factorial correspondence analysis of genotypes at 13 loci are plotted. Black diamonds denote the 140, putative winter run spawned from 1991 through 1995. White boxes denote adults captured in 1995 that did not mature and that clustered closely with spring-run populations (not shown). Note that 19 of the putative winter run adults cluster with the non-maturing, spring-run fish, while one of the non-maturing fish clusters with the true winter run.
The discovery of unwitting winter-spring hybridization in 1995, together withthe observation in the same year that hatchery-spawned fish were returning toBattle Creek rather than the Sacramento River (where they had been releasedas fry), caused the USFWS to temporarily halt the supplementation program.The program resumed in 1998, after construction of the Livingston Stone FishCulture Facility on the Sacramento River solved the imprinting problem anddevelopment of sufficient microsatellite markers and baseline data permittedaccurate assignment of brood stock. A “rapid response” program was imple-mented in 1998 to genotype potential brood stock caught at the fish traps atthe Keswick and Red Bluff diversion dams on the Sacramento River, as well asfish returning to the Coleman National Fish Hatchery on Battle Creek. A cau-dal fin clip is taken from each trapped fish and sent to the Bodega Marine Lab-oratory for analysis of seven microsatellite markers. Simulation resultssuggest that 99.1% (s.d. = 0.91%) of true winter run are correctly identifiedwhen the criterion for assignment is 10:1 or greater odds that a given geno-type belongs to the winter run. More importantly, the percentage of non-win-ter run incorrectly assigned to winter run under this criterion is 0.02% (s.d. =0.16%). Thus, a threshold of 10:1 or greater odds provides ample protectionagainst incorporating non-winter run adults into the hatchery supplementa-
-1.5
-1
-0.5
0
0.5
1
1.5
2
2.5
-1 -0.5 0 0.5 1 1.5 2 2.5 3
Factor I
Fact
or II
I

Contributions to the Biology of Central Valley Salmonids 57
tion program for winter run. We typed 356 fish from the winter spawningruns of 1998 to 2000, of which 240 were assigned to the winter run (Table 2).From 1997 to 2000, we continued to monitor fish returning to the ColemanNational Fish Hatchery; out of 357 examined, 108 were winters, most of whichwere relocated to spawning habitat in the Sacramento River.
Juvenile Emigration and Delta SalvageWe have applied both MSA and individual assignment methods to juvenilechinook emigrating from California’s Central Valley. Though peak times ofemigration for the different subpopulations differ, all five populations poten-tially intermix in the Sacramento-San Joaquin Delta (Fisher 1994). Under-standing the timing of winter-run emigration and their occurrence at the StateWater Project (SWP) and the Central Valley Project (CVP) is essential to evalu-ating the effects of these water-pumping facilities on the endangered Sacra-mento River winter-run chinook salmon. More than 5,000 samples werecollected and genotyped over five consecutive seasons (1995–2000) at twolarge water pumping facilities in the Sacramento-San Joaquin Delta. In thisapplication, in contrast to the selection of hatchery brood stock, we use anassignment criterion of even or better odds, rather than 10:1 odds, that a givengenotype belongs to the winter run. The aim of this criterion is to protect allwinter run at the expense of also protecting some non-winter run fish incor-rectly assigned by the inclusive criterion.
The contributions of various spawning populations to the mixture of juvenilesin the Delta are expected to be unequal and variable with the season. Winterrun contributes a large number of samples early in the season and fewer sam-ples later, when fall run dominates fish salvage. However, as mentionedabove, the relative abundance of the various subpopulations can have a sub-
Table 2 Numbers of chinook adults caught at the Keswick Dam (Sacramento River) and at the Coleman National Fish Hatchery (Battle Creek) subsequently genotyped and assigned to winter run
Year
Keswick Dam(Sacramento River)
Coleman National Fish Hatchery(Battle Creek)
Number genotyped
Number winter run
Number genotyped
Number winter run
1997 --- --- 116 89
1998 152 107 117 15
1999 42 24 70 0
2000 162 109 54 4

58 Fish Bulletin 179: Volume One
stantial effect on individual assignment. To correct for this, we use MSA toestimate the relative abundance of the runs among juveniles of similar sizecaught around the same time as each individual whose genotype alone sug-gests winter-run provenance. In other words, MSA establishes the prior prob-ability for the runs and, using a Bayesian statistical approach, serves to correctthe individual population assignment for unequal relative frequencies of sub-population (Dean and others forthcoming). In practice, the assignment of rela-tively few individuals is affected by this correction (Figure 5). Having thusidentified which emigrating juveniles are winter run, we see that the resultsdo not accord with the growth model predicting the relationship of juvenilesize and provenance. Winter juveniles are caught at similar sizes throughoutthe season of emigration, in contrast to the growth curves that presentlydefine the subpopulations for purposes of determining take of protected win-ter run (Figure 5). The growth curves clearly overestimate the losses of winter-run in the Delta. These results further suggest the hypothesis that the winterrun does not use the lower Delta as rearing habitat.
Figure 5 Size and date of salvage for 4,045 chinook juveniles genotyped between 1995 and 1999. Those individuals with greater than even odds of being assigned to the winter run, adjusted for the abundance of all runs at the time of sampling, are indicated with triangles. Six individuals, whose assignments to winter were overturned by adjustment for relative run-abundance, are indicated with an “X.” All other genotyped samples are indicated with small open circles. Curved lines represent the confidence limits around the expected growth curves for each of the named runs.

Contributions to the Biology of Central Valley Salmonids 59
Ocean CatchAnother area where the use of genetic stock identification can help protectthreatened stocks is in the monitoring of ocean catches. A recent study consid-ers data from an experimental fishery conducted for seven days (April 15–21,1997) between Lopez and Magu points in southern California (Banks and oth-ers forthcoming). As above, both MSA and individual assignment wereapplied in this study, as was the Bayesian correction of individual assignmentfor the actual abundance of contributing stocks. Three data sources were used,microsatellites, allozymes and coded-wire tag recoveries, and all indicated asurprisingly large harvest of the endangered winter run in this short fishery(about 2%). Precise identification of protected subpopulations within water-sheds, such as winter run from the Central Valley, could lead to more refinedfishery management. For example, it should be possible to determine the spe-cific conditions and/or locations that minimize the harvest of protected runs,so that a more targeted fishery on non-threatened stocks could be sustained.Real-time genetic monitoring could be used to verify run composition of har-vest, and effort could be re-directed as necessary to ensure maximum harvestof chosen runs. Such use of population genetics for adaptive fisheries manage-ment could facilitate sustainable salmon harvests even in areas where threat-ened stocks exist.
Genetic Impact of Supplementation
Ryman-Laikre ModelsHaving plummeted from annual runs of nearly 100,000 fish in the late 1960s toless than 200 fish in 1991, the winter chinook was protected under both Cali-fornia and federal endangered species laws in the early 1990s. A hatchery sup-plementation program was initiated with broodstock captured from theSacramento River and taken to the Coleman National Fish Hatchery on BattleCreek for maturation and spawning. Progeny were tagged internally withcoded-wire tags, marked externally by clipping of adipose fins, and releasedinto the Sacramento River as juveniles (smolts). Hedrick and others (1995,2000a, 2000b) have used a demographic population genetics model (Rymanand Laikre 1991) to evaluate the potential genetic effect of this hatchery sup-plementation program from 1991 through 1995. One danger of hatchery sup-plementation is that it could dilute the gene pool by flooding the naturalpopulation with the offspring of a few individuals. However, this dilutionneed not occur.
The effect of hatchery supplementation on genetic diversity is mediatedthrough effects on the effective size (Ne) of the natural population. Ne is thesize of a mathematically ideal population that has rates of genetic drift and

60 Fish Bulletin 179: Volume One
inbreeding equivalent to those in the actual population under study. In themathematically ideal population, there are equal numbers of both sexes,adults mate at random, and variance in number of offspring per adult is bino-mial or Poisson. The number of adults N in the ideal population is, by defini-tion, equal to the effective size, and the ratio of Ne:N = 1.0. In actualpopulations, the sexes may not be in equal numbers, mating may not be atrandom, or the variance in offspring number may be larger than binomial orPoisson.
For a hatchery-supplemented population, Ne depends on the effective sizes ofthe hatchery and wild components of the population and on the relative pro-portion of hatchery origin fish (after Ryman and Laikre 1991):
Neh and New are the effective sizes of the hatchery and wild components of thepopulation, respectively, while x and y are their relative contributions to thetotal (x + y = 1.0). For each year, we calculate Neh from data on the number ofprogeny contributed by each male and female brood fish to the release of juve-niles. The Ne:N ratio for the naturally spawning population is assumed tohave a lower bound of 0.10 (Bartley and others 1992) and an upper bound of0.33 (R.S. Waples, personal communication, see Notes). These ratios are multi-plied by the run-size estimate in any year to obtain Ne before capture of adults(that is, what the effective size would have been without supplementation).The New after capture of adults for supplementation discounts Ne by the num-ber of adults taken to the hatchery. Estimates of the Ryman-Laikre modelparameters from 1991 through 1995 for the winter-run supplementation pro-gram are given in Table 3. There are four important points to note:
1. The supplementation program likely had little, or perhaps a slightly positive effect on winter-run effective population size in all years. Ne with supplementation is higher than Ne without supplementation in all years, if Ne:N = 0.1; Ne with supplementation is higher than without in three of five years at Ne:N = 0.33 (Table 3).
2. The proportion of fish contributed by the hatchery, x, tends to be high in years when the run size was low (1994), and low when the run size was high (1992, 1995). Estimates of x are based on numbers of females, their egg production, and the survival of these progeny from egg to smolt stages. For hatchery stocks, the egg to smolt survival is esti-
Ne
Neh New×
x2New y
2Neh+
-----------------------------------=

Contributions to the Biology of Central Valley Salmonids 61
mated to be 28.5%, about twice as high as estimates for egg to smolt survival in the wild, 14.7% (Hedrick and others 2000). Of course, this boost in early survival is precisely what makes hatchery supplementa-tion such an attractive recovery option in the first place.
3. The genetic effect of supplementation depends critically on x, unless run size is very small. For example, if x in 1995 had been 10% higher, the effect would have been negative, at Ne/N = 0.33, rather than posi-tive. On the other hand, in years of low run size, the hatchery program increases effective population size over a broad range of parameter combinations.
4. Ratios of effective to actual numbers of captive broodstock, Neh:Nh, ranged from 0.47 to 0.8, much higher than the Ne:N ratio assumed for the naturally spawning population (0.1 to 0.33). This boost in Ne:N ratio of the hatchery component is what counterbalances the dilution of natural genetic diversity that seemingly ought to occur in a simple view of supplementation.
Table 3 Effect of hatchery supplementation on the effective size of Sacramento River winter chinook salmon, 1991-1995
Parameter 1991 1992 1993 1994 1995
Naturally spawning run size 191 1180 341 189 1361
No. taken captive (Nh) 23 29 18 29 47
No. of breeding parents(Nf + Nm) 15 26 12 26 42
Hatchery effective size (Neh) 7.02 19.07 7.74 23.2 29.2
(95% confidence interval) (3.58, 12.22) (12.67, 26.68) (3.20, 13.34) (15.9, 30.8) (21.3, 37.8)
Neh/Nh ratio 0.468 0.733 0.645 0.8 0.62
Relative contributionfrom hatchery (x) 0.159 0.061 0.130 0.407 0.083
Ne without hatchery(lower & upper bounds) 19.1 – 63.7 118 – 393.3 34.1 – 113.7 18.9 – 63.0 136.1 – 453.7
New (lower & upper bounds) 16.8 – 56.0 115.1 – 383.6 32.3 – 107.7 16.0 – 53.3 131.4 - 438
Ne with hatchery(lower & upper bounds) 21.9 – 61.6 127.3 – 401.0 39 – 108.6 34.3 – 72.8 150.7 – 463.6

62 Fish Bulletin 179: Volume One
Since Neh is based on adult contributions at release rather than at return andspawning, the above calculations are predictions of Ne. By typing microsatel-lite DNA markers (Banks and others 1999, 2000) on all returning, adipose fin-clipped adults, we were able to assign 93 fish from the 1994 year class to fam-ily (Hedrick and others 2000b). We found that the contributions at release ofeach fish spawned in the hatchery remained approximately the same at return(Table 4) and that the Neh calculated for spawning adults was within the pre-dicted 95% confidence intervals (Hedrick and others forthcoming).
As illustrated in this example, higher survival and higher Ne:N ratios of hatch-ery offspring, combined with contributions that are inversely proportional tothe wild stock size, can increase variance effective size and conserve more ofthe natural biodiversity than would have been conserved in the absence ofsupplementation. Hatchery enhancement does not necessarily constitute athreat to genetic resources; indeed, hatchery supplementation can help toretain biodiversity that would otherwise be lost from threatened and endan-gered populations without intervention. However, we agree with Waples andDo (1994) that supplementation programs are likely to succeed only when theinitial environmental causes of population decline are ameliorated.
Table 4 The proportions of progeny released and returning from the different female and male parents of the 1994 brood year
Female Releases Returns Male Releases Returns
3 0.080 0.108 B 0.102 0.097
4 0.070 0.054 C 0.073 0.097
5 0.058 0.075 D 0.107 0.172
6 0.054 0.065 E 0.139 0.086
7 0.056 0.032 F 0.120 0.161
8 0.053 0.022 G 0.128 0.065
9 0.054 0.054 H 0.102 0.108
11 0.054 0.075 I 0.147 0.172
12 0.062 0.032 J 0.070 0.032
13 0.092 0.086 K 0.029 0.011
14 0.032 0.022
15 0.079 0.108
16 0.066 0.108
17 0.064 0.075
18 0.071 0.043
19 0.057 0.043
Total 43,346 93 Total 43,346 93

Contributions to the Biology of Central Valley Salmonids 63
Domestication Selection?Concern is often expressed about genetic changes in supplemented popula-tions resulting from artificial or domestication selection for survival in thehatchery environment or from shielding of adults or hatchery-reared progenyfrom natural selection (for example, Waples 1999). While this is undoubtedlytrue for production hatchery stocks of fall chinook salmon in the Central Val-ley, conservation hatcheries get brood stock continually from the wild and donot typically use hatchery-reared progeny to propagate the next generation.In this case, the efficiency of selection on a single pass through a hatchery islikely to be low, especially if differential survival among families is mini-mized.
Equivalence in the relative proportions of winter-run families at spawning,release, and return suggests low additive genetic variance for survival in thehatchery or at sea. Moreover, data on the relative numbers of naturallyspawned and hatchery fish returning to the Sacramento River, though subjectto large uncertainty (Botsford and Brittnacher 1998), suggest the hatchery con-tribution is not consistently less at return than at release. For 1995 through1998, the proportions of hatchery-origin winter run, at return compared torelease (three years before), are 6.1% vs. 6.1%, 20.1% vs. 16.1%, and 25.0% vs.41.7% (addendum to USFWS ESA Section 10 Permit Supplement, dated Feb-ruary 20, 1998). These data suggest the relative survival of hatchery and wildfish in the wild is not grossly different, given the large uncertainty in theescapement estimates. In this one example, at least, we see little evidence forselection as the result of a single pass through a supplementation hatchery.The long-term risk to diversity from over-propagating a few adults appears tofar outweigh the risk from artificial selection, at least in the winter-run propa-gation program. This need not be the finding in other programs, however. Theimportant point is that data on family proportions at spawning, release, andadult stages allow evaluation of the relative strengths of selection and randomdrift and should be required for supplementation programs.
Hybridization in Production Hatcheries
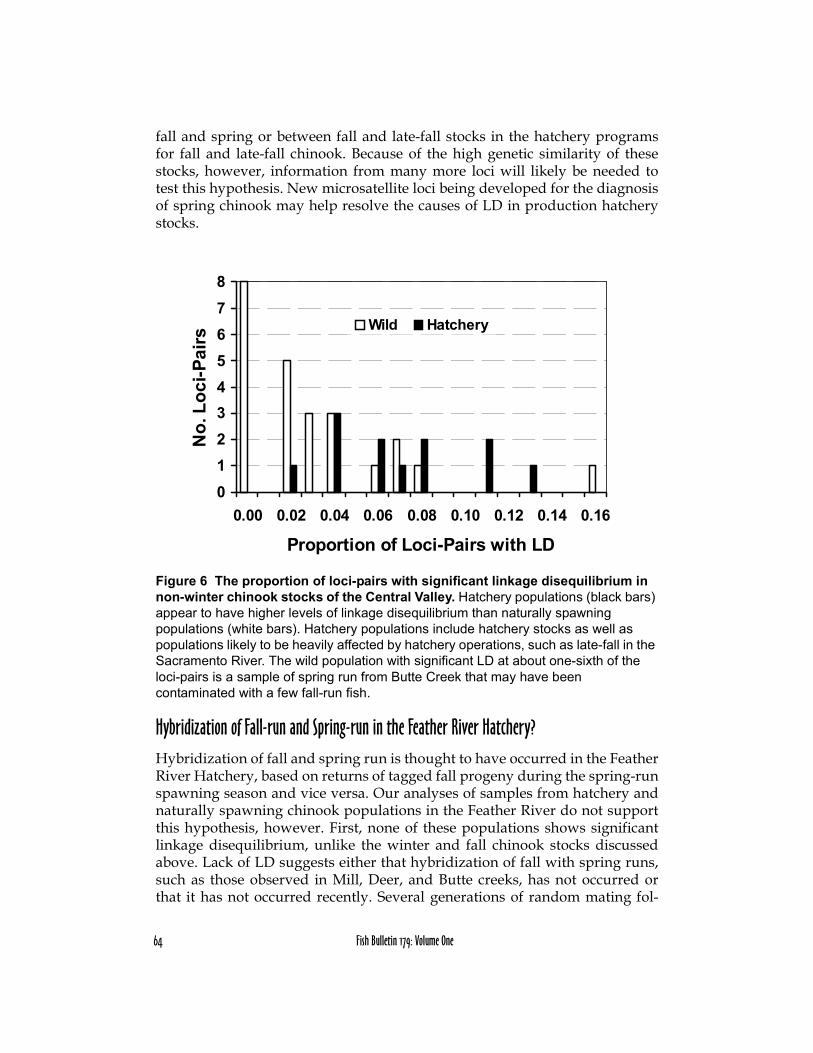
Hybridization in the Coleman National Fish Hatchery Fall StockAnalyses of linkage disequilibrium in samples of fall and late-fall chinookstocks propagated or heavily influenced by hatcheries show higher levels ofLD than typically observed in naturally spawning stocks of chinook salmon(Figure 6). The median proportion of pairwise combinations of loci showingsignificant LD is 0.069 for hatchery stocks and 0.025 for naturally spawningadult chinook populations. A likely explanation for this slight elevation of LDin production hatchery stocks is recent admixture and hybridization between
64 Fish Bulletin 179: Volume One
fall and spring or between fall and late-fall stocks in the hatchery programsfor fall and late-fall chinook. Because of the high genetic similarity of thesestocks, however, information from many more loci will likely be needed totest this hypothesis. New microsatellite loci being developed for the diagnosisof spring chinook may help resolve the causes of LD in production hatcherystocks.
Figure 6 The proportion of loci-pairs with significant linkage disequilibrium in non-winter chinook stocks of the Central Valley. Hatchery populations (black bars) appear to have higher levels of linkage disequilibrium than naturally spawning populations (white bars). Hatchery populations include hatchery stocks as well as populations likely to be heavily affected by hatchery operations, such as late-fall in the Sacramento River. The wild population with significant LD at about one-sixth of the loci-pairs is a sample of spring run from Butte Creek that may have been contaminated with a few fall-run fish.
Hybridization of Fall-run and Spring-run in the Feather River Hatchery?Hybridization of fall and spring run is thought to have occurred in the FeatherRiver Hatchery, based on returns of tagged fall progeny during the spring-runspawning season and vice versa. Our analyses of samples from hatchery andnaturally spawning chinook populations in the Feather River do not supportthis hypothesis, however. First, none of these populations shows significantlinkage disequilibrium, unlike the winter and fall chinook stocks discussedabove. Lack of LD suggests either that hybridization of fall with spring runs,such as those observed in Mill, Deer, and Butte creeks, has not occurred orthat it has not occurred recently. Several generations of random mating fol-
012345678
0.00 0.02 0.04 0.06 0.08 0.10 0.12 0.14 0.16
Proportion of Loci-Pairs with LD
No.
Loc
i-Pai
rs
Wild Hatchery

Contributions to the Biology of Central Valley Salmonids 65
lowing some past hybridization event could have reduced initial LD to non-detectable levels. Second, chinook in the Feather River cluster with the fall-run lineage in the Central Valley (Figure 7), not with the spring chinook lin-eages observed in Mill, Deer, and Butte creeks. This proximity of FeatherRiver chinook to the fall-run lineage is observed when samples, whose originis marked “unknown” by DFG collectors, are pooled after testing for and fail-ing to find any significant heterogeneity among these samples. Still, few of the“unknown” samples can be included in the homogeneous pool of fall sam-ples, so some slight but statistically significant genetic differentiation doesexist between many of these unknown samples and fall chinook populations.The nature of this differentiation is still under investigation, but it seems notto be the result of hybridization. Finally, under the hypothesis of past hybrid-ization followed by random mating, one might expect to see Feather Riverpopulations occupying a genetically intermediate position between fall andspring runs. Yet, there is no consistent tendency for Feather River “unknown”samples to have frequencies intermediate to fall and spring frequencies.
Figure 7 Clustering of Central Valley chinook samples by similarity at seven microsatellite loci shows chinook of unknown (spring?) race in the Feather River to be most closely related with fall chinook
Parentage and Kinship
One of the exciting new areas in population genetics is the application ofhighly polymorphic microsatellite DNA markers to questions of parentageand kinship in natural populations (O’Reilly and others 1998; Goodnight andQueller 1999; Bentzen and others 2000). These methods and markers areequally applicable to hatchery populations, in which the parents or potentialparents are often known, as in the case of the winter-run hatchery supplemen-tation program. In this case, the parents of any given progeny can be identi-
0.01
Winter
Spring, BC
Spring, D&MC
Late-Fall
Fall
Unk. Feather
100
91.8
91.4
97.7

66 Fish Bulletin 179: Volume One
fied by simple matching algorithms; WHICHPARENT, a program facilitatingsuch matching of progeny and parents, is available at http://www-bml.ucdavis.edu/imc/Software.html.
More difficult is ascertaining kinship when parents are unknown. In thecourse of our survey of variation in the Central Valley, for example, we hadseveral samples of the threatened spring run that comprised only juveniles. Inthe past, population geneticists advised against using such samples becausethe presence of full- or half-sibs could bias allele-frequency estimates (Allen-dorf and Phelps 1981). Indeed, these samples showed significant departuresfrom single locus and pairwise linkage equilibrium, compared to samplesfrom naturally spawning adult populations. We investigated kinship in thesespring-run chinook juvenile samples and attempted to estimate the allele fre-quencies of the adult spawning population from which they were derived(Banks and others 2000). This was done by first identifying groups of individ-uals showing significant odds of being full-sibs. Of the 206 individuals inthese samples with sufficient genotypic information, 114 were involved inpairwise comparisons for which the hypothesis of a full-sib relationship wassignificantly more likely (P < 0.01) than the hypothesis that they were unre-lated. Next, we determined the mating type or combination of parental geno-types at each locus with the maximum likelihood of producing the array ofgenotypes in each full-sib group. We then replaced these 114 individuals with86 inferred parents. After adjustment of juvenile samples for kinship, the pro-portions of single- and multiple-locus genotypes within each conformed torandom mating expectations. This procedure allowed us to use the informa-tion gained from juvenile samples in our Central Valley baseline data set.
These procedures for adjusting estimates of allele frequencies for kinshipshould be generally applicable to salmon molecular ecological studies. This isan active area of research, and several laboratories, including ours, are pres-ently refining statistical approaches that will accurately recover parental gen-otypes from juvenile samples.
Conclusions
Population genetic analysis of highly polymorphic microsatellite DNA mark-ers confirms the existence of genetically diverse subpopulations of chinooksalmon in the Central Valley. These subpopulations correspond to the tradi-tional seasonal runs, winter, spring, fall, and late-fall, though two distinct lin-eages of spring run have been identified, one in Mill and Deer creeks, theother in Butte Creek. The availability of a high quality genetic database forCentral Valley chinook populations now enables identification of the run-composition of mixtures, which can occur at all stages of the life-cycle, usingthe traditional method of Mixed Stock Analysis (MSA). Moreover, the high

Contributions to the Biology of Central Valley Salmonids 67
level of diversity among runs at microsatellite DNA markers enables theassignment of individuals to run with an unprecedented degree of accuracyand precision. Individual identification is useful in determining the presenceof winter run at all phases of the life cycle. Confirming the run-origin of puta-tive winter chinook brood stock is essential for the hatchery supplementationprogram. Identifying protected runs in the fish salvage operations at the CVPand SWP in the Delta and in ocean harvests are other important application ofmicrosatellite DNA markers. Thus, the development and application of micro-satellite DNA markers has significantly advanced knowledge of winter-runbiology as well as conservation efforts. Extension of the methods developedfor winter-run identification to threatened spring-run populations shouldnow be straightforward.
References
Allendorf FW, Phelps SR. 1981. Use of allelic frequencies to describe population struc-ture. Can J Fish Aquat Sci 38:1507–14.
Banks MA, Eichert W. 2000. WHICHRUN (Version 3.2): a computer program for pop-ulation assignment of individuals based on multilocus genotype data. J Hered 91:87–9.
Banks MA, Blouin MS, Baldwin BA, Rashbrook VK, Fitzgerald HA, Blankenship SM, Hedgecock D. 1999. Isolation and inheritance of novel microsatellites in chinook salmon (Oncorhynchus tshawytscha). J Hered 90:281–8.
Banks MA, Rashbrook VK, Calavetta M J, Dean CA, Hedgecock D. 2000. Analysis of microsatellite DNA resolves genetic structure and diversity of chinook salmon (Oncorhynchus tshawytscha) in California’s Central Valley. Can J Fish Aquat Sci 57:915–27.
Bartley D, Gall GAE, Bentley B, Brodziak J, Gomulkiewicz R, Mangel M. 1992. Geo-graphic variation in population genetic structure of chinook salmon from Califor-nia and Oregon. Fish Bull US 90:77–100.
Bentzen P, Olsen JB, McLean J, Seamons TR, and Quinn TP. 2000. Kinship analysis of Pacific salmon: insights into mating, homing and timing of reproduction. J Hered-ity. Forthcoming.
Botsford LW, Brittnacher JG. 1998. Viability of Sacramento River winter-run chinook salmon. Conserv Biol 12:65–79.
Fisher FW. 1994. Past and present status of Central Valley chinook salmon. Conserv Biol 8:870–3.

68 Fish Bulletin 179: Volume One
Fry DH. 1961. King salmon spawning stocks of the California Central Valley, 1949-1959. California Fish and Game 47(1):55-71.
Goodnight KF, Queller DC. 1999. Computer software for performing likelihood tests of pedigree relationship using genetic markers. Mol Ecol 8:1231–4.
Healey MC. 1991. The life history of chinook salmon. In: Groot C, Margolis L, editors. Pacific salmon life histories. Vancouver, BC: University of British Columbia Press. p 39-52.
Hedrick PW. 1999. Perspective: highly variable genetic loci and their interpretation in evolution and conservation. Evolution 53:313–8.
Hedrick PW, Hedgecock D, Hamelberg S. 1995. Effective population size in winter-run chinook salmon. Conserv Biol 9:615–24.
Hedrick PW, Hedgecock D, Hamelberg S, Croci SJ. 2000. The impact of supplementa-tion in winter-run chinook salmon on effective population size. J Hered 9:112–6.
Hedrick PW, Rashbrook VK, Hedgecock D. Effective population size of winter-run chinook salmon based on microsatellite analysis of returning spawners. Can J Fish Aquat Sci. Forthcoming.
Kim JT, Parker KM, Hedrick PW. 1999. MHC differentiation in Sacramento River chi-nook salmon. Genetics 151:1115–22.
Milner GB, Teel DJ, Utter FM, Winans GA. 1985. A genetic method of stock identifica-tion in mixed populations of Pacific salmon, Oncorhynchus spp. Mar Fish Rev 47:1–8.
[NMFS] National Marine Fisheries Service. 1994. Endangered and threatened species; status of Sacramento River winter-run chinook salmon. Federal Register 59(2):440–50.
[NMFS] National Marine Fisheries Service. 1999. Endangered and threatened species; Threatened status for two chinook salmon evolutionary significant units (ESUs) in California. Federal Register 64(179):50394–415.
Nielsen JL, Fountain MC, Sundermeyer DR, Heine EL, Malone CL, Avelino OL. 2000. Microsatellite variation in chinook salmon spawning runs from the Central Val-ley, California, 1992-1997. Report to the California Department of Fish and Game. 38 p.
Nielsen JL, Tupper D, Thomas WK. 1994. Mitochondrial DNA polymorphism in unique runs of chinook salmon (Oncorhynchus tshawytscha) from the Sacramento-San Joaquin river basin. Conserv Biol 8:882–4.
O'Reilly PT, Herbinger C, Wright JM. 1998. Analysis of parentage determination in Atlantic salmon. Anim Genet 29:363–70.

Contributions to the Biology of Central Valley Salmonids 69
Paetkau D, Waits L, Clarkson P, Craighead L, Strobeck C. 1997. An empirical evalua-tion of genetic distance statistics using microsatellite data from bear (Ursidae) populations. Genetics 147:1943–57.
Ryman N, Laikre L. 1991. Effects of supportive breeding on the genetically effective population size. Conserv Biol. 5:325–9.
Shoemaker JS, Painer IS, Weir BS. 1999. Bayesian statistics in genetics: a guide for the uninitiated. Trends in Genetics 15:354–8.
Stone L. 1874. Report of operations during 1872 at the United States salmon hatching establishment on the McCloud River. U.S. Commission on Fish and Fisheries, Report for 1872 and 1873, Part II: 168–215. Washington, D.C.
Utter FM, Ryman N. 1993. Genetic markers and mixed stock fisheries. Fisheries 18:11–21.
Utter FM. 1991. Biochemical genetics and fishery management: an historical perspec-tive. J Fish Biol 39(Suppl A):1–20.
Waples RS. 1991. Definition of “species” under the Endangered Species Act: applica-tion to Pacific salmon. National Oceanic and Atmospheric Administration Techni-cal Memorandum, National Marine Fisheries Service F/NWC-194. Seattle (WA): Northwest Fisheries Science Center.
Waples RS. 1995. Evolutionary significant units and the conservation of biological diversity under the Endangered Species Act. Amer Fish Soc Symp 17:8–27.
Waples RS. 1999. Dispelling some myths about hatcheries. Fisheries 13:12–21.
Waples RS, Do C. 1994. Genetic risk associated with supplementation of Pacific salmonids: Captive broodstock programs. Can J Fish Aquatic Sci 51:310–29.
Waples RS, Smouse PE. 1990. Gametic disequilibrium analysis as a means of identify-ing mixtures of salmon populations. Amer Fish Soc Symp 7:439–58.
Wright S. 1931. Evolution in Mendelian populations. Genetics 16:97–159.
Yoshiyama RM, Gerstung ER, Fisher FW, Moyle PB. 1996. Historical and present dis-tribution of chinook salmon in the Central Valley drainage of California. Sierra Nevada Ecosystem Project: final report to Congress. In: University of California, Center for Water and Wildlife Resources, Davis. Assessments, commissioned reports, and background information. p 309-362.
Yoshiyama RM, Fisher FW, Moyle PB. 1998. Historical abundance and decline of chi-nook salmon in the Central Valley region of California. N Am J Fish Manage 18:487–521.

70 Fish Bulletin 179: Volume One
Yoshiyama RM, Gerstung ER, Fisher FW, Moyle PB. 2001. Historical and present dis-tribution of chinook salmon in the Central Valley drainage of California. In: Brown RL, editor. Fish Bulletin 179: Contributions to the biology of Central Valley salmonids. Volume 1. Sacramento (CA): California Department of Fish and Game.
Notes
Teel D. (National Marine Fisheries Service, NW Fisheries Science Center, Seattle, Washington). June 1999 poster at the Coastwide Salmon Genetics meeting, Uni-versity of Montana, Missoula, Montana.
Waples RS. (National Marine Fisheries Service, NW Fisheries Science Center, Seattle, Washington.) Personal communication with D. Hedgecock at December 1992 meeting of the Genetics subcommittee of the winter chinook captive breeding committee, UC Davis, with P. Hedrick, L. Botsford, and D. Hedgecock attending.
Winans G. (National Marine Fisheries Service, NW Fisheries Science Center, Seattle, Washington). June 1999 poster at the Coastwide Salmon Genetics meeting, Uni-versity of Montana, Missoula, Montana.