applications of environmental scanning electron microscopy
TRANSCRIPT

Colloids and Surfaces
A: Physicochemical and Engineering Aspects 174 (2000) 37–53
Applications of environmental scanning electron microscopyto colloidal aggregation and film formation
Athene M. Donald *, Chaobin He, C. Patrick Royall, Michele Sferrazza,Nadia A. Stelmashenko, Bradley L. Thiel
Ca6endish Laboratory, Department of Physics, Uni6ersity of Cambridge, Madingley Road, Cambridge CB3 OHE, UK
Abstract
Environmental scanning electron microscopy (ESEM) is a rather new form of electron microscopy, which permitsthe observation of hydrated samples in their native state, and also does not require that insulators are coated witha conducting layer. These two factors make it ideal for studying colloidal dispersions as they aggregate and/or filmform. This paper describes the application of ESEM to three situations involving aggregating latices. Firstly thenature of fractal structures grown from aggregating acrylic latices is discussed, with a comparison given of thebehaviour with and without added salt as the screening between particles is altered. Secondly the behaviour of vinyllatices is considered. The impact of the addition of starch, both modified and unmodified, upon the particle sizedistribution and ability to film form is examined. Finally, the structures which form when the hard inorganiccomponent silica is added to acrylic latices are explored. Together these three examples illustrate some of the manystrengths of the ESEM in the field of colloidal dispersions and aggregates. © 2000 Elsevier Science B.V. All rightsreserved.
Keywords: Environmental scanning electron microscopy; Colloidal aggregation; Film formation
www.elsevier.nl/locate/colsurfa
1. Introduction
For many colloidal systems, water is an integralpart of the whole, and as such the ability to image‘wet’ systems in their native state is vital. Howeverthere is a dearth of techniques which combine thiswet-imaging ability with good resolution anddepth of field. Optical microscopy has a long anddistinguished history, but for smaller colloidalparticles its resolution is frequently inadequate.Conversely electron microscopy has, until re-
cently, been limited by the need to carry outexamination of a sample in the high vacuumrequired by the instruments (be they scanning ortransmission electron microscopes, SEMs orTEMs, respectively). Due to this limitation it hasalways been necessary to go through a series offairly drastic specimen preparation steps such asfreeze-drying prior to imaging. This leads to thedanger that artefacts may creep into the imageperhaps because of ice crystal formation, or thatredistribution of components could occur duringthe freeze-drying process. For these reasons therehas been a need for a microscopy which permits* Corresponding author. Fax: +44-1223-337000.
0927-7757/00/$ - see front matter © 2000 Elsevier Science B.V. All rights reserved.
PII: S0927 -7757 (00 )00520 -3

A.M. Donald et al. / Colloids and Surfaces A: Physicochem. Eng. Aspects 174 (2000) 37–5338
the imaging of colloidal dispersions in their nativestate, yet still with the high resolution of anelectron microscope. The introduction of the envi-ronmental scanning electron microscope (ESEM)in the last decade, and its various cousins at thelow vacuum end (known variously as leakySEMs, low vacuum SEMs, variable pressureSEMs etc) has now opened up the field. However,comparatively little work has yet been done utilis-ing the full power of the instrument for colloidalsystems, not least because of a failure of anappreciation of the potential of the instrument.This article serves to highlight the power of thetechnique, in the hopes that other workers in thefield will feel encouraged to apply it to theirparticular favourite colloid, and to demonstrateits applicability to a few specific examples in thefield of particle aggregation and coalescence. Abrief overview of the limited applications ofESEM to colloids in the literature can be found inDonald [1].
So how is it possible to keep water in anelectron microscope and still form a high resolu-tion image? The key development lay in the recog-
nition by Danilatos that by utilising a columnwith a system of differential pumping zones, itwas possible to satisfy both the requirement thatthe electron gun was kept at the necessary highvacuum, and that the sample was kept wet (for auseful early review see Danilatos [2]). Fig. 1 showsa schematic of the lay-out of the column, with thedifferent pressure zones identified. The vacuumconsiderations in the vicinity of the gun are suffi-cient to permit a LaB6 filament to be used, withits high brightness, as well as the more commontungsten filament. Below the gun are a series ofpressure-limiting apertures (typically three) acrosswhich there is differential pumping to allow apressure difference to be maintained. In this way apressure of up to about 20 torr (�1000 Pa) canbe maintained in the vicinity of the sample. As wewill see below, this is sufficient to ensure that awet sample can be maintained in its wet state.
However maintaining this pressure differentialis not in itself sufficient to permit the operation ofthe instrument. There are two further require-ments: firstly to ensure that the scattering whichthe electron beam undergoes as it passes through
Fig. 1. Schematic of the ESEM column, identifying the different pressure regimes.

A.M. Donald et al. / Colloids and Surfaces A: Physicochem. Eng. Aspects 174 (2000) 37–53 39
Fig. 2. Scattering of the incident beam by the gas moleculescauses a so-called ‘skirt’ to form, but the central probe is stillsharp: (a) the incident beam undergoes collisions but most ofthe electrons travel unscattered; (b) the shape of the probewhich forms as a result.
that is capable of operating outside a vacuum.The requirement that the scattering is not exces-sive is most easily met by ensuring that the dis-tance from the final pressure-limiting aperture tothe sample is only short, the so-called workingdistance. As long as the average number of colli-sions an electron in the primary beam undergoesas it travels that distance is kept small, and indeedthat the majority of the electrons are not scatteredat all, the net effect is to introduce a broad ‘skirt’onto a sharp and well-defined probe as can beseen in Fig. 2. This skirt effectively acts as a DCbackground, but does not significantly degradethe resolution. To ensure that this so-calledoligoscattering regime is not exceeded, the combi-nation (crudely this can be represented by theproduct) of working distance and chamber pres-sure needs to be kept sufficiently low. This natu-rally imposes restrictions on the possibleconditions within the chamber, and hence theexperiments that can be carried out. However, aswe will see below, it nevertheless leaves a broadand extremely useful window within which wetsamples can readily be imaged.
As regards the detector, Danilatos back in theearly 1980s designed a simple and effective detec-tor, quite distinct from the Everhardt–Thornleydetector used in conventional SEMs, known asthe environmental secondary electron detector.Since then detectors have continued to evolve,and are still doing so as our understanding of howto optimise signal detection continues to improve.For all the detectors the basic principles are thesame. Electrons emitted from the sample, be theysecondary electrons or the higher energy backscat-tered, have to travel back through the gas-con-taining chamber to the detector. In traversing thegas, these electrons will undergo collisions withthe gas molecules. The collisions may be of vari-ous types both inelastic and elastic. Of crucialimportance are the ionising collisions which leadto the creation of new daughter electrons. In thisway a cascade amplification process occurs asshown in Fig. 3, so that many more electrons aredetected than were originally emitted from thesample. The degree of amplification has beenstudied in detail, Fletcher et al. [3], Thiel et al. [4],and depends on operating parameters such as gas
Fig. 3. Schematic representation of the cascade amplificationprocess, whereby daughter electrons are created en route to thedetector.
a region containing gas molecules is not so greatto degrade the image resolution to the point thatit is no longer better than an optical microscope(for instance); and secondly to build a detector
A.M. Donald et al. / Colloids and Surfaces A: Physicochem. Eng. Aspects 174 (2000) 37–5340
pressure and working distance. A highly desirableside effect of the cascade amplification process isthat positive ions are formed which drift back tothe surface of the sample. There they can neu-tralise the usual build-up of charge associatedwith electron microscopy of insulators. Thismeans that insulating samples can be viewed with-out the need to apply any conducting coatingfirst. A corollary of this is that fine surface detailcan be seen without the risk of it being obscuredby a thin conductive layer.
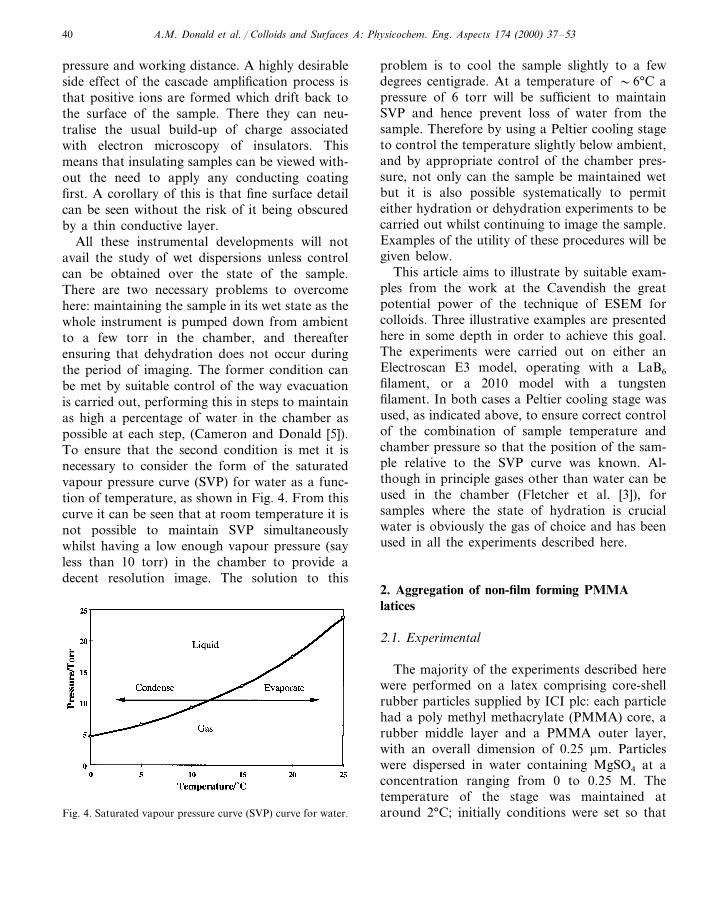
All these instrumental developments will notavail the study of wet dispersions unless controlcan be obtained over the state of the sample.There are two necessary problems to overcomehere: maintaining the sample in its wet state as thewhole instrument is pumped down from ambientto a few torr in the chamber, and thereafterensuring that dehydration does not occur duringthe period of imaging. The former condition canbe met by suitable control of the way evacuationis carried out, performing this in steps to maintainas high a percentage of water in the chamber aspossible at each step, (Cameron and Donald [5]).To ensure that the second condition is met it isnecessary to consider the form of the saturatedvapour pressure curve (SVP) for water as a func-tion of temperature, as shown in Fig. 4. From thiscurve it can be seen that at room temperature it isnot possible to maintain SVP simultaneouslywhilst having a low enough vapour pressure (sayless than 10 torr) in the chamber to provide adecent resolution image. The solution to this
problem is to cool the sample slightly to a fewdegrees centigrade. At a temperature of �6°C apressure of 6 torr will be sufficient to maintainSVP and hence prevent loss of water from thesample. Therefore by using a Peltier cooling stageto control the temperature slightly below ambient,and by appropriate control of the chamber pres-sure, not only can the sample be maintained wetbut it is also possible systematically to permiteither hydration or dehydration experiments to becarried out whilst continuing to image the sample.Examples of the utility of these procedures will begiven below.
This article aims to illustrate by suitable exam-ples from the work at the Cavendish the greatpotential power of the technique of ESEM forcolloids. Three illustrative examples are presentedhere in some depth in order to achieve this goal.The experiments were carried out on either anElectroscan E3 model, operating with a LaB6
filament, or a 2010 model with a tungstenfilament. In both cases a Peltier cooling stage wasused, as indicated above, to ensure correct controlof the combination of sample temperature andchamber pressure so that the position of the sam-ple relative to the SVP curve was known. Al-though in principle gases other than water can beused in the chamber (Fletcher et al. [3]), forsamples where the state of hydration is crucialwater is obviously the gas of choice and has beenused in all the experiments described here.
2. Aggregation of non-film forming PMMAlatices
2.1. Experimental
The majority of the experiments described herewere performed on a latex comprising core-shellrubber particles supplied by ICI plc: each particlehad a poly methyl methacrylate (PMMA) core, arubber middle layer and a PMMA outer layer,with an overall dimension of 0.25 mm. Particleswere dispersed in water containing MgSO4 at aconcentration ranging from 0 to 0.25 M. Thetemperature of the stage was maintained ataround 2°C; initially conditions were set so thatFig. 4. Saturated vapour pressure curve (SVP) curve for water.

A.M. Donald et al. / Colloids and Surfaces A: Physicochem. Eng. Aspects 174 (2000) 37–53 41
Fig. 5. Acrylic latex in water.
2.2. Results and discussion
Fig. 5 shows an example of the latex dispersionbefore any drying has occurred. The individualparticles are well resolved, and their apparent‘fuzziness’ in places is due to the fact that they aredispersed in water (and hydrated particles willalways have a more diffuse boundary than dry)and are undergoing Brownian motion on the timescale of the recording time for the frame (someseconds). It must be remembered that what thisimage shows is the surface only of the sample.Thus what can be seen is where individual parti-cles are protruding through the surface or coveredby only a sufficiently thin layer of water that theelectron beam can penetrate. Thus all the greyregions in between the individual particles corre-spond to water where there are no particles closeenough to the surface to be visible. At this earlystage the particles remain distinct, and there areno aggregates visible.
As evaporation proceeds, aggregation begins(Fig. 6). In this case, where no salt is present,watching the particle collisions shows that a colli-sion does not usually lead to ‘sticking,’ i.e. aparticle joining an aggregate. The net result is theslow formation of a well-ordered colloidal crystal.In the surface plane the majority of the packing isfound to have hexagonal symmetry, although oc-casionally four-fold symmetry is also seen (Heand Donald [6]). The packing is seen to havemany defects, both in terms of ‘missing’ particles,and in terms of grain boundaries where the orien-tation of the planes changes.
In the presence of salt, the structures whichform are much less ordered. Systematic changescan be seen as the molarity of the MgSO4 israised, (He and Donald [6]). The addition of salthas the effect of reducing the long-range repulsionso that the barrier to the deep primary minimumof the interparticle potential is reduced. When twoparticles come together the probability of stickingtherefore increases and this can be directly viewedin the ESEM with the particles coming together inthe primary minimum. This aggregation will beirreversible (Jeffrey and Ottewill [7]). The net ef-fect is therefore to lead to a much more disor-dered, open structure than in the no-salt case.
Fig. 6. As water is allowed to evaporate in the ESEM, acolloidal crystal starts to form from the acrylic latex.
no evaporation or condensation occurred. Afterthis initial imaging the temperature was raisedslightly so that evaporation took place whilstimaging was continued. In this way the evolvingstructure during aggregation could be followed inreal time. A few experiments were also carried outon a similar particle, but lacking the outside layerof PMMA. It is, therefore, a ‘soft’ latex in so faras the outer layer has a Tg of below zero. Inprinciple videos can be taken in real time of thewhole process, so that each stage can be examinedin detail later. In practice the danger of beamdamage affecting the response of the system, if agiven area is viewed for extended periods, meansvideoing must be treated with caution.

A.M. Donald et al. / Colloids and Surfaces A: Physicochem. Eng. Aspects 174 (2000) 37–5342
Fig. 7 compares the form of the flocs that formfor the case of 0.078 and 0.25 M MgSO4, for thesame overall particle concentration of 1×10¹³
particles cm−3. It can be seen that a much morecompact structure is formed for the latter casethan for the former, and in neither case is thereany regularity of packing of the type seen in thecolloidal crystals when no salt is present. Imagessuch as those seen in Fig. 7 can be analysed inmore detail to provide a novel way of characteris-ing the fractal dimension of the flocs that form.
The fractal (or Hausdorff) dimension d is ameasure of how convoluted the fractal structureis. Its value depends on the mechanism by whichthe fractal structure has formed. Colloidal aggre-gation is usually described by one of three limitingcase models: fast diffusion limited cluster aggrega-tion (DLCA), slow reaction limited cluster aggre-gation (RLCA) and diffusion limited aggregation(DLA) (Weitz [8]). In the RLCA case there aresignificant repulsive forces acting between neigh-bours, with the consequence of producing slowaggregation rates and more compact structuresthan in the DLCA case. Diffusion limited aggre-gation (DLA) idealises the irreversible aggrega-tion of colloidal particle aggregates, in whichindividual particles join pre-existing clusters. Thisis in contrast to the DLCA regime, in whichclusters diffuse to join other, pre-existing clusters.According to theory and simulation, the fractaldimension of two dimensional flocs should be 1.45for the DLCA regime, 1.6 for the RLCA regimeand 1.7 for DLA aggregation (Witten and Sander[9], Viscek [10]), although experimental results arenot so clear cut (Richetti et al. [11], Hurd andSchaefer [12], Stannkiewicz et al. [13], Fernandez-Barbero et al. [14]).
The fractal dimensions were calculated for theflocs in Fig. 7, by using a method (Vicsek [10])designed to calculate the dimension of a singlefractal: the number of particles N(R) belonging toa fractal and lying within a circle of radius R (Rless than the maximum dimension of the fractal)was evaluated and then N(R) versus R was plot-ted as a double logarithmic plot. From such ananalysis it should be possible to deduce, for differ-ent conditions of particle and salt concentration,what regime of aggregation the system is in. Theflocs that form are of course three dimensional,but the way the image is formed means that onlythe top quasi-two-dimensional plane is sampled.This means that the situation is more complicatedthan where the floc is constrained to lie at aninterface and is therefore necessarily two-dimen-sional, as in many of the earlier works, Hurd andSchaefer [12], Stankiewicz et al. [13]. It is moreakin to that of fat crystal networks recentlyanalysed via optical microscopy (Narine andMarangoni [15]).
Fig. 7. Flocs formed during the evaporation of water from alatex containing (a) 0.078 M MgSO4 and (b) 0.25 M MgSO4.

A.M. Donald et al. / Colloids and Surfaces A: Physicochem. Eng. Aspects 174 (2000) 37–53 43
Fig. 8. Fractal dimensions calculated from the flocs shown inFigs. 7 and 9. The plot shows the number of particles con-tained within a radius R as a function of R for: =0.078 MMgSO4; D=0.25 M MgSO4 and = ‘soft’ particles shown inFig. 9; all at a concentration of particles of 1×10¹³ particlescm−3.
When the salt concentration is raised to 0.25 M(Fig. 7(b)), a very different situation pertains.Because of the increased screening due to the salt,essentially every collision leads to sticking. Be-cause of this a large number of small aggregatesform. These clusters then move around and aggre-gate further, exactly the situation envisaged in thecluster-cluster aggregation model. The fractal di-mensions ranged from 1.2 to 1.6 depending on thesize of the aggregates. This is similar to the exper-imental results obtained by Stankiewicz et al.,who showed that the fractal dimension increasedas the size increased, also with a limiting value of1.6 [13].
One possibility raised in the paper byStankiewicz is the possibility that restructuringmay occur after the floc first forms. The moreopen the structure which forms the more likely itis to occur for one arm to move and bump intoanother. If the sticking probability is high, then anew shape will form, whose fractal dimension nolonger reflects the mechanism by which the origi-nal structure formed. In our work we saw evi-dence for this in the flocs formed from ratherdifferent ‘soft’ latex particles which lacked theoutermost PMMA layer, but were also chargestabilised. Since the outer layer was rubber andhence soft, when contact between particles wasmade sticking always occurred (the Tg of therubber layer was �−20°C). Fig. 9 shows atypical floc for this system, grown at the sameparticle concentration as the earlier examples of1×1013 particles cm−3, and with no added salt. Itcan be seen that the floc contains loops of parti-cles, rather than dangling arms as in the earliercases, giving an appearance overall of a network.This is consistent with collisions between the orig-inal arms having occurred, and the whole struc-ture subsequently restructuring as the two armsstick together. Of course, it is additionally possi-ble that the particles themselves are so soft thatthey deform individually; this will also have theeffect of altering the fractal dimension deter-mined, but it is hard to assess the impact of thisas even this comparatively high resolution tech-nique cannot follow the individual particles withthis degree of detail.
Fig. 8 shows the results for this N(R) versus Ranalysis for the two flocs of Fig. 7. Although it isdangerous to draw too many conclusions fromsuch a limited data set, it can be seen that the twoslopes are somewhat different for the two differ-ent salt levels. The biggest aggregate in Fig. 7(a)has :1200 particles in it, and the fractal dimen-sion deduced from Fig. 8 is 1.4590.05. This canbe compared with a value for d of 1.690.05 forthe largest aggregate (�1700 particles) in thehigher salt case of Fig. 7(b). By watching how theaggregation occurs in the case of low salt, it isobserved that the floc grows by individual parti-cles sticking to the pre-existing cluster (althoughsometimes small clusters may also approach andstick). The salt concentration employed, 0.078 M,is close to the critical value at which aggregationfirst occurs and, as in the no-salt case, by nomeans every collision of a particle with a clusterleads to sticking. Thus the observations suggestthat the mechanism operating is DLA, but not inthe ideal sense of every encounter leading tosticking, but with a lower probability of aggrega-tion than that. This may explain why the fractaldimension determined from Fig. 8 is lower thanthe theoretical predictions, although a much moresubstantial number of measurements would needto be carried out to confirm this suggestion.

A.M. Donald et al. / Colloids and Surfaces A: Physicochem. Eng. Aspects 174 (2000) 37–5344
Fig. 9. Floc formed from ‘soft’ particles, i.e. those with arubber outer layer.
One caveat should be mentioned at this point.In the preceding paragraphs it has been impliedthat real time observations can be made as evapo-ration proceeds. This is of course true, but theobserver must always be aware of the possibilityof beam damage becoming a limiting factor.Beam damage is a ubiquitous problem for elec-tron microscopists working on organic and manyinorganic systems (but not in general metals). Ittranspires that in the ESEM the situation is ingeneral worse than for conventional SEM. This isfor two reasons. Firstly there is no conductivecoating required for the surface of an insulator, asdiscussed in the introduction. This means thatthere is no protective layer to dissipate some ofthe incoming electrons’ energy. Secondly, andprobably more importantly, the various processesthat occur when electrons interact with watermolecules, leads to the formation of free radicalsthrough the process known as radiolysis. Thesefree radicals can be very deleterious for organicmaterials. If the exposure is continued for suffi-ciently long, the damage is easily visible.
As an example, away from the field of purecolloids, Fig. 10 shows a sequence of imagesduring hydration of some substituted lyocellfibres. In the presence of water the fibres shouldswell, but this real effect may be obscured bybeam-induced damage that can look broadly simi-lar. In Fig. 10, by the end of 15 min exposure tobeam plus water, there is substantial bubbling andswelling of most of the fibres (viewed end on). Theeffect is most severe at the left hand side of thefigure where the way the electron beam dwells atthe start of each line in the raster leads to agreater dose there than elsewhere. Consequently,right at the edge of the figure it seems as if all theoriginally distinct fibres have fused together. Thiseffect appears to be general for cellulosic materi-als, and additional information can be found inrefs [18–20].
The problem is that whereas the gross effectsvisible in Fig. 10 are readily detected, beam dam-age need not necessarily be so visible. FTIR spec-troscopy has been used to quantify the extent ofdamage under different conditions, in this case forsamples of polypropylene, [21]. This demonstratedthat the presence of liquid water on the surface of
The ESEM used in this way therefore opens upthe possibility of a high resolution way of study-ing fractal structure evolution. Whereas the num-bers obtained here should be regarded only asindicative of what can be done, several points canbe noted. First, ESEM has the resolution, whichlight microscopy does not, to image individuallatex particles. Thus the details of the encounterswhich occur —does a particle-particle collisionlead to sticking or not? — can be directly ob-tained. Secondly, whereas previous work usingelectron microscopy to study fractal structures,Lin et al. [16], Brady and Ball [17] required dehy-dration prior to observation, and can only thenobserve what is likely to be a collapsed structure,ESEM permits the direct observation of the flocin its native state. What is observed is, however,clearly only the surface of a three-dimensionalstructure. Thus, unlike in many of the opticalstudies where a true 2 dimensional structure isformed by constraining the aggregation to occurat the air/water interface [12,13], there is no suchconstraint operational here although a three di-mensional mass/number of particles cannot beobtained from the images. From this summary itcan be seen how ESEM studies may contributefurther to studies of the fractal nature of colloidalaggregation.

A.M. Donald et al. / Colloids and Surfaces A: Physicochem. Eng. Aspects 174 (2000) 37–53 45
Fig. 10. Micrographs illustrating the visible changes to carboxymethyl-derivatised lyocell fibres in the ESEM under damagingconditions of the incident beam. The images show (a) undamaged fibres; (b) the start of bubbling; (c) continuing damage, with theeffects of the beam raster pause evident down the left hand side of the image; and (d) the fibres obscured 15 min after the initiationof damage in (b). Scale bar represents 50 mm.
a sample renders the damage worse than if there issimply water vapour present in the chamber. Thiseffect is presumed to be due to the ready mobilityof radicals through the water layer, increasing therate of polymer hydrolysis. This necessarily meansthat damage is likely to be an issue when imagingwet dispersions of PMMA latices, PMMA beingnotoriously susceptible to beam damage, and in-deed used as an electron resist in e-beam lithogra-phy. Whereas this does not mean that any givenimage is necessarily artefactual, it does mean thatcaution must be exercised when sitting with thebeam on any given area of a sample and watchinghow the structure evolves. Thus although onemay have confidence that a conclusion such asthat concerning the probability of sticking isvalid, it does not mean that a video taken of asingle floc is necessarily free of artefacts. It is forthis reason that we have refrained from making
firm statements concerning rearrangements of oneof the flocs comprising the soft particles; that isexactly the sort of situation where long termobservations would need to be made. Neverthe-less, as the work on damage to cellulose fibres hasshown elsewhere, as long as one knows how longone can safely image a sample without significantbeam damage occurring, then imaging over com-paratively long periods can be made, [20,22].
3. Structure and aggregation of vinyl latices
3.1. Experimental
Both standard vinyl latices (supplied by ICIPaints) and those with starch incorporated werestudied, to examine the effect of starch uponaggregation and coalescence. The starch was ei-

A.M. Donald et al. / Colloids and Surfaces A: Physicochem. Eng. Aspects 174 (2000) 37–5346
ther in the form of unmodified material, orderivatised potato starch. The effect of the addi-tion of surfactant was also explored. The laticeswere imaged after spin coating onto glass stubsoutside the ESEM, and carrying out a controlledpumpdown; images were also taken at increasingtimes thereafter up to 2 weeks, to follow theevolution of structure as the films dried. As in theabove case, care has to be taken to avoid beamdamage.
3.2. Results and discussion
Vinyl latices are very often used in paint formu-lations. As such it is desirable that the individualparticles rapidly aggregate and coalesce followed
by interdiffusion across the initial particleboundaries occur to yield a film with good me-chanical properties. The required stages in filmformation are described in detail elsewhere, [23].As formulation developments occur, it is crucialthat alterations do not impede these variousstages. Fig. 11 shows images taken during dryingfor a commercial vinyl latex to which 10% ofnative starch has been added during polymerisa-tion. Fig. 11(b) shows two key features. First theindividual particles have a very narrow size distri-bution compared with the standard commercialformulation (shown in Fig. 11(c and d)). How-ever, although this might seem like an attractiveadvantage the particles show no tendency to coa-lesce even after 2 weeks of drying. This means
Fig. 11. ESEM images of vinyl latex with 10% native potato starch (a) 10 min and (b) 2 weeks after deposition; ESEM images ofcommercial vinyl (c) 10 min and (d) 2 weeks after deposition.

A.M. Donald et al. / Colloids and Surfaces A: Physicochem. Eng. Aspects 174 (2000) 37–53 47
Fig. 12. ESEM images of vinyl latex with 10% modified potato starch (a) 10 min and (b) 3 weeks after deposition.
that the quality of the film is unacceptable. Ex-actly what role the native starch is playing cannotbe assessed from this information alone, but it isclear that it is radically affecting the surfaces ofthe particles. This altered surface chemistry willthen affect both the polydispersity and theinterdiffusion.
If on the other hand the starch is chemicallymodified, so that the original granular structure istotally lost before addition, the response of thelatex (the same base vinyl formulation) is ratherdifferent. Fig. 12 shows results for a latex formedwith 10% of modified potato starch (it should benoted that the species from which the starchcomes from also affects its behaviour). Althoughin this case both at early and late stages the filmsare fairly flat and particle deformation can be seeneven at early times, after 3 weeks there are numer-ous imperfections still present in the film, al-though some particle coalescence has occurred. Inthe dry films there are therefore small cracks atsome of the particle interfaces rendering the filmof an unacceptable quality. The particle polydis-persity is greater than in the case of the additionof unmodified starch.
As it is clearly some element of the surfacechemistry that is being affected by the presence ofthe starch, the effect of the addition of a surfac-tant was also explored. Fig. 13 shows the resultswhen surfactant is added to the sample containingthe modified potato starch. The particle polydis-persity is now even greater although the mean
particle size is significantly smaller, but the mainconsequence is the apparently very rapid coales-cence of the particles. After 1 h all particleboundaries have disappeared. However at muchlonger times a new effect is seen: regions of brightcontrast slowly begin to appear on the surface.This effect is attributed to the slow exudation ofexcess surfactant to the surface to form poolsupon it. This interpretation is confirmed by alter-ing the level of surfactant addition, which reducesthe amount of exudate which appears on thesurface.
Although this is an incomplete story, it high-lights the power of the ESEM for analysing thechanging structure of latex films as water evapo-ration occurs. Because water loss does not occurdue simply to the high vacuum conditions ofobservation, as in a conventional SEM, we canhave confidence that the changes that are ob-served during drying are real and not artefactual.The high resolution images means both that infor-mation about particle polydispersity and the de-gree of particle coalescence can readily beobtained. In terms of identifying whether stan-dard synthetic organic additives can be replacedby starch, it can be seen that good quality paintfilms can be obtained using such formulations.However, as one might expect, there is a complexinterplay of many factors largely revolvingaround the alteration in surface chemistry: thisaffects both particle polydispersity during poly-merisation, and ability to film form. Utilising the

A.M. Donald et al. / Colloids and Surfaces A: Physicochem. Eng. Aspects 174 (2000) 37–5348
Fig. 13. ESEM images of vinyl latex with 10% modified potato starch plus 10% surfactant (a) 10 min and (b) 1 h and (c) 1 weekafter deposition.
ESEM means that these factors can be unambigu-ously determined, rather than simply relying onparameters such as film formation temperature orgloss as a quality determinant.
4. Film formation in the presence of hardinclusions
Finally, let us consider the situation when hardparticles are also present. These might either beparticles of a higher glass transition temperaturethan the remainder, and hence unable to partici-pate in film formation, or an inorganic inclusionadded for a variety of reasons. In an example ofthe former situation, in which ESEM was used inconjunction with ellipsometry [24], it was found
that the presence of an increasing concentrationof non-film forming particles led to an increase inthe number of voids. This had the effect of in-creasing the total time taken for film formation.However the ability to image the particles directlyin the ESEM enabled a distinction to be madebetween the situation where a void was associatedwith only one individual hard particle, from thesituation in which a void is formed interstitiallybetween several. In the latter case void closurewas much harder. Consequently, when hard parti-cles are present it is important to ensure a uni-form distribution to minimise the risk of hardparticle clusters.
In this section we will consider what happenswhen silica particles are added to an acrylic latexas a matting agent. The silica particles may them-

A.M. Donald et al. / Colloids and Surfaces A: Physicochem. Eng. Aspects 174 (2000) 37–53 49
Fig. 14. Primary beam damage of a latex containing silica,imaged at 12 keV accelerating voltage. The sample was viewedat higher magnification and then the magnification reduced sothat the fingerprint of the original raster can clearly be seen.Because the beam dwells slightly longer at the start of eachline in the scan, the left-hand side of the raster is particularlybadly damaged.
ing an optimised pumpdown procedure, Cameronand Donald [5] to prevent premature dehydration.After the pumpdown, slow evaporation of thewater was allowed to occur whilst imaging pro-ceeded at a temperature typically of 8°C. Series ofdrying images were obtained by a gradual increaseof the sample temperature. Once silica particlescould be distinguished form the aqueous back-ground, images were recorded every few minutes.A continuous transformation from a uniform-aqueous latex to a dried film in which the silica isclearly distinct was observed. This system provedquite susceptible to beam damage, as shown inFig. 14. This figure shows a central rectanglewhich has been heavily irradiated at high magnifi-cation, and then the magnification reduced toexpose the affected area. It can be seen (as in Fig.10) that the damage is greatest at the left-handside of the raster, where the dwell time of thebeam at the start of each line in the raster isgreatest. To reduce beam damage to an acceptablelevel, the accelerating voltage was reduced to 8keV, and a short working distance used.
4.2. Results and discussion
Fig. 15 compares a drying sequence for ma-trices containing 2.5% fumed and precipitated sil-ica. Firstly it is clear that the silica particlesappear bright. This is not surprising since they areof higher atomic number than the matrix and, asin a conventional SEM, their backscattered emis-sion is therefore higher. At the magnificationsemployed, the individual primary particles cannotbe distinguished, although it is clear that theparticles do have internal sub-structures present;this is particularly apparent in Fig. 15(c), wheresome large particles with internal structure areevident. The rather uniform size distribution ofthe fumed silica is readily seen, whereas the parti-cles of the precipitated silica have irregular shapesand with some particles significantly larger than10 mm present. The uniform structure of thefumed silica aggregates is thought to be due to theway they agglomerate through hydrogen bonding.In contrast, the precipitated silica remains as sep-arate particles.
selves be agglomerates and porous and how effec-tive they are as matting agents will obviouslydepend both on how they interact with the film-forming matrix and how they distribute them-selves throughout the film.
4.1. Experimental
Two types of silica have been used. The firstwas a precipitated silica supplied by Crossfieldsand the second was a fumed silica obtained fromDegussa. In the case of the former, the primaryparticles are typically �50 nm in diameter. Theseaggregate to give a loose, porous structure with abroad distribution of particle sizes peaking ataround 7 mm. The fumed silica has even smallerprimary particles, �15 nm in average diameterand again these aggregate via weak hydrogenbonds to give aggregates with a typical size of 10mm.
These silica particles were dispersed in anaqueous acrylic latex of mean particle size �80nm; the disperson also contained a variety ofadditives to aid the film formation process. Theconcentration of silica particles was varied from0.5–5% by weight. Experiments were carried outboth during the drying process, and on the finaldried films. Drying was carried out in situ follow-

A.M. Donald et al. / Colloids and Surfaces A: Physicochem. Eng. Aspects 174 (2000) 37–5350
Fig. 15. Drying of films containing (a–c) precipitated and (d–f) fumed silica over 1 h: (a) t=0 s; (b) t=6 min; (c) t=59 min; (d)t=0 s; (e) t=8 min and (f) t=50 min.

A.M. Donald et al. / Colloids and Surfaces A: Physicochem. Eng. Aspects 174 (2000) 37–53 51
Thus at a simple level, the contrast in theimages of Fig. 15 can be understood. However,aside from the relative brightness of the silicaparticles there is a more subtle type of contrastvisible in these images. As drying proceeds thebackground gets systematically darker. This isseen for both series of images in Fig. 15. In orderto understand this we have to consider a little
more deeply the effect of water upon image for-mation. It was first noticed several years ago thata water layer surrounding a latex particle gave ananomalously high signal, which could not be ex-plained by either of the standard SEM contrastmechanisms, namely topographic contrast (whicharises primarily from the secondary electron sig-nal) and atomic number contrast coming from thehigher energy backscattered electrons [25]. Recentstudies on contrast in oil/water emulsions hasbegun to cast light on this contrast [26]. Imagingof oil-in-water emulsions showed that the waterphase looked bright, and this was maintainedwhen the emulsion was inverted to form a water-in-oil emulsion, again demonstrating that thebrightness was not a subtle topographic effect.Qualitatively the origin of the contrast can beattributed to the way in which the secondaryelectrons (which are by far the major constituentof the signal) lose energy as they travel throughdifferent materials.
Water can be considered as a wide band gapsemiconductor, in the sense that there is a signifi-cant range of electron energies over which noinelastic collisions can occur to cause loss ofenergy to the secondary electrons as they travelthrough the material. Certainly by comparisonwith oils-which tend to have a degree of unsatura-tion which introduces the possibility of p � p*transition energy levels occurring within the gap— there are fewer energy loss processes accessibleto the secondaries. Hence a greater number ofthem will have sufficient energy to overcome thesurface affinity and escape to be subsequentlydetected. It is for this reason that water looksbright compared with oils, or indeed a polymermatrix. For the images in Fig. 15, as the watercontent drops there will therefore be a systematicreduction in the electron signal escaping the sur-face and the sample will appear progressivelydarker during drying.
A second set of experiments was concernedwith looking at the morphology of the dried filmsas a function of silica content. Fig. 16 comparessamples with 1.25% of precipitated and fumedsilica. It appears that there is more silica in thesurface of the sample with the precipitated silicathan that with fumed. This can be made more
Fig. 16. A comparison of the surface of dried films containing1.25% (a) fumed and (b) precipitated silica.

A.M. Donald et al. / Colloids and Surfaces A: Physicochem. Eng. Aspects 174 (2000) 37–5352
Fig. 17. Image analysis as a function of silica content compar-ing fumed and precipitated silica.
titative approach permits a correlation betweentype of silica added (including its density) to thesurface content. Further studies on surface rough-ness at the micron level can then rationalise theperformance of different silicas.
However, it must be borne in mind that thistechnique can only reveal the top layer of a sample.Depth of field is good, as with conventional SEM,so that there is little difficulty associated withimaging a rough surface, but it is not possible tosee through a significant layer of water, [27,28].Thus, when wet colloidal dispersions are imagedthere is a problem if none of the particles aresufficiently close to the surface for imaging. It alsomeans that if the behaviour at the air/water inter-face is not typical of the bulk, this cannot bedetermined. For this reason it is highly desirable,whenever possible, to correlate information ob-tained from ESEM imaging with other techniques.In the case of the silica distribution discussed here,we are in the process of obtaining quantitative dataon the distribution of the silica throughout thedrying film via confocal microscopy, which permitsoptical sectioning through a thickness of up to�100 mm. The confocal microscope has the oppo-site problem from the ESEM; it is difficult to obtainan absolute position for the surface of a rough film,through which silica particles may be protruding,but imaging below the surface is straightforward.The two techniques can therefore be seen to behighly complementary, and work is ongoing tocorrelate surface and sub-surface packing of thesilicas.
5. Conclusions
This article has aimed to identify the manystrengths of ESEM for the field of colloidal disper-sions. Recognition of the fact that it is possible toimage a wet sample in its natural state withresolution comparable to conventional (high vac-uum) SEM, by dropping the temperature of thestage to slightly below ambient opens up a widerange of possibilities. Moreover, it is also possibleto change the state of the sample, to move itbetween hydrating and dehydrating conditions, bymodest changes in temperature or, less conve-
quantitative by carrying out image analysis onthese and similar images as a function of overallsilica content. The analysis was carried out byimposing a threshold grey level: pixels brighter thanthis threshold were presumed to be part of a silicaparticle, and all other pixels were treated as matrix.Because the particles contain internal morphology,this must be regarded as only a first approximation:for instance a convoluted shape may mean onlysome parts of the particle actually intersect thesurface and are detected as ‘silica’. The results ofthis analysis are shown in Fig. 17. It confirms thatat low silica concentrations the surface occupancyof the samples with precipitated silica is higher thanfor the samples with fumed silica. However athigher concentrations, of �2% silica and above,the fumed silica surface occupancy appears to reacha plateau value. Beyond this value for the bulkconcentration it seems that the surface structuredoes not change any further.
Clearly this technique offers new possibilities ofstudying in detail the way the silica is distributedat the surface of a drying film. And since it is thenature of the surface which imparts the mattingproperties to the film, this may provide additionalinsight into how to optimise the silica type andproperties. This brief example of the utilisation ofimage analysis also demonstrates how at leastsemi-quantitative information can be obtainedfrom such images of the surface. Such a semi-quan-

A.M. Donald et al. / Colloids and Surfaces A: Physicochem. Eng. Aspects 174 (2000) 37–53 53
niently, chamber pressure. Thus dynamic experi-ments can readily be carried out. As long as beamdamage is not an issue, it then becomes possible tofollow dynamic changes in the state of a sample,illustrated here by following aggregation of latexparticles. In other examples, outside the scope ofthis article, it is possible even to follow chemicalreactions induced by the presence of water, as in thehydration of cement and its components, [29–33],as well as physical changes as can occur during theswelling of cellulose fibres, [20,22].
The utilisation of ESEM in this field is still in itsinfancy. It is clear that this in part has been becauseof a lack of availability of this new generation ofinstruments, but it is also due to a failure by someto recognise the need to maintain careful controlover the state of hydration at all times via appro-priate combinations of pressure and sample temper-ature. It is to be hoped that now so many of thesefundamental issues have been clarified, we will seean explosion of activity in the field of colloids asthe instrument’s potential is more widely appreci-ated. It can be anticipated that new novel applica-tions will be developed as the community grows.
Acknowledgements
This work has been carried out under fundingfrom a variety of sources. The equipment waspurchased under grants from the Colloid Technol-ogy Programme jointly funded by the DTI,Unilever, ICI, Schlumberger and Zeneca, and theBBSRC with additional funds from Nestle, Schlum-berger and Dalgety (now du Pont). Part of the workdescribed here was funded by the funded by theEuropean Community (under the Industrial andMaterials Technology Programme (Brite-EuRamIII)-Contract No: BRPR-CT96-0203), EPSRC andCrosfields. Stimulating conversations with DrsJohn Melrose, Phil Taylor, Sue Horley, DerekAldcroft and Gemma Morea-Swift are acknowl-edged. Dr Lisa Jenkins is thanked for the provisionof Fig. 10.
References
[1] A.M. Donald, Curr Opin. Colloid Interface Sci. 3 (1998)
143–147.[2] G.D. Danilatos, Adv. Electron. Electron Phys. 71 (1988)
109–250.[3] A.L. Fletcher, B.L. Thiel, A.M. Donald, J. Phys. D 30
(1997) 2249–2257.[4] B. Thiel, I.C. Bache, A.L. Fletcher, P. Meredith, A.M.
Donald, J. Microsc. 187 (1997) 143–157.[5] R.E. Cameron, A.M. Donald, J. Microsc. 173 (1994)
227–237.[6] C. He, A.M. Donald, Langmuir 12 (1996) 6250–6256.[7] G.C. Jeffrey, R.H. Ottewill, Colloid Polym. Sci. 266 (1988)
173.[8] D.A. Weitz, Phys. Rev. Lett. 54 (1985) 1416.[9] T.A. Witten, L.M. Sander, Phys. Rev. B 28 (1986) 5686.
[10] T. Vicsek, Fractal Growth Phenomena, World ScientificPublishing, Singapore, 1989.
[11] P. Richetti, J. Prost, P. Burois, J. Phys. Lett. 45 (1984) 1137.[12] A.J. Hurd, D.W. Schaefer, Phys. Rev. Lett. 54 (1985)
1043–1046.[13] J. Stankiewicz, M.A.C. Vilchez, R.H. Alvarez, Phys. Rev.
E 47 (1993) 2663–2668.[14] A. Fernandez-Barbero, M. Caberizo-Vilchez, R. Martinez-
Garcia, R. Hidalgo-Alvarez, Phys. Rev. E 53 (1996) 4981–4989.
[15] S.S. Narine, A.G. Marangoni, Phys. Rev. E 59 (1999)1908–1920.
[16] M.Y. Lin, H.M. Lindsay, D.A. Weitz, R.C. Ball, R. Klein,P. Meakin, Nature 339 (1989) 360–362.
[17] R.M. Brady, R.C. Ball, Nature 309 (1984) 225–229.[18] J.G. Sheehan, L.E. Scriven, in: TAPPI/Coating Confer-
ence, 1991; pp. 337–383.[19] P. Forsberg, P. Lepoutre, Scanning Microsc. 8 (1994)
31–34.[20] L. Jenkins, A.M. Donald, Scanning 19 (1997) 92–97.[21] S. Kitching, A.M. Donald, J. Microsc. 190 (1998) 357–365.[22] L.M. Jenkins, A.M. Donald, Text Res. J., in press (1999).[23] J.L. Keddie, Mater. Sci. Eng. R21 (1997) 101–170.[24] J. Keddie, P. Meredith, R. Jones, A. Donald, Langmuir 12
(1996) 3793–3801.[25] P. Meredith, A.M. Donald, J. Microsc. 181 (1996) 23–35.[26] D.J. Stokes, B.L. Thiel, A.M. Donald, Langmuir 14 (1998)
4402–4408.[27] J. Shah, R. Durkin, in: Inst. Phys. Conf. Ser., EMAG 91
Bristol, 1991, pp. 161–164.[28] I.C. Bache, PhD Thesis, University of Cambridge, 1999.[29] K.O. Kjellsen, H.M. Jennings, Adv. Cem. Bas. Mat. 3
(1996) 14–19.[30] K. Sujata, H.M. Jennings, J. Am. Ceram. Soc. 75 (1992)
1669–1673.[31] D.A. Lange, K. Sujata, H.M. Jennings, Ultramicroscopy
37 (1991) 234–238.[32] P. Meredith, A.M. Donald, K. Luke, J. Mater. Sci. 39
(1995) 1921–1930.[33] C. Hall, W.D. Hoff, S.C. Taylor, M.A. Wilson, B.-G.
Yoon, H.W.-K. Reinhardt, M. Sororo, P. Meredith, A.M.Donald, J. Mater. Sci. Lett. 14 (1995) 1178–1181.