applications of bipolar electrochemistry for
TRANSCRIPT

Applications of Bipolar Electrochemistry for Characterization of Electrocatalysts and the
Development of Biosensors
by
Buhua Wang
A dissertation submitted to the Graduate Faculty of
Auburn University
in partial fulfillment of the
requirements for the Degree of
Doctor of Philosophy
Auburn, Alabama
August 8, 2020
Keywords: glucose biosensor, bipolar electrochemistry,
cathodic chemiluminescence
Copyright 2020 by Buhua Wang
Approved by
Curtis Shannon, Chair, Professor of Chemistry & Biochemistry
Christopher J. Easley, C. Harry Knowles Professor of Chemistry & Biochemistry
Wei Zhan, Associate Professor of Chemistry & Biochemistry
Byron H. Farnum, Assistant Professor of Chemistry & Biochemistry

ii
Abstract
Bipolar electrochemistry, which is an untraditional technique where redox reaction happens
on the surface of a conducting object (BPE) that immersed in an electrolyte solution wirelessly
connected with an external power source, has attracted great interest over last decades and used in
a variety of fields. This dissertation work, which used bipolar electrochemistry as a basic platform,
focuses on electrodeposition of bimetallic materials and its electrocatalysis on molecules,
refinements of BPE setup on electrochemical cell, and biosensing.
Chapter 1 presents a detailed literature review on the background and operational principle
of bipolar electrochemistry and ECL (electrochemiluminescence), and its applications on the fields
of materials science and dynamic systems, sensing and screening, also, the current stage of
research is detailly discussed. Moreover, a brief introduction on diabetes, especially on glucose
detection based on bipolar electrochemistry platform.
Chapter 2 describes an experimental approach for adapting the principles of Raman Spectro-
electrochemistry to electrodes controlled using a bipolar circuit, which allows the simultaneous
acquisition of spectroscopic data as a function of both the electrode potential and the chemical
composition of a bimetallic alloy and can be generalized to other system variables. The
electrochemical reduction of 4-nitrothiophenol (4-NTP) was carried out on bimetallic Ag/Au alloy
gradients and monitored in situ using a confocal Raman microscope with 785 nm excitation.
Chapter 3 illustrates the potential profiles from open cell frame, closed cell frame, and channel
cell frame. And four models from channel cell frames were offered to describe and explain the
channel potential based on the variables of normalized channel length and width. Most
importantly, this work may give some guideline to some researchers to the determination of what

iii
kind of cell frames to choose, what kind of details to be aware of for different cell frames, and
what is the optimal cell frame design for the BPE system.
Chapter 4 reports a new glucose biosensor platform based on cathodic ECL in a closed BPE
system. In this C-ECL-C-BPE (cathodic ECL in a close BPE cell) glucose biosensor, 𝑅𝑢(𝑏𝑝𝑦)32+
(tris(2,2’-bipyridyl) ruthenium) used as luminophore and K2S2O8 used as co-reagent to generate
the cathodic ECL signal; two GCEs (glassy carbon electrodes), one acts as BPE cathode and the
other acts as driving anode, used in the reporting cell; and a commercial test strip that already
modified GOx (glucose oxidase) and mediator used in the sensing cell. Under a certain applied DC
voltage, a higher current would produce when glucose concentration varied from low to high,
which need reduce more 𝑅𝑢(𝑏𝑝𝑦)32+
and persulfate to compensate for it and result in a more
incensed ECL signal, using this mechanism, glucose detection could be achieved. Moreover, a
comparison between proposed C-ECL-C-BPE glucose biosensor and commercial blood glucose
meter was performed for determination of glucose in human serum samples.
Chapter 5 summarizes the research contribution of this dissertation, and a briefly statement
of recommended future work of these projects.

iv
Acknowledgments
Pursuing a Ph.D. has been a challenging and rewarding experience in my life. By no means
could I be able to achieve it without the help of countless people over the past years.
Firstly, I would like to express my sincere thanks to my advisor, Dr. Curtis Shannon for being
such a great mentor, for his invaluable assistance, guidance, and encouragement throughout my
PhD studies at Auburn. Dr. Shannon, your intelligence, enthusiasm, has a broad knowledge and
rich experience on electrochemistry and surface science, set an example I hope to match someday.
Also, deepest thanks for you allow me freely to test my ideas on research and pursuit my goals.
Next, I would like to offer my sincere gratitude for the incredible contributions from my
committee members, Dr. Christopher Easley, Dr. Wei Zhan, Dr. Byron Farnum. Thank you for
your generous guidance, suggestions, and kindly supports. Dr. Easley has always been amicable
and put me at ease every time talking with him and give me some pertinent suggestions on my
research. Dr. Zhan is honest and kind, gave me some useful and practical advice for doing a better
presentation. Dr. Farnum is pleasant and obliging, helped me out to serve as my committee
member, for that I really appreciated it.
Thanks also goes to Dr. Tae-Sik Oh from chemical engineering department for being my
university reader, who is such a kind and descent man!
Also, a special thanks go to Dr. Masoud Mehrgardi from the University of Isfahan giving me
some useful guidance on my research during his visiting time.
Thanks to my previous and current lab mates, Dr. Sanjun Fan, Dr. Songyan yu, Li Zhang,
Apu Mazumder, Md Akteruzzaman, Waliul Khan and Humaira Yeasmin. Thank you for the fun
and support. Good luck to all of you!

v
Thanks to students from Dr. Easley’s group, especially Dr. Mark Holtan for his continuous
assistance in 3D printing, photolithography, and electronics. Thanks to Dr. Xiangpeng Li
encouragement during my hard time on research. Thanks to Dr. Subramanian Somasundaram for
many patient and extensive discussions. Thanks also go to Nan Shi, Dr. Jean Negou, Dr. Juan Hu,
Dr. Katarena Ford, and Gebriel Hagos.
I would like to give a special thanks to Peter Traverso for being such a great roommate and
friend. I would also like thanks to my other friends, Dr. Chunkun Jiao, Dr. Mingming Wang, Dr.
Chao Li, Qi Cui, Dr. Ye Li, Dr. Zening Liu, Sicheng Li, Jinyan Cui, Dr. Shamin Iqbal and Hui Jin.
Last but not the least, my deepest and greatest thanks go to my parents and other family
members for their endless support, encouragement, and love.

vi
Table of Contents
Abstract .......................................................................................................................................... ii
Acknowledgments ........................................................................................................................ iv
Table of Contents ......................................................................................................................... vi
Lists of Figures ............................................................................................................................. ix
Lists of Tables ............................................................................................................................. xiii
Chapter 1 ....................................................................................................................................... 1
Introduction ................................................................................................................................... 1
1.1 Bipolar electrochemistry .................................................................................................... 1
1.1.1 Background of Bipolar electrochemistry ....................................................................... 1
1.1.2 Principles of Bipolar electrochemistry........................................................................... 1
1.1.3 Open BPE system and Closed BPE system ................................................................... 3
1.2 ECL (Electrochemiluminescence) ..................................................................................... 5
1.2.1 Fundamentals of ECL .................................................................................................... 5
1.2.2 General Reaction Mechanisms ...................................................................................... 6
1.2.3 ECL Luminophores and Co-reagents............................................................................. 9
1.3 Applications of Bipolar electrochemistry ....................................................................... 12
1.3.1 Bipolar Electrochemistry in Analytical Sensing .......................................................... 12
1.3.2 Bipolar Electrochemistry in Materials Science............................................................ 16
1.3.3 Other Fields .................................................................................................................. 19
References ................................................................................................................................ 21
Chapter 2 ..................................................................................................................................... 41
Reduction of 4-nitrothiophenol on Ag/Au Bimetallic Alloy Surfaces Studied Using Bipolar
Raman Spectroelectrochemistry................................................................................................ 41
2.1 Introduction ....................................................................................................................... 41
2.2 Experimental Section ........................................................................................................ 44
2.2.1 Materials and Reagents ................................................................................................ 44
2.2.2 Preparation of Bipolar Electrochemical Cell Frames .................................................. 44
2.2.3 Self-made tiny Ag/AgCl Reference Electrodes for Solution Potential Measurement . 45
2.2.4 Setup of Solution Potential Measurement.................................................................... 46
2.2.5 Electrodeposition of Ag/Au on Stainless Steel Substrate Using Bipolar System ........ 46
2.2.6 SEM-EDX Measurement ............................................................................................. 47

vii
2.2.7 Setup of Bipolar Cell for Raman Spectroscopy ........................................................... 47
2.3 Results and Discussion ...................................................................................................... 48
2.3.1 Electrodeposition of Ag/Au Alloy on Stainless Steel BPE Substrate .......................... 48
2.3.2 Solution Potential Profile in Bipolar Cell System ....................................................... 52
2.3.3 Characterization of the Reduction of NTP Monolayer on Bimetallic Ag/Au Alloy
Using BRSE .......................................................................................................................... 54
2.4 Conclusions ........................................................................................................................ 66
References ................................................................................................................................ 67
Chapter 3 ..................................................................................................................................... 72
Control of the Potential Profile of Bipolar Electrodes Using Cell Frames ............................ 72
3.1 Introduction ....................................................................................................................... 72
3.2 Experimental section ........................................................................................................ 74
3.2.1 Materials and Reagents ................................................................................................ 74
3.2.2 Apparatus ..................................................................................................................... 75
3.2.3 Preparation of Bipolar Electrochemical Cell Frames .................................................. 75
3.2.4 Prepared Self-made tiny Ag/AgCl Reference Electrodes for Solution Potential
Measurement ......................................................................................................................... 76
3.2.5 Gold BPE cleanness ..................................................................................................... 76
3.2.6 ECL measurement ........................................................................................................ 76
3.3 Results and Discussion ...................................................................................................... 77
3.3.1 Self-made Ag/AgCl reference electrodes .................................................................... 77
3.3.2 Closed cell frames versus open cell frames ................................................................. 78
3.3.3 Effect of Measuring tip depth and Concentration of electrolyte .................................. 81
3.3.4 Study of Potential Profile using Channel Cell Frames ................................................ 82
3.3.5 Model the Potential of Channel Cell Frames ............................................................... 88
3.3.6 ECL Comparison using Closed Cell Frame and Channel Cell Frame ......................... 94
3.3.7 Multiple BPEs Cell Frames Design ............................................................................. 96
3.4 Conclusions ........................................................................................................................ 98
References .............................................................................................................................. 100
Chapter 4 ................................................................................................................................... 102
Cathodic Electrochemiluminescence Glucose Biosensor Using Closed Bipolar Electrode
System ........................................................................................................................................ 102
4.1 Introduction ..................................................................................................................... 102
4.2 Experimental section ...................................................................................................... 107
4.2.1 Chemicals and Reagents ............................................................................................ 107

viii
4.2.2 Apparatus ................................................................................................................... 108
4.2.3 Modification of glassy carbon electrodes (GCEs) with GOx .................................... 108
4.2.4 Preparation of C-ECL-C-BPE glucose biosensor and data acquisition ..................... 109
4.3 Results and discussion .................................................................................................... 109
4.3.1 Effect of Acetonitrile for Cathodic ECL .................................................................... 109
4.3.2 Oxygen Effect for Cathodic ECL .............................................................................. 112
4.3.3 Electrochemical study of modified GCEs .................................................................. 115
4.3.4 Electrochemical study of commercial blood glucose test strips ................................ 118
4.3.5 Performance of the Proposed Cathodic ECL Glucose biosensor in Closed BPE System
............................................................................................................................................. 121
4.3.6 Glucose Detection of Human Serum ......................................................................... 127
4.4 Conclusions ...................................................................................................................... 131
References .............................................................................................................................. 132
Chapter 5 ................................................................................................................................... 139
Conclusions and Future Directions ......................................................................................... 139
5.1 Reduction of 4-NTP on Ag/Au Bimetallic Alloy Surfaces using Bipolar Raman
Spectroelectrochemistry ....................................................................................................... 139
5.2 Potential Profile of BPE using Different Cell Frames Design..................................... 140
5.3 Cathodic ECL Glucose Biosensor using Closed BPE System ..................................... 141

ix
Lists of Figures
Figure 1.1 Basic Bipolar device and illustration of potential profile and redox reaction of the
bipolar electrode in open configuration15, adapted with permission from Copyright © 2013
WILEY‐VCH Verlag GmbH & Co. KGaA, Weinheim. ................................................................ 3 Figure 1.2 Two kinds of bipolar electrochemistry systems: (A) an open configuration and (B) a
closed configuration. ....................................................................................................................... 4
Figure 1.3 ECL mechanism of luminol with hydrogen peroxide.57 Adapted with permission
from Copyright © 2007, Springer Nature. ...................................................................................... 9 Figure 1.4 (A) Synthetic route for Ru(bpy)3
2+-labeled antibody and Ru(bpy)32+-labeled
oligonucleotide probes; (B) Schematic of the sandwich immunoassay and nucleic acid assays
(the antibody or nucleic acid probes are labeled with biotin and Ru(bpy)32+).73 Adapted with
permission from Copyright © 2014, Springer Nature. ................................................................. 11 Figure 1.5 Schematic representation of intracellular c-Myc mRNA detection using BPE- ECL
biosensor.118 Adapted permission from Copyright © 2012, American Chemical Society. .......... 15 Figure 1.6 Ag/Au alloy electrodeposition model. ........................................................................ 17
Figure 2.1 Bipolar Raman spectroelectrochemistry. Spectral data can be acquired along the
potential gradient and the spatial dimension normal to it. In this study, the alloy composition
varies along the second dimension. .............................................................................................. 42
Figure 2.2 Bipolar electrochemical cell frames. (A) cell frame used for electrodeposition; (B)
cell frame used for Raman characterizing. ................................................................................... 45
Figure 2.3 (A) Electrodeposition Bipolar shape and dimension sizes, the red part covered with
parafilm, (B) the cut new BPE with alloy side dipped in NTP solution to form self-assembled
monolayer, (C) Raman scanning sequence of BPE cartoon. ........................................................ 46
Figure 2.4 Linear Sweep Voltammogram scanned in 10 mM KAu(CN)2 and 10mM KAg(CN)2
with 200mM KCN supporting electrolyte solution, pH=12. Ag/AgCl electrode as reference
electrode, Pt grid as counter electrode, stainless-steel as working electrode, scan rate: 100mV/s.
....................................................................................................................................................... 49
Figure 2.5 Cyclic voltammogram of co-deposition solution (A), scan rate 50 mV/s. SEM image
of the Ag/Au alloy (B), bar size: 1 μm. The alloy gradient composition obtained from EDX
measurements along the major and minor axes of the BPE cathode (C, D). Error bars indicate the
standard deviation of three independent measurements. .............................................................. 50 Figure 2.6 (A) Solution potential difference ∆Ebpe between the end of cathode and the end of
anode of BPE length at the left edge, middle and right edge in the Raman Bipolar cell (6 V
applied voltage on Au driving electrode, and the length of BPE is 26mm). (B) Potential
difference ∆Ebpe as a function of time in the middle major axis line (6 V applied voltage on Au
driving electrode, and the length of BPE is 30mm). ..................................................................... 53
Figure 2.7 (A) Schematic NTP reduction mechanisms of (1) direct reduction to 4-
aminothiophenol (ATP) and (2) through an intermediate 4,4’-dimercaptoazobenzene (DMAB) to
ATP. (B) CVs of NTP monolayer on three different substrates: Au, Ag and Ag/Au alloy on
stainless-steel, respectively, in 0.1M NaClO4 solution bubbled with nitrogen, scan rate: 5 mV/s.
(C) Raman spectrum of NTP at equilibrium states on Ag/Au alloy. ............................................ 56 Figure 2.8 Raman spectra (A) acquired at -625 mV at the indicated alloy compositions.
Normalized Raman peak intensity profiles for R (B), I1335/I1080 (C), and I1434/I1080 (D)............... 58 Figure 2.9 (A) and (B) are normalized Raman peak intensities of I1335/I1080, (I1594-
I1572)/(I1594+I1572) as a function of distance from the BPE cathodic edge measured on Au and Ag

x
substrate under 6V applied voltage on the driving electrodes, respectively; (C) and (D) are
voltammograms of NTP reduction on different substrates as Ag/AgCl reference electrode in 0.1
M NaClO4 solution under nitrogen atmosphere with a scan rate of 5 mV/s, Pt grid as counter
electrode. ....................................................................................................................................... 59 Figure 2.10 Solution potential as a function of measuring distance in 0.1M NaClO4 using the
Raman cell frame under 6V applied voltage................................................................................. 60 Figure 2.11 Normalized Raman peak intensity profiles on pure Au: I1335/I1080 (A); R (C). Raman
spectra (B) acquired along the red-dashed line in (A). ................................................................. 62 Figure 2.12 Normalized Raman peak intensity profiles on pure Ag: I1335/I1080 (A); (I1594-
I1572)/(I1594+I1572) (C); and I1434/I1080 (D). Raman spectra (B) acquired along the red-dashed line in
(A). ................................................................................................................................................ 63 Figure 3.1 Electric field strength illustrated in three cell frames, (A) open cell frame, (B) closed
cell frame and (C) channel cell frame. .......................................................................................... 74
Figure 3.2 (A), (B) and (C) are open cell frame, closed cell frame and channel cell frame,
respectively. .................................................................................................................................. 75
Figure 3.3 (A) is a picture of Self-made reference electrode. (B) Cyclic Voltammograms of two
self-made Ag/AgCl reference electrodes, Pt electrode as counter electrode, Au electrode as
working electrode, scan in 2 mM Potassium Ferricyanide (III) solution from 0.5 volt to (-0.1)
volt with 0.5 M KNO3 as supporting electrolyte, scan rate: 50 mv/s (Red and blue CV scanned
using two self-made electrodes).................................................................................................... 77 Figure 3.4 (A) Solution potential measurement scheme; (B) solution potential profile of closed
cell frames vs open cell frames; (C) solution potential profile of closed cell frames vs open cell
frames at different applied voltage under 30 mm measuring distance. ........................................ 79 Figure 3.5 (A) Solution potential as a function of measuring distance under different applied
voltage using closed cell frames; (B) dropped potential at different applied voltage in the closed
cell frame;(D) potential profile in different closed cell frame width under different applied
voltage measured at 30mm distance using (C) cell frame design. ................................................ 80 Figure 3.6 (A) Potential profile of different measuring tip depth under different applied voltage
at a fixed measuring distance; (B) potential profile of different concentrated electrolyte under
different applied voltage at same measuring distance. ................................................................. 82
Figure 3.7 (D) Channel potential as function of channel position under different applied voltage
by using (A), (B) and (C) cell frames, channel with 30mm length × 2mm width. ....................... 83 Figure 3.8 (B) Potential profile along the red line using (A) cell frame under 7V applied voltage,
channel with 30mm length × 2mm width; (C) Scheme of BPE (green color) placed in three
different channel cell frames, BPE length is larger, equal, and smaller than that of the channel,
respectively; (D) BPE (5mm) potential as a function of channel width with different channel
length (5mm, 15mm, 30mm and 40mm, respectively) under 7V applied voltage (CL x/y meaning
potential across x mm channel divided by y)................................................................................ 84
Figure 3.9 (A) Potential profile across the channel as function of normalized channel width
under different channel length with 7V applied voltage; (B) Potential profile across the channel
as function of normalized channel length under different channel width with 7V applied voltage;
(C) Measured potential profile across the channel (top view) as function of normalized channel
width and length with 7V applied voltage. ................................................................................... 86
Figure 3.10 (A) Potential profile (across 30mm channel length, measured close to channel edges
and located the middle of channel) as a function of channel width under different applied

xi
voltage; (B) Potential profile measured at different position across the channel of 32mm channel
width under 7V applied potential. ................................................................................................. 87
Figure 3.11 (C) Channel potential profile as a function of normalized channel length using (A),
(B) types of cell frames, and four calculation methods, channel width 2mm with 7V applied
voltage; (D) Simple scheme used for describing potential modeling calculation of ellipse. ........ 93 Figure 3.12 (A) ECL intensity at different applied voltage by using closed cell frame (B) and
channel cell frame (C), 2mm channel width and 30 mm length, Au foil BPE with a length of
30mm; (B) and (C) is closed cell frame and channel cell frame under 4V applied voltage,
respective, and (D) and (E) is the corresponding surface plot of gray value (or ECL intensity)
crossing the anodic driving electrode. .......................................................................................... 95 Figure 3.13 (C) Potential profile as a function of applied voltage using cell frame (A) (three
channels 2mm width × 6mm length, two rectangular reservoirs both with a 6mm length) and (B)
(channel 2mm width × 30mm length); (C-30)/5 defines potential of channel (B) divided by 5;
Small C-6 defines potential across center channel from cell frame (A) (red and blue dots); Small
R-6 defines potential across small rectangular reservoir from (A) (black and red dots). ............. 97
Figure 3.14 (C) Potential measured at different channel position under different applied voltage
by using cell frame (A) (channel evenly separated) and (B), all the channels 2mm width × 30mm
length, A-L(M/R) defines left (middle/right) channel from cell frame (A), C-L(M/R) defines left
(middle/right) channel from cell frame (B). ................................................................................. 98
Figure 4.1 Cathodic ECL Glucose biosensor Mechanism in Closed BPE system. ................... 105 Figure 4.2 (A)-(F) experimental setup: three GCEs binding together dipping in ECL solution
(0.5mM Ru(bpy)32 +, 10mM K2S2O8), one connected positive DC power supply, one
connected the negative and the last one connected nothing as comparison for the other two
electrodes. (A) and (B) are the camera screenshot of experimental setup before and after
measurement; (C)-(E) collected after experiment begins 10 sec, 60 sec and 120 sec under 3.3V
applied DC voltage, respectively, in ECL solution contains 35% acetonitrile, while (F) collected
under same condition but with ECL solution without acetonitrile; (G) collected using cyclic
voltammetry scanned from (-0.5)V to (-1.5)V, (-1.6)V and (-1.7)V, respectively, ECL solution
used contains 35% acetonitrile for the first two measurements (yellow area) while the last one
does not contain it (pink area), scan rate is 50mV/s, GCE as working electrode, Ag wire as quasi-
reference electrode, Pt grid as counter electrode. ....................................................................... 111 Figure 4.3 (A)-(C) collected using chronoamperometry at different potential for 10 sec in ECL
solution (0.25mM Ru(bpy)32 +, 0.5mM K2S2O8 in 0.1M PBS buffer contains 35% acetonitrile,
pH=8) with/without bubbling N2, GCE as working electrode, Ag wire as quasi-reference
electrode, Pt grid as counter electrode. (D) collected C-ECL-C-BPE glucose biosensor used
commercial glucose blood test strip measured 12 mM glucose with ECL solution
(62.5uM Ru(bpy)32 +, 0.125mM K2S2O8) with/without bubbling N2 in the reporting cell under
3.6V applied DC voltage with 5 sec for each measurement. ...................................................... 113
Figure 4.4 Cyclic voltammograms of GCE, (A) scanned in 0.1M PBS buffer (contains 35%
acetonitrile) bubbled N2 and 1mM K2S2O8 in 0.1M PBS buffer (contains 35% acetonitrile)
bubbled N2; (B) scanned in ECL solution (0.5mM Ru(bpy)32 +, 1mM K2S2O8) with/without
bubbling N2. Scan rate is 30mV/s, Ag wire as quasi-reference electrode, Pt grid as counter
electrode. ..................................................................................................................................... 114 Figure 4.5 (A) Cyclic voltammograms of modified GCEs/GOx/GA/Nafion electrode scanned in
different concentrated glucose solution contains 1mM hydroquinone, Ag/AgCl as reference
electrode, and Pt grid as counter electrode, scan rate 20 mV/s; (B) the calibration curves of cyclic

xii
voltammograms from GCEs/GOx/GA/Nafion electrode, each color curve represent from one
individual modified GCEs/GOx/GA/Nafion electrode measurement;(C) same as (B) except the
electrode modified with GCEs/GOx/GA/MWCNTs/Nafion. ..................................................... 116 Figure 4.6 (A) ECL intensity curves from C-ECL-C-BPE method using GCEs/GOx/GA/Nafion
electrode as BPE anode as the applied voltage employed from 4500mV to 5580mV; (B) Initiated
ECL voltage from two sets of ECL intensity curves employed C-ECL-C-BPE method using
GCEs/GOx/GA/Nafion electrode as BPE anode. ........................................................................ 117
Figure 4.7 (A) Commercial contour next EZ blood glucose meter; (B) and (C) are un-used
glucose test strip and used one, respectively; (D) is inside structure of un-used test strips, and (E)
is the used one. Note that the white line on the test strip is insulating. ...................................... 119 Figure 4.8 (A) ECL signal calibration curve as a function of glucose concentration, L1 is BPE
anode, and L2 as driving cathode, ECL solution (62.5uM Ru(bpy)32 +, 0.125mM K2S2O8),
applied voltage 4800mV; (B) is ECL intensity spectra corresponding to (A); (C) is ECL intensity
spectrum scanned in serum sample. ............................................................................................ 120
Figure 4.9 (A) collected four individual cathodic ECL intensity measurement of 5mM and 12
mM glucose in closed BPE system, commercial glucose blood test strip used to measure in the
sensing cell and two GCEs in the reporting cell with Q =(62.5uM Ru(bpy)32 +, 0.125mM
K2S2O8) ECL solution; (B) is the ECL intensity (V) calibration curve of glucose measurement
using C-ECL-C-BPE glucose biosensor method with Q concentrated ECL solution as function of
concentration; red line is the logistic fit of the data, blue line in the yellow area is the linear
fitting of the data; (C) is the ECL intensity signals corresponding to calibration curve of (B); (D)
is the calibration curves of ECL intensity at different concentration as function of glucose
concentration using C-ECL-C-BPE glucose biosensor method. All the measurements obtained
under 3.6V applied DC voltage and 5 sec except for 4Q curve achieved under 3635mV, each
data point measured at least three times. .................................................................................... 122
Figure 4.10 (A) and (C) are ECL Signal intensity curves as function of measuring glucose
concentration using different concentrated ECL solution, each data point measured at least three
times; (B) and (D) are the ECL signal responses at different glucose concentration corresponding
(A) and (C), respectively. Two GCEs used in the sensing cell under 4.6V applied voltage and 5
sec for each measurement. .......................................................................................................... 124 Figure 4.11 (A), (B) and (C) are ECL signal intensity (V) responses at different glucose
concentrations using C-ECL-C-BPE glucose biosensor method with 0.5Q, 2Q and 4Q
concentrated ECL solution, respectively. ................................................................................... 127 Figure 4.12 Comparison of methods for determining glucose concentrations in human serum
samples. Black data measured using proposed C-ECL-C-BPE method; blue data is the correction
of black data; red data measured using commercial Contour NEXT EZ blood Glucose Meter.
Each data point measured at least three times. ........................................................................... 130

xiii
Lists of Tables
Table 1 Information of Human Serum Samples. ........................................................................ 129 Table 2 Comparison between C-ECL-C-BPE method with Contour NEXT EZ Blood Glucose
Meter for glucose measurement. ................................................................................................. 130

1
Chapter 1
Introduction
1.1 Bipolar electrochemistry
1.1.1 Background of Bipolar electrochemistry
Bipolar electrochemistry, an untraditional technique generates asymmetric reactions on the
surfaces of two poles of conductive objects (BPEs) in a wireless manner,1-2 has attracted great
attention recently and widely used in a variety of fields including wastewater treatment,3 energy,4
material catalysis,5 cation enrichment,6 analytical sensors,7 screening/grafting,8-9 etc.
1.1.2 Principles of Bipolar electrochemistry
Bipolar Electrode (BPE), which is a conductor immersed in an ionic solution without direct
connection to the external power source. When the electric field generated by the potential applied
by the two driving electrodes large enough to cause faradaic reaction, oxidation and reduction
would happen simultaneously on each pole of the BPE.10 Compared to conventional
electrochemistry, which based on a three electrode system composed of working, counter (or
auxiliary), and reference electrodes, and the working electrode directly connected to a power
source that allows a potential difference to be applied between the working electrode and counter
electrode, the BPE polarized with respect to solution and as a result redox reactions occur at the
electrode/solution interface of two poles of BPE simultaneously.11
A simple design of bipolar electrochemistry experiment can be easily achieved by immersing
a conductive object (BPE) into electrolyte solution, with sufficient voltage applied on the two
driving electrodes, as illustrated in Figure 1.1, which is typical cartoon configuration used for
bipolar electrochemistry, the driving electrodes apply a uniform electric field across the electrolyte

2
solution, and the resulting faradaic electrochemical reactions at the BPE are shown, occurring
oxidation at the anodic (blue arrow) pole and reduction at the cathodic (red arrow) pole of the BPE.
Since the interfacial potential between the solution and BPE is highest at the ends part, the faradaic
processes are always start there first. Specifically, the applied voltage to the driving electrodes
results in an electric filed that causes the BPE floating to an equilibrium potential depends on its
position in the field and composition of electrolyte solution,12 due to the electric field in solution,
the interfacial potential between the BPE and solution varies with its length, and the corresponding
anodic and cathodic overpotential, ηan and ηcat , respectively, which drives the redox reaction
happens at the two poles of BPE, and the position of zero overpotential on the BPE with respect
to the solution, which defines as x0, depends on the nature of faradaic processes occurring at the
poles of BPE.13 And the potential across the BPE (∆EBPE) could be roughly estimated from the
equation (1.1):14-15
∆EBPE = Etot (lBPE
l0) (1.1)
where Etot is the voltage applied on the driving electrodes, lBPE is the length of BPE, l0 is the
distance between two driving electrodes. Note that equation (1.1) does not account for any
potential loss at the interface between driving electrode and solution. The fractional loss of Etot
within electrochemical double layer can be significant under some conditions. In that case,
equation (1.1) would not be appropriate to use.15 For instance, electrolytic solution contains a very
high concentrated supporting electrolyte, a voltage applied to the driving electrodes generates a
electrochemical double layer upon accumulating ions at the interfaces between electrode and
solution, a significant steep electric field would generate within the range of double layers
(normally a couple of nanometers thickness), which means a large potential loss at the driving
electrode surfaces from applied voltage, thus, less voltage would contribute the formation of

3
electric field across the solution between two driving electrodes.16 Thus the nature of electric field
formed in the solution between two driving electrodes depends on driving electrode materials,
bipolar cell frames geometry and conductivity of electrolyte solution, more information refers to
chapter 3.
The principle of two-dimensional (2D) bipolar electrochemistry was also reported based on
the use of a 2D BPE surface addressed with two sets of feeder electrode arrays, which allows
electrochemical reactions can be localized at particular locations on the perimeter of a two-
dimensional BPE that configured at the inter-section of two orthogonal microfluidic channels.17
Figure 1.1 Basic Bipolar device and illustration of potential profile and redox reaction of the
bipolar electrode in open configuration15, adapted with permission from Copyright © 2013
WILEY‐VCH Verlag GmbH & Co. KGaA, Weinheim.
1.1.3 Open BPE system and Closed BPE system
According to the differences of configuration, bipolar electrochemistry systems could be
divided into two categories, open BPE system and closed BPE system, as illustrated in Figure 1.2.
And the potential across the BPE (∆EBPE) mentioned above is based on the open BPE system. One

4
of the most important differences and advantages of open BPE system is the potential gradient in
the solution between two driving electrodes. For example, the modification of an electrode surface
with a molecular gradient has been reported via the bipolar reduction of aryl diazonium salts to
analyze the in-plane molecular distribution;18 A 3D gradient polymer brush generated by a
concentration gradient of eATRP that formed due to the potential gradient of BPE
electrochemistry.19 In terms of closed BPE system, multiple advantages exhibits as below:
1) Compared with open BPE system, the closed BPE system is comprised of two cells, one
is reporting cell, and the other one is sensing cell used for detecting interested analytes, which
makes the reporting molecules not interfere the interested analyte during detecting performance.
2) another main advantage of closed BPE system is the current passes through the whole
system is same due to the connection between BPE with solutions in series, which could increase
the current efficiency on the BPE and lower the external applied voltage, and a lower applied
voltage could further lower byproducts generation on the driving electrodes and may lead to
increase the stability and sensitivity of measurement.
Figure 1.2 Two kinds of bipolar electrochemistry systems: (A) an open configuration and (B) a
closed configuration.
3) furthermore, the anodic driving electrode and cathodic driving electrode often immersed
in the same cell of open BPE system, the interested analytes preferentially consumed at the surfaces
of driving electrodes is huge, while in closed BPE system, two driving electrodes are separated in

5
different cells, which could alleviate the amount of consumption of interested analytes happened
on the driving electrode.
For instance, to evaluate cellular respiration of individual cell aggregates, a closed BPE array
that could separate electrochemiluminescence (ECL) chemicals from cell aggregates was
employed for on-chip analysis.20
1.2 ECL (Electrochemiluminescence)
1.2.1 Fundamentals of ECL
CL (chemiluminescence), which is the emission of light initiated by the homogeneous
chemical reaction between at least two reagents. Most of CL results from vigorous oxidative
reduction reactions, which consequently lead to CL has general problems including instability of
reagents, difficulties in spatial and temporal control, etc.21 ECL (electrochemiluminescence), also
called electrogenerated chemiluminescence, is the generation of light initiated by excited states
luminophore species formed at or near the electrode surfaces during electrochemical reactions.22-
23 It is the combination of CL and electrochemistry, and the initial electrochemical step is triggering
a cascade of chemical reactions to form reactive intermediates, which then would undergo highly
homogeneous electron-transfer (ET) reactions to generate excited state of luminophore (or
electrochemiluminophore), and following by relaxing to the ground states to emit light.24 ECL is
also different from photoluminescence (typically, fluorescence and phosphorescence) as a result
of absorption of light or electromagnetic radiation, and electroluminescence as a production of
direct conversion of electric energy to light. Compared to photoluminescence, ECL does not need
light source that may interfere the collection of ECL signal; compared to electroluminescence,
ECL is related to chemical and electrochemical reactions.24-25 ECL, as one kind of electrochemical
techniques that ECL signal has a quantitative relationship with the concentration of interested

6
analytes, has been widely used in biomolecule detection,26-27 food28-29 and drug analysis,30 clinical
diagnosis,31 and environmental monitoring,32 due to its high sensitivity, broad linear range, and
rapid analysis with a low background.33-34
1.2.2 General Reaction Mechanisms
Since the first ECL observation of Grignard compounds35 and luminol (5-amino-2,3-dihydro-
1,4-phthalazinedione)36 in 1920s published, more and more ECL luminophores had been reported
and detailed ECL working principle been offered.37-40 And the general ECL mechanisms mainly
including ion annihilation process and co-reagent process.
1.2.2.1 Annihilation ECL
In annihilation, the ECL luminophore species are electrochemically oxidized and reduced by
applying an alternating pulsed potential to generate the oxidized species and reduced species, both
of which species would react to undergo electron transfer to produce excited states luminophore,
which relaxes to ground state and emits the ECL light.23 And a typical system would contain
reagent A and B in solution with supporting electrolyte, the general mechanism is illustrated
below:41
A-e- → A•+ (oxidation at electrode) (1.2)
B + e- → B•- (reduction at electrode) (1.3)
B•- + A•+ → B + A* (excited state formation) (1.4)
A* → A + hv (light emission) (1.5)
Where A and B could be the same species. A good example is bard group using Ru(bpy)32+ to
generate ECL by alternatively pulsing of an electrode potential in acetonitrile, the mechanisms
showed below:42
Ru(bpy)32+ + e- → Ru(bpy)3
+ (1.6)

7
Ru(bpy)32+- e- → Ru(bpy)3
3+ (1.7)
Ru(bpy)3+ + Ru(bpy)3
3+ → Ru(bpy)32+ + Ru(bpy)3
2+* (1.8)
Ru(bpy)32+* → Ru(bpy)3
2+ + hv (1.9)
Another classic example involves rubrene, ECL observed when a double potential step applied to
the electrode (such as gold, platinum or glassy carbon).43-44
A successful annihilation ECL process should include a stable chemical or a long lifetime of
electrogenerated species, if these species react with solvent or other compound from the solution,
ECL intensity signal would be decreased or quenched, therefore, the lifetime of electrogenerated
species should be long enough to react and produce the excited states luminophore.45-46
1.2.2.2 Co-reagent ECL
In the ECL co-reagent process, ECL emissions generated in a single potential step at an
electrode immersed in a solution containing luminophore and co-reagent. Both the luminophore
and co-reagent can be oxidized or reduced first, and the intermediates formed from the oxidized
or reduced co-reagent decomposed to produce strong oxidizing or reducing species, following the
chemical reaction between the oxidizing/reducing species and reduced/oxidized luminophore
occurs to produce the excited state luminophore complex, which initiates light.25 To better
illustrate the general mechanisms of co-reagent ECL, oxalate, which was the first co-reagent
discovered,47-48 used to as an example, and Ru(bpy)32+ as the luminophore, and the ECL
mechanisms showed below:21, 49
Ru(bpy)32+- e- → Ru(bpy)3
3+ (1.7)
Ru(bpy)33+ + C2O4
2- → Ru(bpy)32+ + C2O4
•- (1.10)
C2O4•- → CO2 + CO2
•- (1.11)
Ru(bpy)33+ + CO2
•- → Ru(bpy)32+* + CO2 (1.12)

8
Or
Ru(bpy)32+ + CO2
•- → Ru(bpy)3+ + CO2 (1.13)
Ru(bpy)3+ + Ru(bpy)3
3+ → Ru(bpy)32+ + Ru(bpy)3
2+* (1.8)
Ru(bpy)32+* → Ru(bpy)3
2+ + hv (1.9)
From the mechanisms we can clearly see that annihilation also occurs along with the co-
reagent ECL electrochemical reactions happening. Moreover, the ECL only be observed at or near
the anodic electrode surface when using oxalate as co-reagent, and this behavior as anodic ECL.
Similar behavior also observed when using tri-n-propylamine (TPrA) as co-reagent.50
Alternatively, persulfate was used as co-reagent to electro-generate an oxidizing agent, in which
persulfate would be reduced to give off sulfate anion radical, which is a strong oxidant, and reacts
with the reduced luminophore to generate the excited states, which emits light.51 And, when
persulfate used as co-reagent, ECL generated can be observed at or near the cathodic electrode
surface, which phenomenon named as cathodic ECL.52-53 Similar cathodic light emission has also
been observed at oxide covered metal electrode (such as aluminum, tantalum) under some
conditions.54-55
However, it is difficult to oxidize some co-reagents either by the oxidized luminophore or at
the electrode. For example, the ECL cannot be initiated in the presence of pyruvate, which is the
co-reagent, and Ru(bpy)32+, in this case, Cerium (III) salt was added to the solution to generate
ECL, because pyruvate can be oxidized by the electrogenerated Cerium (IV).56
Generally, for inorganic luminophores, the excited states generation through electron transfer
without involving bonding breaking, while for some organic luminophores, the ECL mechanisms
is a little different for involving bond breaking. For example, the ECL generation using luminol as
luminophore, as demonstrated in Figure 1.3, luminol is oxidized at electrode surface and forms

9
diazoquinone intermediate under aqueous alkaline condition, then the intermediate further reacts
with hydrogen peroxide to generate luminol endoperoxide, which continues produce to 3-
aminophthalate in an excited state by bond cleavage, and finally emits the 425nm blue light.57
Figure 1.3 ECL mechanism of luminol with hydrogen peroxide.57 Adapted with permission from
Copyright © 2007, Springer Nature.
1.2.3 ECL Luminophores and Co-reagents
Luminophores used for generation of ECL mainly divided into two categories, inorganic
complexes, and organic molecules.
In terms of inorganic luminophores, considering many metal complexes and clusters served
as ECL luminophores applied in electrochemical and spectroscopic qualities, the ECL complexes
or clusters mainly including aluminum,58 cadmium,59 chromium,52 copper,60 europium,61 gold,62
iridium,63 osmium,64 molybdenum,65 platinum,66 rhenium,67 ruthenium,68 silver,69 etc..
Surprisingly, Ru(bpy)32+ complexes has been proved to be the most valuable in both fundamental
research studies and commercial applications. It probably due to its high efficiency luminescence,

10
easy to dissolve in both aqueous and organic solvent at room temperature, and ability to occur
reversible one electron transfer at easily obtained potentials. For example, researchers discovered
that Ru(bpy)32+ ECL efficiency is 0.05 and that the efficiency of emitting charge transfer state
produced from annihilation reactions approaching 100%.70-71 Moreover, the strategy of ECLIA
(ECL immunoassays) take advantage of ruthenium ECL labeling since Bard and Whitesides
presented the ground breaking idea.72 Thus, it lead to a wide applications of Ru(bpy)32+, for
example, one predominant format of ECL bioassays for targeting many different biomolecules and
antibodies commercially available based on ruthenium ECL labeling combined with magnetic
solid support, as illustrated in Figure 1.4, which showed the synthetic route for Ru(bpy)32+-labeled
antibody and Ru(bpy)32+-labeled oligonucleotide probes, together with the configuration of the
sandwich immunoassay and nucleic acid assays.73 Furthermore, ruthenium ECL also used in areas
including DNA detection,74 protein determination from human plasma or serum,75 etc..
As for organic luminophores, mainly including acenaphthalene,76 binaphthyl,63 bis(2,4,6-
trichlorophenyl)peroxyoxalate,77 DPBF,78 luminol,79 lucigenin,80 poly(9,9-dioctylfluorene)
polymer,81 pyrene/phenothiazine-substituted peptides,82 tri-carbocyanine dye IR125 & IR144,83
aromatic hydrocarbons-tetrathiafulvalene,84 rubrene,85 indole/tryptophan,86 etc.. Among these
organic luminophores, luminol and its derivatives are widely used due to their high luminescence
efficiency and solubility in aqueous or non-aqueous medium. For instance, a dual-signaling ECL
ratio-metric sensing approach for the detection of HL-60 cancer cells proposed by using luminol
modified Ag-PAMAM nanocomposites and G-C3N4 nanosheets serving oxidative–reductive and
reductive–oxidative ECL emitters respectively.87 Similarly, ECL immunosensor for Amyloid-β
detection was reported by using luminol that constructed by ceria doped ZnO nanomaterials with
flower-structure.88 In a similar way, an ECL enzyme immunoassay for 2,4,6-trinitrotoluene (TNT)
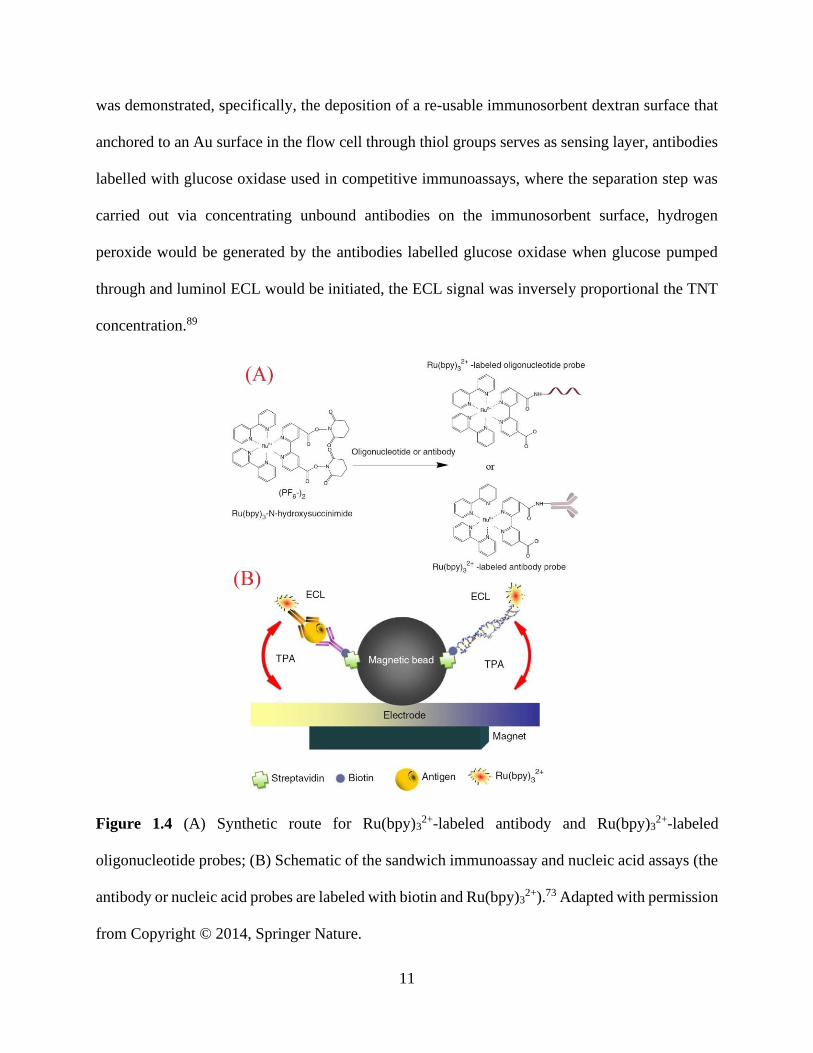
11
was demonstrated, specifically, the deposition of a re-usable immunosorbent dextran surface that
anchored to an Au surface in the flow cell through thiol groups serves as sensing layer, antibodies
labelled with glucose oxidase used in competitive immunoassays, where the separation step was
carried out via concentrating unbound antibodies on the immunosorbent surface, hydrogen
peroxide would be generated by the antibodies labelled glucose oxidase when glucose pumped
through and luminol ECL would be initiated, the ECL signal was inversely proportional the TNT
concentration.89
Figure 1.4 (A) Synthetic route for Ru(bpy)32+-labeled antibody and Ru(bpy)3
2+-labeled
oligonucleotide probes; (B) Schematic of the sandwich immunoassay and nucleic acid assays (the
antibody or nucleic acid probes are labeled with biotin and Ru(bpy)32+).73 Adapted with permission
from Copyright © 2014, Springer Nature.
12
The co-reagents used for the ECL mainly contains oxalate,90 tri-n-propylamine (TPrA),91
persulfate,92 hydrogen peroxide,93 amines,50 acridine orange,94 2-(dibutyl-amino)ethanol
(DBAE),95 oxygen,96 benzoyl peroxide,97 etc..
More luminophores and co-reagents refers to review paper.41
1.3 Applications of Bipolar electrochemistry
1.3.1 Bipolar Electrochemistry in Analytical Sensing
Since the concept of BPE was first proposed by Fleischmann and co-worker in 1960s,98
bipolar fluidized bed electrodes have been used in applications enhancing the efficiency of
electrosynthesis,99 batteries100 and photoelectrochemical cells.101 As a wireless technique, it is hard
to directly monitor the faradaic current promoted by the differences between the BPE and solution,
which may limit the analytical applications of bipolar electrochemistry. The first time ECL was
introduced to bipolar electrochemistry in 2001 by Manz et al. applied for micellar electro-kinetic
chromatographic separation of dichloro-tris(2,2′-bipyridyl)ruthenium(II) hydrate (Ru(bpy)32+ )
and dichloro-tris(1,10-phenanthroline)ruthenium-(II) hydrate (Ru(phen)32+)) on a microfabricated
glass device, which consists of a microfabricated ‘U’ shape floating platinum electrode placed
across the separation channel.102 The applications of bipolar electrochemistry expands widely
areas. Subsequently, the Crooks group proposed a microfluidic-base system, which used the basic
principle of bipolar electrochemistry, generating electrochemical coupling between a sensing
reaction and a reporting one that could be for instant ECL, which could imply the faradaic
processes happened at the two poles of BPE.103 Up to now, a great variety of analytical techniques
have been brought in bipolar electrochemistry, such as ECL,104-105 visual assay based on electro-
chromic materials106-107 or metal electro-dissolution/deposition,9, 108 fluorescence,109-110 directly
current recording with ammeter111 or LED (light emitting diode) in split BPE system,112 and

13
electromechanical readout.113 Among all the detection techniques, ECL matches well with the
wireless nature of BPE system, which offering a powerful tool for analytical sensing
applications.114 Furthermore, the variety of ECL luminophores and detector devices including
PMT (photomultiplier tube), CCD ( charge-coupled device), smart cell phones, makes BPE-ECL
system attracts great attention in sensing platforms.115 For example, Seol Baek, etc.116 reported a
miniaturized reverse electrodialysis-powered biosensor using ECL on bipolar electrode to detect
glucose and achieved a detection in the range of 0.5−10 mM by observing ECL emissions with
naked eyes. Xu group117 suggested a bipolar electrode based multicolor ECL biosensor for the
visualized sensing of prostate-specific antigen (PSA) in human blood serum, as the emission color
of concomitant electro-chemiluminophores is potential resolved, Ru(bpy)32+ and [Ir(ppy)3]
mixture were used as ECL emission and the cutoff values (4.0 and 10.0 ng/mL) of human PSA
could be recognized with naked eyes by the green−yellow−red ECL emission changing.
1.3.1.1 Detection of biomolecules
DNA and RNA sensing by bipolar electrochemistry plays an important role for genetic assays
and diagnosis. For instance, an ultrasensitive wireless BPE-ECL protocol for detection of c-Myc
mRNA in MCF-7 cells (breast cancer cell line) on a ITO (indium tin oxide) BPE presented.118
Specifically, this method based on the modification of anodic pole of BPE with antisense DNA
that as recognition element, RuSi@ Ru(bpy)32+(Ru(bpy)3
2+-conjugated silica nanoparticles) as
signal emitter, which employs the hybridization- induced changes of ECL signal for the detection
of reporter DNA, as illustrated in Figure 1.5, prior ECL detection, the CdSe@ZnS quantum dot-
antisense DNA would conjugate with reporter DNA, followed by transfecting through the tube
cell in which c-Myc mRNA would replace reporter DNA for its higher hybridization, the replaced
reporter DNA would combine with antisense DNA that labelled with RuSi@ Ru(bpy)32+ ECL

14
emitter and decrease the signal, and the reversely ECL signal is proportional with the concentration
of c-Myc mRNA. Similarly, a paper-based Au-BPE ECL sensing platform for detection of
miRNA-155 proposed.119 As well as for the detection of pathogenic DNAs, different paper-based
BPE configurations are fabricated and employed.120-121 Moreover, to detect cancer cell, a visual
ECL sensing platform based on dual-BPE array chip developed, specifically, the chip contains two
BPEs and three reservoirs, which filled with buffer, luminol, and Ru(bpy)32+-TPrA solutions,
respectively, by applying voltage, a set of orange ECL signals belongs to Ru(bpy)32+ turned on,
after adding DNAzyme and hydrogen peroxide to luminol and Ru(bpy)32+ reservoirs, the orange
signals would decrease until vanish by the quenching effect; meanwhile, the blue signals from
luminol turned on due to reaction with H2O2; owning to H2O2 could be formed by stimulating HL-
60 cancer cells with PMA, and DNAzyme can be generated from extended primer DNA by
telomerase, which also can be extracted from the cancer cells, based on this approach, the HL-60
cancer cell could be detected.122
In addition, antibodies or proteins from cells also have being widely detected using bipolar
electrochemistry. To measure the cancer cell surface protein, a hybrid BPE ECL biosensor
reported, prior to ECL measurement, anodic BPE modified with capture DNA, which would
hybridize a ferrocene (Fc) labelled aptamer and lead to a very week ECL signal for Fc inhibiting
the oxidation of Ru(bpy)32+ and Fc+ quenching the ECL efficiency, however, when the Fc labeled
aptamer mixed with cancer cells solution added to the cell, ECL signal would enhanced due to
mucin-1 protein expressed on the surface of cancer cells (MCF-7) would combine with part of Fc-
aptamer, using this principle, the mucin-1 protein on the surface of MCF-7 cells could be
quantified.123 In similar way, tetracycline,124 folic acid,125 adenosine aptamer,126 prostate-sepcific-
antigen (PSA),127 and MCF-7 and A549 aptamers128 were detected using BPE system. Moreover,

15
glucose concentration in blood also play a critical role for influencing human health, based on BPE
technique, various of glucose detection approaches were reported.129-130
Cellular respiration can be monitored using conventional electrochemical techniques,131-132
bipolar technique could also be used in measurement of cell respiratory activities.20 During
measurement, the oxygen would be reduced at the cathodic pole of BPE, while the luminophore
would be oxidized at the anodic pole of BPE to produce ECL emission, therefore, the ECL intensity
depends on oxygen concentration. For cell respiration, the cell aggregates were placed in the
cathodic pole of BPE, and a low ECL signal would be obtained when the cell aggregates consumed
the dissolved oxygen in the solution. Owning to this behavior, the cell respiratory activities could
be monitored. In Similar way, the hydrogen peroxide from cells can also be detected.133
Figure 1.5 Schematic representation of intracellular c-Myc mRNA detection using BPE- ECL
biosensor.118 Adapted permission from Copyright © 2012, American Chemical Society.
1.3.1.2 Others
Some compounds or ions have quenching effect for ECL happened at the vicinity surface of
electrode, such as Fc+,123 brilliant blue FCF,134 ribavirin,135 etc.. And this quenching phenomenon

16
could be considered as a quite general strategy for detecting molecules. In fact, this ECL quenching
effect already combined with BPE for quencher molecules measurement. For example, small
molecules, like ferrocene-methanol and oxygen, which are capable of efficiently quenching of the
Ru(bpy)32+ excited state via energy or electron transfer, detected in the bipolar electrochemical
cell.136 Halide ion turned out also have the ability to quench ECL signal on a critical threshold
concentration,137 which also could be measured using BPE ECL system.
1.3.2 Bipolar Electrochemistry in Materials Science
Bipolar electrochemistry widely used in materials science due to its interesting features
including: 1) wireless nature of BPE, 2) gradient potential distribution, 3) availability of
electrophoresis.16
1.3.2.1 Gradient Material Synthesis
One of beneficial properties of BPEs is that they have an electrical potential gradient
distribution, derived as linear IR drop in solution, and the slope could be manipulated by changing
the applied voltage on the driving electrodes. Thus, it can be used for different applications.
(1) Gradient electrodeposition
By taking advantage of the potential gradient in the solution using bipolar chemistry through
the interfacial polarization between a conducting substrate and an electrolyte solution, a metal
density gradient or bimetallic alloy composition gradient can be achieved on the cathodic side of
bipolar. To better understand of this, a model for Ag/Au alloy electrodeposition using linear sweep
voltammetry showed in Figure 1.6, when the interfacial potential between the electrode and
electrolyte solution reaches to the onset reduction potential of Ag ions, the Ag deposition starts,
and the Ag reducing rate increases with the increasing of more negative potential until reaches an
equilibrium states (constant value) that governs by the maximal mass migration and diffusion of

17
Ag ions; as the negative potential reaches the onset reduction potential of Au ions, the Au
deposition starts and the reducing rate also increases with the increasing of more negative potential
until reaches the equilibrium state of Au ions deposition, and the alloy composition region is
located within the range, as illustrated of part II in Figure 1.6; part III is a region both Ag and Au
reach their equilibrium states, which means the composition of Ag and Au stays at a constant
value. All these three parts could be achieved by changing the potential along with BPE, which
exhibits a potential gradient with the position of BPE. For example, Bouffier group138 reported a
straightforward, single-step generation of metal composition gradients on cylindrical carbon fibers
by using bipolar chemistry. In specifically, they demonstrated with monometallic layers as well as
a bimetallic composite layer based on copper and nickel on BPE, and screened the morphologies
of different metal depositions along a BPE by using SEM. In our previous work, we have
successfully formed CdS on Au substrate139 and Au-Ag alloy gradient on stainless steel by using
bipolar electrodeposition, a technique based on the existence of a potential gradient at the interface
of a BPE and an electrolytic solution.140
Figure 1.6 Ag/Au alloy electrodeposition model.

18
(2) Fabrication of gradient polymer brushes
Once we digest the gradient electrodeposition principle, it would be much easy to understand
the fabrication of gradient polymer brushes. One way to fabricate the gradient polymer brushes is
electrochemically generated Cu(I) used as the catalyst of ATRP (atom-transfer radical
polymerization), in the electrochemically mediated ATRP (eATRP), the living radical
polymerization can be controlled by tuning the potential gradient, and polymerization rate of
ATRP is generally proportional to the ratio of [Cu(I)]/[Cu(II)], therefore, the polymerization rate
can be tuned by changing this ratio, under the BPE conditions, generation of Cu(I) is increasing as
position varies close to the cathodic edge, consequently, the gradient of [Cu(I)]/[Cu(II)] is
established in the space within the micro-gap. Therefore, the rate of surface initiated ATRP
depends on the BPE positions to give a polymer brush with a gradient height profile.19, 141 In
another study, Kuhn and co-workers employed electro-polymerization using BPE technique for
poly-pyrrole deposition.142 Also, they achieved deposits of Au at the cathodic end of BPE (carbon
microfiber) along with a concomitant electro-polymerization of polythiophene at the anodic BPE
pole.143
(3) others
Electron transfer reactions of a conducting polymer generate polaron or bi-polaron in its
repeating unit (known as electrochemical doping), which vary the physical properties of polymers.
The electrochemical doping imparts electrical conductivity along with a significant color
difference.144
1.3.2.2 Modification of Conductive Objects
One neat example about modification of conductive objects is using bipolar electrochemistry
to synthesize Janus particles, where one hemisphere has a distinct property to the other side.145-146

19
BPEs were used carbon beads, and the key point of this technique is to fix BPEs in an electrolyte
to suppress BPEs movement during electrolysis. Agarose-based hydrogel was found to be useful
and used for fixing carbon beads in a glass capillary. Based on this concept, the modification of
SiO2 and TiO2 reported by electrogenerated acid-induced sol−gel reaction,147 the introduction of
covalently bonded organic groups via the diazonium salts electro-grafting and metal deposition.146
Janus particles generated by bipolar electrodeposition containing a catalytic or a magnetic
extremity can be used as synthetic motors. For example, carbon microtubes with an
electrochemically generated Pt tip on one side have been moved in hydrogen peroxide solutions.148
The motion was contributed to the generation and releasing of oxygen bubbles, which come from
the catalytic decomposition of hydrogen peroxide at the Pt surface.
A direct electric connection between two separated BPEs can be achieved using bipolar
electrochemistry. Bradley and co-workers demonstrated that two separated Cu particles that
considered as BPEs could electrically contact by directional growth of Cu microwires. Initially,
the faradaic processes at both Cu particles would cause electro-dissolution of Cu at anodic poles
and water reduction at the cathodic poles, when the electrogenerated copper ions reach the cathodic
side of the other particle, electrodeposition of Cu would happen and Cu dendrites would be
formed.149-151
1.3.3 Other Fields
Bipolar electrochemistry is also using in analytical purpose including separation,152 electric
field focusing,153 pre-concentration154, batteries,155-156 and so on. One of the interesting
applications of bipolar electrochemistry is used for seawater desalination, specifically, a flow of
seawater is separated into desalted and brine water streams at the junction of a branched
microchannel where a BPE placed, the anodic pole of the BPE produces an ion depletion zone,

20
and thus, a local electric field gradient redirects ions present in seawater to the brine channel.157
Undoubtedly, bipolar electrochemistry is a powerful tool employed in a great variety of fields.

21
References
1. Loget, G.; Zigah, D.; Bouffier, L.; Sojic, N.; Kuhn, A., Bipolar electrochemistry: from
materials science to motion and beyond. Accounts of Chemical Research 2013, 46 (11), 2513-2523.
2. Phuakkong, O.; Sentic, M.; Li, H.; Warakulwit, C.; Limtrakul, J.; Sojic, N.; Kuhn, A.;
Ravaine, V. r.; Zigah, D., Wireless synthesis and activation of electrochemiluminescent
thermoresponsive janus objects using bipolar electrochemistry. Langmuir 2016, 32 (49), 12995-
13002.
3. Qi, Z.; You, S.; Liu, R.; Chuah, C. J., Performance and mechanistic study on
electrocoagulation process for municipal wastewater treatment based on horizontal bipolar
electrodes. Frontiers of Environmental Science & Engineering 2020, 14 (3), 1-10.
4. Lacina, K.; Kazda, T.; Syrový, T.; Trnková, L.; Vanýsek, P.; Skládal, P., Asymmetric
bipolar electrochemistry: Detailed empirical description and determination of output
characteristics of a galvanic system with multiple short-circuited cells in one electrolyte.
Electrochimica Acta 2019, 307, 269-274.
5. Shannon, C.; Wang, B.; Yu, S., Reduction of 4‐Nitrothiophenol on Ag/Au Bimetallic Alloy
Surfaces Studied Using Bipolar Raman Spectroelectrochemistry. ChemElectroChem 2020.
6. Sheridan, E.; Hlushkou, D.; Knust, K. N.; Tallarek, U.; Crooks, R. M., Enrichment of
cations via bipolar electrode focusing. Analytical chemistry 2012, 84 (17), 7393-7399.
7. Rafatmah, E.; Hemmateenejad, B., Colorimetric and visual determination of hydrogen
peroxide and glucose by applying paper-based closed bipolar electrochemistry. Microchimica Acta
2019, 186 (11), 684.
8. Kumsapaya, C.; Limtrakul, J.; Kuhn, A.; Zigah, D.; Warakulwit, C., Bipolar electrografting
on the inner wall of carbon nanotubes. ChemElectroChem 2016, 3 (3), 410-414.

22
9. Fosdick, S. E.; Crooks, R. M., Bipolar electrodes for rapid screening of electrocatalysts.
Journal of the American Chemical Society 2012, 134 (2), 863-866.
10. Ibanez, D.; Heras, A.; Colina, A., Bipolar Spectroelectrochemistry. Analytical Chemistry
2017, 89 (7), 3879-3883.
11. Bouffier, L.; Arbault, S.; Kuhn, A.; Sojic, N., Generation of electrochemiluminescence at
bipolar electrodes: concepts and applications. Analytical and bioanalytical chemistry 2016, 408
(25), 7003-7011.
12. Crooks, R. M., Principles of bipolar electrochemistry. ChemElectroChem 2016, 3 (3), 357-
359.
13. Mavré, F.; Chow, K.-F.; Sheridan, E.; Chang, B.-Y.; Crooks, J. A.; Crooks, R. M., A
theoretical and experimental framework for understanding electrogenerated chemiluminescence
(ECL) emission at bipolar electrodes. Analytical Chemistry 2009, 81 (15), 6218-6225.
14. Mavre, F. o.; Anand, R. K.; Laws, D. R.; Chow, K.-F.; Chang, B.-Y.; Crooks, J. A.; Crooks,
R. M., Bipolar electrodes: a useful tool for concentration, separation, and detection of analytes in
microelectrochemical systems. ACS Publications: 2010.
15. Fosdick, S. E.; Knust, K. N.; Scida, K.; Crooks, R. M., Bipolar electrochemistry.
Angewandte Chemie International Edition 2013, 52 (40), 10438-10456.
16. Shida, N.; Zhou, Y.; Inagi, S., Bipolar Electrochemistry: A Powerful Tool for Electrifying
Functional Material Synthesis. Accounts of Chemical Research 2019, 52 (9), 2598-2608.
17. Fosdick, S. E.; Crooks, J. A.; Chang, B.-Y.; Crooks, R. M., Two-dimensional bipolar
electrochemistry. Journal of the American Chemical Society 2010, 132 (27), 9226-9227.

23
18. Shida, N.; Kitamura, F.; Fuchigami, T.; Tomita, I.; Inagi, S., Signal‐Amplified Analysis of
Molecular Layers Prepared through Bipolar Electrochemistry. ChemElectroChem 2016, 3 (3),
465-471.
19. Shida, N.; Koizumi, Y.; Nishiyama, H.; Tomita, I.; Inagi, S., Electrochemically mediated
atom transfer radical polymerization from a substrate surface manipulated by bipolar electrolysis:
Fabrication of gradient and patterned polymer brushes. Angewandte Chemie International Edition
2015, 54 (13), 3922-3926.
20. Ino, K.; Yaegaki, R.; Hiramoto, K.; Nashimoto, Y.; Shiku, H., Closed bipolar electrode
array for on-chip analysis of cellular respiration by cell aggregates. ACS sensors 2020, 5 (3), 740-
745.
21. Hai-Juan, L.; Shuang, H.; Lian-Zhe, H.; Guo-Bao, X., Progress in Ru (bpy) 32+
Electrogenerated Chemiluminescence. Chinese Journal of Analytical Chemistry 2009, 37 (11),
1557-1565.
22. Hesari, M.; Ding, Z., Electrogenerated chemiluminescence: light years ahead. Journal of
The Electrochemical Society 2015, 163 (4), H3116.
23. Bard, A. J., Electrogenerated chemiluminescence. CRC Press: 2004.
24. Bouffier, L.; Sojic, N., Introduction and Overview of Electrogenerated
Chemiluminescence. 2019.
25. Qi, H.; Zhang, C., Electrogenerated chemiluminescence biosensing. ACS Publications:
2020.
26. Deng, B.; Lu, H.; Li, L.; Shi, A.; Kang, Y.; Xu, Q., Determination of the number of binding
sites and binding constant between diltiazem hydrochloride and human serum albumin by

24
ultrasonic microdialysis coupled with online capillary electrophoresis electrochemiluminescence.
Journal of Chromatography A 2010, 1217 (28), 4753-4756.
27. Ji, Y.; Ma, Y.; Sun, X., Determination of glutathione in individual Ramos cells by capillary
electrophoresis with electrochemiluminescence detection. Analytical Methods 2013, 5 (6), 1542-
1547.
28. Cai, C.; Cheng, H.; Wang, Y., Determination of pretilachlor in soil and rice using matrix
solid-phase dispersion extraction by capillary electrophoresis with field amplified sample injection
and electrochemiluminescence detection. Analytical Methods 2014, 6 (8), 2767-2773.
29. An, D.; Chen, Z.; Zheng, J.; Chen, S.; Wang, L.; Huang, Z.; Weng, L., Determination of
biogenic amines in oysters by capillary electrophoresis coupled with electrochemiluminescence.
Food chemistry 2015, 168, 1-6.
30. Lahuerta-Zamora, L.; Mellado-Romero, A. M., Video approach to chemiluminescence
detection using a low-cost complementary metal oxide semiconductor (CMOS)-based camera:
determination of paracetamol in pharmaceutical formulations. Analytical and bioanalytical
chemistry 2017, 409 (15), 3891-3898.
31. Xu, L.; Li, L.; Huang, J.; You, T., Analysis of perphenazine and fluphenazine by capillary
electrophoresis coupled with tris (2, 2′-bipyridyl) ruthenium (II) electrochemiluminescence
detection. Talanta 2014, 118, 1-6.
32. Deng, B.; Liu, Y.; Yin, H.; Ning, X.; Lu, H.; Ye, L.; Xu, Q., Determination of ultra-trace
formaldehyde in air using ammonium sulfate as derivatization reagent and capillary
electrophoresis coupled with on-line electrochemiluminescence detection. Talanta 2012, 91, 128-
133.

25
33. Yao, J.; Li, L.; Li, P.; Yang, M., Quantum dots: from fluorescence to chemiluminescence,
bioluminescence, electrochemiluminescence, and electrochemistry. Nanoscale 2017, 9 (36),
13364-13383.
34. Lara, F. J.; Airado-Rodríguez, D.; Moreno-González, D.; Huertas-Pérez, J. F.; García-
Campaña, A. M., Applications of capillary electrophoresis with chemiluminescence detection in
clinical, environmental and food analysis. A review. Analytica Chimica Acta 2016, 913, 22-40.
35. Dufford, R.; Nightingale, D.; Gaddum, L., Luminescence of Grignard compounds in
electric and magnetic fields, and related electrical phenomena. Journal of the American Chemical
Society 1927, 49 (8), 1858-1864.
36. Harvey, N., Luminescence during electrolysis. The Journal of Physical Chemistry 1929,
33 (10), 1456-1459.
37. Hercules, D. M., Chemiluminescence resulting from electrochemically generated species.
Science 1964, 145 (3634), 808-809.
38. Visco, R. E.; Chandross, E. A., Electroluminescence in solutions of aromatic hydrocarbons.
Journal of the American Chemical Society 1964, 86 (23), 5350-5351.
39. Santhanam, K.; Bard, A. J., Chemiluminescence of electrogenerated 9, 10-
Diphenylanthracene anion radical1. Journal of the American Chemical Society 1965, 87 (1), 139-
140.
40. Leland, J. K.; Powell, M. J., Electrogenerated chemiluminescence: an oxidative‐reduction
type ECL reaction sequence using tripropyl amine. Journal of the Electrochemical Society 1990,
137 (10), 3127.
41. Richter, M. M., Electrochemiluminescence (ecl). Chemical Reviews 2004, 104 (6), 3003-
3036.

26
42. Tokel, N. E.; Bard, A. J., Electrogenerated chemiluminescence. IX. Electrochemistry and
emission from systems containing tris (2, 2'-bipyridine) ruthenium (II) dichloride. Journal of the
American Chemical Society 1972, 94 (8), 2862-2863.
43. Bezman, R.; Faulkner, L. R., Mechanisms of chemiluminescent electron-transfer reactions.
V. Absolute measurements of rubrene luminescence in benzonitrile and N, N-dimethylformamide.
Journal of the American Chemical Society 1972, 94 (18), 6324-6330.
44. Maricle, D. L.; Maurer, A., Pre-annihilation electrochemiluminescence of rubrene. Journal
of the American Chemical Society 1967, 89 (1), 188-189.
45. Miao, W.; Choi, J.-P.; Bard, A. J., Electrogenerated chemiluminescence 69: The Tris (2, 2
‘-bipyridine) ruthenium (II),(Ru (bpy) 32+)/Tri-n-propylamine (TPrA) system revisited A new
route involving TPrA•+ Cation Radicals. Journal of the American Chemical Society 2002, 124
(48), 14478-14485.
46. Cruser, S. A.; Bard, A. J., Electrogenerated chemiluminescence. III. Intensity-time and
concentration-intensity relation and the lifetime of radical cations of aromatic hydrocarbons in N,
N-dimethylformamide solution. Journal of the American Chemical Society 1969, 91 (2), 267-275.
47. Chang, M.-M.; Saji, T.; Bard, A. J., Electrogenerated chemiluminescence. 30.
Electrochemical oxidation of oxalate ion in the presence of luminescers in acetonitrile solutions.
Journal of the American Chemical Society 1977, 99 (16), 5399-5403.
48. Rubinstein, I.; Bard, A. J., Polymer films on electrodes. 4. Nafion-coated electrodes and
electrogenerated chemiluminescence of surface-attached tris (2, 2'-bipyridine) ruthenium (2+).
Journal of the American Chemical Society 1980, 102 (21), 6641-6642.

27
49. Ege, D.; Becker, W. G.; Bard, A. J., Electrogenerated chemiluminescent determination of
tris (2, 2'-bipyridine) ruthenium ion (Ru(bpy)32+) at low levels. Analytical chemistry 1984, 56
(13), 2413-2417.
50. Liu, X.; Shi, L.; Niu, W.; Li, H.; Xu, G., Environmentally Friendly and Highly Sensitive
Ruthenium (II) Tris (2, 2′‐bipyridyl) Electrochemiluminescent System Using 2‐(Dibutylamino)
ethanol as Co‐Reactant. Angewandte Chemie International Edition 2007, 46 (3), 421-424.
51. White, H. S.; Bard, A. J., Electrogenerated chemiluminescence. 41. Electrogenerated
chemiluminescence and chemiluminescence of the Ru (2, 21-bpy) 32+-S2O82-system in
acetonitrile-water solutions. Journal of the American Chemical Society 1982, 104 (25), 6891-6895.
52. Bolleta, F.; Ciano, M.; Balzani, V.; Serpone, N., Polypyridine transition metal complexes
as light emission sensitizers in the electrochemical reduction of the persulfate ion. Inorganica
Chimica Acta 1982, 62, 207-213.
53. Gorman, B. A.; Francis, P. S.; Barnett, N. W., Tris (2, 2′-bipyridyl) ruthenium (II)
chemiluminescence. Analyst 2006, 131 (5), 616-639.
54. Kulmala, S.; Ala-Kleme, T.; Heikkilä, L.; Väre, L., Energetic electrochemiluminescence
of (9-fluorenyl) methanol induced by injection of hot electrons into aqueous electrolyte solution.
Journal of the Chemical Society, Faraday Transactions 1997, 93 (17), 3107-3113.
55. Gaillard, F.; Sung, Y.-E.; Bard, A. J., Hot electron generation in aqueous solution at oxide-
covered tantalum electrodes. Reduction of methylpyridinium and electrogenerated
chemiluminescence of Ru (bpy) 32+. The Journal of Physical Chemistry B 1999, 103 (4), 667-674.
56. Knight, A. W.; Greenway, G. M., Electrogenerated chemiluminescent determination of
pyruvate using tris (2, 2′-bipyridine) ruthenium (II). Analyst 1995, 120 (10), 2543-2547.

28
57. Marquette, C. A.; Blum, L. J., Electro-chemiluminescent biosensing. Analytical and
Bioanalytical Chemistry 2008, 390 (1), 155-168.
58. Gross, E.; Anderson, J.; Slaterbeck, A.; Thayumanavan, S.; Barlow, S.; Zhang, Y.; Marder,
S.; Hall, H.; Nabor, M. F.; Wang, J.-F., Electrogenerated chemiluminescence from derivatives of
aluminum quinolate and quinacridones: Cross-reactions with triarylamines lead to singlet emission
through triplet− triplet annihilation pathways. Journal of the American Chemical Society 2000,
122 (20), 4972-4979.
59. Taverna, P. J.; Mayfield, H.; Andrews, A. R., Determination of cadmium ions in water by
a novel electrochemiluminescence method. Analytica chimica acta 1998, 373 (2-3), 111-117.
60. Vogler, A.; Kunkely, H., Electrochemiluminescence of organometallics and other
transition metal complexes. ACS Publications: 1987.
61. Richter, M. M.; Bard, A. J., Electrogenerated chemiluminescence. 58. Ligand-sensitized
electrogenerated chemiluminescence in europium labels. Analytical chemistry 1996, 68 (15),
2641-2650.
62. Bruno, J. G.; Cornette, J. C., An Electrochemiluminescence Assay Based on the
Interactionof Diaminotoluene Isomers with Gold (I) and Copper (II) Ions. Microchemical journal
1997, 56 (3), 305-314.
63. Fleet, B.; Kirkbright, G.; Pickford, C., Application of electroluminescence techniques to
the determination of aromatic hydrocarbons. Talanta 1968, 15 (6), 566-570.
64. Abruña, H. D., Electrogenerated chemiluminescence of bipyridine and phenanthroline
complexes of osmium. Journal of electroanalytical chemistry and interfacial electrochemistry
1984, 175 (1-2), 321-326.

29
65. Ouyang, J.; Zietlow, T. C.; Hopkins, M. D.; Fant, F. R. F.; Gray, H. B.; Bard, A. J.,
Electrochemistry and electrogenerated chemiluminescence of tetrachlorotetrakis
(trimethylphosphine) dimolybdenum. The Journal of Physical Chemistry 1986, 90 (16), 3841-
3844.
66. Bonafede, S.; Ciano, M.; Bolletta, F.; Balzani, V.; Chassot, L.; Von Zelewsky, A.,
Electrogenerated chemiluminescence of an ortho-metalated platinum (II) complex. The Journal of
Physical Chemistry 1986, 90 (16), 3836-3841.
67. Richter, M. M.; Debad, J. D.; Striplin, D. R.; Crosby, G.; Bard, A. J., Electrogenerated
chemiluminescence. 59. Rhenium complexes. Analytical Chemistry 1996, 68 (24), 4370-4376.
68. Richter, M. M.; Bard, A. J.; Kim, W.; Schmehl, R. H., Electrogenerated
chemiluminescence. 62. Enhanced ECL in bimetallic assemblies with ligands that bridge isolated
chromophores. Analytical Chemistry 1998, 70 (2), 310-318.
69. Bruno, J. G.; Parker, J. E.; Holwitt, E.; Alls, J. L.; Kiel, J. L., Preliminary
electrochemiluminescence studies of metal ion–bacterial diazoluminomelanin (DALM)
interactions. Journal of bioluminescence and chemiluminescence 1998, 13 (3), 117-123.
70. Luttmer, J.; Bard, A. J., Electrogenerated chemiluminescence. 38. Emission intensity-time
transients in the tris (2, 2'-bipyridine) ruthenium (II) system. The Journal of Physical Chemistry
1981, 85 (9), 1155-1159.
71. Glass, R. S.; Faulkner, L. R., Electrogenerated chemiluminescence from the tris (2, 2'-
bipyridine) ruthenium (II) system. An example of S-route behavior. The Journal of Physical
Chemistry 1981, 85 (9), 1160-1165.
72. Bard, A. J.; Whitesides, G. M., Luminescent metal chelate labels and means for detection.
Google Patents: 1993.

30
73. Zhou, X.; Zhu, D.; Liao, Y.; Liu, W.; Liu, H.; Ma, Z.; Xing, D., Synthesis, labeling and
bioanalytical applications of a tris (2, 2′-bipyridyl) ruthenium (II)-based
electrochemiluminescence probe. nature protocols 2014, 9 (5), 1146-1159.
74. Dennany, L.; Forster, R. J.; Rusling, J. F., Simultaneous direct electrochemiluminescence
and catalytic voltammetry detection of DNA in ultrathin films. Journal of the American Chemical
Society 2003, 125 (17), 5213-5218.
75. Miao, W.; Bard, A. J., Electrogenerated Chemiluminescence. 72. Determination of
Immobilized DNA and C-Reactive Protein on Au (111) Electrodes Using Tris (2, 2 ‘-bipyridyl)
ruthenium (II) Labels. Analytical chemistry 2003, 75 (21), 5825-5834.
76. Schaper, H., A novel hybrid detection system based on electrochemiluminescence in
electrolyte-free solutions. Journal of Electroanalytical Chemistry and Interfacial Electrochemistry
1981, 129 (1-2), 335-342.
77. Brina, R.; Bard, A. J., Electrogenerated chemiluminescence: Part XLVIII.
Electrochemistry and electrogenerated chemiluminescence of bis (2, 4, 6-trichlorophenyl) oxalate-
luminescer systems. Journal of electroanalytical chemistry and interfacial electrochemistry 1987,
238 (1-2), 277-295.
78. Debad, J. D.; Morris, J. C.; Magnus, P.; Bard, A. J., Anodic coupling of diphenylbenzo [k]
fluoranthene: Mechanistic and kinetic studies utilizing cyclic voltammetry and electrogenerated
chemiluminescence. The Journal of organic chemistry 1997, 62 (3), 530-537.
79. Sheng, Y.; Yang, H.; Wang, Y.; Han, L.; Zhao, Y.; Fan, A., Silver nanoclusters-catalyzed
luminol chemiluminescence for hydrogen peroxide and uric acid detection. Talanta 2017, 166,
268-274.

31
80. Karasawa, K.; Haraya, S.; Okubo, S.; Arakawa, H., Novel assay of antibacterial
components in manuka honey using lucigenin-chemiluminescence-HPLC. Analytica chimica acta
2017, 954, 151-158.
81. Prieto, I.; Teetsov, J.; Fox, M. A.; Vanden Bout, D. A.; Bard, A. J., A study of excimer
emission in solutions of poly (9, 9-dioctylfluorene) using electrogenerated chemiluminescence.
The Journal of Physical Chemistry A 2001, 105 (3), 520-523.
82. Strauß, J.; Daub, J., Donor–Acceptor Functionalized Luminescent Hairpin Peptides:
Electrochemiluminescence of Pyrene/Phenothiazine‐Substituted Optically Active Systems.
Advanced Materials 2002, 14 (22), 1652-1655.
83. Lee, S. K.; Richter, M. M.; Strekowski, L.; Bard, A. J., Electrogenerated
chemiluminescence. 61. Near-IR electrogenerated chemiluminescence, electrochemistry, and
spectroscopic properties of a heptamethine cyanine dye in MeCN. Analytical Chemistry 1997, 69
(20), 4126-4133.
84. Hasegawa, T.; Mattenberger, K.; Takeya, J.; Batlogg, B., Ambipolar field-effect carrier
injections in organic Mott insulators. Physical Review B 2004, 69 (24), 245115.
85. Rodríguez-Lopez, J.; Shen, M.; Nepomnyashchii, A. B.; Bard, A. J., Scanning
electrochemical microscopy study of ion annihilation electrogenerated chemiluminescence of
rubrene and [Ru (bpy) 3] 2+. Journal of the American Chemical Society 2012, 134 (22), 9240-
9250.
86. Chen, G. N.; Lin, R. E.; Zhao, Z. F.; Duan, J. P.; Zhang, L., Electrogenerated
chemiluminescence for determination of indole and tryptophan. Analytica chimica acta 1997, 341
(2-3), 251-256.

32
87. Wang, Y.-Z.; Hao, N.; Feng, Q.-M.; Shi, H.-W.; Xu, J.-J.; Chen, H.-Y., A ratiometric
electrochemiluminescence detection for cancer cells using g-C3N4 nanosheets and Ag–PAMAM–
luminol nanocomposites. Biosensors and Bioelectronics 2016, 77, 76-82.
88. Wang, J.-X.; Zhuo, Y.; Zhou, Y.; Wang, H.-J.; Yuan, R.; Chai, Y.-Q., Ceria doped zinc
oxide nanoflowers enhanced luminol-based electrochemiluminescence immunosensor for
amyloid-β detection. ACS applied materials & interfaces 2016, 8 (20), 12968-12975.
89. Wilson, R.; Clavering, C.; Hutchinson, A., Electrochemiluminescence enzyme
immunoassay for TNT. Analyst 2003, 128 (5), 480-485.
90. Jimenez-Ruiz, A.; Grueso, E.; Perez-Tejeda, P.; Muriel-Delgado, F.; Torres-Marquez, C.,
Electrochemiluminescent (ECL)[Ru (bpy) 3] 2+/PAMAM dendrimer reactions: coreactant effect
and 5-fluorouracil/dendrimer complex formation. Analytical and bioanalytical chemistry 2016,
408 (25), 7213-7224.
91. Zhang, R.; Zhong, X.; Chen, A.-Y.; Liu, J.-L.; Li, S.-K.; Chai, Y.-Q.; Zhuo, Y.; Yuan, R.,
Novel Ru (bpy) 2 (cpaphen) 2+/TPrA/TiO2 ternary ECL system: an efficient platform for the
detection of glutathione with Mn2+ as substitute target. Analytical Chemistry 2019, 91 (5), 3681-
3686.
92. Tang, T.; Hao, Z.; Yang, H.; Nie, F.; Zhang, W., A highly enhanced
electrochemiluminescence system based on a novel Cu-MOF and its application in the
determination of ferrous ion. Journal of Electroanalytical Chemistry 2020, 856, 113498.
93. Tian, K.; Li, D.; Tang, T.; Nie, F.; Zhou, Y.; Du, J.; Zheng, J., A novel
electrochemiluminescence resonance energy transfer system of luminol-graphene quantum dot
composite and its application in H2O2 detection. Talanta 2018, 185, 446-452.

33
94. Saqib, M.; Bashir, S.; Kitte, S. A.; Li, H.; Jin, Y., Acridine orange as a coreactant for
efficient electrogenerated chemiluminescence of tris (2, 2′-bipyridine) ruthenium (ii) and its use in
selective and sensitive detection of thiourea. Chemical Communications 2020, 56 (38), 5154-5157.
95. Parveen, S.; Zhang, W.; Yuan, Y.; Hu, L.; Gilani, M. R. H. S.; ur Rehman, A.; Xu, G.,
Electrogenerated chemiluminescence of Ru (phen) 32+/2-(dibutylamino) ethanol system. Journal
of Electroanalytical Chemistry 2013, 688, 45-48.
96. Cao, W.; Xu, G.; Zhang, Z.; Dong, S., Novel tris (2, 2′-bipyridine) ruthenium (ii) cathodic
electrochemiluminescence in aqueous solution at a glassy carbon electrode. Chemical
communications 2002, (14), 1540-1541.
97. Swanick, K. N.; Ladouceur, S.; Zysman-Colman, E.; Ding, Z., Bright
electrochemiluminescence of iridium (III) complexes. Chemical Communications 2012, 48 (26),
3179-3181.
98. Backhurst, J.; Coulson, J.; Goodridge, F.; Plimley, R.; Fleischmann, M., A preliminary
investigation of fluidized bed electrodes. Journal of the Electrochemical Society 1969, 116 (11),
1600.
99. Manji, A.; Oloman, C., Electrosynthesis of propylene oxide in a bipolar trickle-bed reactor.
Journal of applied electrochemistry 1987, 17 (3), 532-544.
100. Wiesener, K.; Ohms, D.; Benczúr-Ürmössy, G.; Berthold, M.; Haschka, F., High power
metal hydride bipolar battery. Journal of Power Sources 1999, 84 (2), 248-258.
101. Cervera‐March, S.; Smotkin, E.; Bard, A.; Campion, A.; Fox, M.; Mallouk, T.; Webber,
S.; White, J., Modeling of bipolar semiconductor photoelectrode arrays for electrolytic processes.
Journal of the Electrochemical Society 1988, 135 (3), 567.

34
102. Arora, A.; Eijkel, J. C.; Morf, W. E.; Manz, A., A wireless electrochemiluminescence
detector applied to direct and indirect detection for electrophoresis on a microfabricated glass
device. Analytical chemistry 2001, 73 (14), 3282-3288.
103. Zhan, W.; Alvarez, J.; Crooks, R. M., Electrochemical sensing in microfluidic systems
using electrogenerated chemiluminescence as a photonic reporter of redox reactions. Journal of
the American Chemical Society 2002, 124 (44), 13265-13270.
104. Moghaddam, M. R.; Carrara, S.; Hogan, C. F., Multi-colour bipolar
electrochemiluminescence for heavy metal ion detection. Chemical Communications 2019, 55 (8),
1024-1027.
105. Dauphin, A. L.; Akchach, A.; Voci, S.; Kuhn, A.; Xu, G.; Bouffier, L.; Sojic, N., Tracking
Magnetic Rotating Objects by Bipolar Electrochemiluminescence. The journal of physical
chemistry letters 2019, 10 (18), 5318-5324.
106. Zhang, X.; Shang, C.; Gu, W.; Xia, Y.; Li, J.; Wang, E., A renewable display platform
based on the bipolar electrochromic electrode. ChemElectroChem 2016, 3 (3), 383-386.
107. Xu, W.; Fu, K.; Bohn, P. W., Electrochromic sensor for multiplex detection of metabolites
enabled by closed bipolar electrode coupling. ACS sensors 2017, 2 (7), 1020-1026.
108. Hadjixenis, A. P.; Hrbac, J.; Prodromidis, M. I., Bipolar electrochemical detection of
reducing compounds based on visual observation of a metal electrodeposited track at the onset
driving voltage. Sensors and Actuators B: Chemical 2018, 268, 529-534.
109. Stefano, J. S.; Conzuelo, F.; Masa, J.; Munoz, R. A.; Schuhmann, W., Coupling
electrochemistry with a fluorescence reporting reaction enabled by bipolar electrochemistry.
Journal of Electroanalytical Chemistry 2020, 113921.

35
110. Xu, W.; Ma, C.; Bohn, P. W., Coupling of independent electrochemical reactions and
fluorescence at closed bipolar interdigitated electrode arrays. ChemElectroChem 2016, 3 (3), 422-
428.
111. Klett, O.; Nyholm, L., Separation high voltage field driven on-chip amperometric detection
in capillary electrophoresis. Analytical chemistry 2003, 75 (6), 1245-1250.
112. Zhang, X.; Chen, C.; Yin, J.; Han, Y.; Li, J.; Wang, E., Portable and visual electrochemical
sensor based on the bipolar light emitting diode electrode. Analytical chemistry 2015, 87 (9), 4612-
4616.
113. Zhang, L.; Gupta, B.; Goudeau, B.; Mano, N.; Kuhn, A., Wireless electromechanical
readout of chemical information. Journal of the American Chemical Society 2018, 140 (45),
15501-15506.
114. WANG, J. L. E., Wireless ECL Generation Based on Bipolar Electrochemistry. Analytical
Electrogenerated Chemiluminescence: From Fundamentals to Bioassays 2019, 15, 176.
115. Lu, H.-J.; Zhao, W.; Xu, J.-J.; Chen, H.-Y., Visual electrochemiluminescence ratiometry
on bipolar electrode for bioanalysis. Biosensors and Bioelectronics 2018, 102, 624-630.
116. Baek, S.; Kwon, S.-R.; Yeon, S. Y.; Yoon, S.-H.; Kang, C. M.; Han, S. H.; Lee, D.; Chung,
T. D., A Miniaturized Reverse Electrodialysis-Powered Biosensor Using
Electrochemiluminescence on Bipolar Electrode. Analytical chemistry 2018.
117. Wang, Y.-Z.; Xu, C.-H.; Zhao, W.; Guan, Q.-Y.; Chen, H.-Y.; Xu, J.-J., Bipolar Electrode
Based Multicolor Electrochemiluminescence Biosensor. Analytical chemistry 2017, 89 (15), 8050-
8056.

36
118. Wu, M.-S.; Qian, G.-s.; Xu, J.-J.; Chen, H.-Y., Sensitive electrochemiluminescence
detection of c-Myc mRNA in breast cancer cells on a wireless bipolar electrode. Analytical
chemistry 2012, 84 (12), 5407-5414.
119. Wang, F.; Fu, C.; Huang, C.; Li, N.; Wang, Y.; Ge, S.; Yu, J., based closed Au-Bipolar
electrode electrochemiluminescence sensing platform for the detection of miRNA-155. Biosensors
and Bioelectronics 2020, 150, 111917.
120. Feng, Q.; Chen, H.; Xu, J., Disposable paper-based bipolar electrode array for multiplexed
electrochemiluminescence detection of pathogenic DNAs. Science China Chemistry 2015, 58 (5),
810-818.
121. Liu, H.; Zhou, X.; Liu, W.; Yang, X.; Xing, D., based bipolar electrode
electrochemiluminescence switch for label-free and sensitive genetic detection of pathogenic
bacteria. Analytical chemistry 2016, 88 (20), 10191-10197.
122. Zhang, H.-R.; Wang, Y.-Z.; Zhao, W.; Xu, J.-J.; Chen, H.-Y., Visual color-switch
electrochemiluminescence biosensing of cancer cell based on multichannel bipolar electrode chip.
Analytical chemistry 2016, 88 (5), 2884-2890.
123. Wu, M.-S.; Yuan, D.-J.; Xu, J.-J.; Chen, H.-Y., Sensitive electrochemiluminescence
biosensor based on Au-ITO hybrid bipolar electrode amplification system for cell surface protein
detection. Analytical chemistry 2013, 85 (24), 11960-11965.
124. Jin, L.; Qiao, J.; Chen, J.; Xu, N.; Wu, M., Combination of area controllable sensing surface
and bipolar electrode-electrochemiluminescence approach for the detection of tetracycline.
Talanta 2020, 208, 120404.
125. Wu, M. S.; Liu, Z.; Xu, J. J.; Chen, H. Y., Highly specific electrochemiluminescence
detection of cancer cells with a closed bipolar electrode. ChemElectroChem 2016, 3 (3), 429-435.

37
126. Shi, H.-W.; Wu, M.-S.; Du, Y.; Xu, J.-J.; Chen, H.-Y., Electrochemiluminescence
aptasensor based on bipolar electrode for detection of adenosine in cancer cells. Biosensors and
Bioelectronics 2014, 55, 459-463.
127. Wu, M.-S.; Yuan, D.-J.; Xu, J.-J.; Chen, H.-Y., Electrochemiluminescence on bipolar
electrodes for visual bioanalysis. Chemical Science 2013, 4 (3), 1182-1188.
128. Shi, H.-W.; Zhao, W.; Liu, Z.; Liu, X.-C.; Xu, J.-J.; Chen, H.-Y., Temporal sensing
platform based on bipolar electrode for the ultrasensitive detection of cancer cells. Analytical
Chemistry 2016, 88 (17), 8795-8801.
129. Eßmann, V.; Jambrec, D.; Kuhn, A.; Schuhmann, W., Linking glucose oxidation to
luminol-based electrochemiluminescence using bipolar electrochemistry. Electrochemistry
Communications 2015, 50, 77-80.
130. Sentic, M.; Arbault, S.; Goudeau, B.; Manojlovic, D.; Kuhn, A.; Bouffier, L.; Sojic, N.,
Electrochemiluminescent swimmers for dynamic enzymatic sensing. Chemical Communications
2014, 50 (71), 10202-10205.
131. Hiramoto, K.; Pai, H.-J.; Ino, K.; Nashimoto, Y.; Shiku, H., Electrochemical measurement
of respiratory activity for evaluation of fibroblast spheroids containing endothelial cell networks.
Electrochimica Acta 2020, 135979.
132. Ino, K.; Onodera, T.; Kanno, Y.; Suda, A.; Kunikata, R.; Matsue, T.; Shiku, H.,
Electrochemicolor imaging of endogenous alkaline phosphatase and respiratory activities of
mesenchymal stem cell aggregates in early-stage osteodifferentiation. Electrochimica Acta 2018,
268, 554-561.
133. Ge, S.; Zhao, J.; Wang, S.; Lan, F.; Yan, M.; Yu, J., Ultrasensitive
electrochemiluminescence assay of tumor cells and evaluation of H2O2 on a paper-based closed-

38
bipolar electrode by in-situ hybridization chain reaction amplification. Biosensors and
Bioelectronics 2018, 102, 411-417.
134. Chen, X.; Yin, J.; Zhang, C.; Lu, N.; Chen, Z., Determination of Brilliant Blue FCF by a
Novel Solid-state ECL Quenching Sensor of Ru (bpy) 32+-poly (sulfosalicylic acid)/GCE.
Analytical Sciences 2017, 33 (10), 1123-1128.
135. Kong, D.; Liu, Y.; Wang, Z.; Jiang, L.; Cheng, J.; Xu, L.; Zhuang, Q.; Lu, C.-H.; Chi, Y.;
Wei, Q.-h., Establishment of an electrochemiluminescence quenching method for ribavirin
detection in Ru (bpy) 32+/TEA system. Journal of Electroanalytical Chemistry 2017, 801, 1-6.
136. Wang, T.; Fan, S.; Erdmann, R.; Shannon, C., Detection of ferrocenemethanol and
molecular oxygen based on electrogenerated chemiluminescence quenching at a bipolar electrode.
Langmuir 2013, 29 (51), 16040-16044.
137. Fan, S.; Shannon, C., Electrochemiluminescence quenching by halide ions at bipolar
electrodes. Electroanalysis 2016, 28 (3), 533-538.
138. Tisserant, G.; Gillion, J.; Lannelongue, J.; Fattah, Z.; Garrigue, P.; Roche, J.; Zigah, D.;
Kuhn, A.; Bouffier, L., Single‐Step Screening of the Potential Dependence of Metal Layer
Morphologies along Bipolar Electrodes. ChemElectroChem 2016, 3 (3), 387-391.
139. Ramakrishnan, S.; Shannon, C., Display of solid-state materials using bipolar
electrochemistry. Langmuir 2010, 26 (7), 4602-4606.
140. Ramaswamy, R.; Shannon, C., Screening the Optical Properties of Ag− Au Alloy
Gradients Formed by Bipolar Electrodeposition Using Surface Enhanced Raman Spectroscopy.
Langmuir 2010, 27 (3), 878-881.
141. Magenau, A. J.; Strandwitz, N. C.; Gennaro, A.; Matyjaszewski, K., Electrochemically
mediated atom transfer radical polymerization. Science 2011, 332 (6025), 81-84.

39
142. Kong, S.; Fontaine, O.; Roche, J. r. m.; Bouffier, L.; Kuhn, A.; Zigah, D.,
Electropolymerization of polypyrrole by bipolar electrochemistry in an ionic liquid. Langmuir
2014, 30 (11), 2973-2976.
143. Ongaro, M.; Gambirasi, A.; Favaro, M.; Kuhn, A.; Ugo, P., Asymmetrical modification of
carbon microfibers by bipolar electrochemistry in acetonitrile. Electrochimica Acta 2014, 116,
421-428.
144. Beaujuge, P. M.; Reynolds, J. R., Color control in π-conjugated organic polymers for use
in electrochromic devices. Chemical reviews 2010, 110 (1), 268-320.
145. Loget, G.; Roche, J. r.; Gianessi, E.; Bouffier, L.; Kuhn, A., Indirect bipolar
electrodeposition. Journal of the American Chemical Society 2012, 134 (49), 20033-20036.
146. Loget, G.; Roche, J.; Kuhn, A., True bulk synthesis of Janus objects by bipolar
electrochemistry. Advanced materials 2012, 24 (37), 5111-5116.
147. Koizumi, Y.; Nishiyama, H.; Tomita, I.; Inagi, S., Templated bipolar electrolysis for
fabrication of robust Co and Pt nanorods. Chemical Communications 2018, 54 (74), 10475-10478.
148. Fattah, Z.; Loget, G.; Lapeyre, V.; Garrigue, P.; Warakulwit, C.; Limtrakul, J.; Bouffier,
L.; Kuhn, A., Straightforward single-step generation of microswimmers by bipolar
electrochemistry. Electrochimica acta 2011, 56 (28), 10562-10566.
149. Bradley, J. C.; Crawford, J.; Ernazarova, K.; McGee, M.; Stephens, S. G., Wire formation
on circuit boards using spatially coupled bipolar electrochemistry. Advanced Materials 1997, 9
(15), 1168-1171.
150. Bradley, J.; Dengra, S.; Gonzalez, G.; Marshall, G.; Molina, F., Ion transport and deposit
growth in spatially coupled bipolar electrochemistry. Journal of Electroanalytical Chemistry 1999,
478 (1-2), 128-139.

40
151. Bradley, J.-C.; Babu, S.; Carroll, B.; Mittal, A., A study of spatially coupled bipolar
electrochemistry on the sub-micrometer scale: colloidal particles on surfaces and cylinders in
nuclear-track etched membranes. Journal of Electroanalytical Chemistry 2002, 522 (1), 75-85.
152. Sheridan, E.; Knust, K. N.; Crooks, R. M., Bipolar electrode depletion: membraneless
filtration of charged species using an electrogenerated electric field gradient. Analyst 2011, 136
(20), 4134-4137.
153. Hlushkou, D.; Perdue, R. K.; Dhopeshwarkar, R.; Crooks, R. M.; Tallarek, U., Electric
field gradient focusing in microchannels with embedded bipolar electrode. Lab on a Chip 2009, 9
(13), 1903-1913.
154. Anand, R. K.; Sheridan, E.; Hlushkou, D.; Tallarek, U.; Crooks, R. M., Bipolar electrode
focusing: tuning the electric field gradient. Lab on a chip 2011, 11 (3), 518-527.
155. Hagg, C. M.; Skyllas-Kazacos, M., Novel bipolar electrodes for battery applications.
Journal of applied electrochemistry 2002, 32 (10), 1063-1069.
156. Zhu, L.; Lei, A.; Cao, Y.; Ai, X.; Yang, H., An all-organic rechargeable battery using
bipolar polyparaphenylene as a redox-active cathode and anode. Chemical Communications 2013,
49 (6), 567-569.
157. Knust, K. N.; Hlushkou, D.; Anand, R. K.; Tallarek, U.; Crooks, R. M., Electrochemically
mediated seawater desalination. Angewandte Chemie 2013, 125 (31), 8265-8268.

41
Chapter 2
Reduction of 4-nitrothiophenol on Ag/Au Bimetallic Alloy Surfaces Studied Using Bipolar
Raman Spectroelectrochemistry
2.1 Introduction
Spectroelectrochemical methods are widely used in analytical chemistry, materials science,
and chemical biology/biophysics, and the field recently has been reviewed.1 While this family of
analytical methods encompasses a wide range of possible measurements, typically, voltammetry,
amperometry or electrochemical impedance spectroscopy, are coupled with UV-vis, fluorescence,
Fourier transform infrared (FTIR), or surface enhanced Raman spectroscopy (SERS) to acquire
information-rich, multidimensional data sets.
Since its discovery in 1974, SERS has become a powerful and widely employed tool to study
surface-mediated chemical processes due to its high sensitivity and selectivity.2-5 In particular, the
use of laser excitation allows SERS to be applied in diverse environments ranging from ultrahigh
vacuum to the liquid-solid interface as well as to acquire spectroscopic data from local regions of
interest on a surface.
Bipolar electrochemistry has attracted significant attention recently as a platform to study
fundamental aspects of electron transfer6, electrodeposition7-8, and chemical sensing9-10. In a
bipolar electrochemical circuit, the working electrode is interrogated using an externally applied
voltage that generates a gradient of interfacial potential in one direction along the working
electrode, providing a ‘snapshot’ of the system’s voltammetric behavior that can be read out using
spectroscopic techniques.11 Thus, leveraging the ability of Raman microscopy to probe local
regions of the surface with the snapshot aspect of a bipolar circuit, makes the development of

42
bipolar Raman spectroelectrochemistry an obvious direction to expand the toolkit for surface
analytical measurements (Figure 2.1).12
Figure 2.1 Bipolar Raman spectroelectrochemistry. Spectral data can be acquired along the
potential gradient and the spatial dimension normal to it. In this study, the alloy composition varies
along the second dimension.
Bimetallic alloys are a category of materials in which two metals with different physical and
chemical properties are combined, leading to enhanced or unique optical13, catalytic14, electronic15,
and photochemical16 behaviors. Noble metals, especially Au and Ag, can not only enhance Raman
signal due to their plasmon resonance, but also act as catalysts17-20 and are thus of interest as a
testbed for developing bipolar Raman spectroelectrochemistry (BRSE). In general, Au particles
with diameters smaller than 10 nm show remarkable catalytic activities but poor SERS, while
diameters larger than 20 nm exhibit good SERS but poor catalytic activities. Silver particles
provide stronger SERS signal than Au particles, but worse stability.21-23 Therefore, researches on

43
SERS14, 24 and catalysis25-27 using the Au/Ag bimetallic synergistic effect have become
widespread. Yin, et al.25 synthesized hybrid Au−Ag alloy particles and nanochains (NCs) to better
harvest visible light energy for selective hydrogenation reactions. The results show the conversion
and turnover frequency (TOF) of individual Au/Ag particles with Au25 (25nm Au particles) cores,
are approximately 8 and 10 times higher than those of Au25 particles. Crooks group28 studied the
catalytic activity trends of random PtAu and PdAu alloy dendrimer-encapsulated particles with an
average size of ∼1.6 nm towards allyl alcohol hydrogenation. Specifically, PtAu alloy particles
had a linear increase in activity with increasing Pt ratio, while PdAu dendrimer-encapsulated
particles show a maximum activity at a Pd composition of ∼60%. This behavior was ascribed to
the differences in H binding strength on the PtAu and PdAu alloy surfaces. Moreover, by taking
advantage of the interfacial polarization under bipolar chemistry, a bimetallic alloy composition
gradient can be achieved on the cathode side of the bipolar electrode (BPE). For example, the
Bouffier group29 reported a straightforward, single-step generation of metal composition gradients
in both a monometallic layer and a bimetallic composite layer based on copper and nickel, on
cylindrical carbon fibers using bipolar chemistry. In previous work, our group has successfully
formed CdS on Au substrate30 and Au-Ag alloy gradient on stainless steel under bipolar
electrodeposition, exploiting the gradient of interfacial potential at the interface of the BPE and
electrolytic solution.31
In this paper, we present a method for the real-time, in situ characterization of surface
processes on electrode surfaces that employs Raman spectroscopy and a bipolar electrochemical
circuit. Bimetallic alloy of Ag/Au with significant Raman enhancement is prepared first on the
BPE surface with a surface gradient using a pre-bipolar electrochemical deposition. The
electrochemical reduction of 4-nitrothiophenol (NTP) was used to demonstrate the feasibility of

44
this approach, because both the oxidized and reduced forms are Raman active. By using BRSE,
the NTP reduction process on Ag/Au alloy surface could be detailed characterized with changing
alloy composition and cathodic overpotential simultaneously in a 2D profile system. This real-
time, in situ Raman characterization under bipolar electrochemistry enable the investigation of the
dependence of electrochemical process on multiple parameters such as substrate composition, and
applied potential, capable of rapid discovery of efficient electrocatalysts.
2.2 Experimental Section
2.2.1 Materials and Reagents
All solutions were prepared with deionized, ultra-pure water (VWR Type II). Stainless Steel
foil (0.1mm, Alfa Aesar), Gold foil (0.1mm thick, 99.99% trace metals, Sigma-Aldrich), Silver
nitrate (99.9+%, metals basis, Alfa Aesar), Potassium cyanide (97%, Sigma-Aldrich), Sodium
hydroxide (98.4%, Fisher Scientific), Gold chloride (HAuCl4⸱3H2O) (VWR), 4-nitrothiophenol
(80%, Alfa Aesar), Sodium perchlorate nomohydrate (≥99.0%, Fluka analytical), Potassium
Chloride (crystals, BDH Chemicals), Potassium nitrate (99.7%, Fisher Scientific), Ethyl Alcohol
(200 Proof, ACS/USP grade, Pharmco-Aaper), Potassium Ferricyanide(III) powder (99%, Sigma-
Aldrich), Capillary tubes (I.D. 1.1-1.2 mm, Wall 0.2 ± 0.02 mm, Kimble Chase), Silver wire
(0.25mm diameter, 99.99%, Sigma-Aldrich), Potassium dicyanoargentate ( KAg(CN)2, Sigma-
Aldrich), Potassium dicyanoaurate(I) (KAu(CN)2, 98%, Sigma-Aldrich).
2.2.2 Preparation of Bipolar Electrochemical Cell Frames
Electrochemical cell frames were prepared using 3D-printer (MakerBot Replicator 2). As
Figure 2.2 showed, three dimensions of (A) cell frame are 60 mm long ×72 mm wide (driving
electrode width) × 10 mm deep, (B) cell frame are 60 mm long ×25 mm wide (driving electrode
width) × 10 mm deep.

45
Figure 2.2 Bipolar electrochemical cell frames. (A) cell frame used for electrodeposition; (B) cell
frame used for Raman characterizing.
2.2.3 Self-made tiny Ag/AgCl Reference Electrodes for Solution Potential Measurement
To measure the solution potential more precisely, two tiny Ag/AgCl reference electrodes were
prepared as measuring tips. The processes of making Ag/AgCl reference electrodes are as below:
Hydrogen flame was used to melt capillary tube into micrometer size hole, and it was cut
according to the length required. Then it was filled with 1 M KCl solution. The oxidized silver
wire was placed into it and sealed the top with tape. Prior to the preparation of the oxidized silver
wire, first, the silver wire was slightly polished with sand paper (micro cut, 1200 grit, purchased
from BUEHLER), then washed with deionized (D.I.) water and dried with stream of nitrogen,
followed by dipping the silver wire into HNO3 solution (assay 68%-70%, purchased from
Pharmco-Aaper) for 2 mins, then it was cleaned with D.I. water and dried with stream of nitrogen.
Using cyclic voltammetry in 1 M KCl solution (standard commercial Ag/AgCl electrode was used
as reference electrode), the oxidation peak was observed, and then the oxidization peak potential
was hold for 2-3 mins to oxidize the silver wire surface using Bulk Electrolysis method.
Self-made Ag/AgCl reference electrodes only used for measuring solution potential. All the
experiments that involved three electrode systems were used standard commercial Ag/AgCl
reference electrode.

46
2.2.4 Setup of Solution Potential Measurement
In order to study the solution potential distribution in the electrochemical cell, the bipolar
solution potential differences located at the edges and middle across the BPE length was measured
in cell B from Figure 2.2 using oscilloscope (Hantek DSO8060), 0.1 M NaClO4 solution was used
as electrolyte and applied 6V across the Au driving electrodes. The bipolar across length is 26 mm.
Also, to study the stability of solution potential, the potential across 30 mm length in the middle
of the bipolar cell was measured for close 2 hours under 6V across the bipolar cell.
2.2.5 Electrodeposition of Ag/Au on Stainless Steel Substrate Using Bipolar System
The bipolar cell frame used for the experiment is the frame (A) that is shown in Figure 2.2.
Stainless steel was used as bipolar and driving electrodes that were pretreated by polishing with
sandpaper and sonicated in alcohol solution (volume ratio of ethyl alcohol: water equals 1) for 5
mins, and finally washed with D.I. water and dried with the flow of nitrogen gas. The shape and
the dimensions of BPE are shown in Figure 2.3(A). About half of the size covered with parafilm.
Finally, it was placed in the middle of the bipolar cell.
Figure 2.3 (A) Electrodeposition Bipolar shape and dimension sizes, the red part covered with
parafilm, (B) the cut new BPE with alloy side dipped in NTP solution to form self-assembled
monolayer, (C) Raman scanning sequence of BPE cartoon.

47
Precursor solution for the deposition of Ag/Au alloy using 30 mM of 𝐻𝐴𝑢𝐶𝑙4 and 30 mM
𝐴𝑔𝑁𝑂3 in 300 mM KCN solution and pH was adjusted to 12 using NaOH solution.
For electrodeposition, 6.5 V was applied to the driving electrodes for 3 mins.
2.2.6 SEM-EDX Measurement
Scanning Electron Microscopy (SEM) images were collected using Joel JSM-7000f Field
Emission Microscope and analyzed using EOS 7000F software package. EDX data were acquired
using an Oxford X-Max energy dispersive X-ray spectrometer and were analyzed using the INCA
software package.
2.2.7 Setup of Bipolar Cell for Raman Spectroscopy
After electrodeposition of Ag/Au, the top electrodeposited part that has the Ag/Au gradient
ratio was cut to form the new BPE for the Raman characterization. Prior to characterization by
BRSE, the BPE was cut into a dimension of 26 mm long × 7 mm wide, and the side with the
electrodeposited part dipped into 1 mM NTP solution, which was dissolved in ethyl alcohol, for 2
hours in the dark environment to form the self-assembled monolayer (The stainless-steel side
covered with parafilm). Then the alloy part with NTP monolayer was washed with ethyl alcohol
and DI water, respectively, and then dried with stream of nitrogen.
The BPE was placed such a way that the part covered by NTP was directed toward anodic
driving electrode. The cell was filled with 0.1 M NaClO4 solution. Gold foils were used for driving
electrodes. 6 V was applied and waited for about 12 mins. Then Raman scanning was started from
the side edge part horizontally as ‘S’ sequence towards the middle part of the BPE, as shown in
Figure 2.3(C). And the data collected under nitrogen environment. The distance between two
adjacent scanning dots is 1 mm. Raman scanning was used 785nm (18 mW power was used for
Raman measurement) output from a wavelength stabilized high power laser diode system (model

48
SDL – 8530, SDL Inc.). Raman measurement and analysis were performed using a Renishaw inVia
Raman microscope system, and Raman signals were accumulated for 10 second.
2.3 Results and Discussion
2.3.1 Electrodeposition of Ag/Au Alloy on Stainless Steel BPE Substrate
In bipolar electrochemistry, a linear potential gradient will be generated in the solution across
the cell under the influence of external electric field. The interfacial potential, notes as the potential
difference between the solution and the BPE, is the driving force that leads to reduction or
oxidation, respectively. Due to the solution potential difference, it will possess a certain value at
each local position across the BPE, showing a varying overpotential for faradaic reaction. In the
application of electrodeposition, the designed material would be deposited along the BPE cathode
at different rate with continuous change in cathodic overpotential. In our experimental design, to
have bimetallic Ag/Au alloy on the substrate, a co-depositing solution consisted of both Ag and
Au anions should be prepared. The alloy gradient, with varying percentage ratio of Ag/Au along
the cathode of BPE, can only be established by the presence of reduction potential separation in
two different deposition regents. For example, a co-depositing solution of 𝐾𝐴𝑔(𝐶𝑁)2 and
𝐾𝐴𝑢(𝐶𝑁)2 is not appropriate with similar reduction potentials. As illustrated in Figure 2.4, the
reduction peak of Ag complex and Au complex ions are not distinguishable, which demonstrates
the co-depositing solution of 𝐾𝐴𝑔(𝐶𝑁)2and 𝐾𝐴𝑢(𝐶𝑁)2 is not a good selection to achieve Ag/Au
alloy gradient. In addition to the reagent selection, the pH of deposition solution should be
carefully controlled due to possible hydrogen evolution in aqueous solution would give rise to
inconsistency on the alloy morphology and incontinuity of gradient distribution.

49
Figure 2.4 Linear Sweep Voltammogram scanned in 10 mM KAu(CN)2 and 10mM KAg(CN)2
with 200mM KCN supporting electrolyte solution, pH=12. Ag/AgCl electrode as reference
electrode, Pt grid as counter electrode, stainless-steel as working electrode, scan rate: 100mV/s.
𝐻𝐴𝑢𝐶𝑙4 and 𝐴𝑔𝑁𝑂3 were finally selected as deposition reagent in KCN solution, with pH
adjusted by 0.1 M NaOH to a value of 12 to avoid the generation of HCN during electrodeposition
process. In the cyanide solution, 𝐴𝑔+ ions from 𝐴𝑔𝑁𝑂3 would chelate with 𝐶𝑁− and form
[𝐴𝑔(𝐶𝑁)2]−complex, while [𝐴𝑢(𝐶𝑙)4]−, from 𝐻𝐴𝑢𝐶𝑙4, will undergo a ligand exchange reaction
to form a new complex [𝐴𝑢(𝐶𝑁)4]− as the result of their high formation constant by the
substitution of 𝐶𝑁− to 𝐶𝑙− . First, cyclic voltammetry was carried out by scanning the co-
deposition solution with newly formed [𝐴𝑢(𝐶𝑁)4]− and [𝐴𝑔(𝐶𝑁)2]−complex form -0.5 V to -1.6
V, at a scan rate of 50 mV/s. Pt grid was used as the counter electrode and standard Ag/AgCl
electrode was used as reference electrode. As is shown in Figure 2.5(A), the reduction potential of
[𝐴𝑔(𝐶𝑁)2]− locates at ca. -1.2 V, and the reduction potential of [𝐴𝑢(𝐶𝑁)4]− locates at about -
1.45 V. This reduction potential separation could be mainly assigned as the difference in formation

50
constant of [𝐴𝑢(𝐶𝑁)4]−complex at ⁓1056, and [𝐴𝑔(𝐶𝑁)2]−complex at 5.6 × 10¹⁸ respectively.
Also, the aforementioned similarity in reduction potential between [𝐴𝑢(𝐶𝑁)2]− and
[𝐴𝑔(𝐶𝑁)2]−complexes, can now maybe explained by their much more closed formation constants
of 2 × 1038 and 5.6 × 1018.32 The considerable reduction potential separation between
[𝐴𝑢(𝐶𝑁)4]−and [𝐴𝑔(𝐶𝑁)2]−, would allow Au/Ag alloy to be deposited on the surface of stainless
steel substrate in the bipolar system, with an increasing percentage ratio of Au towards end along
the BPE cathode.
Figure 2.5 Cyclic voltammogram of co-deposition solution (A), scan rate 50 mV/s. SEM image
of the Ag/Au alloy (B), bar size: 1 μm. The alloy gradient composition obtained from EDX
measurements along the major and minor axes of the BPE cathode (C, D). Error bars indicate the
standard deviation of three independent measurements.

51
Electrodeposition was carried out on the stainless steel BPE substrate in the bipolar cell frame
(A) from Figure 2.2 using this co-deposition solution under 6.5V for 3min. One side of the
substrate served as the BPE cathode for deposition and the other side on the bottom served as the
BPE anode for corresponding oxidation reaction. Due to half of the cathode was covered by
parafilm, Ag/Au bimetallic alloy would only be deposited on the other half cathodic side of the
stainless-steel substrate. As discussed, the cyanide solution was titrated to a basic condition with
pH value equals to 12. Two benefits could be obtained from this pH adjustment. On one hand,
cyanide solution, as the common deposition solution environment which provides a stabilized
metal-cyanide complex for uniform film coverage, in the bipolar electrodeposition, the oxidation
of water on the driving anode would produce 𝐻+locally and possibly form HCN with 𝐶𝑁−, by
setting the solution pH to a much more basic condition, the formation of toxic HCN could be
avoided. On the other hand, even though at pH =12, hydrogen evolution is still present during the
process of Ag and Au deposition as shown in a step-down trend in the CV curve, the extent of
bubble generation would be minimized and provide a relative uniform morphology and continuous
bimetallic alloy ratio across the BPE substrate cathode as demonstrated in the following SEM and
EDX characterization.
After the pre-electrodeposition, the deposited part as cathode was cut off from the stainless-
steel substrate for characterization. In future discussion, this cathode strip was turned 90 degree
and would serve as another whole BPE body for subsequent BRSE study. Here we defined the
major axis as the length along the new BPE, which would be parallel to the electric field in the
new bipolar cell. The minor axis across the width, which is along the Ag/Au bimetallic alloy
gradient, would be vertical to the electric field. Figure 2.5(B) shows the SEM image of the half
cathode strip which is not covered by parafilm during electrodeposition. Ag/Au alloy is

52
successfully deposited on the surface of stainless steel with consistent poly-crystalline structure
and fully covered the substrate. These polycrystals are “needle-like” shapes with about 1 µm in
length and 0.3 µm in width with uniform distribution. The alloy composition gradient is
characterized synchronously by using Ag mole ratio acquired from EDX measurement, across two
directions of the deposited BPE. In the plot illustrated in Figure 2.5(C), Ag mole ratio of the alloy
changes gradually from around 50% to 100% crossing 4 mm length along the minor axis. The
standard deviation, less than 2.5% in each point as shown in the error bar, is calculated from
measurement of three sampling points at the same distance in minor axis but different position in
major axis. While in Figure 2.5(D), it exhibits an identical Ag mole ratio along the major axis,
with standard deviation less than 1.4% in each point. The consistent change of Ag/Au alloy
gradient along the major axis and its uniformity along the horizontal distance strongly suggested
that the half cathode strip could be employed as the new BPE substrate for NTP monolayer
immobilization on varying bimetallic alloy composition.
2.3.2 Solution Potential Profile in Bipolar Cell System
The reduction of NTP molecules on electrode surface is very sensitive to the overpotential
applied, especially for monolayer with small amount of coverage. For the purpose of addressing
the kinetics of reduction of NTP monolayer under same overpotential on the substrate with varying
bimetallic alloy composition in our BRSE system, the interfacial potential at each local point
across the BPE minor axis, vertical to the electric field applied by driving electrodes, must be
carefully controlled to ensure the same value. Since the bipolar electrode in the cell is an equal
potential body with an equilibrium potential adjusted by the surrounding solution potential, the
interfacial potential variations along the BPE minor axis, could be just represented by the solution
potential at each point next to the BPE. Instead of the absolute value, the solution potential was

53
measured as the difference across the BPE length. Voltage of 6V, which was proven to be
appropriate for later NTP reduction study in BRSE, was applied in the BPE cell B (Figure 2.2) in
0.1M NaClO4 solution. Three measurements were made individually along the BPE major axis
line at left edge, middle and right edge of the cell with locating two self-made Ag/AgCl reference
electrodes at the BPE distance. As was shown in Figure 2.6(A), they have the magnitudes at ca.
1.2V with about 17mV standard deviation. The almost same values confirm the same overpotential
along the BPE minor axis with bimetallic alloy composition gradient during the Raman scattering
operation.
Figure 2.6 (A) Solution potential difference ∆Ebpe between the end of cathode and the end of
anode of BPE length at the left edge, middle and right edge in the Raman Bipolar cell (6 V applied
voltage on Au driving electrode, and the length of BPE is 26mm). (B) Potential difference ∆Ebpe
as a function of time in the middle major axis line (6 V applied voltage on Au driving electrode,
and the length of BPE is 30mm).
In addition, the overpotential stability during following bipolar Raman characterization was
examined by potential-time dependent measurement using the oscilloscope. Taking the major axis
line in the middle as an example in Figure 2.6(B), the solution potential difference between the

54
anode and cathode is considerable stable for close two hours, about 1.4 V with an 20mV standard
deviation, indicating its stability and applicability of collecting consecutive Raman spectrum
during bipolar electrochemistry for cathodic NTP reduction.
2.3.3 Characterization of the Reduction of NTP Monolayer on Bimetallic Ag/Au Alloy Using
BRSE
NTP molecule has a high affinity to metal surfaces and its electrochemical reduction
mechanisms process differs depending on the materials of substrate and reaction conditions. As
illustrated in Figure 2.7(A), on Au substrate, the NTP favors the direct reduction to 4-
aminothiophenol (4-ATP), while using Ag substrate, the NTP reduction goes through an
intermediate process of 4,4’-dimercaptoazobenzene (DMAB) to 4-ATP.33 Since 514nm laser from
Raman spectrometer has a strong photo driven effect of NTP reduced to DMAB34-35, 785nm laser
was used to characterize the reduction process of NTP on bimetallic alloy (Ag/Au).
The NTP monolayer on substrate used for Raman characterization was prepared by dipping
the new BPE, which was covered by Ag/Au alloy with gradient as mentioned, in NTP solution for
2 hours. Then the BPE was placed in the bipolar cell with its NTP side towards the driving anode.
According to our potential profile measurement, all NTP molecules along the minor axis with same
major coordinate on the bipolar substrate would have the same cathodic overpotential for
electrochemical reduction. Due to Ag/Au alloy gradient is across the minor axis, NTP reduction
could be studied as a function of alloy composition under same cathodic overpotential. Also, the
consistent Ag mole ratio of alloy across the major axis endows the study of NTP reduction as a
function of cathodic overpotential under same alloy composition. Consequently, the 2D profile of
reduction process on NTP molecules with varying cathodic overpotential and alloy composition

55
based on Ag mole ratio could be recorded by using in situ Raman characterization under bipolar
electrochemistry in equilibrium state.
Figure 2.7(B) illustrates the CVs of NTP monolayer on the surface of three different
substrates in 0.1 M NaClO4 solution. Au, Ag, and Ag/Au on the surface of stainless steel were
electrodeposited by applying around (-1.5) V with Bulk Electrolysis (BE from AfterMath software
on PINE Potentiostat) for 60 seconds to the stainless-steel sheets dipping in 𝐻𝐴𝑢𝐶𝑙4 (30 mM),
𝐴𝑔𝑁𝑂3 (30 mM), and the 𝐻𝐴𝑢𝐶𝑙4: 𝐴𝑔𝑁𝑂3 (30 mM, 1:1) solutions containing 300 mM KCN
supporting electrolyte with pH=12, respectively. Then followed by immersing in NTP solution for
2 hours. As the CVs (Figure 2.7(B)) demonstrate that the reduction of NTP occurs at less negative
potential at the gold substrate surface in compared with silver and Ag/Au alloy showed that the
gold substrate has better catalytic ability for the reduction of NTP molecules.
As mentioned, immobilized NTP monolayer on Ag/Au alloy surface would undergo two main
reduction processes under enough negative potential, and the time it takes for its reduction to the
equilibrium state depends on the reduction potential, laser power and wavelength. In our case, the
latter two parameters are fixed during the whole experiment and waited for 12min after applied
the potential to begin the Raman spectra measurement. That is in accordance with others reports
that the Raman peaks would reach a steady state after a period of time.10, 22 This equilibrium state
reached after a certain time could thus lay the foundation for our system with lasting multiple
Raman spectra acquisitions spatially under bipolar electrochemistry with stable cathodic
overpotential distribution. The Raman spectrum of NTP at equilibrium states on Ag/Au alloy
substrate is shown in Figure 2.7(C). The vibrational bands at 1080, 1335, and 1572 cm-1, are
corresponding to C S stretching, O N O stretching, and the phenyl ring modes, respectively.
Raman bands at 1140, 1390, and 1434 cm-1, which mainly from the DMAB, correspond to C N

56
symmetric stretching, N=N stretching, and C H in plane bending modes, respectively. In addition,
during the process of NTP molecules reduction to ATP, the 1572 cm-1 band would decrease and
finally disappear, and a new band at 1594 cm-1 would generate.
Figure 2.7 (A) Schematic NTP reduction mechanisms of (1) direct reduction to 4-
aminothiophenol (ATP) and (2) through an intermediate 4,4’-dimercaptoazobenzene (DMAB) to
ATP. (B) CVs of NTP monolayer on three different substrates: Au, Ag and Ag/Au alloy on
stainless-steel, respectively, in 0.1M NaClO4 solution bubbled with nitrogen, scan rate: 5 mV/s.
(C) Raman spectrum of NTP at equilibrium states on Ag/Au alloy.
In our BRSE study, the peak at 1335 cm-1 from O N O stretching of NTP and peak at 1434
cm-1 peak is one from C H in plane bending of DMAB are selected to address NTP reduction and
the formation of intermediate. In virtue of the same existence of C S stretching in NTP and its
reduction product, this peak at 1080 cm-1 could be used as reference peak for Raman intensity

57
normalization. I1335/I1080 and I1434/I1080, (short for the peak height intensity at 1335 and 1434 cm-1
divided by the reference peak height intensity at 1080 cm-1, respectively), as characterizing the
NTP reduction rate parameters. Also, because of the gradual disappearance of peak at 1572 cm-1
and appearance of new peak at 1594 cm-1, R= (I1594-I1572)/(I1594+I1572) is served as a third parameter
to characterize the NTP reduction. This third parameter would be more accurate compared to
I1594/I1080 since It could show the whole shifting peak changing from band 1572 cm-1 to 1594 cm-
1, which represents the process of NTP reducing to ATP, and increase the normalized intensity for
the low intensity value of 𝐼1594 compared to that of 𝐼1080 as well.
The BRSE study was operated under 6V of applied voltage, with half of the BPE covered by
NTP with Ag/Au alloy gradient underneath. Sequential Raman signals were collected along the
major and minor axis with varying alloy composition and cathodic overpotential in a zig-zag
pattern after reaching equilibrium state. Three normalized Raman peaks profiles, I1335/I1080, R, and
I1434/I1080 are plotted as a function of calibrated cathodic overpotential and Ag mole ratio in a 2D
profiles in Figure 2.8(B), (C), (D), separately.
In order to find out the differences of catalytic ability of alloy composite for the NTP
reduction, the reduction potential of NTP showed on Raman peaks 2D profiles combine to that
showed with cyclic voltammogram would be a better way, in other words, the potential showed
on Raman 2D profile is relative potential versus Ag/AgCl reference electrode. Since the reduction
of NTP monolayer on substrate surface is irreversible (showed on Figure 2.9 (C) and (D)), and the
exact actual reduction potential on specific position of BPE is hard to know, the way to achieve
the calculated reduction potential showed in the 2D profiles as follows (showed on Figure 2.9):
Firstly, choose the Ep/2 of cyclic voltammogram of NTP reduction on steel-Au substrate equals the
reduction potential on the position in which R=0 of Raman 2D profile on the same substrate, since

58
the solution potential gradient can get from Figure 2.10, we can calculate every reduction potential
of the spot on the BPE, therefore, the calculated reduction potential can achieve for the Raman 2D
profile; Secondly, use the calculated reduction potential profile from first part to check the NTP
reaction on steel-Ag substrate to double check whether this method is reasonable, turned out the
reduction potential on the position in which R=0 of Raman 2D profile on steel-Ag substrate is
almost same with the Ep/2 of cyclic voltammogram of NTP reduction on same substrate. Therefore,
this way to calculate the reduction potential on the Raman 2D profile is reasonable.
Figure 2.8 Raman spectra (A) acquired at -625 mV at the indicated alloy compositions.
Normalized Raman peak intensity profiles for R (B), I1335/I1080 (C), and I1434/I1080 (D).

59
Figure 2.8 (A) and (B) are normalized Raman peak intensities of I1335/I1080, (I1594-I1572)/(I1594+I1572)
as a function of distance from the BPE cathodic edge measured on Au and Ag substrate under 6V
applied voltage on the driving electrodes, respectively; (C) and (D) are voltammograms of NTP
reduction on different substrates as Ag/AgCl reference electrode in 0.1 M NaClO4 solution under
nitrogen atmosphere with a scan rate of 5 mV/s, Pt grid as counter electrode.
Representative SERS spectra of 4-NTP self-assembled monolayers on an Ag/Au alloy
gradient under steady state conditions at -625 mV are shown in Figure 2.8(A) for the three specific
alloy compositions noted in the legend. When the Ag mole fraction is 1.0, the monolayer is mostly
oxidized, with a significant surface concentration of 4-NTP (blue curve). Raman bands at 1140,
1390, and 1434 cm-1 arise from the C-N symmetric stretch, N=N stretch, and the C-H in-plane

60
bending modes, respectively, of 4, 4’ dimercaptoazobenzene (DMAB, partially reduced dimer
species). In addition, due to the ca. 22 cm-1 shift in the ring modes between 4-NTP and 4-ATP,
their interconversion can easily be monitored spectroscopically. The 1572 cm-1 band from 4-NTP
decreases in intensity as 4-NTP is reduced and the band at 1594 cm-1 (corresponding 4-ATP)
increases in intensity (Figure 2.8A). These data illustrate how SERS can be used to monitor the
interconversion of 4-NTP, DMAB, and 4-ATP as a function of potential and alloy composition
using bipolar electrochemistry. As noted above, the ring modes of 4-ATP and 4-NTP are easy to
resolve (1572 cm-1 and 1594 cm-1, respectively), the progress of their interconversion could be
monitored by simultaneously measuring changes in these two bands in SERS spectra (see Figure
2.8B). More specifically, the ratio R is a convenient metric that reports on both 4-NTP and 4-ATP
surface concentrations. That is, under conditions where the monolayer is comprised of fully
oxidized 4-NTP, I1594=0, and R=-1. On the other hand, under conditions where the monolayer is
fully reduced, I1572=0 and R= +1. When the surface concentrations of the two forms are equal, the
sign of R changes. In all cases, data from at least three separate experiments were averaged.
Figure 2.9 Solution potential as a function of measuring distance in 0.1M NaClO4 using the
Raman cell frame under 6V applied voltage.

61
Figure 2.8C shows how the ratio I1335 /I1080 (which reports on the surface concentration of 4-
NTP) depends on the electrode potential and alloy composition as measured along the two
dimensions of the BPE. The red dashed line indicates the potential at which the SERS spectra
discussed above were acquired. At potentials more positive than about -575 mV, the monolayer is
fully oxidized independent of alloy composition. I1335 is at or near its maximum value (green,
yellow, and red regions of the plot). For potentials more negative than about -700 mV, the
monolayer is fully reduced, also independent of alloy composition. I1335 is close to 0 and
unchanging (blue region of the plot). Finally, for potentials near -625 mV, the surface
concentration of 4-NTP is strongly dependent on alloy composition. When the alloy Ag mole
fraction is 0.5, the monolayer is fully reduced (blue). On pure Ag, the monolayer is not fully
reduced until much more negative potentials near -700 mV are reached. The key takeaway is that
the surface concentration of 4-NTP depends on the alloy composition in addition to the interfacial
potential.
Figure 2.8B shows how the experimentally measured value of R (defined above) varies as a
function of potential and composition. As expected, under conditions where the monolayer is
comprised of fully oxidized 4-NTP, I1594=0, and R has a value of -1 (blue in the plot). On the other
hand, under conditions where the monolayer is fully reduced, I1572=0 and R= +1 (red in the plot).
The potential where R changes sign corresponds to the condition where the surface concentrations
of 4-NTP and 4-ATP are equal – that is, the E1/2 value (green-yellow border). E1/2 is dependent on
the composition of the alloy, changing by about 100 mV over the range of compositions
investigated. This trend is similar to that described previously for 4-NTP. The shifts in E1/2
observed spectroscopically are consistent with our cyclic voltammetry measurements and those
published in the literature.36-37

62
Figure 2.10 Normalized Raman peak intensity profiles on pure Au: I1335/I1080 (A); R (C). Raman
spectra (B) acquired along the red-dashed line in (A).
To rule out the possibility that optical misalignment between the bipolar cell and the axes of
the Raman spectrometer could account for the behavior described above, we conducted analogous
measurements for 4-NTP monolayers adsorbed on pure Au BPEs, Figure 2.11. In this control,
there is no composition gradient along the minor axis of the BPE (90° to the potential gradient) as
the electrode is pure Au. Both plots of I1335/I1080 (Figure 2.11A), R (Figure 2.11C) as well as the
raw SERS spectra (Figure 2.11B) show a uniform distribution of 4-NTP/4-ATP along the minor
axis of the BPE with the expected changes as a function of potential. SERS data collected along

63
the vertical red dashed line show a smooth progression from 4-NTP to 4-ATP along the principle
axis of the BPE (electric field direction), as expected.
Figure 2.11 Normalized Raman peak intensity profiles on pure Ag: I1335/I1080 (A); (I1594-
I1572)/(I1594+I1572) (C); and I1434/I1080 (D). Raman spectra (B) acquired along the red-dashed line in
(A).
Previous researchers have discussed the fact that, in addition to the direct electrochemical
reduction of 4-NTP to 4-ATP, it is also possible under certain conditions of potential, pH, and laser
irradiation, to form a partially reduced azo-dimer (DMAB).33 We wished to investigate whether
this process might be responsible for the dependence of the apparent E1/2 on alloy composition.
Therefore, we used SERS to determine the experimental conditions under which DMAB could be

64
observed on the alloy surface. As noted earlier, the C-H in-plane bend at 1434 cm-1, normalized to
the C-S stretch is a convenient measure of the surface concentration of DMAB. A plot of I1434 /I1080
as a function of potential and alloy composition is shown in Figure 2.11D. The surface
concentration of DMAB is very dependent on potential and alloy composition. This observation
strongly suggests that the conversion of 4-NTP to 4ATP occurs by a different pathway at higher
Ag mole fractions. For alloy compositions below about 0.70 Ag, little to no DMAB is observed
under steady state conditions. On pure Ag surfaces, however, there is a ca. 20 mV window where
significant surface concentrations of DMAB are detected by SERS. Similar results also could
achieve when using pure Ag substrate, illustrated in Figure 2.12.
To summarize the bipolar Raman spectroelectrochemistry findings, the mechanism by which
4-NTP is converted to 4-ATP depends on the alloy composition. For alloy compositions above
about 70% Ag, 4-NTP is first partially reduced to DMAB, which is then further reduced to 4-ATP
at more negative potentials. As the Ag content of the alloy decreases with increasing Au mole
fraction, the amount of DMAB present on the surface appears to decrease. Below roughly 70%
Ag, 4-NTP is directly converted to 4-ATP, and no DMAB is observed spectroscopically at any
potential.
Campion was one of the first researchers to document the importance of adsorbate-substrate
charge transfer transitions in SERS.38 Beyond accounting for part of the SERS enhancement factor,
other researchers have noted that depending on the initial and final states coupled by these CT
transitions, it is possible to induce photoredox reactions during a SERS measurement. Indeed, even
as early as 1992, Matsuda and coworkers suggested that charge transfer transitions between the
Ag electrode and adsorbed 4-NTP played a role in their SERS pioneering measurements.39

65
We believe our results are consistent with the previously published computational
investigation by Tian, et al.10 Crucially, these workers demonstrated that metal-to-molecule CT
transitions in the visible region of the electromagnetic spectrum could drive the photo-
electrochemical reduction of 4-NTP SAMs on Au and Ag surfaces. Conversely, molecule-to-metal
CT processes were shown to be operative in photo-electrochemical oxidation of 4-ATP. According
to these researchers, photoreduction involves coupling metal electrons near the Fermi level to anti-
bonding states in the 4-NTP. The calculated metalto-4-NTP CT transition energies for Ag and Au
were 1.76 and 2.35 eV, respectively. While the Au CT process is not accessible, the 1.76 eV value
for Ag is reasonably close to the laser frequency used for our SERS measurements (785 nm, or 1.6
eV). The 4-ATP-to-metal CT transitions that could be important in the photo-oxidation of 4-ATP
were found to be 2.2 and 2.48 on Ag and Au, respectively. Thus, using 785 nm (1.6 eV) excitation,
as in the experiments described herein, we believe it is possible to excite two relevant Ag-to-
molecule CT transitions leading to the photo-assisted reduction of 4-NTP to 4nitrosothiophenol
and 4-hydroxylaminothiophenol. These two molecules can couple to form DMAB, in analogy to
the Haber process. On Au rich alloys, on the other hand, these photoinduced redox channels are
much higher in energy (>2 eV) and thus are not accessible using 785 nm radiation, so that only
direct electrochemical transformations are possible.
It only remains to account for the increase in the amount of DMAB formed as the mole
fraction of Ag in the alloy increases. We believe this can be explained on the basis that the
plasmonic efficiency of Ag is higher than that of Au and that the absorption cross-section for the
alloy increases as the Ag content of the film increases. We have previously reported on this effect,
for films are similar to those studied here.31 This is additional confirming evidence that the
formation of DMAB is a photo-assisted process.

66
2.4 Conclusions
In this work, we present a novel method, bipolar Raman spectro-electrochemistry (BRSE), to
investigate the reduction process of NTP monolayer on Ag/Au alloy substrate. With the help of
bimetallic alloy gradient established by pre-bipolar electrodeposition, a monolayer of studied
molecule, such as NTP, was immobilized on the cathode of BPE substrate. Then Raman
characterization profile on 2D system as a function of potential and bimetallic alloy composition
could be achieved simultaneously in longitude and latitude across the BPE. The reaction process
can thus be addressed under continuous potential control and varying bimetallic alloy composition
bi-directionally using BRSE. The results shown as the Ag mole ratio of alloy increases (from 50%
to 100% range), the alloy substrate would become less favorable for the reduction of NTP to ATP.
In this method, the bipolar electrochemistry provides a uniform and continuous potential
control and the Raman characterization provides a in situ record of quantitative information about
catalyst activity. Not only Ag/Au alloy for NTP reduction, large libraries of potential catalyst
candidates, like Au/Ag/Pt/Pd/Cd, etc., with varying alloy composition and other parameters, can
be rapidly evaluated and screened out for efficient electrocatalysis.

67
References
1. Zhai, Y.; Zhu, Z.; Zhou, S.; Zhu, C.; Dong, S., Recent Advances in
Spectroelectrochemistry. Nanoscale 2018, 10, 3089-3111.
2. Choi, H.-K.; Park, W.-H.; Park, C.-G.; Shin, H.-H.; Lee, K. S.; Kim, Z. H., Metal-
Catalyzed Chemical Reaction of Single Molecules Directly Probed by Vibrational Spectroscopy.
J. Am. Chem. Soc. 2016, 138 (13), 4673-4684.
3. Li, J.; Liu, J.; Yang, Y.; Qin, D., Bifunctional Ag@ Pd-Ag nanocubes for highly sensitive
monitoring of catalytic reactions by surface-enhanced Raman spectroscopy. J. Am. Chem. Soc.
2015, 137 (22), 7039-7042.
4. Matsuda, N.; Sawaguchi, T.; Osawa, M.; Uchida, I., Surface-assisted photoinduced
reduction of p-nitrothiophenol self-assembled monolayer adsorbed on a smooth silver electrode.
Chem. Lett. 1995, 24 (2), 145-146.
5. Lu, T.; Cotton, T. M.; Birke, R. L.; Lombardi, J. R., Raman and surface-enhanced Raman
spectroscopy of the three redox forms of 4, 4'-bipyridine. Langmuir 1989, 5 (2), 406-414.
6. Ying, Y.-L.; Hu, Y.-X.; Gao, R.; Yu, R.-J.; Gu, Z.; Lee, L. P.; Long, Y.-T., Asymmetric
Nanopore Electrode-Based Amplification for Electron Transfer Imaging in Live Cells. J. Am.
Chem. Soc. 2018, 140 (16), 5385-5392.
7. Xu, F.; Wang, H.; He, X.-D.; Deng, N.; Li, F.; Li, B.; Xie, J.-H.; Han, S.-K.; He, J.-B.,
One-step deposition of Ni x Cu 1− x alloys with both composition gradient and morphology
evolution by bipolar electrochemistry. J. Electroanal. Chem. 2018.
8. Koefoed, L.; Pedersen, E. B.; Thyssen, L.; Vinther, J.; Kristiansen, T.; Pedersen, S. U.;
Daasbjerg, K., Functionalizing Arrays of Transferred Monolayer Graphene on Insulating Surfaces
by Bipolar Electrochemistry. Langmuir 2016, 32 (25), 6289-6296.

68
9. Zhang, L.; Gupta, B.; Goudeau, B.; Mano, N.; Kuhn, A., Wireless electromechanical
readout of chemical information. Journal of the American Chemical Society 2018, 140 (45),
15501-15506.
10. Ren, X.; Tan, E.; Lang, X.; You, T.; Jiang, L.; Zhang, H.; Yin, P.; Guo, L., Observing
reduction of 4-nitrobenzenthiol on gold nanoparticles in situ using surface-enhanced Raman
spectroscopy. Physical Chemistry Chemical Physics 2013, 15 (34), 14196-14201.
11. Fosdick, S. E.; Knust, K. N.; Scida, K.; Crooks, R. M., Bipolar electrochemistry.
Angewandte Chemie International Edition 2013, 52 (40), 10438-10456.
12. Ibanez, D.; Heras, A.; Colina, A., Bipolar Spectroelectrochemistry. Anal. Chem. 2017, 89
(7), 3879-3883.
13. Andolina, C. M.; Dewar, A. C.; Smith, A. M.; Marbella, L. E.; Hartmann, M. J.; Millstone,
J. E., Photoluminescent gold–copper nanoparticle alloys with composition-tunable near-infrared
emission. J. Am. Chem. Soc. 2013, 135 (14), 5266-5269.
14. Dai, L.; Song, L.; Huang, Y.; Zhang, L.; Lu, X.; Zhang, J.; Chen, T., Bimetallic Au/Ag
Core–Shell Superstructures with Tunable Surface Plasmon Resonance in the Near-Infrared Region
and High Performance Surface-Enhanced Raman Scattering. Langmuir 2017, 33 (22), 5378-5384.
15. Tsao, Y.-C.; Rej, S.; Chiu, C.-Y.; Huang, M. H., Aqueous phase synthesis of Au–Ag core–
shell nanocrystals with tunable shapes and their optical and catalytic properties. J. Am. Chem. Soc.
2013, 136 (1), 396-404.
16. Khlebtsov, B.; Panfilova, E.; Khanadeev, V.; Bibikova, O.; Terentyuk, G.; Ivanov, A.;
Rumyantseva, V.; Shilov, I.; Ryabova, A.; Loshchenov, V., Nanocomposites containing silica-
coated gold–silver nanocages and Yb–2, 4-Dimethoxyhematoporphyrin: Multifunctional

69
capability of IR-luminescence detection, photosensitization, and photothermolysis. ACS nano
2011, 5 (9), 7077-7089.
17. Juzgado, A.; Soldà, A.; Ostric, A.; Criado, A.; Valenti, G.; Rapino, S.; Conti, G.; Fracasso,
G.; Paolucci, F.; Prato, M., Highly sensitive electrochemiluminescence detection of a prostate
cancer biomarker. J. Mater. Chem.B 2017, 5 (32), 6681-6687.
18. Yuan, T.; Le Thi Ngoc, L.; van Nieuwkasteele, J.; Odijk, M.; van den Berg, A.; Permentier,
H.; Bischoff, R.; Carlen, E. T., In situ surface-enhanced raman spectroelectrochemical analysis
system with a hemin modified nanostructured gold surface. Anal. Chem. 2015, 87 (5), 2588-2592.
19. Kiyonaga, T.; Jin, Q.; Kobayashi, H.; Tada, H., Size‐Dependence of Catalytic Activity of
Gold Nanoparticles Loaded on Titanium (IV) Dioxide for Hydrogen Peroxide Decomposition.
ChemPhysChem 2009, 10 (17), 2935-2938.
20. Boghosian, S.; Bebelis, S.; Vayenas, C.; Papatheodorou, G., In situ high temperature SERS
study of Ag catalysts and electrodes during ethylene epoxidation. J. Catal. 1989, 117 (2), 561-565.
21. Hartman, T.; Wondergem, C. S.; Kumar, N.; van den Berg, A.; Weckhuysen, B. M.,
Surface-and tip-enhanced Raman spectroscopy in catalysis. J. Phys. Chem. Lett. 2016, 7 (8), 1570-
1584.
22. Li, P.; Ma, B.; Yang, L.; Liu, J., Hybrid single nanoreactor for in situ SERS monitoring of
plasmon-driven and small Au nanoparticles catalyzed reactions. Chem. Commun. 2015, 51 (57),
11394-11397.
23. Cui, Q.; Yashchenok, A.; Li, L.; Moehwald, H.; Bargheer, M., Mechanistic study on
reduction reaction of nitro compounds catalyzed by gold nanoparticles using in situ SERS
monitoring. Colloids Surf., A 2015, 470, 108-113.

70
24. Krajczewski, J.; Kołątaj, K.; Pietrasik, S.; Kudelski, A., Silica-covered star-shaped Au-Ag
nanoparticles as new electromagnetic nanoresonators for Raman characterisation of surfaces.
Spectrochim. Acta, Part A. Mol. Biomol. Spectrsc. 2018, 193, 1-7.
25. Yin, Z.; Wang, Y.; Song, C.; Zheng, L.; Ma, N.; Liu, X.; Li, S.; Lin, L.; Li, M.; Xu, Y.,
Hybrid Au-Ag Nanostructures for Enhanced Plasmon-Driven Selective Hydrogenation through
Visible Light Irradiation and Surface-Enhanced Raman Scattering. J. Am. Chem. Soc. 2018, 140
(3), 864–867.
26. Han, Q.; Zhang, C.; Gao, W.; Han, Z.; Liu, T.; Li, C.; Wang, Z.; He, E.; Zheng, H., Ag-Au
alloy nanoparticles: Synthesis and in situ monitoring SERS of plasmonic catalysis. Sens. Actuators,
B 2016, 231, 609-614.
27. Cao, M.; Zhou, L.; Xu, X.; Cheng, S.; Yao, J.-L.; Fan, L.-J., Galvanic replacement
approach for bifunctional polyacrylonitrile/Ag–M (M= Au or Pd) nanofibers as SERS-active
substrates for monitoring catalytic reactions. J. Mater. Chem. A 2013, 1 (31), 8942-8949.
28. Luo, L.; Duan, Z.; Li, H.; Kim, J.; Henkelman, G.; Crooks, R. M., Tunability of the
adsorbate binding on bimetallic alloy nanoparticles for the optimization of catalytic hydrogenation.
J. Am. Chem. Soc. 2017, 139 (15), 5538-5546.
29. Tisserant, G.; Gillion, J.; Lannelongue, J.; Fattah, Z.; Garrigue, P.; Roche, J.; Zigah, D.;
Kuhn, A.; Bouffier, L., Single‐Step Screening of the Potential Dependence of Metal Layer
Morphologies along Bipolar Electrodes. ChemElectroChem 2016, 3 (3), 387-391.
30. Ramakrishnan, S.; Shannon, C., Display of solid-state materials using bipolar
electrochemistry. Langmuir 2010, 26 (7), 4602-4606.

71
31. Ramaswamy, R.; Shannon, C., Screening the Optical Properties of Ag− Au Alloy
Gradients Formed by Bipolar Electrodeposition Using Surface Enhanced Raman Spectroscopy.
Langmuir 2011, 27 (3), 878-881.
32. Nicol, M.; Paul, R.; Fleming, C. In The chemistry of the extraction of gold, Mintek: 1987.
33. Corma, A.; Concepción, P.; Serna, P., A different reaction pathway for the reduction of
aromatic nitro compounds on gold catalysts. Angewandte Chemie International Edition 2007, 46
(38), 7266-7269.
34. Han, S. W.; Lee, I.; Kim, K., Patterning of organic monolayers on silver via surface-
induced photoreaction. Langmuir 2002, 18 (1), 182-187.
35. Shin, K. S.; Lee, H. S.; Joo, S. W.; Kim, K., Surface-induced photoreduction of 4-
nitrobenzenethiol on Cu revealed by surface-enhanced Raman scattering Spectroscopy. J. Phys.
Chem. C 2007, 111 (42), 15223-15227.
36. Futamata, M., Surface-plasmon-polariton-enhanced Raman scattering from self-assembled
monolayers of p-nitrothiophenol and p-aminothiophenol on silver. The Journal of Physical
Chemistry 1995, 99 (31), 11901-11908.
37. Nielsen, J. U.; Esplandiu, M. J.; Kolb, D. M., 4-Nitrothiophenol SAM on Au (111)
investigated by in situ STM, electrochemistry, and XPS. Langmuir 2001, 17 (11), 3454-3459.
38. Campion, A.; Ivanecky III, J.; Child, C.; Foster, M., On the mechanism of chemical
enhancement in surface-enhanced Raman scattering. Journal of the American Chemical Society
1995, 117 (47), 11807-11808.
39. Matsuda, N.; Yoshii, K.; Ataka, K.-i.; Osawa, M.; Matsue, T.; Uchida, I., Surface-enhanced
infrared and Raman studies of electrochemical reduction of self-assembled monolayers formed
from p-nitrohiophenol at silver. Chemistry letters 1992, 21 (7), 1385-1388.

72
Chapter 3
Control of the Potential Profile of Bipolar Electrodes Using Cell Frames
3.1 Introduction
Bipolar electrochemistry is an unconventional technique where a conductor is immersed
electrochemically in an electrolyte wirelessly with two driving electrodes connected an external
power supply, when the external power large enough to cause faradic reaction, the two distinct
poles of bipolar electrode would exhibit opposite polarization with respect to the solution due to
electric field crossing the whole cell, specifically, reduction occurs at the cathodic pole while
oxidation happens simultaneously at the anodic.1 Based on the different configurations, BPE
system can be carried out into two system, ‘open’ BPE system, where BPE anode and BPE cathode
sharing same cell, and ‘closed’ BPE system, where BPE anode and BPE cathode separated into
different cell. And bipolar electrochemistry used in a variety of fields, such as electrodeposition,2
electrocatalysis,3 sensing,4 concentration enrichments,5 electro-grafting,6 etc.
An important issue in BPE system is the applied voltage to the driving electrodes to achieve
desired redox reaction occurs on the anode and cathode of BPE. Specifically, external bias of
power source applied on the driving electrodes would induce an electric field formation in the
solution, with an potential gradient across the cell from anodic driving electrode to the cathodic in
the solution, when the interfacial potential between the solution and BPE is large enough would
cause redox reaction happens.7 However, one thing should be noted that there is a potential
dropping at the driving electrode, and under some circumstances, the potential loss within the
electrochemical double layers can be substantial.8 And the dropped potential mainly occupied by
double layer capacitance formation, charge transfer resistance and diffusion impedance happened
at the metal electrode/solution surface.9 The properties of interface formed by charged

73
electrode/electrolyte system governs the charge transfer processes through the interface itself,
which would influence the electrochemical responses.10 Thus some well-known models
established based on Helmholtz’s early theoretical work to address and refine the electrochemical
double layers, such as Gouy–Chapman model and Gouy–Chapman–Stern model.11-12 As for
solution potential, which is applied voltage subtracts dropped potential, would be employed for
inducing the electric field formation or potential gradient formation in the solution across the
electrochemical cell. Noted that the exist of electric field or potential gradient in the solution
indicates Faradic current flowing through the driving electrode, on the contrary, when the applied
voltage is not big enough to cause faradic current happens on the driving electrodes, no potential
gradient would be formed at steady states. And our purpose is offering a basic guideline for
researchers to make the optimal BPE cell frames. To achieve that, it is important to understand the
potential profile of different cell frames.
Herein, the potential profile of three types of cell frames were studied, as illustrated in Figure
3.1, three types of cell frame is open cell frame, closed cell frame and channel cell frame,
respectively, and the electric field trend line (red line) that is virtual to show the probable trend of
electron or anions moving direction in the solution. And the electric field strength that is a
quantitative expression of the intensity of an electric field at a particular location can be tuned by
the design of cell frame, as demonstrated in Figure 3.1, the electric field line in closed cell frame
is uniform and have a same electric field strength anywhere in the cell under a fixed applied voltage,
while the density of electric field line would slight decrease by using open cell frame and opposite
results would obtain in channel cell frame. Therefore, the potential profile was studied based on
these three types of cell frames, and simple models were proposed to describe the potential
behavior of channel cell frames.

74
Figure 3.12 Electric field strength illustrated in three cell frames, (A) open cell frame, (B) closed
cell frame and (C) channel cell frame.
All the study has focused exclusively on what are known as ‘open’ BPE system cell frames
in this section. As far as we understand the potential profile of ‘open’ BPE system cell frames, it
would be much easier for us to comprehend the potential distribution of ‘closed’ BPE system cell
frames that could simply be treated as two ‘open’ BPE system cell frames in series.
3.2 Experimental section
3.2.1 Materials and Reagents
All solutions were prepared with deionized, ultra-pure water (VWR Type II). Stainless Steel
foil (0.5mm, Alfa Aesar), Gold foil (0.1mm thick, 99.99% trace metals, Sigma-Aldrich),Sodium
perchlorate nomohydrate (≥99.0%, Fluka analytical), Potassium Chloride (crystals, BDH
Chemicals), Ethyl Alcohol (200 Proof, ACS/USP grade, Pharmco-Aaper), Capillary tubes (I.D.
1.1-1.2 mm, Wall 0.2 ± 0.02 mm, Kimble Chase), Silver wire (0.25mm diameter, 99.99%, Sigma-
Aldrich), Tris(2,2’-bipyridyl) dichlororuthenium(II) hexahydrate (Ru(bpy)3Cl2·6H2O) (99.95%,
Sigma-Aldrich), Sodium phosphate dibasic anhydrous (Sigma-Aldrich), Sodium Phosphate
Monobasic (98.8%, Fisher Scientific), tri-n-propylamine (TPrA)(≥98%, Sigma-Aldrich),

75
hydrogen peroxide (30% (v/v) in H2O, Sigma-Aldrich), sulfuric acid (HPLC grade) were from
commercial sources and used as received, Potassium Ferricyanide(III) powder (99%, Sigma-
Aldrich), Potassium nitrate (99.7%, Fisher Scientific).
ECL solution used 5mM Ru(bpy)32+
as chemiluminescent, 25mM TPrA as co-reagent,
prepared in 0.1M PBS buffer, pH=7. And 0.1M NaClO4 Solution used for the potential
measurement in the cell frames.
3.2.2 Apparatus
Panasonic Lumix DMC-LX3 Camera (Panasonic Corporation, Osaka Japan),
Electrochemical Potentiostat (Pine Instrument), Power supply (9122A 0-60V/0-2.5A Single
Output Programmable DC, B&K Precision Corporation), Solution potentials were monitored by a
two-channel handheld oscilloscope (Hantek model DSO8060).
3.2.3 Preparation of Bipolar Electrochemical Cell Frames
Figure 3.13 (A), (B) and (C) are open cell frame, closed cell frame and channel cell frame,
respectively.

76
Use 3D-printer (MakerBot Replicator 2) to print different bipolar electrochemical cell frames.
Designs were modeled by Sketch Up © (Trimble Navigation Limited) and printed from polylactic
acid filament (1.75mm diameter).
According to the structure of cell frames used for BPE system, cell frames divided into three
categories: open cell frames, closed cell frames and channel cell frame. As shown in Figure 3.2,
without notification, the cell frames, which used for the experimental research for the BPE system
in this section, have a width of 72mm and length of 60mm.
3.2.4 Prepared Self-made tiny Ag/AgCl Reference Electrodes for Solution Potential Measurement
To measure the solution potential more precisely, we made two tiny Ag/AgCl reference
electrodes as measuring tips. And the processes about self-making Ag/AgCl reference electrodes
see chapter 2(2.3).
3.2.5 Gold BPE cleanness
Gold foil, which serves as BPE, cleaned in fresh piranha solution (H2SO4/H2O2, 3:1 (v/v)) at
room temperature for about 5 min, rinsed with alcohol mixed D.I. water, and dried under nitrogen
gas. Caution: piranha solution is dangerous to human health and should be used with extreme
caution and handled only in small quantities. Then, the cleaned Gold BPE was placed into the
electrochemical cell frames near the center using epoxy, driving electrodes were used stainless
steel.
3.2.6 ECL measurement
ECL light recorded using Panasonic Lumix DMC-LX3 Camera (Panasonic Corporation,
Osaka Japan), and the light intensity analyzed using ImageJ2x software.

77
3.3 Results and Discussion
3.3.1 Self-made Ag/AgCl reference electrodes
The criteria of a reference electrode including:(i) electrode potential should be stable, (ii)
electrode should be reversible which obeys Nernst Equation, (iii) electrode should response fast to
the change of environment conditions;13 and the final important one is electrode should be
nonpolarizable, which could mostly minimize the potential loss between the measuring tip and
solution, and increase the accuracy of performance. Therefore, two Ag/AgCl reference electrodes
were made to measuring the solution potential in the cell frames.
Figure 3.3 (A) is a picture of Self-made reference electrode. (B) Cyclic Voltammograms of two
self-made Ag/AgCl reference electrodes, Pt electrode as counter electrode, Au electrode as
working electrode, scan in 2 mM Potassium Ferricyanide (III) solution from 0.5 volt to (-0.1) volt
with 0.5 M KNO3 as supporting electrolyte, scan rate: 50 mv/s (Red and blue CV scanned using
two self-made electrodes).

78
To verify the self-made reference electrodes working properly, cyclic voltammograms
obtained by using two different self-made reference electrodes as reference electrode scanned in
ferricyanide (III) solution from 0.5V to (-0.1)V with 0.5 M KNO3 as supporting electrolyte, as
shown in Figure 3.3, the cyclic Voltammograms, red and blue overlapped together, and are
undistinguishable, indicates that the two self-made reference electrodes working properly, are
good enough for solution potential measurement.
3.3.2 Closed cell frames versus open cell frames
To achieve solution potential measurement more convenient, accurate, and easier to compare,
the cell frame was evenly separated sixteen columns with 4.5mm distance next to each line and
twelve rows with 5mm distance of each row, as illustrated in Figure 3.4(A), solution potential
across 10 mm, the two self-made reference electrode tips would be placed in the two green dots
position, solution potential across 40 mm, the two self-made reference electrode tips would be
placed in the two blue dots position, etc. Using this way, the solution potential profile of closed
cell frame (Figure 3.2(B)) and open cell frame (Figure 3.2(A)) achieved at different measuring
distance and applied voltage, as demonstrated in Figure 3.4(B), the potential profile contains five
layers, the potential on each layer obtained under a fixed applied voltage, from low to high, 3V,
4V, 5V, 6V, and 7V, respectively; each layer contains five horizontal lines and seventeen vertical
lines, as for the horizontal lines, for example, 3V4 meaning potential measured across 4cm distance
under 3V applied voltage, etc., in terms of vertical lines, which meaning the potential measured at
different position of the cell frame, it corresponding the seventeen vertical lines showed in Figure
3.4(A). And Figure 3.4(B) clearly indicates that the potential from closed cell frame more uniform,
all the potential located same line that parallels with the driving electrode are same, and also slight
higher than that from the open cell frame obtained under same measuring condition; while the

79
Figure 3.4 (A) Solution potential measurement scheme; (B) solution potential profile of closed
cell frames vs open cell frames; (C) solution potential profile of closed cell frames vs open cell
frames at different applied voltage under 30 mm measuring distance.
potential from the open cell frame higher in the middle, and slight decreasing as the measuring
position moves from middle to edges. It is reasonable, as demonstrated in Figure 3.1, the electric
field strength of solution in closed cell frame is uniform, while the electric field strength decreasing
and the electric lines become less dense from middle to edges of the open cell frame. From Figure

80
3.4(C), which shows the potential profile from closed cell frame and open cell frame measured at
30mm distance with different applied voltage, we also can see the potential from the closed cell
frame is a little higher than that of open cell frame, and the potential difference between middle
and edge is increasing as increasing the applied voltage using the open cell frame, which caused
by increased electric field strength as increasing applied voltage. Therefore, a closed cell frame
would be preferred compared to open cell frame, if open cell frame was needed to use, to ensure a
relative uniform and stable potential, the BPE width should be not wider than 1/3rd width of the
driving electrode.
Figure 3.5 (A) Solution potential as a function of measuring distance under different applied
voltage using closed cell frames; (B) dropped potential at different applied voltage in the closed
cell frame;(D) potential profile in different closed cell frame width under different applied voltage
measured at 30mm distance using (C) cell frame design.

81
To better understand solution potential profile in the closed cell frame, solution potential as a
function of measuring distance under different applied voltage was plotted in Figure 3.5(A), as
indicates, the solution potential shows a linear relationship with measuring distance, and the slope
of the line increases as increasing the applied voltage, which contributes to the uniformed electric
field strength. In terms of voltage/potential drop, which is the applied voltage subtracts the solution
potential across the cell, as illustrated in Figure 3.5(B), applied voltage smaller than 3V, non-
faradic current plays a important role, the applied voltage mainly contributes to the formation of
double layer at the surface of driving electrodes, nearly no voltage across the solution (or most of
applied voltage acts as potential drop) since any reaction happens need to reach their redox
potential; when the applied voltage larger than 3V, the slope of potential drop is decreasing,
indicates most of increased voltage employs the increase of solution potential across the cell frame.
To study the effect of cell frame width for the potential profile, solution potential profile achieved
using cell frames with different width (Figure 3.5(C)) under different applied voltage at same
measuring distance, as demonstrated in Figure 3.5(D), the solution potentials are almost same
under 2mm, 4mm, 8mm, 16mm and 32mm cell frame width at a fixed applied voltage, indicates
cell frame width does not affect the potential profile using the closed cell frame, probably due to
the voltage drop at electrode surface for overcome double layer capacitance, charge transfer
resistance, and diffusion impedance is same.
3.3.3 Effect of Measuring tip depth and Concentration of electrolyte
The effect of reference electrodes tips depth in solution and concentration of electrolyte when
perform potential measurement also studied. The potential as a function of applied voltage
collected when the measuring reference electrode tips immersed in solution ca. 3mm (shallow),
6mm (middle), and 10mm (deep), as demonstrated in Figure 3.6(A), the potential measured in

82
three different depth overlapped together, indicates the measuring reference electrode tip depth in
solution has no effect for interfering the accuracy of collected solution potential. Meanwhile, the
potential profile in 1mM, 10mM, 100mM, 1M, 2M, and 4M concentrated NaClO4 electrolyte
solution under different applied voltage were measured, as shown in Figure 3.6(B), the solution
potentials, which collected under same measuring distance and same applied voltage, increasing
as electrolyte concentration varies from low to high. This behavior was ascribed to lower the
concentration of electrolyte maybe decrease the unit double layer capacitance and increase the
charge transfer at the driving electrode surface, not caused by the solution resistance across the
cell since the cell frame width (or solution resistance across the cell) has no interference for the
solution potential profile, as discussed above.
Figure 3.6 (A) Potential profile of different measuring tip depth under different applied voltage at
a fixed measuring distance; (B) potential profile of different concentrated electrolyte under
different applied voltage at same measuring distance.
3.3.4 Study of Potential Profile using Channel Cell Frames
As for the channel cell frames used for BPE system, the effect of channel position for the
potential were discussed in this section, three types of cell frames were used, where the channel

83
located in the middle, 1/4th of cell width to the cell side edge, and next to the side edge, as showed
in Figure 3.7(A)- (C), all channels in three types of cell frames are same length, and potential
profile was collected using these three types of cell frames under different applied voltage, as
illustrated in Figure 3.7(D), the potential across the channel is slight increasing as the channel
varies from edge to middle of the cell frame, and this behavior becomes more obvious as applied
voltage increasing, especial after 4V. This phenomenon was ascribed to the solution resistance at
a fixed applied voltage since the solution resistance between driving anode and cathode decreasing
as the channel varies from edge to middle in cell frames. Therefore, the channel should be placed
in the middle of the cell frames when a channel cell frame chosen to use in BPE cell.
Figure 3.7 (D) Channel potential as function of channel position under different applied voltage
by using (A), (B) and (C) cell frames, channel with 30mm length × 2mm width.

84
Figure 3.8 (B) Potential profile along the red line using (A) cell frame under 7V applied voltage,
channel with 30mm length × 2mm width; (C) Scheme of BPE (green color) placed in three
different channel cell frames, BPE length is larger, equal, and smaller than that of the channel,
respectively; (D) BPE (5mm) potential as a function of channel width with different channel
length (5mm, 15mm, 30mm and 40mm, respectively) under 7V applied voltage (CL x/y meaning
potential across x mm channel divided by y).
Due to the purpose of cell frames design is used for BPE system, does the length of BPE
should be longer, equal, or shorter than that of channel (as shown in Figure 3.8 (C))? Therefore, a
potential gradient was measured in the middle of cell frame across the channel at 7V applied
voltage, as illustrated in Figure 3.8 (A)-(B), the solution potential along the red line from Figure
3.8(A) contains three parts, two parts from two reservoirs (presented in A zone and C zone), one

85
from the channel (B zone with 30mm channel length). And we can see the potential gradient or
slope in the channel is much larger than that of the reservoir, indicates BPE should not longer than
the channel to use maximum voltage efficiency on the BPE. Now it leaves BPE should equal or
smaller than the length of channel. Thus, a 5mm BPE was chosen, potential profiles with 5mm,
15mm, 30mm, and 40mm channel length were collected at 7V applied voltage, and plotted as a
function of normalized channel width (defines channel width divided by cell width), as shown in
Figure 3.8(D), CL5 defines potential across 5mm channel length, CL15/3 defines potential across
15mm channel length divided by 3, etc., hence, the potentials shown in Figure 3.8(D) measured
across same length, and the potential is higher in plot CL 5 than that from other plots, indicates the
BPE placed in the channel with same length has higher voltage and the channel should be designed
same length of BPE.
To further understand the potential profile along with different channel width and length, the
potential profile as a function of normalized channel width (channel width divided by cell width)
using different length of channel at 7V were collected and plotted in Figure 3.9(A), as it shows the
potential increases as increasing the channel length under same channel width, and the potential
increase becomes more obvious at same channel length when the normalized channel width not
larger than 0.2, which indicates the normalized channel width should not larger than 0.2 to better
increase potential across the BPE in the channel cell frame design. Meanwhile, the potential profile
as a function of normalized channel length (channel length divided by cell length) using different
length of channel at 7V were also collected and plotted in Figure 3.9(B), indicates normalized
channel length should not smaller than 0.4 to maintain the potential across BPE at least 60%
solution potential across the cell, and also not larger than 0.8 to avoid the interference from the
reactions happening at the driving electrode. Therefore, to make a better channel cell frame
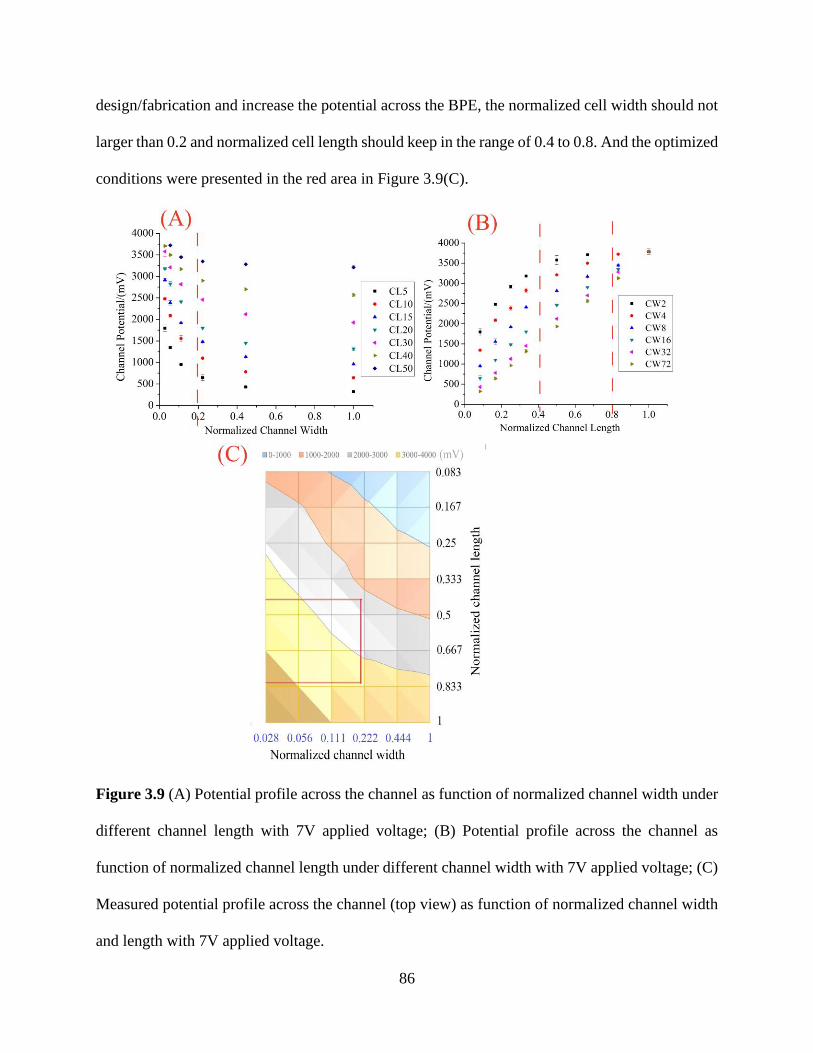
86
design/fabrication and increase the potential across the BPE, the normalized cell width should not
larger than 0.2 and normalized cell length should keep in the range of 0.4 to 0.8. And the optimized
conditions were presented in the red area in Figure 3.9(C).
Figure 3.9 (A) Potential profile across the channel as function of normalized channel width under
different channel length with 7V applied voltage; (B) Potential profile across the channel as
function of normalized channel length under different channel width with 7V applied voltage; (C)
Measured potential profile across the channel (top view) as function of normalized channel width
and length with 7V applied voltage.

87
One import case should be noticed that in the channel cell frame design, the potential profile
in the channel is not that uniform. The potential across the channel length is slight larger when
measurement close to the edge of channel, and potential is smallest in the middle of channel, as
illustrated in Figure 3.10(A), where the potential at edge and middle of the channel measured in
different width of channel under different applied voltage, and the potential difference between
the edge and middle increases as increasing channel width. For example, the potential at different
channel position measured under 7V applied voltage using channel with 32mm width and 30mm
length of cell frame, as illustrated in Figure 3.10(B), the edge potential ca. 350mV larger than that
of middle. This behavior was due to the high electric field strength at the edge compared the middle
of the channel, as demonstrated in Figure 3.1(C), electric field lines much denser at channel edge
while loose in the middle of the channel.
Figure 3.10 (A) Potential profile (across 30mm channel length, measured close to channel edges
and located the middle of channel) as a function of channel width under different applied voltage;
(B) Potential profile measured at different position across the channel of 32mm channel width
under 7V applied potential.

88
3.3.5 Model the Potential of Channel Cell Frames
To predict and better understand the potential profile of BPE across the channel, the solution
was considered as ideal conductor since the concentration of electrolyte used is 0.1M that not low
for ions movement in solution to have a better conductivity, and also for better calculation, a simple
model was built to describe the potential across the BPE that is placed in the channel, and the
calculation shows below:
Vapp = Vcathodic drop + Vanodic drop + Vchannel + Vreservoir1 + Vreservoir2
where Vreservoir1 = Vreservoir2 = Vr , assume Vcathodic drop + Vanodic drop = Vd and is constant
since the potential drop at electrode surface not depends on solution resistance caused by different
cell frame structure when not changing the concentration of electrolyte and composition, which
already discussed above,
Vapp = Vd + 2Vr + Vc
Where Vapp is applied voltage, Vc = Vchannel is the potential across the channel in cell frame, since
V (voltage) is proportional of solution resistivity,
Vc = (Vapp- Vd)*Rc
(2Rr + Rc)⁄ = b*Rc
(2Rr + Rc)⁄ (3.0)
Where p = (Vapp- Vd), Rr is the resistance of solution in reservoir located at the end of channel
next to driving electrode, and Rc is the solution resistance in the channel, if consider solution as
ideal conductor,
Rc = ρ*l
Ac= ρ*
l
wc*h , Rr = ρ*
0.5(L-l)
Ar,
Where ρ is resistivity, W is cell width, L is cell length, l is channel length, wc is channel width, Ac
is the area of cross section of channel, h is the solution depth,
(1) Assume the Rr of the solution in reservoir is a rectangle resistor, then

89
Vc = p*Rc
(2Rr + Rc)⁄ = p*(ρ*
lwc*h
)
(ρ*L-l
W*h+ ρ*
lwc*h
)⁄ =
pWl
wcL + (W-wc)l
=p* (
lL)
(wc
W ) + (1- (wc
W )) * (lL)
=p*xl
xw + (1-xw)*xl
Where l/L = xl, wc
W= xw, if Vc = y, then potential across the channel is:
y =p*xl
xw + xl-xw*xl (0 < xl < 1, 0 < xw < 1) (3.1)
Where y is channel potential, xw is normalized channel width, and xl is normalized channel length.
(2) Assume the Rr of the solution in reservoir is a trapezoid resistor, then
Vc = p*Rc
(2Rr + Rc)⁄ = p*(ρ*
lwc*h
)
(2*ρ*0.5*(L-l)
12
(W + wc)*h+ ρ*
lwc*h
)⁄
= p*
lwc
lwc
+ 2*(L-l)
(W + wc)
= p*
lL
lL + 2*
wc* (1-lL)
(W + wc)
= p*
lL
lL + 2*
(1-lL)
(Wwc
+ 1)
= p*xl
xl + 2*(1-xl)
(1
xw+ 1)
= p* (xl + xwxl)
xl + 2xw-xwxl
if Vc = y, then potential across the channel is:
y = p* (xl + xwxl)
xl + 2xw-xwxl (0 < xl < 1, 0 < xw < 1) (3.2)
To verify the accuracy of the two simple models that described in equation (3.1) and equation
(3.2), two sets of experimental data collected at 7V applied voltage using channel frames showed

90
in Figure 3.11(A)-(B), and two sets of calculated data based on two models from equation (3.1)
and equation (3.2) were plotted in Figure 3.11(C), as it shows, the two sets of experimental data
were very close, indicates the electric field strength distributes in reservoir of the cell frame is
more like in triangle or trapezoid area shape, as expected, the trapezoid calculated data from
equation (3.2) more close to experimental data than rectangular calculated data since the model
treated reservoir resistor as trapezoid shape. However, the trapezoid calculated data from equation
(3.2) still slightly larger than experimental data, especially around 0.2 of normalized channel
length, indicates Rr that used for calculation is smaller than real value based on equation (3.0),
since Rr is proportional to (1/Ar), the value of Ar used for calculation, which from trapezoid
model, is larger than real one and need to be decreased. Therefore, a third model was proposed as
below:
(3) An ellipse model that has a center of O, point M and N both on the ellipse was offered, as
illustrated in Figure 3.11(D). Due to the problem to cause large potential differences between
calculated data and experimental one from all the models is the determination of Rr , and Rr is
proportional to (1/Ar), thus Ar plays an important role for achieving the proper model. In this
ellipse model, two methods were used to determine Ar and need to be verified. Since Ar is the area
of cross section of solution in reservoir, which has a constant solution depth, we only need to find
the length of the cross section. As illustrated in Figure 3.11(D), the length of the cross section
could be line segment RH, where the line parallels with the driving electrodes and goes through
the midpoint G of line segment MF, or line segment ST, which also parallels to the driving
electrodes with point T is the midpoint of arc MN. Therefore, to determine the length of RH or ST,
both need to acquire function of ellipse. Refers to the assumed ellipse goes M (0, L/2) and N (wc-W
2 ,
l
2), and the determined function of ellipse, no matter foci on x axis or y axis, presents as below:

91
4(L2-l2)x2
L2(W-wc)2+
4y2
L2= 1 (|x| < ||
W-wc
2√1-xl2
|| , 0 < xl < 1) (3.3)
a) Channel potential profile model based on RH. To find out length of RH, from H (x, L+l
4) and
place y value of L+l
4 into equation (3.3), we can acquire x =
wc-W
4√
3L+l
L+l , then obtain the length of
RH is (W-W-wc
2√
3L+l
L+l), put it into Rr = ρ*
0.5(L-l)
Ar= ρ*
0.5(L-l)
RH×h and substitute it into equation (3.0),
rearrangement, and obtains the final equation for the model,
y = p* 2xl√1 + xl-xl(1-xw)√3 + xl
2xw(1-xl)√1 + xl + 2xl√1 + xl-xl(1-xw)√3 + xl
(0 < xl < 1, 0 < xw
< 1) (3.4)
b) Channel potential profile model based on ST. The length s of arc given by s = ∫ ds, where ds =
dx(1 + y'2), where y' =dy
dx⁄ . Thus, the length of arc between x = x1 and x = x2 shows as:
s = ∫ √(1 + y'2)dx (3.5) x2
x1
Therefore, differential of equation (3.3) and alternative we can obtain
y'2 =4(L2-l2)2x2
L2(W-wc)4-4(W-wc)2(L2-l2)x2=
4a2x2
L2b2-4abx2=
4x2
L2c2-4cx2 (3.6)
Where a = L2-l2 , b = (W-wc)2 , c = ba⁄ , to find out the length of arc NM showed in Figure
3.11(D), combine equation (3.5) and equation (3.6),

92
s (Arc NM) = ∫ √1 +4x2
L2c2-4(cx2)dx
0
-√b2
=
√1-b
L2c√1-
1c +
L2
-b + L2cEllipticE[L√ 1
L2c √cArcCsc[L√c
√b],
-1 + cc ]
2√ 1L2c
√b-bc + L2c2
L2c2
=1
2L√c × EllipticE [ArcCsc [
L√c
√b] ,
-1 + c
c] (3.7)
Assume T (x0, y0), which is the midpoint of arc NM, same way we can have the length of arc TM,
s (Arc TM) = ∫ √1 +4x2
L2c2-4(cx2)dx = -
0
x0
1
2L√c
× EllipticE [ArcSin [2x0
L√c] ,
-1 + c
c] (3.8)
Due to length of arc NM is two times of the length of arc TM, combine equation (3.7) and equation
(3.8), we can have
|EllipticE [ArcCsc [L√c
√b] ,
-1 + c
c]|
= 2* |EllipticE [ArcSin [2x0
L√c] ,
-1 + c
c]| (x0 < 0) (3.9)
By using the Mathematica and Wolfram Alpha software could not solve out x0, even though we
could not make further calculation to obtain the final modeling function, the way to calculate it is
obvious, after x0, then achieve the length of ST showed in Figure 3.11(D), followed by substitution
of it into equation (3.0) and alternate to have the final modeling function.

93
Figure 3.11 (C) Channel potential profile as a function of normalized channel length using (A),
(B) types of cell frames, and four calculation methods, channel width 2mm with 7V applied voltage;
(D) Simple scheme used for describing potential modeling calculation of ellipse.
Therefore, to achieve a reasonable modeling function for predicting potential profile of
channel cell frame, a final function was determined to use by averaging modeling potential
function equation (3.2) and equation (3.4) for most close to the experimental measured data, as
Figure 3.11(C) demonstrates, average data (dark yellow dots) is very close to real experimental
data acquire from rectangular reservoir channel cell compared with calculated ellipse 1st data
(magenta dots). And the final determined, easy to calculated and reasonable modeling potential
function shows below in equation (3.10),

94
y = p*1
2[
2xl√1+xl-xl(1-xw)√3+xl
2xw(1-xl)√1+xl+2xl√1+xl-xl(1-xw)√3+xl+
(xl+xwxl)
xl+2xw-xwxl] (0 < xl < 1, 0 < xw <
1) (3.10).
3.3.6 ECL Comparison using Closed Cell Frame and Channel Cell Frame
To verify using channel cell frame could lower down applied potential to cause same redox
reaction happens on BPE under same condition, ECL experiments was employed in BPE system
using channel cell frame, which has a 2mm channel width and 30mm length, and closed cell frame.
And BPE used a gold foil. As illustrated in Figure 3.12(A), the initial potential (defined as smallest
applied potential on driving electrodes to cause redox reaction happens on BPE) to emit ECL on
BPE is ca. 3.8V using the channel cell frame, while ca. 6V using closed cell frame, indicates using
channel cell frame does lower applied potential for increasing current density or electric field
strength.
And from Figure 3.12(B)-(C), which plotted the gray value (or ECL intensity) crossing the
anodic driving electrode acquired from closed cell frame and channel cell under 4V applied
potential, respectively, we can clearly observe a flat gray value line (Figure 3.12(B)) from using
closed cell frame, which indicates a uniform solution potential distribution in closed cell frame, a
gray value curve similar the model shape from ellipse 2nd, which further assured the right model
we built to describe the potential crossing the channel.

95
Figure 3.12 (A) ECL intensity at different applied voltage by using closed cell frame (B) and
channel cell frame (C), 2mm channel width and 30 mm length, Au foil BPE with a length of 30mm;
(B) and (C) is closed cell frame and channel cell frame under 4V applied voltage, respective, and
(D) and (E) is the corresponding surface plot of gray value (or ECL intensity) crossing the anodic
driving electrode.

96
3.3.7 Multiple BPEs Cell Frames Design
Since we already discussed the potential profile of one channel cell frame and have known
how to make an optimal fabrication of it, multiple channels (BPEs) cell frame would be studied in
this small section. And for multiple BPEs in one cell frame, two alignment would be demonstrated,
one is BPEs in a line arrangement, the other is BPEs in parallel arrangement.
In terms of BPEs in a line arrangement, two kinds of cell frames were offered to discuss, as
showed in Figure 3.13(A)-(B), herein, three BPEs with each one 6mm length were used as an
example, in Figure 3.13(A), three BPEs were placed in three small channel with same length of
BPE, two small reservoirs with length of 6mm (distance between black and red dot) to separate
the channels, thus, three BPEs totally covering 30mm length; as for comparison, the channel cell
frame showed in Figure 3.13(B) also has a 30mm channel length. And BPE crossing potential as
a function of applied potential presented in Figure 3.13(C), (C-30)/5 defines as potential of channel
(B) divided by 5; Small C-6 defines as potential across small channel from cell frame (A) (red and
blue dot); Small R-6 defines as potential across small rectangular reservoir from cell frame (A)
(red and black dot); therefore, three potential profile (black, red, and blue curve) measured across
same distance of 6mm. As demonstrated in Figure 3.13(C), small C-6 curve has a higher potential
than that of small R-6 since the electric field strength decreased in small R-6 caused by the big
reservoir structure; small C-6 and (C-30)/5 curve has similar potential when applied voltage no
bigger than 4V, indicates no big potential differences when BPEs placed in cell frame (A) or cell
frame (B), while after 5V, the potential from small C-6 is bigger becomes more obviously,
indicates using cell frames with multiple small channels would be better than one channel for BPE
system.

97
Figure 3.13 (C) Potential profile as a function of applied voltage using cell frame (A) (three
channels 2mm width × 6mm length, two rectangular reservoirs both with a 6mm length) and (B)
(channel 2mm width × 30mm length); (C-30)/5 defines potential of channel (B) divided by 5;
Small C-6 defines potential across center channel from cell frame (A) (red and blue dots); Small
R-6 defines potential across small rectangular reservoir from (A) (black and red dots).
As for BPEs in parallel arrangement, two kinds of alignment for the channels in cell frames
studied, one is the channel evenly separated distributed in the cell, with each channel toward same
effectively driving electrode area, as illustrated in Figure 3.14(A), while the other is channels were
closely placed in the central cell frame, as shown in Figure 3.14(B). The channel potential at
different channel position under different applied voltage were measured based on the two
structured channel cell frames, as demonstrated in Figure 3.14(C), the potential at different channel
position exhibits similar value when using cell frame with evenly separated channels, while
potential using cell frames from Figure 3.14(A) is slightly becoming bigger than that measured
using cell frame (B) after 4V applied voltage, meanwhile, the potential measured in middle channel

98
also becomes slight lower then that from two sides channel after 4V when using cell frame (B)
from Figure 3.14, and this behavior becomes more and more obvious as applied voltage varied
from 4V to higher one, indicates channels should evenly separate in cell frames in order to ensure
BPEs have same potential.
Figure 3.14 (C) Potential measured at different channel position under different applied voltage
by using cell frame (A) (channel evenly separated) and (B), all the channels 2mm width × 30mm
length, A-L(M/R) defines left (middle/right) channel from cell frame (A), C-L(M/R) defines left
(middle/right) channel from cell frame (B).
3.4 Conclusions
In this work, the potential profiles from open cell frame, closed cell frame, and channel cell
frame were studied. We found that closed cell frames give an uniform potential distribution
compared with open cell frames; the solution potential across the cell length does not depends on
cell frame width; and closed cell frames would be a preferred choice to use in BPE system

99
compared with open cell frames. If open cell frames are chosen, to ensure a relative uniform and
stable potential, the BPE width should be not wider than 1/3rd width of the driving electrode. As
for channel cell frames, the potential of BPE can be enhanced or increased compared with that
from using closed cell frames; to maintain the potential across BPE at least 60% solution potential
across the cell, and avoid the interference from the reactions happening at the driving electrode, a
optimal channel cell frame design/fabrication, the normalized cell width should not larger than 0.2
and normalized cell length should be in the range of 0.4 to 0.8; the potential across the channel is
also described using several models (rectangle, trapezoid, ellipse 1st and ellipse 2nd) based on the
variables of channel length and width, we find that the model of ellipse 2nd is most accurate,
however, a final modeling function to predict and describe the channel potential is determined by
averaging function of trapezoid and ellipse 1st for simplicity of calculation as well as acceptable
accuracy.
In conclusion, this work may give a guideline to some researchers what kind of cell frame
they should choose, what is the optimal cell frame fabrication for their BPE system.

100
References
1. Koefoed, L.; Pedersen, S. U.; Daasbjerg, K., Bipolar electrochemistry—A wireless
approach for electrode reactions. Current Opinion in Electrochemistry 2017, 2 (1), 13-17.
2. Ramaswamy, R.; Shannon, C., Screening the Optical Properties of Ag− Au Alloy
Gradients Formed by Bipolar Electrodeposition Using Surface Enhanced Raman Spectroscopy.
Langmuir 2011, 27 (3), 878-881.
3. Shannon, C.; Wang, B.; Yu, S., Reduction of 4‐Nitrothiophenol on Ag/Au Bimetallic Alloy
Surfaces Studied Using Bipolar Raman Spectroelectrochemistry. ChemElectroChem 2020.
4. Zhang, X.; Lazenby, R. A.; Wu, Y.; White, R. J., Electrochromic, Closed-Bipolar
Electrodes Employing Aptamer-Based Recognition for Direct Colorimetric Sensing Visualization.
Analytical Chemistry 2019, 91 (17), 11467-11473.
5. Sheridan, E.; Hlushkou, D.; Knust, K. N.; Tallarek, U.; Crooks, R. M., Enrichment of
cations via bipolar electrode focusing. Analytical chemistry 2012, 84 (17), 7393-7399.
6. Kumsapaya, C.; Limtrakul, J.; Kuhn, A.; Zigah, D.; Warakulwit, C., Bipolar electrografting
on the inner wall of carbon nanotubes. ChemElectroChem 2016, 3 (3), 410-414.
7. Gamero-Quijano, A.; Molina-Osorio, A. F.; Peljo, P.; Scanlon, M. D., Closed bipolar
electrochemistry in a four-electrode configuration. Physical Chemistry Chemical Physics 2019, 21
(19), 9627-9640.
8. Mavré, F.; Chow, K.-F.; Sheridan, E.; Chang, B.-Y.; Crooks, J. A.; Crooks, R. M., A
theoretical and experimental framework for understanding electrogenerated chemiluminescence
(ECL) emission at bipolar electrodes. Analytical Chemistry 2009, 81 (15), 6218-6225.
9. Gamburg, Y. D.; Zangari, G., Theory and practice of metal electrodeposition. Springer
Science & Business Media: 2011.

101
10. Markovic, N. M., Electrocatalysis: interfacing electrochemistry. Nature materials 2013, 12
(2), 101-102.
11. Bard, A. J.; Faulkner, L. R., Fundamentals and applications. Electrochemical Methods
2001, 2 (482), 580-632.
12. Favaro, M.; Jeong, B.; Ross, P. N.; Yano, J.; Hussain, Z.; Liu, Z.; Crumlin, E. J.,
Unravelling the electrochemical double layer by direct probing of the solid/liquid interface. Nature
communications 2016, 7 (1), 1-8.
13. Chan, S.; Chen, X.; Khor, K., Reliability and accuracy of measured overpotential in a three-
electrode fuel cell system. Journal of applied electrochemistry 2001, 31 (10), 1163-1170.

102
Chapter 4
Cathodic Electrochemiluminescence Glucose Biosensor Using Closed Bipolar Electrode
System
4.1 Introduction
Diabetes, one of the global diseases, plays a crucial part in effecting human health, and
persistently high blood glucose levels may cause generalized vascular damage leading to cardiac
arrest, failure function of kidney, and various complications.1 It was estimated that there are 451
million (age 18–99 years) people suffering diabetes worldwide in 2017, and expected to increase
to 693 million by 2045.2 Therefore, screening and monitoring blood glucose, guide people on
whether need seeking clinical help is very important.3 Glucose oxidase (GOx), which is a
hydrodynamic Metallo-flavoenzyme contains two flavin adenine dinucleotide (FAD) redox
cofactors and two iron moieties, is commonly used for enzymatic glucose biosensor design become
of its low cost and high sensitivity and selectivity.4-5 It’s been decades since Clark and Lyons6
proposed the concept of glucose enzyme electrodes, which considered as first-generation glucose
biosensor prototype, used oxygen to regenerate GOx(FAD) (oxidized form of GOx) and detect
glucose based on monitoring consumption of oxygen or the production of hydrogen peroxide. And
the reactions show as below (Eqs 4.1-4.3):
GOx(FAD) + β-ᴅ-glucose → GOx(FADH2) + glucono-δ-lactone (4.1)
glucono-δ-lactone + H2O → ᴅ-gluconic acid (4.2)
GOx(FADH2) + O2 → GOx(FAD) + H2O2 (4.3)
Due to Clark’s design as so successful, many research and commercial biosensors have been
produced by employing the original concept O2 or H2O2 measurement. However, the 10-fold
excess of glucose over oxygen in blood that ‘oxygen deficit’ becomes the most serious problem

103
for the first generation biosensor.7 Then, the so called ‘second generation’ first developed by Cass
et al.8 used ferrocene derivatives such as ferrocene carboxylic acid to replace oxygen as mediator,
which aimed to deliver electrons between the enzyme active site and the electrode, to avoid
dependence on ambient oxygen. An ideal mediator should be able to react rapidly with the reduced
enzyme; exhibit reversible heterogeneous kinetics; possess reversible and stable redox forms; have
a low redox potential; independent on pH and inert with O2.9 And the commonly used mediators
are Prussian blue,10 quinones,11 ferrocene and ferrocene derivatives,12 viologen,13 ruthenium,14 etc.
For the third-generation glucose biosensors are much more interesting since one of the important
and fundamental concepts is mediator-free direct electron transfer between the active center of the
redox enzyme and the electrode surface. However, the direct electron transfer between the redox-
active cofactor (FAD) and the electrode surface is very difficult because FAD redox cofactors are
deeply embedded inside the nonconducting layer of the rigid protein structure.15 Therefore, many
methods have proposed to overcome the challenge and achieve the direct electron transfer between
the enzyme and electrodes without mediator, such as the using of conductive nanomaterials like
carbon nanotubes,16 TiO2 nanosheets array/carbon cloth,17 gold nanoparticles,18 etc. Although third
generation glucose biosensor has a low detection limit,18-19 a lot a scientific research need to
perform before lay it into practical applications.
Electrochemiluminescence (ECL), also known as electrogenerated chemiluminescence, is an
electrochemical luminescence process, where the light emission initiated by the active species,
which located at excited states, undergo high energy electron transfer reactions at the electrode.20-
21 And it can be generated under anodic and cathodic conditions. 𝑅𝑢(𝑏𝑝𝑦)3𝐶𝑙2 22 and luminol23
are commonly used as ECL luminophores, while in a co-reagent ECL system, tripropylamine
(TPrA), persulfate (𝑆2𝑂82−), oxalate (𝐶2𝑂4
2−) commonly used as co-reagents that could form

104
strong reducing or oxidizing agents upon electrochemical oxidized or reduced.24 Due to the low
background signal, high detection sensitivity, ease of controllability, simple optical setup, without
requiring extrinsic illumination, etc.,25-26 ECL has been widely used for analytical applications,
such as dopamine,27 antigen,28 glucose,29 glutathione,30 RNA,31 and so on.32
Bipolar electrochemistry or bipolar electrode (BPE) system, is an unconventional technique
where an conductive material (BPE) that is immersed into a solution (open BPE system) or two
separated solutions (closed BPE system) without any wire connection with an external power
source. Exploiting the wireless nature of BPEs in solutions, BPE technique used in various areas,
wastewater treatment,33 energy,34 material catalysis,35 cation enrichment,36 analytical sensors,37 for
example. Since ECL was first introduced to BPEs for reporting electrochemical reactions in
2001,38 the technique of BPE combined with ECL has attracted great attention in analytical
applications.39-40 For instance, a nanopipette, in which the tip are decorated by a Pt deposit used
as an open BPE-ECL device, was developed by researchers41 to achieve intracellular wireless
electroanalysis of H2O2 or glucose; Xu group reported a disposable paper-based BPE based on
ECL for the detection of cancer biomarker (PSA) for the first time;42 Zhang group enhanced the
sensitivity of glucose sensor based on BPE-ECL through the decoration of cathodic pole of BPE
with chitosan, multi-walled carbon nanotubes, graphene quantum dots and gold nanoparticles,
achieved a glucose detection range of 0.1-5000uM.23 However, as for many cathodic ECL systems
require very negative potentials to generate light,43 cathodic ECL may not that preferred compared
with anodic ECL by the researchers in scientific researches. To our knowledge, any publications
in terms of glucose biosensor using cathodic ECL in a closed BPE (C-ECL-C-BPE) system have
not seen so far, and using a C-ECL-C-BPE system to design glucose biosensor worth to try.

105
Figure 4.1 Cathodic ECL Glucose biosensor Mechanism in Closed BPE system.
Herein, a cathodic ECL sensor in closed BPE system have been proposed for the measurement
of glucose. And its basic schematic structure and operational mechanism illustrated in Figure 4.1.
Compared with open BPE system, the closed BPE system is comprised of two cells, one is
reporting cell that usually contains chemiluminescent and co-reagent, and the other one is sensing
cell used for detecting interested analytes, which makes the reporting molecules not interfere the
interested analyte during detecting performance; another main advantage of closed BPE system is
the current passes through the whole system is same, which could increase the current efficiency
on the BPE and lower the external applied voltage, and a lower applied voltage could further lower
byproducts generation on the driving electrodes and may lead to increase the stability and
sensitivity of measurement. In this report, ECL solution used 𝑅𝑢(𝑏𝑝𝑦)32+
as luminophore,

106
K2S2O8 as co-reagent, and the ECL emission on cathodic pole of BPE could be generated from the
reaction between 𝑅𝑢(𝑏𝑝𝑦)3+
and sulfate radicals (𝑆𝑂4•−), the reaction between 𝑅𝑢(𝑏𝑝𝑦)3
+ and
𝑅𝑢(𝑏𝑝𝑦)33+
in the reporting cell, and the reactions show below (Eqs. 4.4-4.9): 44-45
𝑒− + 𝑆2𝑂82− → 𝑆𝑂4
•− + 𝑆𝑂42− (4.4)
𝑅𝑢(𝑏𝑝𝑦)32+ + 𝑒− → 𝑅𝑢(𝑏𝑝𝑦)3
+ (4.5)
𝑅𝑢(𝑏𝑝𝑦)32+ + 𝑆𝑂4
•− → 𝑅𝑢(𝑏𝑝𝑦)33+ + 𝑆𝑂4
2− (4.6)
𝑅𝑢(𝑏𝑝𝑦)3+ + 𝑆𝑂4
•− → 𝑅𝑢(𝑏𝑝𝑦)32+∗ + 𝑆𝑂4
2− (4.7)
𝑅𝑢(𝑏𝑝𝑦)33+ + 𝑅𝑢(𝑏𝑝𝑦)3
+ → 𝑅𝑢(𝑏𝑝𝑦)32+∗ + 𝑅𝑢(𝑏𝑝𝑦)3
2+ (4.8)
𝑅𝑢(𝑏𝑝𝑦)32+∗ → 𝑅𝑢(𝑏𝑝𝑦)3
2+ + ℎ𝑣 (4.9)
In the sensing cell, the commercial blood glucose test strips that already modified with
GOx(glucose oxidase) and mediator were used to detect glucose. To better illustrate the reaction
processes during the measurement, two normal electrodes drawn in the sensing cell instead of
commercial test strip, as showed in Figure 4.1(A). In the represent of glucose, oxidized form of
GOx, denoted as GO(FAD), will oxidize it to gluconolactone, which will become gluconic acid in
the present of aqueous condition. And at the same time, GO(FAD) is reduced to GO(FADH2),
which will be oxidized back to GO(FAD) by the oxidized form of mediator that oxidized by the
BPE anode under certain applied external voltage through a DC power supply on the sensor system.
All these three reactions are describing on Figure 4.1(A). Once the glucose solution changed into
higher concentration, it will accelerate these three reaction processes happening on the BPE anode,
in other way, higher current would be generated. Since the glucose sensor established on the closed
BPE system, the current passes through all four electrodes is same, the BPE cathode need higher
current go through to compensate for the current change on the BPE anode, which means more
𝑅𝑢(𝑏𝑝𝑦)32+
and 𝑆2𝑂82− will be reduced and more 𝑅𝑢(𝑏𝑝𝑦)3
+ and 𝑆𝑂4
•− will be evolved, and

107
much higher intensity of ECL light will be emitted, as illustrated in Figure 4.1(B). Therefore, the
cathodic ECL light intensity change as a function of glucose concentration would be established,
and the cathodic ECL glucose biosensor in a closed BPE system would become reasonable and
achievable in the practical way.
4.2 Experimental section
4.2.1 Chemicals and Reagents
All solutions were prepared with deionized, ultra-pure water (VWR Type II). Glucose
Oxidase (GOx) from Aspergillus niger (Type X-S, lyophilized powder, 149500 units/g solid,
purchased from Sigma-Aldrich), D-(+)-Glucose (99.5%, Sigma-Aldrich), Tris(2,2’-bipyridyl)
dichlororuthenium(II) hexahydrate (Ru(bpy)3Cl2·6H2O) (99.95%, Sigma-Aldrich), Acetonitrile
(anhydrous,99.8+%, Alfa Aesar), Sodium phosphate dibasic anhydrous (Sigma-Aldrich), Sodium
Phosphate Monobasic (98.8%, Fisher Scientific), Sulfuric Acid (Fisher Chemical), MicroPolish
Alumina ( 1.0 micron, 0.3 micron and 0.05 micron) and Chemomet Polishing Cloth ( all purchased
from BUEHLER), Capillary tubes (I.D. 1.1-1.2 mm, Wall 0.2 ± 0.02 mm, Kimble Chase), Silver
wire (0.25mm diameter, 99.99%, Sigma-Aldrich), Glassy carbon electrode (3mm diameter,
Bioanalytical Systems, Inc.), human Serum samples (BioIVT), Potassium persulfate (Millipore
Sigma), Potassium hexacyanoferrate(II) trihydrate (98.5%, Strem Chemicals), Nafion
perfluorinated resin solution (5 wt% in lower aliphatic alcohols and water, contains 15-20% water,
Sigma-Aldrich), hydroquinone (99%, Alfa Aesar), Glutaraldehyde solution (Grade II, 25% in H2O,
Sigma-Aldrich ). Multi-walled carbon nanotubes (TCI, 10-20nm diameter, 5-15 μm length), Multi-
walled carbon nanotubes (Nanolab, 30nm diameter, 1-5 μm length).

108
4.2.2 Apparatus
Panasonic Lumix DMC-LX3 Camera (Panasonic Corporation, Osaka Japan),
Electrochemical Potentiostat (Pine Instrument), Power supply (9122A 0-60V/0-2.5A Single
Output Programmable DC, B&K Precision Corporation), PMT(photomultiplier tube) (HC-120-05
(HAMAMATSU, PhotoSensor Modules), Hantek multifunction DAQ device (USB-
6002)(National Instruments), Contour NEXT EZ Diabetes Testing Kit (Contour NEXT EZ Blood
Glucose Meter, Contour NEXT Blood Glucose Test Strips, Lancets, Lancing Device, Control
Solution) (Amazon).
4.2.3 Modification of glassy carbon electrodes (GCEs) with GOx
The glassy carbon electrodes (GCEs) were polished by using 1 micron, 0.3 micron and 0.05
micron Alumina starting with most coarse and finishing with the finest grade, followed by
sonicating in EtOH and water for 5 mins, respectively, then scanned 20 cycles using cyclic
voltammetry with 50 mV/s scan rate in 0.1 M sulfuric acid, and finally washed with D.I. water and
dried with flowing nitrogen.
Prior to use, MWCNTs (multi-walled carbon nanotubes) were functionalized and purified by
sonicating in a mixture of concentrated nitric acid and sulphuric acid (1:3, v/v) at 60 Celsius degree
for 3 hours, neutralized with D.I. water and centrifuged the solution with 15000 rpm for 30min,
remove the supernatant and dissolve MWCNTs in D.I. water, repeat 3 times and dried with Bella
Dryer/cooler.
GCE/GOx/GA/Nafion modification: A mixed solution prepared by mixing 30 μL GOx
(1000U), 40 μL glutaraldehyde (GA), and 50 μL 0.1M PBS buffer. 3 μL mixed solution was put
on the surface of GCE and dried under ambient condition, then 2 μL Nafion solution was put on it

109
and dried under ambient condition. Finally, the modified GCE was dipped into PBS buffer under
4 Celsius degree overnight, then modified GCE ready to use.
GCE/GOx/GA/MWCNTs /Nafion modification: A mixed solution prepared by mixing 30 μL
GOx (1000U), 40 μL glutaraldehyde (GA), 30 μL MWCNTs (0.5 mg/mL), and 20 μL 0.1M PBS
buffer. 3 μL mixed solution was put on the surface of GCE and dried under ambient condition,
then 2 μL Nafion solution was put on it and dried under ambient condition. Finally, the modified
GCE was dipped into PBS buffer under 4 Celsius degree overnight before to use.
4.2.4 Preparation of C-ECL-C-BPE glucose biosensor and data acquisition
For the C-ECL-C-BPE (cathodic ECL in closed BPE system) glucose biosensor, two GCEs
(one electrode is anodic driving electrode, the other is cathodic BPE) used in the reporting cell
through all the experiments, commercial Contour NEXT blood glucose test strip used in the
sensing cell; all the ECL intensity using C-ECL-C-BPE sensor method acquired with a PMT
(photomultiplier tube); after each measurement, the two GCEs rinsed with D.I. water and dried
with nitrogen; all ECL solution used 𝑅𝑢(𝑏𝑝𝑦)32+
as luminophore, K2S2O8 as co-reagent, prepared
in 0.1M PBS buffer contains 35% (v/v) acetonitrile, pH=8, bubbled with nitrogen; all glucose
solution prepared in 0.1M PBS buffer with pH=7.
Data acquisition: For ECL intensity calibration curve signal, each data point acquired the
highest point from the ECL spectrum collected by PMT.
4.3 Results and discussion
4.3.1 Effect of Acetonitrile for Cathodic ECL
Cathodic ECL is the emission of light initiated by electrochemical method produced on the
cathode of electrode. As illustrated from Eqs.4-9, there are two ways to initiate the light. One is
the reaction between 𝑅𝑢(𝑏𝑝𝑦)3+
and 𝑆𝑂4•−, and the other is the annihilation between 𝑅𝑢(𝑏𝑝𝑦)3
+

110
and 𝑅𝑢(𝑏𝑝𝑦)33+
. And the generation of 𝑅𝑢(𝑏𝑝𝑦)33+
also contains two path ways, one is the
reaction between 𝑅𝑢(𝑏𝑝𝑦)32+
and 𝑆𝑂4•−, and the other is from the anode of driving electrode. In
order to eliminate the possible interference that the ECL light may be observed on or near area of
the anode of driving electrode through the diffusion of 𝑅𝑢(𝑏𝑝𝑦)3+
, generated on the BPE cathode,
and 𝑅𝑢(𝑏𝑝𝑦)33+
, oxidized from the driving anode, when binding the driving anode and BPE
cathode together in the reporting cell, three GCEs were bound together, one is connecting positive
side of a DC power supply, one is connecting negative side, and the third one is connecting nothing
as a blank comparison, as indicated in Figure 4.2(A). And three GCEs immersed in ECL solution,
the ECL emission can only be observed on the one connected negative DC power supply, as
illustrated in Figure 4.2(B). To further rule out the ECL light may be observed on or near area of
the anode of driving electrode, the light emission were collected from the three GCEs at 10 sec,
60 sec and 120 sec, as shown from Figure 4.2(C)-(E), still the ECL light can be observed only on
the one connected to negative DC power supply at 3.3V applied voltage. All of these indicate ECL
emission only happens on the cathodic electrode when using 𝑅𝑢(𝑏𝑝𝑦)32+
as luminophore and
persulfate as co-reagent, and 𝑅𝑢(𝑏𝑝𝑦)3+
generated from cathode and 𝑅𝑢(𝑏𝑝𝑦)33+
oxidized from
anode would not or not have enough time to diffuse to each other and emit the light before they
were quenched by the surrounding environment under 2 mins.

111
Figure 4.2 (A)-(F) experimental setup: three GCEs binding together dipping in ECL solution
(0.5mM 𝑅𝑢(𝑏𝑝𝑦)32+
, 10mM K2S2O8), one connected positive DC power supply, one connected
the negative and the last one connected nothing as comparison for the other two electrodes. (A)
and (B) are the camera screenshot of experimental setup before and after measurement; (C)-(E)
collected after experiment begins 10 sec, 60 sec and 120 sec under 3.3V applied DC voltage,
respectively, in ECL solution contains 35% acetonitrile, while (F) collected under same condition
but with ECL solution without acetonitrile; (G) collected using cyclic voltammetry scanned from
(-0.5)V to (-1.5)V, (-1.6)V and (-1.7)V, respectively, ECL solution used contains 35% acetonitrile
for the first two measurements (yellow area) while the last one does not contain it (pink area), scan
rate is 50mV/s, GCE as working electrode, Ag wire as quasi-reference electrode, Pt grid as counter
electrode.

112
To study the effect of acetonitrile for the emission of cathodic ECL, two kind of ECL solution
prepared to use, one contains 35%(v/v) acetonitrile, the other does not, while both are prepared in
0.1M PBS with pH=8. Data of Figure 4.2(C)-(E) are collected in ECL solution contains acetonitrile
shows much stronger and more stable ECL emission, while Figure 4.2(F) collected in ECL solution
without acetonitrile under same experimental setup and applied voltage can barely to be observed.
Same conclusion can be achieved from Figure 4.2(G), which collected using cyclic voltammetry,
that the ECL emission can be initiated at much lower potential and much stronger light signal in
ECL solution contains acetonitrile compared with that collected in ECL solution without it. All
these results are consistent with previous research46 that 𝑅𝑢(𝑏𝑝𝑦)3+
is very unstable in aqueous
solutions and adding organic solvent such as acetonitrile could stabilize and increase the ECL
emission.
4.3.2 Oxygen Effect for Cathodic ECL
As for studying the effect of oxygen on the emission of cathodic ECL, ECL intensity signals,
which are collected with ECL solution bubbled/ not bubbled nitrogen using chronoamperometry
at different applied potential (-1.45V, -1.5V and -1.55V vs Ag wire quasi-reference electrode),
compared. As Figure 4.3(A)-(C) shows, ECL intensity that performed in ECL solution without
bubbling nitrogen is stronger than that from solution degassed nitrogen. The reasons for this are
the cathodic ECL emission are not just from a series of reactions between 𝑅𝑢(𝑏𝑝𝑦)32+
and
persulfate, as mentioned above from Eqs.4-9; some types of reactive oxygen species such as H2O2,
•OH and 𝑂2•− could be produced when the dissolved oxygen was reduced under the reduction
potential, H2O2 can react with 𝑂2•− to generate •OH, which can oxidize 𝑅𝑢(𝑏𝑝𝑦)3
2+ to form
𝑅𝑢(𝑏𝑝𝑦)33+
, and 𝑅𝑢(𝑏𝑝𝑦)33+
can react with 𝑂𝐻− to generate more 𝑅𝑢(𝑏𝑝𝑦)32+∗
, therefore,
much more intense ECL light could be emitted.47-48

113
Figure 4.3 (A)-(C) collected using chronoamperometry at different potential for 10 sec in ECL
solution (0.25mM 𝑅𝑢(𝑏𝑝𝑦)32+
, 0.5mM K2S2O8 in 0.1M PBS buffer contains 35% acetonitrile,
pH=8) with/without bubbling N2, GCE as working electrode, Ag wire as quasi-reference electrode,
Pt grid as counter electrode. (D) collected C-ECL-C-BPE glucose biosensor used commercial
glucose blood test strip measured 12 mM glucose with ECL solution (62.5uM 𝑅𝑢(𝑏𝑝𝑦)32+
,
0.125mM K2S2O8) with/without bubbling N2 in the reporting cell under 3.6V applied DC voltage
with 5 sec for each measurement.

114
Figure 4.14 Cyclic voltammograms of GCE, (A) scanned in 0.1M PBS buffer (contains 35%
acetonitrile) bubbled N2 and 1mM K2S2O8 in 0.1M PBS buffer (contains 35% acetonitrile) bubbled
N2; (B) scanned in ECL solution (0.5mM 𝑅𝑢(𝑏𝑝𝑦)32+
, 1mM K2S2O8) with/without bubbling N2.
Scan rate is 30mV/s, Ag wire as quasi-reference electrode, Pt grid as counter electrode.
However, involving with oxygen into ECL solution used for cathodic ECL glucose biosensor
in a closed BPE system is not a good choice, since the concentration of dissolved oxygen is not
low (ca. 8-9 mg/L in water at room temperature and 1 atm)49, cathodic current from the reduction
of oxygen can compensate for the anodic current from BPE and result in only small part of current
or no current coming from the reduction of 𝑅𝑢(𝑏𝑝𝑦)32+
and persulfate, the standard reduction
potentials of 𝑅𝑢(𝑏𝑝𝑦)32+
and persulfate are lower than that of oxygen, as indicated in Figure 4.4,
the reduction peak potenital for oxygen is ca. (-0.8)V while ca. (-1.2)V for persulfate and (-1.7)V
for 𝑅𝑢(𝑏𝑝𝑦)32+
versus Ag wire quasi-reference electrode, which used to generate the cathodic
ECL emission on the cathode of BPE for the reporting of detection signal, in other way, it may
result in a failure of detection of a sensor. For example, in the cathodic ECL glucose biosensor in
a closed BPE system, the ECL signal is much stronger when the ECL solution bubbled nitrogen,

115
as shown in Figure 4.3(D) when the sensor performed in 12 mM glucose solution, while the ECL
signal almost a flat line ( Figure 4.3(D) black line) detected by the PMT using ECL solution
without bubbling nitrogen under the same applied DC voltage.
4.3.3 Electrochemical study of modified GCEs
To study the electrochemical performance of modified GCEs in the glucose solution, two
kinds of modified GCEs were scanned in glucose solution using cyclic voltammetry, one is
GCEs/GOx/GA/Nafion electrode, the other is GCEs/GOx/GA/MWCNTs/Nafion. When increase
the glucose concentration, it would increase the reaction rate of GO(FAD) reduced to GO(FADH2),
which will be oxidized back to GO(FAD) by the oxidized form of mediator (hydroquinone) that
oxidized on the surface of the modified GCEs, thus a higher current would be generated. As Figure
4.5 indicates, a clear observation of current increasing as modified GCEs scan from 0 to 50 mM
concentrated glucose solution, as expected. However, the stability and reproducibility of modified
GCEs are not good, as Figure 4.5(B)-(C) shows, no matter GCEs/GOx/GA/Nafion electrode or
GCEs/GOx/GA/MWCNTs/Nafion electrode, a huge net current (the oxidation peak current of CV
in certain concentrated glucose solution subtracts that with no glucose in it) differences generated
from three sets of measurements with individual modified GCE. We believe the reasons for this
may come from two ways, one is the thickness of casted nafion films are different, the other is the
interference of GOx and GA when casting nafion film since the nafion solution contains water (15-
20%) and alcohol (ca. 80%), which could re-dissolve GOx and GA during the modification of GCE
process. All of this note that using modified GCE as BPE anode is not a good choice to design C-
ECL-C-BPE glucose biosensor, unless the stability of Nafion film achieved.

116
Figure 4.5 (A) Cyclic voltammograms of modified GCEs/GOx/GA/Nafion electrode scanned in
different concentrated glucose solution contains 1mM hydroquinone, Ag/AgCl as reference
electrode, and Pt grid as counter electrode, scan rate 20 mV/s; (B) the calibration curves of cyclic
voltammograms from GCEs/GOx/GA/Nafion electrode, each color curve represent from one
individual modified GCEs/GOx/GA/Nafion electrode measurement;(C) same as (B) except the
electrode modified with GCEs/GOx/GA/MWCNTs/Nafion.

117
Figure 4.6 (A) ECL intensity curves from C-ECL-C-BPE method using GCEs/GOx/GA/Nafion
electrode as BPE anode as the applied voltage employed from 4500mV to 5580mV; (B) Initiated
ECL voltage from two sets of ECL intensity curves employed C-ECL-C-BPE method using
GCEs/GOx/GA/Nafion electrode as BPE anode.
To verify the feasibility of C-ECL-C-BPE glucose biosensor method, the modified
GCEs/GOx/GA/Nafion electrode used as BPE anode, which were bound with another bare GCE
that serves as driving cathode in the sensing cell. The applied voltage scanned from low to high
(4500mV to 5680mV) with 10mV/s to find out the voltage that could generate ECL signal at

118
different concentrated glucose solution. As Figure 4.6(A) demonstrated, the voltage to initiate ECL
light decreasing as increasing glucose concentration from 3mM to 20mM. Similar trends could be
observed in Figure 4.6(B), where the initiated ECL voltage (defined as the smallest voltage to
initiate ECL light) decreasing as increasing glucose concentration. Two color curves represent two
individual sets of performance using modified GCEs/GOx/GA/Nafion electrode. Even though a
big difference of the initiated ECL voltage curves, which caused by instability and irreproducibility
of modified BPE anode (GCEs/GOx/GA/Nafion electrode) mentioned above, it verified the
feasibility and the achievable of the C-ECL-C-BPE glucose biosensor method.
4.3.4 Electrochemical study of commercial blood glucose test strips
Due to the instability and irreproducibility of modified GCEs, commercial blood glucose test
strips were used for further study. The test strips are already modified with GOx and mediator. As
illustrated in Figure 4.7, four connections are showing on the test strips, L1 connected to the center
of sensing spot that cover with GOx and mediator has a very high probability serves as BPE anode;
L3 has a high chance serves as reference electrode that designed to use with commercial glucose
meter showed in Figure 4.7(A). Either L2 or L4 serves driving cathode in the sensing cell of closed
BPE system. In this small section, L2 was chosen serves as driving cathode to study the C-ECL-
C-BPE glucose biosensor.

119
Figure 4.7 (A) Commercial contour next EZ blood glucose meter; (B) and (C) are un-used glucose
test strip and used one, respectively; (D) is inside structure of un-used test strips, and (E) is the
used one. Note that the white line on the test strip is insulating.

120
Figure 4.8 (A) ECL signal calibration curve as a function of glucose concentration, L1 is BPE
anode, and L2 as driving cathode, ECL solution (62.5uM 𝑅𝑢(𝑏𝑝𝑦)32+
, 0.125mM K2S2O8), applied
voltage 4800mV; (B) is ECL intensity spectra corresponding to (A); (C) is ECL intensity spectrum
scanned in serum sample.
A reasonable ECL signal calibration curve as a function of glucose concentration (prepared
in 0.1M PBS buffer with pH=7)employing C-ECL-C-BPE method achieved, as illustrated in
Figure 4.8(A), the ECL solution contains 62.5μM 𝑅𝑢(𝑏𝑝𝑦)32+
and 0.125mM K2S2O8, and a
voltage of 4800mV applied to the glucose biosensor. Then a serum sample was used to test the
performance of C-ECL-C-BPE glucose biosensor in human blood sample, as showed in Figure

121
4.8(C), the ECL intensity signal of light spectrum is very low (ca. 0.045V), out of detection range
from the calibration curve showed in Figure 4.8(A) (0.7 V for 1mM glucose), while a 4.5mM
glucose acquired using the commercial blood glucose meter. The reason to cause the inconsistent
measurement between C-ECL-C-BPE glucose biosensor and commercial glucose meter, is
probably two different aqueous system, the former is 0.1M PBS buffer, the latter one is human
blood, the resistance of former is smaller than latter, which cause a decreasing current when
measuring the blood sample. One way to avoid the big resistance change between BPE anode and
driving cathode is short the distance.
Therefore, L4 was chosen for further study of C-ECL-C-BPE glucose biosensor. Note that,
without further notification, L4 always serves as the BPE anode when using test strips in C-ECL-
C-BPE glucose system.
4.3.5 Performance of the Proposed Cathodic ECL Glucose biosensor in Closed BPE System
Two GCEs (3mm diameter) were bound together used in the reporting cell, and commercial
blood glucose test strips that already modified GOx and mediator were used in the sensing cell for
the proposed C-ECL-C-BPE glucose biosensor. For the rest research, L4 serves driving cathode in
the C-ECL-C-BPE glucose system. And the ratio of 2:1 was chosen for the persulfate co-reagent
with 𝑅𝑢(𝑏𝑝𝑦)32+
luminophore to prepared ECL solution. The volume of ECL solution used ca.
3mL in a small glass vial as the reporting cell for each measurement. To decrease the error
difference of each measurement, two GCEs used in the reporting cell were rinsed with D.I. water
and dried with nitrogen each time on the successively measurements, and the 3mL ECL solution
changed to new one. Since the measuring range of light intensity by the PMT is from 0 to 10.5V,
and the lowest glucose concentration for the commercial glucose meter (contains the test strip) can

122
determine is 1mM, the voltage used to apply on the proposed C-ECL-C-BPE glucose biosensor
determined by adjusting the PMT light signal around 1V measuring 1mM glucose solution.
Figure 4.9 (A) collected four individual cathodic ECL intensity measurement of 5mM and 12
mM glucose in closed BPE system, commercial glucose blood test strip used to measure in the
sensing cell and two GCEs in the reporting cell with Q =(62.5uM 𝑅𝑢(𝑏𝑝𝑦)32+
, 0.125mM K2S2O8)
ECL solution; (B) is the ECL intensity (V) calibration curve of glucose measurement using C-
ECL-C-BPE glucose biosensor method with Q concentrated ECL solution as function of
concentration; red line is the logistic fit of the data, blue line in the yellow area is the linear fitting
of the data; (C) is the ECL intensity signals corresponding to calibration curve of (B); (D) is the
calibration curves of ECL intensity at different concentration as function of glucose concentration
using C-ECL-C-BPE glucose biosensor method. All the measurements obtained under 3.6V
applied DC voltage and 5 sec except for 4Q curve achieved under 3635mV, each data point
measured at least three times.

123
To investigate the reproducibility and stability of proposed C-ECL-C-BPE glucose biosensor,
four individual measurements were performed in 5mM and 12mM glucose solution with Q
=(62.5uM 𝑅𝑢(𝑏𝑝𝑦)32+
, 0.125mM K2S2O8) ECL solution under 3.6V applied voltage from the DC
power supply that determined from above mentioned method, as demonstrated in Figure 4.9(A),
the ECL signal is ca. 2.3V in 5mM glucose solution and ca. 6.7V in 12 mM, and consistent with
each measurement, which shows great reproducibility and stability for the proposed glucose
biosensor. Thus, the ECL intensity calibration curve as a function of glucose concentration was
collected by using Q concentrated ECL solution, each data point on the calibration curve measured
at least three times with 5 sec for each measurement, as illustrated in Figure 4.9(B)-(C), the ECL
intensity gradually increases as glucose concentration varied from 1mM to 18mM, and shows a
linear relationship with the glucose concentration in the range of 5mM to 12mM (R2=0.998), which
shown in the yellow area of Figure 4.9(B), and the red curve is the logistic fitting of collected data
(R2=0.999). The limit of detection (defined as the concentration of glucose generating ECL signal
three times higher than the standard deviation when it subtracts that of 1mM, which was treated as
blank sample since it is the lowest concentration of glucose for the commercial test strip with the
blood glucose meter can be measured) was calculated from the red fitting curve to be 3.8mM, and
the sensitivity (defined as the smallest glucose concentration change that generating ECL signal
higher than the standard deviation of blank sample) of proposed glucose biosensor using Q
concentrated ECL solution is ca. 0.2mM.

124
Figure 4.10 (A) and (C) are ECL Signal intensity curves as function of measuring glucose
concentration using different concentrated ECL solution, each data point measured at least three
times; (B) and (D) are the ECL signal responses at different glucose concentration corresponding
(A) and (C), respectively. Two GCEs used in the sensing cell under 4.6V applied voltage and 5
sec for each measurement.
To better understand the mechanism of proposed C-ECL-C-BPE glucose biosensor, different
ECL intensity calibration curves were collected as a function of glucose concentration using
different concentrated ECL solution (0.5Q, 2Q and 4Q), as indicated in Figure 4.9(D) (as for the
corresponding ECL intensity spectra curves see Figure 4.10), the ECL intensity increases as
glucose concentration varies from low to high, as expected, higher concentration of glucose would

125
produce higher current on anode of BPE, and higher cathodic current generated from reduction of
𝑅𝑢(𝑏𝑝𝑦)32+
and persulfate on cathode of BPE was needed to compensate for it since current going
through anode and cathode of BPE is same, which would obtain more 𝑅𝑢(𝑏𝑝𝑦)3+
and 𝑆𝑂4•− and
result in stronger emission of ECL light, as mentioned above for the mechanism explanation of
proposed C-ECL-C-BPE glucose biosensor in Figure 4.1. In terms of the black calibration curve
of 0.5Q in Figure 4.9(D), the ECL intensity signal is low compared with that of red curve of Q at
the same glucose concentration, even at higher concentration such as 12mM, the ECL intensity
signal increased less than 1V compared with that of its blank point (mentioned above, defined as
1mM glucose concentration), we believe that is due to the concentration of 𝑅𝑢(𝑏𝑝𝑦)32+
and
persulfate used in the ECL solution too low, the limit amount of 𝑅𝑢(𝑏𝑝𝑦)32+∗
that could be
generated, even though with increasing concentration of glucose. On the other hand, under the
same applied potential, the ECL signal of blue calibration curve of 2Q increased sharply starts
from 5mM, and reaches the measuring threshold of PMT at 12mM glucose, as the gray area
showed in Figure 4.9(D), compared to that of red calibration curve of Q. This is probably owning
to the cathodic current of BPE used to compensate for the increasing anodic current caused by the
increased glucose concentration all contributes to reducing more 𝑅𝑢(𝑏𝑝𝑦)32+
and persulfate and
generating more 𝑅𝑢(𝑏𝑝𝑦)32+∗
, which results in a sharp increasing of ECL intensity. Furthermore,
a small phenomenon should be noticed that the lowest detection limit of the calibration curve is
gradually increasing as the ECL concentration varied from Q to 2Q, and it becomes much more
obvious when ECL concentration changed into 4Q, the detection limit of the calibration curve of
4Q is ca. 7mM, even though the applied voltage for the calibration curve of 4Q is increased into
3635mV instead of 3600mV that used for other three ECL intensity calibration curves. This is due
to as increasing the ECL concentration, the concentration of persulfate also increases since we kept

126
a constant ratio of concentration for 𝑅𝑢(𝑏𝑝𝑦)32+
and persulfate in the ECL solution, plus the
reduction of persulfate is much easier than that of 𝑅𝑢(𝑏𝑝𝑦)32+
, as illustrated in Figure 4.4, the
reduction peak potential of persulfate is ca. (-1.2)V while for 𝑅𝑢(𝑏𝑝𝑦)32+
is ca. (-1.7)V versus
Ag wire quasi-reference electrode, most of increased current caused by increasing glucose
concentration in the sensing cell could be compensate by the reduction of persulfate, in that case,
only small amount of 𝑅𝑢(𝑏𝑝𝑦)32+
can be reduced to 𝑅𝑢(𝑏𝑝𝑦)3+
that used to react with 𝑆𝑂4•− or
𝑅𝑢(𝑏𝑝𝑦)33+
to generate ECL light, which would indirectly lower the ECL intensity signal. This
has the same effect as the oxygen mentioned above for the generation of ECL signal when the
concentration of persulfate too high. In brief, it is easy to conclude that the sensitivity of proposed
glucose biosensor would increase, and detection range of glucose concentration would decrease as
increasing the ECL concentration.
To verify the proposed the mechanism of C-ECL-C-BPE sensor, in which the commercial
test strip replaced with two GCEs, potassium ferrocyanide solution that prepared in 0.1M PBS
with pH=7 were used to measure in the sensing cell. As demonstrated in Figure 4.11, two ECL
intensity calibration curves were collected by performing in Q and 4Q concentrated ECL solutions
under 4.6V applied DC voltage for 5 sec of each measurement, and the ECL intensity signal
changes not large (ca. 3V difference) in calibration curve of Q as the concentration of ferrocyanide
varied from 1mM to 7mM, as for the ECL intensity calibration curve of 4Q, the ECL signal
difference changes over 7V. The trend of ECL signal calibration curves is similar with that used
for the glucose measurement mentioned above when changing the ECL concentration, as expected.

127
Figure 4.11 (A), (B) and (C) are ECL signal intensity (V) responses at different glucose
concentrations using C-ECL-C-BPE glucose biosensor method with 0.5Q, 2Q and 4Q concentrated
ECL solution, respectively.
4.3.6 Glucose Detection of Human Serum
Once we understand the operational mechanism of proposed C-ECL-C-BPE glucose
biosensor, real clinical samples were used to determine the glucose concentration by employing
the proposed glucose biosensor, crucially, to evaluate the reliability and application potential of
this method, commercial blood glucose meter used as a comparison. Therefore, eight human serum
samples, three from normal donors, the rest of five from the diabetes donors (including one from

128
diabetes type I) (more detailed information see Table 4.1) measured using these two methods.
Noted that, every sample measured at least three times using each method. The similarity of the
results between the proposed C-ECL-C-BPE glucose biosensor and commercial blood glucose
meter shown in Figure 4.11. And the glucose concentration determined using proposed method
through the logistic fitting function (red function) shown in Figure 4.9(B). Since glucose
concentration, prepared in 0.1M PBS with pH=7, determined ca. 20% higher than the real value
by using the commercial blood glucose meter, which probably caused by two measuring glucose
solution system, one is prepared in 0.1M PBS, the other is in human serum. Thus, we corrected
our results that used to determine glucose in serum by employing our proposed method by ×120%,
as illustrated of the blue plotted data in Figure 4.12. More detailed data see Table 4.2. The results
using both methods show great similarity, therefore, it is easy to conclude that the proposed C-
ECL-C-BPE sensor has great potential as a reliable technique for determination of glucose in
practical applications.

129
Table 4.1 Information of Human Serum Samples.
Serum # Gender Age/years Race Ethnicity Diagnosis Medications
1 Female 24 Caucasian Hispanic Normal
Donor None
2 Male 50 Caucasian N/A Normal
Donor None
3 Female 38 African African
American
Normal
Donor None
4 Male 81 Caucasian N/A Diabetes Metformin, Janumet
5 Male 21 Caucasian Slavic Type 1
Diabetes
Novorapid 1.11iu-6.6iu, Lantus
2.22iu
6 Male 61 N/A Hispanic Diabetes
Glimepiride 4mg, Metoprolol
50mg, Plavix 75mg, Crestor
20mg, Iron, Vitamin D 3000,
Timolol 0.5
7 Female 70 N/A Hispanic
Type 2
Diabetes,
Depression
Metformin 1000mg, Losartan
21mg, Glipizide 5mg, Citalopram
10mg, Folic Acid 800mcg
8 Male 59 Caucasian N/A
Normal
Donor, Type
2 Diabetes,
Hypertension
(HTN)
Lisinopril 10mg, Jardiance

130
Figure 4.12 Comparison of methods for determining glucose concentrations in human serum
samples. Black data measured using proposed C-ECL-C-BPE method; blue data is the correction
of black data; red data measured using commercial Contour NEXT EZ blood Glucose Meter. Each
data point measured at least three times.
Table 4.2 Comparison between C-ECL-C-BPE method with Contour NEXT EZ Blood Glucose
Meter for glucose measurement.
Human
Serum #
BPE-ECL Corrected BPE-ECL Contour NEXT EZ Blood Glucose Meter
Concentration/mM Std/mM Concentration/mM Std/mM Concentration/mM Std/mM
NO.1 3.2 0.15 3.84 0.18 4.478 0.052
NO.2 7.186 0.205 8.62 0.247 7.549 0.056
NO.3 4.609 0.169 5.531 0.203 5.912 0.028
NO.4 5.818 0.189 6.982 0.227 7.799 0.139
NO.5 13.796 0.231 16.555 0.277 18.054 0.458
NO.6 4.58 0.155 5.496 0.189 5.255 0.069
NO.7 5.799 0.133 6.959 0.159 7.401 0.183
NO.8 6.311 0.043 7.573 0.052 7.679 0.114

131
4.4 Conclusions
We have developed a new approach that using cathodic ECL in a closed system to determine
the glucose concentration in samples. In this study, the operational mechanism of proposed C-
ECL-C-BPE glucose biosensor has been studied; effect of oxygen and acetonitrile in the ECL
solution for the generation of ECL signal has been discussed; different ECL concentration used by
the proposed sensor for determination of glucose has been explained. To increase the sensitivity
or adjust the detection range of interested analytes, many parameters could be optimized or change,
such as the ECL solution composition, amplification voltage of PMT, modification of electrode
used in the sensing cell (could do in the future), redesign the close BPE cell, etc. On the other hand,
C-ECL-C-BPE method is a universal technique for detection of interested analytes. More
importantly, easy to fabricate, cheap to use, fast to detect (only need 5 sec or even shorter), great
similarity of the results for determination of glucose in human serum samples performed using
proposed method and commercial blood glucose meter, showed the C-ECL-C-BPE sensor has a
bright prospect as a reliable analytical strategy for detection of drugs, food, environmental
monitoring, scientific research and so on.

132
References
1. Mathers, C.; Stevens, G.; Mascarenhas, M., Global health risks: mortality and burden of
disease attributable to selected major risks. World Health Organization: 2009.
2. Cho, N.; Shaw, J.; Karuranga, S.; Huang, Y.; da Rocha Fernandes, J.; Ohlrogge, A.;
Malanda, B., IDF Diabetes Atlas: Global estimates of diabetes prevalence for 2017 and projections
for 2045. Diabetes research and clinical practice 2018, 138, 271-281.
3. Heller, A.; Feldman, B., Electrochemical glucose sensors and their applications in diabetes
management. Chemical reviews 2008, 108 (7), 2482-2505.
4. Bartlett, P. N.; Tebbutt, P.; Whitaker, R. G., Kinetic aspects of the use of modified
electrodes and mediators in bioelectrochemistry. Progress in reaction kinetics 1991, 16 (2), 55-
155.
5. Chen, C.; Xie, Q.; Yang, D.; Xiao, H.; Fu, Y.; Tan, Y.; Yao, S., Recent advances in
electrochemical glucose biosensors: a review. Rsc Advances 2013, 3 (14), 4473-4491.
6. Clark Jr, L. C.; Lyons, C., Electrode systems for continuous monitoring in cardiovascular
surgery. Annals of the New York Academy of sciences 1962, 102 (1), 29-45.
7. Sekretaryova, A. N.; Vokhmyanina, D. V.; Chulanova, T. O.; Karyakina, E. E.; Karyakin,
A. A., Reagentless biosensor based on glucose oxidase wired by the mediator freely diffusing in
enzyme containing membrane. Analytical chemistry 2012, 84 (3), 1220-1223.
8. Cass, A. E.; Davis, G.; Francis, G. D.; Hill, H. A. O.; Aston, W. J.; Higgins, I. J.; Plotkin,
E. V.; Scott, L. D.; Turner, A. P., Ferrocene-mediated enzyme electrode for amperometric
determination of glucose. Analytical chemistry 1984, 56 (4), 667-671.
9. Chaubey, A.; Malhotra, B., Mediated biosensors. Biosensors and bioelectronics 2002, 17
(6-7), 441-456.

133
10. Lupu, A.; Compagnone, D.; Palleschi, G., Screen-printed enzyme electrodes for the
detection of marker analytes during winemaking. Analytica Chimica Acta 2004, 513 (1), 67-72.
11. Chen, C.; Wang, L.; Tan, Y.; Qin, C.; Xie, F.; Fu, Y.; Xie, Q.; Chen, J.; Yao, S., High-
performance amperometric biosensors and biofuel cell based on chitosan-strengthened cast thin
films of chemically synthesized catecholamine polymers with glucose oxidase effectively
entrapped. Biosensors and Bioelectronics 2011, 26 (5), 2311-2316.
12. Qin, C.; Chen, C.; Xie, Q.; Wang, L.; He, X.; Huang, Y.; Zhou, Y.; Xie, F.; Yang, D.; Yao,
S., Amperometric enzyme electrodes of glucose and lactate based on poly
(diallyldimethylammonium)-alginate-metal ion-enzyme biocomposites. Analytica chimica acta
2012, 720, 49-56.
13. Ghica, M. E.; Brett, C. M., A glucose biosensor using methyl viologen redox mediator on
carbon film electrodes. Analytica Chimica Acta 2005, 532 (2), 145-151.
14. Deng, H.; Teo, A. K. L.; Gao, Z., An interference-free glucose biosensor based on a novel
low potential redox polymer mediator. Sensors and Actuators B: Chemical 2014, 191, 522-528.
15. Milton, R. D.; Minteer, S. D., Direct enzymatic bioelectrocatalysis: differentiating between
myth and reality. Journal of the Royal Society Interface 2017, 14 (131), 20170253.
16. Xia, H.-q.; Tang, H.; Zhou, B.; Li, Y.; Zhang, X.; Shi, Z.; Deng, L.; Song, R.; Li, L.; Zhang,
Z., Mediator-free electron-transfer on patternable hierarchical meso/macro porous bienzyme
interface for highly-sensitive sweat glucose and surface electromyography monitoring. Sensors
and Actuators B: Chemical 2020, 127962.
17. Liu, J.; He, Z.; Khoo, S. Y.; Tan, T. T. Y., A new strategy for achieving vertically-erected
and hierarchical TiO2 nanosheets array/carbon cloth as a binder-free electrode for protein

134
impregnation, direct electrochemistry and mediator-free glucose sensing. Biosensors and
Bioelectronics 2016, 77, 942-949.
18. Paul, A.; Vyas, G.; Paul, P.; Srivastava, D. N., Gold-Nanoparticle-Encapsulated ZIF-8 for
a Mediator-Free Enzymatic Glucose Sensor by Amperometry. ACS Applied Nano Materials 2018,
1 (7), 3600-3607.
19. Fidal, V.; Inguva, S.; Krishnamurthy, S.; Marsili, E.; Mosnier, J.-P.; Chandra, T., Mediator-
free interaction of glucose oxidase, as model enzyme for immobilization, with Al-doped and
undoped ZnO thin films laser-deposited on polycarbonate supports. Enzyme and microbial
technology 2017, 96, 67-74.
20. Pu, G.; Yang, Z.; Wu, Y.; Wang, Z.; Deng, Y.; Gao, Y.; Zhang, Z.; Lu, X., Investigation
into the Oxygen-Involved Electrochemiluminescence of Porphyrins and Its Regulation by
Peripheral Substituents/Central Metals. Analytical chemistry 2019, 91 (3), 2319-2328.
21. Maar, R. R.; Zhang, R.; Stephens, D. G.; Ding, Z.; Gilroy, J. B., Near‐Infrared
Photoluminescence and Electrochemiluminescence from a Remarkably Simple Boron Difluoride
Formazanate Dye. Angewandte Chemie International Edition 2019, 58 (4), 1052-1056.
22. Baek, S.; Kwon, S.-R.; Yeon, S. Y.; Yoon, S.-H.; Kang, C. M.; Han, S. H.; Lee, D.; Chung,
T. D., Miniaturized reverse electrodialysis-powered biosensor using electrochemiluminescence on
bipolar electrode. Analytical chemistry 2018, 90 (7), 4749-4755.
23. Wang, D.; Liang, Y.; Su, Y.; Shang, Q.; Zhang, C., Sensitivity enhancement of cloth-based
closed bipolar electrochemiluminescence glucose sensor via electrode decoration with
chitosan/multi-walled carbon nanotubes/graphene quantum dots-gold nanoparticles. Biosensors
and Bioelectronics 2019, 130, 55-64.

135
24. Hai-Juan, L.; Shuang, H.; Lian-Zhe, H.; Guo-Bao, X., Progress in Ru (bpy) 32+
Electrogenerated Chemiluminescence. Chinese Journal of Analytical Chemistry 2009, 37 (11),
1557-1565.
25. Cui, C.; Jin, R.; Jiang, D.; Zhang, J.; Zhu, J.-J., Electrogenerated Chemiluminescence in
Submicrometer Wells for Very High-Density Biosensing. Analytical Chemistry 2019, 92 (1), 578-
582.
26. Zhang, J.; Jin, R.; Jiang, D.; Chen, H.-Y., Electrochemiluminescence-based capacitance
microscopy for label-free imaging of antigens on the cellular plasma membrane. Journal of the
American Chemical Society 2019, 141 (26), 10294-10299.
27. Li, Z.; Qin, W.; Liang, G., A mass-amplifying electrochemiluminescence film (MAEF) for
the visual detection of dopamine in aqueous media. Nanoscale 2020.
28. Huang, B.; Liu, X.-P.; Chen, J.-S.; Mao, C.-j.; Niu, H.-L.; Jin, B.-K.,
Electrochemiluminescence immunoassay for the prostate-specific antigen by using a
CdS/chitosan/gC 3 N 4 nanocomposite. Microchimica Acta 2020, 187 (3), 155.
29. Liu, G.; Ma, C.; Jin, B.-K.; Chen, Z.; Cheng, F.-L.; Zhu, J.-J., Electrochemiluminescence
investigation of glucose transporter 4 expression at skeletal muscle cells surface based on a
graphene hydrogel electrode. Analytical chemistry 2019, 91 (4), 3021-3026.
30. Wang, C.; Chen, L.; Wang, P.; Li, M.; Liu, D., A novel ultrasensitive
electrochemiluminescence biosensor for glutathione detection based on poly-l-lysine as co-
reactant and graphene-based poly (luminol/aniline) as nanoprobes. Biosensors and Bioelectronics
2019, 133, 154-159.

136
31. Zhu, H.-Y.; Ding, S.-N., Dual-signal-amplified electrochemiluminescence biosensor for
microRNA detection by coupling cyclic enzyme with CdTe QDs aggregate as luminophor.
Biosensors and Bioelectronics 2019, 134, 109-116.
32. Wu, Q.; Wang, P.; Yang, X.; Wei, M.; Zhou, M.; Pu, Y.; Zhang, M., Fe-Co-Co prussian
blue analogues as a novel co-reaction accelerator for ultrasensitive electrochemiluminescent
biosensor construction. Sensors and Actuators B: Chemical 2019, 297, 126767.
33. Qi, Z.; You, S.; Liu, R.; Chuah, C. J., Performance and mechanistic study on
electrocoagulation process for municipal wastewater treatment based on horizontal bipolar
electrodes. Frontiers of Environmental Science & Engineering 2020, 14 (3), 1-10.
34. Lacina, K.; Kazda, T.; Syrový, T.; Trnková, L.; Vanýsek, P.; Skládal, P., Asymmetric
bipolar electrochemistry: Detailed empirical description and determination of output
characteristics of a galvanic system with multiple short-circuited cells in one electrolyte.
Electrochimica Acta 2019, 307, 269-274.
35. Shannon, C.; Wang, B.; Yu, S., Reduction of 4‐Nitrothiophenol on Ag/Au Bimetallic Alloy
Surfaces Studied Using Bipolar Raman Spectroelectrochemistry. ChemElectroChem 2020.
36. Sheridan, E.; Hlushkou, D.; Knust, K. N.; Tallarek, U.; Crooks, R. M., Enrichment of
cations via bipolar electrode focusing. Analytical chemistry 2012, 84 (17), 7393-7399.
37. Rafatmah, E.; Hemmateenejad, B., Colorimetric and visual determination of hydrogen
peroxide and glucose by applying paper-based closed bipolar electrochemistry. Microchimica Acta
2019, 186 (11), 684.
38. Arora, A.; Eijkel, J. C.; Morf, W. E.; Manz, A., A wireless electrochemiluminescence
detector applied to direct and indirect detection for electrophoresis on a microfabricated glass
device. Analytical chemistry 2001, 73 (14), 3282-3288.

137
39. Wu, M.-S.; Liu, Z.; Shi, H.-W.; Chen, H.-Y.; Xu, J.-J., Visual electrochemiluminescence
detection of cancer biomarkers on a closed bipolar electrode array chip. Analytical chemistry 2015,
87 (1), 530-537.
40. Yu, X.; Liang, J.; Yang, T.; Gong, M.; Xi, D.; Liu, H., A resettable and reprogrammable
keypad lock based on electrochromic Prussian blue films and biocatalysis of immobilized glucose
oxidase in a bipolar electrode system. Biosensors and Bioelectronics 2018, 99, 163-169.
41. Wang, Y.; Jin, R.; Sojic, N.; Jiang, D.; Chen, H.-Y., Intracellular Wireless Analysis of
Single Cells by Bipolar Electrochemiluminescence Confined in Nanopipette. Angewandte Chemie
International Edition 2020.
42. Feng, Q.-M.; Pan, J.-B.; Zhang, H.-R.; Xu, J.-J.; Chen, H.-Y., Disposable paper-based
bipolar electrode for sensitive electrochemiluminescence detection of a cancer biomarker.
Chemical Communications 2014, 50 (75), 10949-10951.
43. Tian, Y.; Han, S.; Hu, L.; Yuan, Y.; Wang, J.; Xu, G., Cathodic electrochemiluminescence
and reversible electrochemistry of [Ru (bpy) 3] 2+/1+ in aqueous solutions on tricresyl phosphate-
based carbon paste electrode with extremely high hydrogen evolution potential. Analytical and
bioanalytical chemistry 2013, 405 (11), 3427-3430.
44. Ege, D.; Becker, W. G.; Bard, A. J., Electrogenerated chemiluminescent determination of
tris (2, 2'-bipyridine) ruthenium ion (Ru(bpy)32+) at low levels. Analytical chemistry 1984, 56
(13), 2413-2417.
45. Ala-Kleme, T.; Kulmala, S.; Väre, L.; Juhala, P.; Helin, M., Hot electron-induced
electrogenerated chemiluminescence of Ru (bpy) 32+ chelate at oxide-covered aluminum
electrodes. Analytical Chemistry 1999, 71 (24), 5538-5543.
138
46. White, H. S.; Bard, A. J., Electrogenerated chemiluminescence. 41. Electrogenerated
chemiluminescence and chemiluminescence of the Ru (2, 21-bpy) 32+-S2O82-system in
acetonitrile-water solutions. Journal of the American Chemical Society 1982, 104 (25), 6891-6895.
47. Cao, W.; Xu, G.; Zhang, Z.; Dong, S., Novel tris (2, 2′-bipyridine) ruthenium (ii) cathodic
electrochemiluminescence in aqueous solution at a glassy carbon electrode. Chemical
communications 2002, (14), 1540-1541.
48. Clark, C. D.; Debad, J. D.; Yonemoto, E. H.; Mallouk, T. E.; Bard, A. J., Effect of Oxygen
on Linked Ru (bpy) 32+− Viologen Species and Methylviologen: A Reinterpretation of the
Electrogenerated Chemiluminescence. Journal of the American Chemical Society 1997, 119 (43),
10525-10531.
49. Truesdale, G. A.; Downing, A.; Lowden, G., The solubility of oxygen in pure water and
sea‐water. Journal of Applied Chemistry 1955, 5 (2), 53-62.

139
Chapter 5
Conclusions and Future Directions
In terms of dissertation work, which used bipolar electrochemistry as a basic platform, we
have successfully illustrated reduction of 4-NTP on Ag/Au bimetallic alloy surfaces using bipolar
Raman spectroelectrochemistry, refinements of cell frames for BPE system, and cathodic ECL
glucose biosensor using closed BPE system. The conclusions and future direction showed as below.
5.1 Reduction of 4-NTP on Ag/Au Bimetallic Alloy Surfaces using Bipolar Raman
Spectroelectrochemistry
Herein, we describe an experimental approach for adapting the principles of Raman
spectroelectrochemistry to electrodes controlled using a bipolar circuit. This method allows the
simultaneous acquisition of spectroscopic data as a function of both the electrode potential and the
chemical composition of a bimetallic alloy and can be generalized to other system variables. The
electrochemical reduction of 4-nitrothiophenol (4-NTP) was carried out on bimetallic Ag/Au alloy
gradients and monitored in situ using a confocal Raman microscope with 785 nm excitation. 2D
Raman profiles as a function of potential and bimetallic alloy composition were collected serially
across the BPE in a raster pattern. Continuous Ag/Au alloy gradients, in which the alloy
composition varied from approximately 0.5 to 1.0 mole fraction Ag, were prepared by using
bipolar electrodeposition and then modified with a monolayer of 4-NTP using self-assembly. The
steady state surface concentrations of 4-NTP, 4-ATP, and DMAB (4,4’-dimercaptoazobenzene)
on Au/Ag alloys were placed in a bipolar electrochemical cell and characterized as a function of
applied potential and chemical composition by using surface-enhanced Raman scattering. The E1/2
for NTP reduction was observed to be a strong function of the alloy composition, increasing by
over 100 mV as the mole fraction of Ag varied from 0.5 to 1.0. In addition, spectroscopic evidence

140
for the formation of the partially reduced intermediate, DMAB at intermediate applied potentials,
was also found. The experimental strategy described herein can be generalized to gain access to a
variety of 2D data sets for arrange of interesting electrochemical systems. Bipolar Raman
spectroelectrochemistry (BRSE) is a valuable tool for the characterization of solid-state material
libraries that should aid in the discovery of new electrocatalysts.
Future directions, bimetallic materials could be changed, such as Au/Ag/Pt/Pd/Cd, etc., and
replacement of interested molecules used to study as well.
5.2 Potential Profile of BPE using Different Cell Frames Design
In this work, the potential profiles from open cell frame, closed cell frame, and channel cell
frame were studied. Also, four models from channel cell frames were offered to describe and
explain the channel potential based on the variables of normalized channel length and width. Most
importantly, this work could guide some researchers to determine what kind of cell frames to
choose, what kind of details to be aware of for different cell frames, and what is the optimal cell
frame design for the BPE system. And what we have learned shows below:
1) a closed cell frame would be preferred compared to open cell frame for the unformed potential
gradient across the whole cell, if open cell frame was needed to use, to ensure a relative uniform
and stable potential, the BPE width should be not wider than 1/3rd width of the driving electrode;
2) cell frame width does not affect the potential profile or solution potential gradient using the
closed cell frame under same circumstances; 3) increasing the concentration of supporting
electrolyte would decrease the slope of solution potential gradient; 4) the channel should be placed
in the middle of the cell frames to give the maximum channel potential enhancement; 5) BPE
should have the same length as the channel; 6) to maintain the potential across BPE at least 60%
solution potential across the cell, and avoid the interference from the reactions happening at the

141
driving, the normalized cell width should not larger than 0.2 and normalized cell length should
keep in the range of 0.4 to 0.8; 7) the potential across the channel is also described using several
models (rectangle, trapezoid, ellipse 1st and ellipse 2nd) based on the variables of channel length
and width, turns out the model of ellipse 2nd is most accurate, however, a final modeling function
to predict and describe the channel potential is determined by averaging function of trapezoid and
ellipse 1st due to the complicated math calculation of ellipse 2nd; 8) the potential profile in the
channel is not that uniform; 9) channel cell frame does enhance the potential across the BPE (or
lower down applied voltage to achieve same redox reaction happens on the BPE) compared with
closed cell frame; 10) in terms of BPEs in a line arrangement, using cell frames with multiple small
channels would be better than one channel for BPE system; as for BPEs in parallel arrangement,
channels should evenly separate in cell frames in order to ensure BPEs have same potential.
Future directions, using ECL solution, study the ECL intensity distribution on the anodic
driving electrode with current going through the driving electrode, more information or results
may be obtained or verified.
5.3 Cathodic ECL Glucose Biosensor using Closed BPE System
For this project, we report a new glucose biosensor platform based on cathodic ECL
(electrochemiluminescence) in a closed BPE (bipolar electrode) system. In this C-ECL-C-BPE
(cathodic ECL in a close BPE cell) glucose biosensor, 𝑅𝑢(𝑏𝑝𝑦)32+
(tris(2,2’-bipyridyl) ruthenium)
used as luminophore and K2S2O8 used as co-reagent to generate the cathodic ECL signal; two
GCEs (glassy carbon electrodes), one acts as BPE cathode and the other acts as driving anode,
used in the reporting cell; and a commercial test strip that already modified GOx (glucose oxidase)
and mediator used in the sensing cell. Under a certain applied DC voltage, a higher current would
produce when glucose concentration varied from low to high, which need reduce more

142
𝑅𝑢(𝑏𝑝𝑦)32+
and persulfate to compensate for it and result in a more incensed ECL signal, using
this mechanism, a successive of calibration curves achieved. And under optimized condition, a
detection range of glucose from 3.8mM to 18mM achieved, and the limit of detection is calculated
to be 3.8mM with a 0.2mM sensitivity. Moreover, two methods between proposed C-ECL-C-BPE
glucose biosensor and commercial blood glucose meter has compared for determination of glucose
in human serum samples, and the results show great similarity between these two methods. Most
importantly, the proposed C-ECL-C-BPE sensor is a universal tool, easy to fabricate, cheap to use,
fast to detect (only need 5 sec or even shorter time), has a great potential as a reliable analytical
technique for detection of drugs, food analysis, environmental monitoring, scientific research and
so on.
As for future directions, 1)to increase the sensitivity or adjust the detection range of interested
analytes, many parameters could be optimized or change, such as the ECL solution composition,
amplification voltage of PMT, modification of electrode used in the sensing cell (could do in the
future), redesign the close BPE cell. 2) Modification reporting electrode to lower down the
reduction potential, this one would be challenging, but worth to achieve.