application, uncertainty and sensitivity analysis of the … · · 2008-12-011 application,...
TRANSCRIPT

1
Application, uncertainty and sensitivity analysis of the anaerobic digestion model by Siegrist et al. (2002) on household waste digestion
E. Ossiansson* and O. Lidholm** Water and Environmental Engineering, Department of Chemical Engineering E‐mail: * [email protected], ** [email protected]
Abstract
In this paper the anaerobic digestion model published by Siegrist et al. (2002) is applied on household waste digestion. Data from two pilot scale experiments with measured characterizations were used, one with mesophilic and one with thermophilic temperature. Validation simulations with focus on the gas production rate, ammonium and VFA were first performed, using default values for model parameters. The steady state gas production could be predicted with acceptable accuracy, while the simulated ammonium and VFA concentrations were overestimated by the model. An uncertainty analysis was conducted to analyze the quality of the predictions with respect to measurements of input data. The measurement errors influenced the gas production the most, but that the VFA and ammonia predictions could not be improved with more accurate measurements. To find suitable parameters for calibration of model parameters, a Monte Carlo based sensitivity analysis was conducted, supplemented with scatter plots. The sensitivity analysis showed that the hydrolysis constant was the most important parameter to determine for both ammonium and gas production. This was problematic for the calibration, as the particulate organic matter is lumped and calibrating the ammonium from the hydrolysis constant therefore led to unrealistically low gas production. To model the protein degradation accurately, without changing the overall hydrolysis constant or the model structure, the protein content in the substrate was calibrated instead. The Siegrist model was hence not suitable for simulation of characterized household waste, unless a hydrolysis model with slower protein hydrolysis was introduced or the stoichiometry for the hydrolysis was calibrated. The VFA concentrations in the reactor were dependent on model parameters related to the aceticlastic methanogenesis and the propionate degradation. Calibration of half saturation constants for these processes was successful, but the values were increased considerably. A possible explanation for the considerable change in these parameter values could be that the mass transfer of substrate was more limiting than for the default Siegrist model.
Keywords anaerobic digestion, model, household waste, uncertainty analysis, sensitivity analysis, calibration, Monte Carlo, hydrolysis constant
Introduction Anaerobic digestion is a complex system of biochemical and physical processes. Due to the complexity of the process, it has traditionally been treated as a black box system, and optimization has been based on experience or trial and error methods. As experiments of anaerobic digestion processes are expensive and time consuming, modeling can provide a useful tool for process understanding and optimization. Models have potentials for revealing non-linear behaviors of the system and to quantify the performance of alternative operational setups.
The aim of this report is to evaluate the applicability of a model for anaerobic digestion published by Siegrist, et al (2002), here referred to as the Siegrist model. The model was primarily developed for simulating the digestion of mixed sludge, but in this report the applicability for the model on household waste is studied. Compared to the more commonly used model by the International Water Association (IWA), called Anaerobic Digestion Model no 1 (ADM1), the Siegrist model is less complex, with a lumped hydrolysis constant and fewer Volatile Fatty Acids (VFA) included. The two models were constructed with different approaches, the Siegrist model parameters are based on experiments, whereas the ADM1 uses review consensus (Batstone, 2006).
ADM1 has been validated in the literature with varying success (Parker, 2005; Batstone, et al., 2003; Tartakovsky, et al., 2008). The Siegrist model is less utilized, but interesting because of the simpler structure with fewer input variables.
The aim of the report is also to evaluate the required quality of input parameters, and to find the most important parameters to measure when modeling household waste digestion. Furthermore, the model parameters most suitable for calibration are evaluated and results with calibrated parameters are shown.
Materials & Methods The model was implemented in Matlab as a system of differential equations with 23 liquid phase state variables and 3 state variables describing gaseous compounds. The stiff ODE-solver ode15s was used for the numerical integration. The hydrolysis rate was described with first order kinetics with respect to the degradable particulate organic matter XS (process 1 in Figure 1). Monod kinetics, in combination with inhibition expressions with respect to ammonia, pH, acetate and dissolved hydrogen, were used to simulate the microbial processes (process 2-7 in Figure 1). The model also included stripping of the gases methane, carbon dioxide and hydrogen from the liquid with a pressure control loop (Siegrist, et al., 2002).

2
Figure 1 Overview of the biochemical reactions in anaerobic digestion with flows expressed as percent of COD (from Siegrist et al 2002 based on Gujer et al 1983)
Data from one mesophilic (35°C) and one thermophilic (55°C) pilot scale experiment was used for validation and model analysis (Davidsson, et al. 2007). The household waste used in the mesophilic experiment was collected in the city district of Västra Hamnen in Malmö, Sweden, and the thermophilic digester was fed with household waste from Aalborg, Denmark. Characterization data for fat, protein, fiber, sugar, starch, VFA and ammonium content as fractions of TS was found in Højlund Christensen, et al. (2003). The measurement errors of the characterization data were found in an evaluation of the analysis methods by la Cour Jansen, et al. (2004). Relative standard deviation for the ammonium measurements were provided by the analysis instrument manufacturer (3.5 %, Dr Lange®). The relative standard deviation for VFA was assumed to be 10 %, and 2.5 % for gas production measurements.
The experiments were divided into three phases; startup, steady state and post digestion. As the inoculums were collected from digesters fed with sludge, the startup phase was needed for the microorganisms to get accustomed to the new type of feed. Post digestion data was not available for the mesophilic digestion experiment.
Validation simulations Before the pilot scale experiments could be simulated, some processing of data was needed, including unit conversions and calculation of stoichiometry and the rate constant for the hydrolysis process. The elemental compositions for protein, fat etc. were found in Davidsson, et al. (2007) and converted to the unit gCOD/gTS with the Buswell formula (Buswell, et al., 1930). The default stoichiometry of mixed sludge hydrolysis in Figure 1 was hence updated to apply for the household wastes.
Data from batch experiments on the waste from Västra Hamnen was used to determine the first order hydrolysis constant for degradation of
particulate degradable organic matter, XS. It was assumed that the hydrolysis step was rate limiting and that there were no inhibition effects on the microbial reactions. The hydrolysis constant, kH, was determined to 0.20 d-1 (Figure 2).
Figure 2 Calibration of kH from batch experiment on household waste from the mesophilic digestion
Except for the hydrolysis constant and the composition of the waste, default values for model parameters were used for the validation simulations. The results show that the steady state gas production rate could be predicted fairly well for both household wastes, while the correlation during the start-up phase was poorer (Figure 3a and 4a). The modeled gas production rate during the startup phase was higher than measured, indicating a slower degradation before adaptation to the substrate. The fit to data for steady state ammonium concentrations were unsatisfactory for both simulations, especially for the mesophilic case (Figure 3b and 4b). The good fit to data for the startup of the thermophilic experiment was mainly due to a washout effect. The VFA concentrations were underestimated in the model predictions, especially for the thermophilic household waste digestion (Figure 3c and 4c).
Uncertainty analysis The characterizations were based on measurements with inherent measurement errors. A Monte Carlo method with Latin Hypercube Sampling (LHS) was used to study the effects of these measurement errors on prediction uncertainty. The distributions of the measurement errors were assumed to be described by Gaussian functions, and the distributions of outputs from 5000 simulations were studied.
In Figure 5 the uncertainty of simulated outputs presented as 95 % confidence intervals can be compared with measurement uncertainties of validation data (vertical intervals) for the thermophilic household waste simulation. When the confidence intervals overlap, the lack of fit could be explained by measurement error. Figure 5a shows that measurement errors can explain some of the discrepancy between simulations and data for the
0 10 20 30 40 50-0.5
0
0.5
1
1.5
2
2.5
3
3.5
4
Time, [Days]
Gas
pro
duct
ion,
[Nm
l/Day
]
Triplicate 1Triplicate 2Triplicate 3kh=0.2
4) Anaerobic oxid. of Sfa5) Anaerobic oxid. of Spro 7% 5%
Fermentation of 2) amino acids 3) sugars
1) Hydrolysis
7) Hydrogenotrophic methanogenesis
6) Acetotrophic methanogenesis
14%
45%
31%
28%67%
20%
3%
9% 29%
12% 50%
Amino acids (Saa), Sugars (Ssu)
Inert diss. COD (Sin)
Long chain fatty acids (Sfa)
Propionate (Spro)
Acetate (Sac) Hydrogen (SH2)
Methane (SCH4)
Degradable particulate organic material (XS) Proteins Carbohydrates Lipids 30% 17% 5% 48%
3
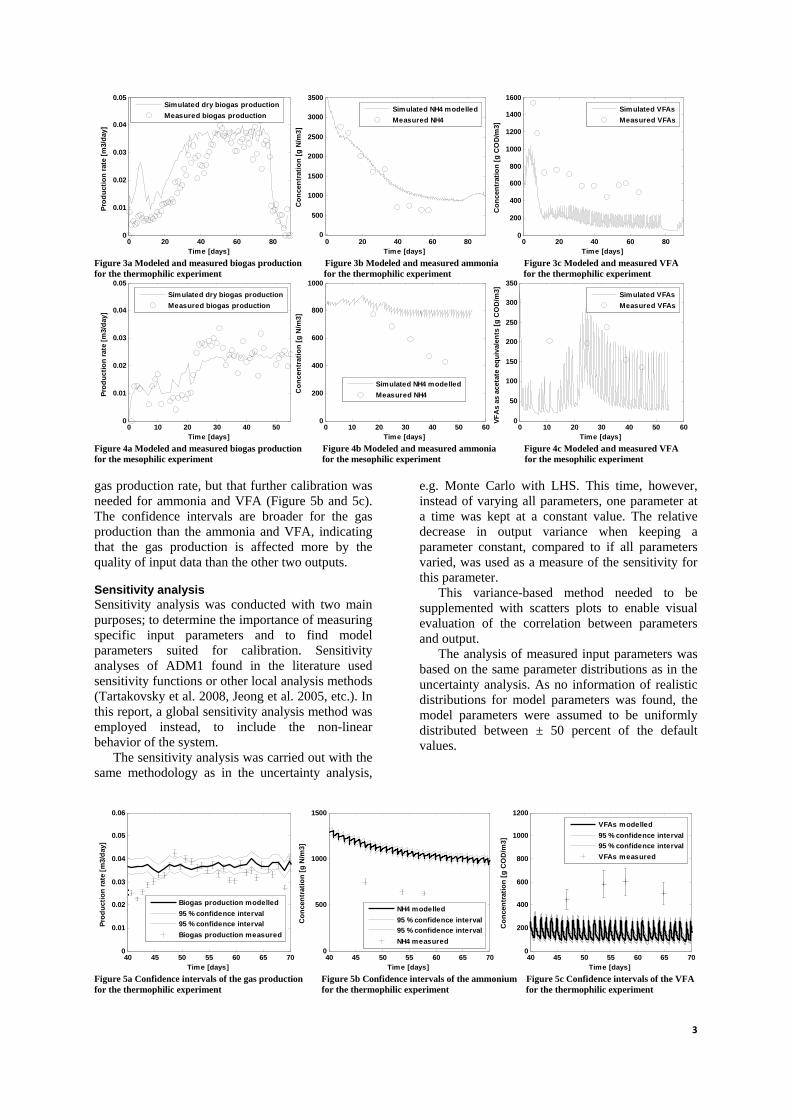
Figure 3a Modeled and measured biogas production Figure 3b Modeled and measured ammonia Figure 3c Modeled and measured VFA for the thermophilic experiment for the thermophilic experiment for the thermophilic experiment
Figure 4a Modeled and measured biogas production Figure 4b Modeled and measured ammonia Figure 4c Modeled and measured VFA for the mesophilic experiment for the mesophilic experiment for the mesophilic experiment
gas production rate, but that further calibration was needed for ammonia and VFA (Figure 5b and 5c). The confidence intervals are broader for the gas production than the ammonia and VFA, indicating that the gas production is affected more by the quality of input data than the other two outputs.
Sensitivity analysis Sensitivity analysis was conducted with two main purposes; to determine the importance of measuring specific input parameters and to find model parameters suited for calibration. Sensitivity analyses of ADM1 found in the literature used sensitivity functions or other local analysis methods (Tartakovsky et al. 2008, Jeong et al. 2005, etc.). In this report, a global sensitivity analysis method was employed instead, to include the non-linear behavior of the system.
The sensitivity analysis was carried out with the same methodology as in the uncertainty analysis,
e.g. Monte Carlo with LHS. This time, however, instead of varying all parameters, one parameter at a time was kept at a constant value. The relative decrease in output variance when keeping a parameter constant, compared to if all parameters varied, was used as a measure of the sensitivity for this parameter.
This variance-based method needed to be supplemented with scatters plots to enable visual evaluation of the correlation between parameters and output.
The analysis of measured input parameters was based on the same parameter distributions as in the uncertainty analysis. As no information of realistic distributions for model parameters was found, the model parameters were assumed to be uniformly distributed between ± 50 percent of the default values.
Figure 5a Confidence intervals of the gas production Figure 5b Confidence intervals of the ammonium Figure 5c Confidence intervals of the VFA for the thermophilic experiment for the thermophilic experiment for the thermophilic experiment
0 20 40 60 800
0.01
0.02
0.03
0.04
0.05
Time [days]
Prod
uctio
n ra
te [m
3/da
y]
Simulated dry biogas productionMeasured biogas production
0 20 40 60 800
500
1000
1500
2000
2500
3000
3500
Time [days]
Con
cent
ratio
n [g
N/m
3]
Simulated NH4 modelledMeasured NH4
0 20 40 60 800
200
400
600
800
1000
1200
1400
1600
Time [days]
Con
cent
ratio
n [g
CO
D/m
3]
Simulated VFAsMeasured VFAs
0 10 20 30 40 500
0.01
0.02
0.03
0.04
0.05
Time [days]
Prod
uctio
n ra
te [m
3/da
y]
Simulated dry biogas productionMeasured biogas production
0 10 20 30 40 50 600
200
400
600
800
1000
Time [days]
Con
cent
ratio
n [g
N/m
3]
Simulated NH4 modelledMeasured NH4
0 10 20 30 40 50 600
50
100
150
200
250
300
350
Time [days]
VFA
s as
ace
tate
equ
ival
ents
[g C
OD
/m3]
Simulated VFAsMeasured VFAs
40 45 50 55 60 65 700
0.01
0.02
0.03
0.04
0.05
0.06
Time [days]
Prod
uctio
n ra
te [m
3/da
y]
Biogas production modelled95 % confidence interval95 % confidence intervalBiogas production measured
40 45 50 55 60 65 700
500
1000
1500
Time [days]
Con
cent
ratio
n [g
N/m
3]
NH4 modelled95 % confidence interval95 % confidence intervalNH4 measured
40 45 50 55 60 65 700
200
400
600
800
1000
1200
Time [days]
Con
cent
ratio
n [g
CO
D/m
3]
VFAs modelled95 % confidence interval95 % confidence intervalVFAs measured

4
Table 1 Results from sensitivity analysis of measured input parameters
Parameter Mean Unit Sensitivity (Gas)
Sensitivity (VFA)
Sensitivity (NH4-N)
Thermophilic digestion rank relative
Mesophilic digestion rank relative
Thermophilic digestion Rank relative
Mesophilic digestion rank relative
Thermophilic digestion rank relative
Mesophilic digestion rank relative
TS Soluble TS Protein HCO3
0.05 0.23 0.17 10
kg/kg g/TS mol/m3
1 5 10 15
0.69 0.93 1.00 1.00
3 2 6 1
0.88 0.88 0.97 0.29
4 3 7 2
0.95 0.95 0.99 0.59
3 2 6 1
0.88 0.88 0.97 0.29
1 3 2 4
0.42 0.93 0.84 0.93
1 2 3 15
0.46 0.76 0.86 1.00
The sensitivity analysis of measured input parameters showed that the variance for prediction of gas production rate decreased the most if the TS measurements were made without errors (Table 1). Reliable measurements for TS are thus important. The most significant sources of uncertainty for the ammonium predictions were the TS, solubilized TS and protein content of the feed (Table 1). For VFA, the uncertainty from distributed input parameters was not significant, but the HCO3 of the feed was most influential (Table 1).
With the aid of scatter plots, the correlations between the measured input parameters and output could be visualized. From this analysis, the correlation between the degradable fraction of TS could be pointed out as more important for the gas production rate than the total measured TS (Figure 6 and 7). The linear correlation to the gas production is more pronounced for the degradable TS and the output values are less dispersed. This result is no surprise, however, since it is the degradable fraction of TS that is used for gas production. This result emphasizes the importance of measuring the degradability of the substrate.
Figure 6 Gas production vs. total TS for the thermophilic experiment
Figure 7 Gas production vs. degradable TS for the thermophilic experiment
The results from the variance-based sensitivity analysis of model parameters showed that the hydrolysis constant kH is the most important parameter both for determining the gas production rate and the ammonium levels in the reactor (Table 2). This indicates that the hydrolysis step is rate limiting, and that the hydrolysis constant can be calibrated from either the gas production rate or the ammonia level in the reactors. Figure 8 shows the non-linear correlation between the hydrolysis constant and the gas production.
Figure 8 Gas production vs. kH for the thermophilic experiment
VFA levels in the reactor were sensitive to parameters related to the acetotrophic methanogenesis and the anaerobic degradation of propionate (Table 2). The scatter plot analysis of the correlations revealed that the high sensitivity to these parameters was partly due to that bacteria were washed out when these constants reached extreme values. Figure 9 shows an example of a frequent washout of bacteria for low maximum growth rates for the aceticlastic methanogens.
Figure 9 Gas production vs. maximum growth rate of aceticlastic methanogens
0.045 0.05 0.0550
0.01
0.02
0.03
0.04
0.05
0.06
Gas
pro
duct
ion
rate
[m3 /d
]
TS [kg/kg]
0.03 0.032 0.034 0.036 0.038 0.040
0.01
0.02
0.03
0.04
0.05
0.06
Gas
pro
duct
ion
rate
[m3 /d
]
TS [kg/kg]
0.1 0.15 0.2 0.25 0.30
0.01
0.02
0.03
0.04
0.05
0.06
kH [d-1]
Gas
pro
duct
ion
rate
[m3 /d
]
0.2 0.3 0.4 0.5 0.60
0.005
0.01
0.015
0.02
0.025
0.03
µ max6
Gas
pro
duct
ion
rate
[m3 /d
]

5
Table 2 Results from sensitivity analysis of model parameters
Calibration In the sensitivity analysis, the most influential model parameters for each output were ranked. This result could then be used for calibration purposes, where the most influential parameters were chosen, and used to increase the fit to data. The calibration was conducted by varying parameters so that the sum of absolute errors for model predictions compared to data during the steady state phase could be minimized.
Calibration of the hydrolysis constant to the gas production measurements resulted in an unchanged value for the mesophilic experiment, while the best fit to data for the thermophilic experiment was slightly decreased (from 0.2 to 0.15). This indicated a successful determination of kH from batch experiment for the household waste from Västra Hamnen. To enable calibration during the startup phase, the hydrolysis constant was iteratively increased until a good fit to data was achieved. The results from the calibration of the hydrolysis constant to the gas production errors are presented in Figure 10a.
The hydrolysis constant was also the most influential parameter when it came to determining the ammonia levels in the reactor. When calibrating the hydrolysis constant with the ammonia measurements, the resulting hydrolysis constants were lower, indicating slower degradation of protein than other particulate constituents. The fact that the particulate organics were lumped into one state variable, XS, complicated the calibration process. As the hydrolysis constant determined both the protein degradation and the gas production rate, only one of the two processes could be calibrated at the same time. The model structure hence needed to be revised, to include a separate process of
hydrolysis of particulate protein. The model structure was however not changed in this project, but is suggested for further studies. The problem was instead solved by decreasing the stoichiometric coefficient of protein in the degradation of XS. The result from this calibration is presented in Figure 10b.
The sensitivity analysis showed that the maximum growth rate constants for the acetoclastic methanogenesis and the propionate degradation were most important for the VFA concentration. As discussed in the sensitivity analysis section, this result was partly due to the high rate of washout for extreme values of these parameters. This indicated that they may not be suited for calibration purposes. When calibrating with these values, the fit to data only improved slightly, and when changing the value further, the errors increased rapidly. An example when calibrating the maximum growth rate constant for the aceticlastic methanogens is presented in Figure 11.
Figure 10 Sum of absolute errors for VFA for the thermophilic simulation when varying maximum growth rate constant for the aceticlastic methanogenesis
Figure 11a Biogas production for the thermophilic Figure 11b Ammonium concentration for the Figure 11c VFA concentration for the experiment after calibration thermophilic experiment after calibration thermophilic experiment after calibration
0 0.1 0.2 0.3 0.4 0.5 0.60
1000
2000
3000
4000
5000
6000
7000
µmax7
Sum
of a
bsol
ute
erro
rs
0 20 40 60 800
0.01
0.02
0.03
0.04
0.05
0.06
Time [days]
Prod
uctio
n ra
te [m
3/da
y]
Biogas production modelledBiogas production measured
0 20 40 60 800
500
1000
1500
2000
2500
3000
3500
Time [days]
Con
cent
ratio
n [g
N/m
3]
NH4 modelledNH4 measured
0 20 40 60 800
500
1000
1500
2000
2500
3000
3500
Time [days]
Con
cent
ratio
n [g
CO
D/m
3]
VFAs modelledVFAs measured
Parameter Mean Unit Sensitivity (Gas)
Sensitivity (VFA)
Sensitivity (NH4-N)
Thermophilic digestion rank relative
Mesophilic digestion rank relative
Thermophilic digestion Rank relative
Mesophilic digestion rank relative
Thermophilic digestion rank relative
Mesophilic digestion rank relative
µmax6 µmax7 kH
0.6 0.37 0.2
d-1
d-1
d-1
24 7 1
1.00 1.00 0.019
7 2 1
0.98 0.78 0.21
1 4 12
0.35 0.72 0.96
5 1 6
0.84 0.09 0.88
5 8 1
0.99 0.99 0.051
2 8 1
0.98 1.00 0.024

6
Better calibration results were instead achieved when using half saturation constants. A better fit to data was obtained, and the process was stable for a wide range of values (Figure 12). The minimum error was acquired for a KS of 100 g COD/m3for propionate degradation and 260 g COD/m3 in the thermophilic digester (compare with the default values 20 and 40 g COD/m3 respectively). For mesophilic digestion, only KS for acetoclastic methanogenesis was calibrated, to 190 g COD/m3. The physical explanation for changing the half saturation constants could be that the mass transfer conditions was different than suggested in the implementation by Siegrist et al. The resulting simulation after calibration is showed in Figure 10c.
Figure 12 Sum of absolute errors for VFA for the thermophilic simulation when varying half saturation constant for the aceticlastic methanogenesis
Conclusions Applying the Siegrist model on household waste experiments gave acceptable predictions of the steady state gas production. The simulation of the startup phase, i.e. before the inoculum was adapted to the substrate, was less successful. The correlation of ammonia and VFA predictions to data was not satisfying for simulations without calibrated values.
The uncertainty analysis showed that measurement errors could explain some of the discrepancy for gas production predictions to data, but not to the same extent for ammonium and VFA.
From the sensitivity analysis it could be concluded that the most important parameters to determine for predictions of gas production are the amount of degradable TS in the substrate, and the hydrolysis rate constant. The VFA concentrations of the reactor were mostly influenced by the availability of VFA as substrate in propionate degradation and acetoclastic methanogenesis. This implied that the mass transfer in the digester was more important for the VFA level than the input variables.
The calibration showed that the hydrolysis rate constant determined from batch experiments gave the best fit to data for the gas production; this
method for determining the hydrolysis constant could thus be used in this case.
The ammonium concentration in the reactor was determined from the degradation of protein. As the particulate organics are lumped in the Siegrist model, the individual hydrolysis of particulate protein could not be modeled. This was problematic, since the protein degradation was much slower in the simulated experiments. It was therefore concluded that a hydrolysis model with separate hydrolysis rates as in ADM1 is preferable when modeling household waste degradation. This applies particularly when characterization measurements of the substrate are used; otherwise calibrations of the stoichiometric coefficients are needed.
References Batstone D J Mathematical modelling of anaerobic reactors treating domestic [Journal] // Reviews in Environmental Science and Bio/Technology. - 2006. - pp. 5, 57–71.
Batstone D.J. and Keller J. Industrial applications of the IWA anaerobic digestion model No. 1 (ADM1) [Article] // Water science and technology. - 2003. - Vols. 47, 199-206.
Buswell E G and Neave S L Laboratory studies of sludge digestion [Article] // Illinois Division of State Water Survey. - 1930. - Vol. Bulletin no. 30.
Davidsson Åsa [et al.] Methane yield in source-sorted organic fraction of municipal solid waste [Article] // Waste Management. - 2007. - Vols. 27, p.406-414 .
Gujer W and Zehnder A J B Conversion processes in anaerobic digestion [Article] // Water Science and Technology. - 1983. - Vols. 15 (8/9); 127-167.
Højlund Christensen T, la Cour Jansen J and Jörgensen O Datarapport om sammensætning og biogaspotentiale i organisk dagrenovation [Report]. - [s.l.] : Danska Miljöstyrelsen, 2003.
Jeong Hyeong-Seok [et al.] Analysis and application of ADM1 for anaerobic methane production [Article] // Bioprocess Biosyst Eng. - 2005. - Vols. 27; 81–89.
la Cour Jansen J [et al.] Assessment of sampling and chemical analysis of source-separated organic household waste [Article] // Waste Management. - 2004. - Vols. 24; 541-549.
Parker Wayne J. Application of the ADM1 model to advanced anaerobic digestion [Artikel] // Bioresource Technology. - 2005. - Vol. 96, p.1832-1842.
Siegrist H [et al.] Mathematical model for meso- and thermophilic anaerobic sewage sludge digestion [Journal] // Environmental Science and Technology. - 2002. - pp. 36, 1113-1123.
Tartakovsky B [et al.] Anaerobic digestion model No 1- based distributed prameter model of an anaerobic reactor: II. Model validation [Article] // Bioresource technology. - 2008. - Vols. 99 3676-3684.
0 50 100 150 200 2500
1000
2000
3000
4000
5000
6000
7000
Sum
of a
bsol
ute
erro
rs
KSac