uncertainty and sensitivity analysis for detailed design ... · uncertainty and sensitivity...
TRANSCRIPT
Uncertainty and sensitivity analysis for detailed designsupportHopfe, C.J.; Hensen, J.L.M.; Plokker, W.
Published in:Proceedings of the 10th IBPSA Building Simulation Conference, Tsinghua University, Beijing. September 2007
Published: 01/01/2007
Document VersionAccepted manuscript including changes made at the peer-review stage
Please check the document version of this publication:
• A submitted manuscript is the author's version of the article upon submission and before peer-review. There can be important differencesbetween the submitted version and the official published version of record. People interested in the research are advised to contact theauthor for the final version of the publication, or visit the DOI to the publisher's website.• The final author version and the galley proof are versions of the publication after peer review.• The final published version features the final layout of the paper including the volume, issue and page numbers.
Link to publication
General rightsCopyright and moral rights for the publications made accessible in the public portal are retained by the authors and/or other copyright ownersand it is a condition of accessing publications that users recognise and abide by the legal requirements associated with these rights.
• Users may download and print one copy of any publication from the public portal for the purpose of private study or research. • You may not further distribute the material or use it for any profit-making activity or commercial gain • You may freely distribute the URL identifying the publication in the public portal ?
Take down policyIf you believe that this document breaches copyright please contact us providing details, and we will remove access to the work immediatelyand investigate your claim.
Download date: 25. Aug. 2018

Proceedings: Building Simulation 2007
- 1799 -
UNCERTAINTY AND SENSITIVITY ANALYSIS FOR DETAILED DESIGN SUPPORT
Christina Hopfe1, Jan Hensen1 and Wim Plokker2
1 Unit BPS, Technische Universiteit Eindhoven, The Netherlands
2Vabi, Delft, The Netherlands
ABSTRACT Nowadays, building performance simulation (BPS) is still primarily used for code compliance checking in the Netherlands whilst it could provide the user already useful design information by e.g. indicating design solutions or introducing uncertainty analysis (UA) and sensitivity analysis (SA).
This paper summarizes results from an ongoing research introducing UA and SA in BPS. A case study is performed based on a hypothetical building which is part of an international test method for assessing the accuracy of BPS tools with respect to various building performance parameters. SA is accomplished via a freeware tool called Simlab. This is used as a pre- and postprocessor for the BPS software VA114.
The SA is based on seven different input parameters, covering different categories like uncertainties in physical and design parameters as well as in boundary conditions. The sample matrix for the different input was generated with the Latin hypercube method.
Results considering energy consumption (annual heating and cooling, peak loads) and thermal comfort (weight over- and underheating hours) are compared.
The paper will finish with indicating how this research will be proceeded.
KEYWORDS Building performance, sensitivity analysis, Monte Carlo analysis, energy consumption, thermal comfort
INTRODUCTION Although BPS is used during the detailed design, it serves more as a tool for code compliance. Possibilities to enhance the use of BPS, for instance to support decision making, are its use for appropriate design optimization tools and user-oriented design analysis among others. Moreover, one important aspect is dealing with uncertainties, to provide solutions which are insensible to fluctuations of parameters [Poloni, 2005]. It is the long-range objective of this research to enable the user to forecast the uncertainty of the building performance
due to uncertainties of input parameters and thereby to support the designer in making decisions. Aim of this paper is to give an overview of three different categories of uncertainties, to show their influence on two performance indicators (energy demand and thermal comfort) and to work out in which way this can support the designer in terms of decision making.
METHODOLOGY For demonstration purposes a case study is simulated with one robust, industry strength, and extensively used, BPS tool in the Netherlands. The case study is based on the BESTEST case 900, a hypothetical heavy-weight building meant to check the accuracy of BPS tools whilst providing ranges for the energy demand. In the building design process there exist a number of performance indicators that have a significant impact on the process. As mentioned in [Hopfe et al., 2005] those called value drivers comprise aspects like costs, flexibility, energy consumption, thermal comfort among others. It is intended to represent the influence of uncertainties in input parameters related to chosen performance indicators. The BESTEST case 900 is executed by a sample matrix with 200 simulations. The outcomes of both analyses are discussed in the chapter results.
In this research the following steps can be listed in general:
1. Description of a target function and consideration of the essential input.
2. Assignment of a normal distribution to the selected variables.
3. Generation of a matrix of inputs with the normal distribution through a suitable design.
4. Evaluation of the model and computation of the distribution. 5. Selection of (a) method/s for assessing the influence or relative importance/ sensitivity of each input factor based on the target function.
Proceedings: Building Simulation 2007
- 1800 -
Altogether 200 simulations are executed. From those 9 variables 5 different input files necessary for one simulation were generated, one with the material properties, one for internal heat gains, one for the air change rate, one for the orientation and one for the glass surface. This procedure was done 200 times via one macro in Excel. In this work it can be distinguished between three different uncertainty groups caused by different parameters:
1. Uncertainty in physical parameters: physical parameters are e.g. conductivity, thickness, density of different material layers; taking these uncertainties into account is related to quality assurance.
2. Uncertainty in design parameters: by this group is meant for instance the type of glazing, the building mass (heavy/lightweight), type of system and so on; taking these into account could improve/enable design decision support, especially if it would be augmented by sensitivity analysis.
3. Uncertainty in boundary conditions: like internal: infiltration, casual gains, etc; but also external: weather data, climate change, etc.; taking these into account is also related to design decision support particular with in view of design robustness and (future) flexibility of the building
For the thermal comfort study the weighted over- and underheating hours are measured. There exist numerous techniques in a building to analyze the thermal performance. In VA114 the criterion to asses thermal comfort is called GTO-criterion. It is a Dutch criterion, published by the Rijksgebouwendienst in 1991 [ISSO 2004]. The weighted overheating or underheating hours (Dutch: Weeguren or GTO) is based on the Fanger- Model. In this criterion the extent in which a PMV of +0,5 is exceeded is expressed by a factor which depends on the PPD. Each hour during operation time this factor is determined. The sum of these hourly factors over the year results in the weighted overheating hours. The corresponding criterion exists for the weighted underheating hours where the PMV is -0.5.
SIMULATION For the SA the Monte Carlo analysis (MCA) is selected. The MCA is one of the most commonly used methods to analyze the approximate distribution of possible results on the basis of probabilistic inputs. The MCA is a black box approach- there is no code modification necessary; thus it is easy to implement to any desired tool [Lomas et al. 1991].
Starting point for this analysis is the BESTEST case 900, which is executed by a sample matrix with 200 simulations. The outcomes of the analyses are discussed in the chapter discussion and results. For generating the sample matrix, the Latin hypercube sampling (LHS) was used. There are several methods for generating the sample matrix. The chosen one is a particular case of stratified sampling which is meant to achieve a better coverage of the sample space of the chosen input parameters [Saltelli et al., 2005]. To cover uncertainties in physical parameters the U-value and G-value were varied; for the uncertainties in design parameters the building mass, the orientation of the building and the area of the glass surface are changed; the uncertainties in boundary conditions are covered by internal parameters: infiltration rate and casual gains. The seven different varied parameters and their maximum and minimum values can be seen in table 1. The deviation of the U-value and the solar transmittance (G-value) were fixed to 5 percent. For the orientation a rotation of 360 degrees was allowed. The range of building mass was selected in a manner to guarantee a light and a heavy weighted case. In order to increase the glass surface the window to the right was changed to the maximum limit.
Table 1 Parameters and range
Min Value
Max Value Unit
1Building mass 114.45 298.69 kg/m²
2Infiltration rate 0.06 0.98 ACH
3Internal gains 120.33 274.68 W
4 Orientation 1 360 degree 5 U-value 2.85 3.15 W/m²*K 6 G-value 0.75 0.83 /
7Glass surface 10.46 13.76 m²
The deviations for infiltration rate and casual gains are taken from literature and comparable to a study taken from [Hopfe et al., 2007] and can be seen in table 2.
Proceedings: Building Simulation 2007
- 1801 -
Table 2 Mean (μ) and standard deviation (σ) of infiltration rate and casual gains
μ σ %
1 Infiltration rate 0.5 0.17 34
2 Internal gains 200 26.4 13.2
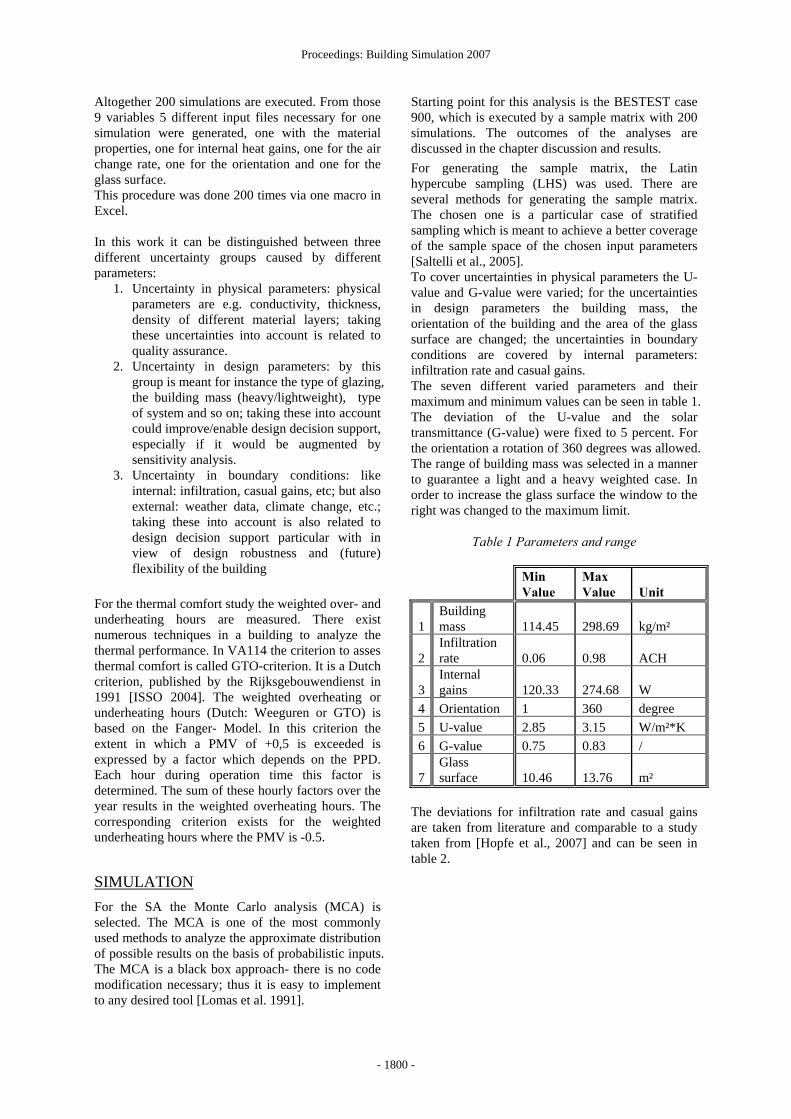
All parameters are normal distributed except the orientation which has an uniform distribution. The simulated building is comparable to the BESTEST case 900. It is a rectangular single zone without any interior partitions. The model is kept simple regarding the geometric and materials specifications (see figure 1).
Figure1. Case study
Results are summarized considering energy consumption, annual heating/ cooling and the weighted over- and underheating hours, a significant measure for thermal comfort.
RESULTS The results comprise two performance indicators, the energy consumption (annual and peak loads) as well as thermal comfort.
The outcome is presented with the help of scatter plots and with a correlation coefficient to show the order of sensitivity.
In order to find the most suitable coefficient for the SA scatter plots are conducted first.
Scatter plots
Scatter plots are plots of values Y compared to corresponding values X .The creation of scatter plots is one of the simplest sensitivity analysis technique. This approach consists of generating plots of the points
( ) ,,...,1,, miyx jij =
for each independent variable xi [SIMLAB, 2006].
The purpose is to show the type of relationship or correlation that exists between two sets of data. On the vertical Y axis usually the response variable is covered whilst on the horizontal X axes some variable which is suspect to be related to the other. Sometimes scatter plots completely reveal the relationship between model input and model predictions; this is often the case when there is only one or two inputs that dominate the outcome of the analysis [SIMLAB, 2006].
The relation between orientation and the weighted underheating hours (WUH) appears to be oscillatory and is drawn to the trigonometric sinusoidal model.
Figure 2 Scatter plot: weighted underheating hour versus orientation s
The amplitude in the model is limited in the figure 2 to one. Nevertheless it is trivial that when turning the building, the oscillatory will continue.
The same appears to figure 3, the orientation compared to the annual cooling.
Figure 3 Scatter plot: annual cooling versus orientation
On both figures can be seen that the position of the window is on the south side in the initial situation
Proceedings: Building Simulation 2007
- 1802 -
whilst turning the building with 180 degrees, the window is located on the north side where the lowest annual cooling demand is necessary and the weighted underheating hours reaches the maximum.
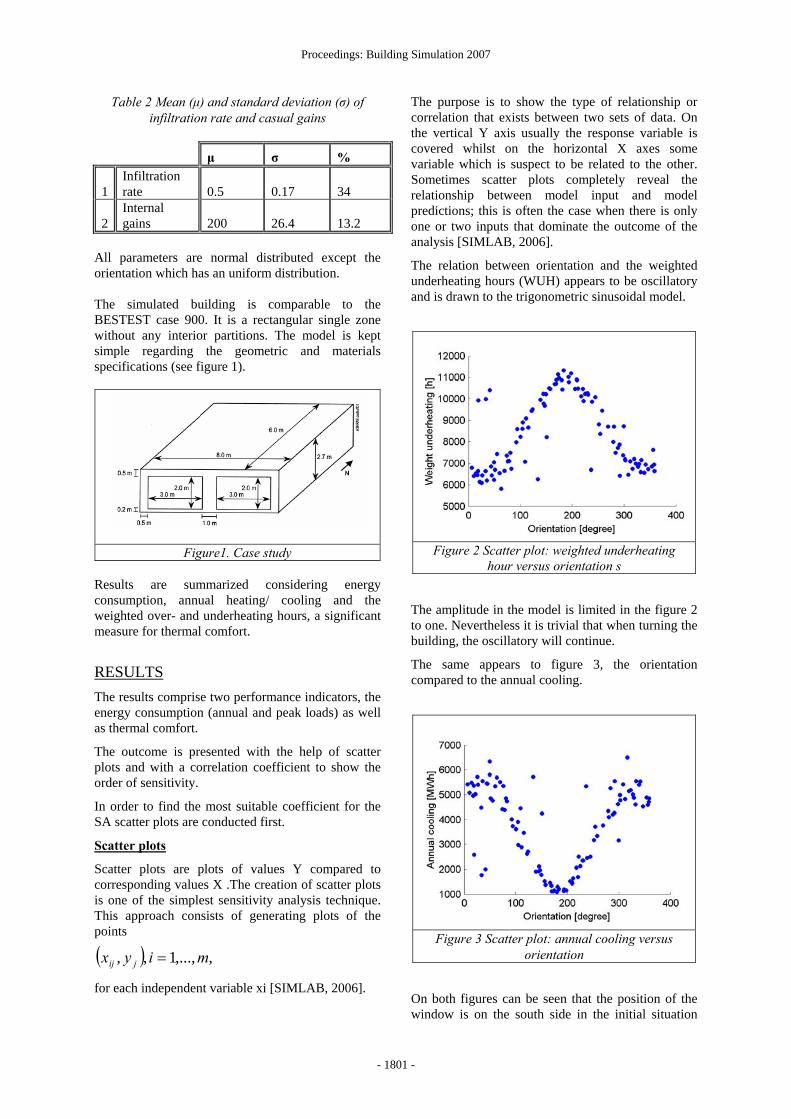
A positive linear relation is shown in figure 4 where infiltration rate is opposed to the peak heating.
A positive correlation implies that as a value of one set of data rises, the other data set will increase as well. It can be seen that the higher the infiltration rate, the higher the amount of the peak heating load.
Figure 4 Scatter plot: peak heating versus infiltration rate
It can be noted that a straight line fits through the results. Hence, a linear relation ship exists even though it is not an exact linear positive relation.
An advantage of scatter plots is to make a prediction using a line of the best fit. Every point on the line is associated with an infiltration value and a peak heating value. Thus, any value chosen on the infiltration will have a corresponding average peak heating value, which can be found by locating the point on the line.
It needs to be point out that there is not one correct answer for drawing a line; it will be only an approximation. Nevertheless, the line of best fit can be used as an indication for the correlation of input and output.
When there is no relationship between the variables, the individual points will be randomly spread over the plot. In this case study there are several sets of data without having apparently a two-dimensional; correlation. There is no obvious positive or negative effect from one sight to the other sight of data.
For that reason three dimensional scatters are plotted.
Following figure shows the correlation between G-value and glass surface compared to the weighted underheating (WUH). Although each value itself compared to the WUH, shows a non-linear relation,
the three dimensional scatter plot delivers a bandwidth of data which is almost linear.
Figure 6 3-dimensional scatter plot: glass surface and G-value versus weight underheating
To sum up, there are different relations in the scatter plots recognizable. Not every parameter has a monotonic or linear relation at least not recognizable in the two dimensional plots. The problem is the influence the input parameters take among each other compared to the output.
In order to fit those linear and non- linear relations, the regression analysis is chosen, which is meant to perform best in such cases [Helton, 2006].
Regression analysis
The more quantitative measures of sensitivity are based on regression analysis. A multivariate sample of the input is generated by some sampling strategy and the corresponding sequence of a number of output values is computed using the model under analysis [SIMLAB, 2006].
The method used in this case study is called Standardized Regression Coefficients (SRC).
Due to the fact that SRC quantifies the effects caused by changing a model parameter from its average by a fraction of its variance, whilst the others are kept at their mean values, the SRC relates directly to the sensitivity of the model output to the model parameters [SIMLAB, 2006].
Regarding the annual consumption and the peak loads the sensitivity output can be seen in figures 7 and 8.
The range of the sensitivity indicates how sensitive the parameter is. The higher the value the more sensitive the parameter is.

Proceedings: Building Simulation 2007
- 1803 -
-0.15 -0.1 -0.05 0 0.05 0.1 0.15 0.2 0.25
Glass surface
Building mass
U-value
ZTA
Orientation
Internal gains
Infiltration rate
Standardize d Re gre ss ion Coe fficie nt (SRC)
Energy Annual heating Annual cooling
Figure 7 Sensitivity analysis in terms of energy demand
The order of sensitivity in figure 7 is ranked by the total energy consumption. Infiltration rate followed by internal gains and orientation are the most sensitive parameters. For annual cooling the order of the three most sensitive parameters is G-value, glass surface, internal gains; for annual heating the order is G-value, infiltration rate and glass surface.
-0.2 -0.1 0 0.1 0.2 0.3 0.4 0.5
Orientation
Internal gains
U-value
Building mass
Glass surface
ZTA
Infiltration rate
S tan dardiz e d Re gre ssion C oe ffi cie nt (SRC )
Peak heating Peak cooling
Figure 8 Sensitivity analysis in terms of peak loads
The sensitivity of the peak heating is headed by infiltration rate, G-value, glass surface; for peak cooling it is U-value, G-value and glass surface.
-0.15 -0.1 -0.05 0 0.05 0.1 0.15 0.2
Orientation
Infiltration rate
U-value
Internal gains
Building mass
Glass surface
ZTA
Standardized Regression Coefficient (SRC)
Weight underheating Weight overheating
Figure 9 Sensitivity analysis in terms of thermal comfort
Figure 9 represents the sensitivity for thermal comfort. The order of the three most sensitive values for the weighted underheating hours is G-value, glass surface and building mass; for the weighted overheating hours it is internal gains, G-value and glass percentage.
CONCLUSION At this stage, a number of preliminary conclusions can be drawn. The produced results from the SA provided by scatter plots and the SRC coefficient seem to be feasible. Both methods allow assessing the impact on more than one performance indicator. It was found out that some parameters fulfill a certain behavior which simplifies the prevision in further analysis. SA appears to be further on a promising method to provide design information using building performance simulation. Energy demand
The most sensitive parameters are identified. For the energy use these are infiltration rate and causal gains that belong to the group of uncertainties for internal boundary conditions. Less important by the meaning of less sensitive are building mass and orientation that belong to the group of design parameters.
Thermal comfort
For the thermal comfort uncertainties in the G-value (physical parameter) and glass surface (design parameter) have more influence. Less crucial is infiltration rate (internal boundary conditions) and orientation (design parameter).
FUTURE WORK Further work will include a more realistic case study.
In addition a case study validation will take place. A trial study will be prepared in order to check how designers feel satisfied with the outcome and in which way results can be performed to support their decision making. This could for instance influence the order in which way the results will be presented or of which relations scatter plots will be plotted. This will be find out in further research.
REFERENCES Helton J.C., Johnson J.D., Sallaberry C.J., Storlie
C.B., 2006. Survey of sampling-based methods for uncertainty and sensitivty analysis, Sandia report, SAND2006-2901, unlimited release, printed June 2006
Hopfe C., Struck, C., Ulukavak Harputlugil, G., Hensen, J., de Wilde, P., 2005. Exploration of the use of building performance simulation for
Proceedings: Building Simulation 2007
- 1804 -
conceptual design, in proceedings IBPSA NVL 2005, Delft, The Netherlands
ISSO, 2004. Thermal comfort as performance (in Dutch), ISSO research rapport, 74, Rotterdam, The Netherlands
Lomas K.J., Eppel H., 1992. Sensitivity analysis techniques for building thermal simulation programs, Energy and Buildings. Vol. 19, no. 1, pp. 21-44. 1992
Poloni C., 2006. Design for quality: the role of adaptive computing in industrial applications, in proceedings of 7thinternational conference ACDM 2006, Bristol, UK
Saltelli A., Tarantola S., Campolongo F., Ratto M., 2004. Sensitivity analysis in practice- a guide to assessing scientific models, reprinted version 2005, Wiley
Simlab, http://webfarm.jrc.cec.eu.int/uasa, version 2.2, last accessed February 2006
Vabi Software, standard in rekenen, http://www.vabi.nl/, last accessed February 2006
Wit, M.S. de, 2001. Uncertainty in prediction of thermal comfort in buildings, PhD-thesis, Delft University of Technology, Delft, The Netherlands