application of semi-automated settlement detection for an
TRANSCRIPT

South African Journal of Geomatics, Vol. 6. No. 3, October 2017
308
Application of semi-automated settlement detection for an
integrated topographic map information system update in South
Africa
L.Ngcofe1, T.Rambau1, M. McCalachan1, F. Hantibi1, N. Mudau2
1Department of Rural Development and Land Reform
Directorate: National Geo-Spatial Information
E-mail: [email protected] 2 South African National Space Agency
Earth Observation
Email: [email protected]
DOI: http://dx.doi.org/10.4314/sajg.v6i3.3
Abstract
Complete, accurate and up-to-date topographic data is of vast importance as it is widely
required by different government agencies, non-governmental organisations, the private
sector as well as the general public for urban mapping, rural development and environmental
management, to mention but a few applications. Efficient semi-automatic methods for
detecting settlements as change area indicators are required in order to achieve a
sustainable up-to-date topographic database. This study reviewed the capability of
geographic object based image analysis (GEOBIA) as a semi-automated method for
settlement detection using 2012 SPOT 5imagery in the KwaZulu-Natal Province, South
Africa.
The application of GEOBIA provide the ability to segment imagery into areas resembling
features of interest. For this study GEOBIA settlement detection provided 70.7% overall
accuracy while the existing semi-automated South African global human settlement layer
(SA_GHSL) had 60% overall accuracy. These results presents an opportunity to apply
GEOBIA semi-automated method to target areas of new settlement development more
efficiently and with consistent repeatable manner. Thus assisting topographic update analyst
to be drawn to more areas of new settlement development at an enhanced efficient rate.
However the spectral variability of roof tops which are prominent identifiable feature by
remote sensing for settlement areas prove to be the most challenging obstacle towards semi-
automated settlement detection.
South African Journal of Geomatics, Vol. 6. No. 3, October 2017
309
1. Introduction
The changes to the landscape are constantly occurring both naturally and human induced.
It is essential for these changes to be regularly detected and captured for updated topographic
information in order to reflect the current status of the landscape (Duncan & Smit, 2012;
Knudsen & Oslen, 2003). Chen et al., (2014) concur highlighting the importance of
topographic information applications for different government agencies, non-governmental
organisation, private sector and citizens at large.
The Chief Directorate: National Geo-Spatial Information (CD: NGI), as one of its
mandates, needs to provide the national topographic map information of the country. In doing
so the organisation has developed an integrated topographic information system (iTIS) for the
geo-spatial capture of the 1: 50 000 scale topographic data product. The Spatial Data
Infrastructure Act (SDI) 54 of 2003 provides CD: NGI with the responsibility to accurately
maintain and frequently update the iTIS. The CD: NGI is therefore in the process of updating
and maintaining the iTIS. The map updating and revision process is based on a data holistic
approach, where for each new 1: 50 000 map, all topographic data are collected in vector
form, symbolised and validated. The map updates have been carried out as a full remapping
of South Africa by manual detection and registration of the changes from aerial photographs.
The current method of updating the iTIS is based on a five year revision cycle of all features
using aerial photographs. This is due to the three year flying programme for capturing aerial
photographs for the whole country and the compilation programme (entailing
orthorectification) of the captured aerial photographs.
The current method has significant challenges as the manual approach has proved to be
time and human resource consuming, which is not a unique problem as also experienced by
mapping agencies around the world (Le Bris & Chehata, 2011). This has resulted to certain
areas of the country within the iTIS geo-spatial database to be continuously out-dated.
Furthermore, in South Africa the compilation programme is forced to work in areas of the
country that might have had little or no change due to the flying programme covering areas
with no or little activities. The availability of new satellite sensors providing high spatial
resolution and frequent data capture can be used to fast track topographic mapping updates.
These include satellites like IKONOS, Quickbird, WorldView and SPOT to mention but a
few.

South African Journal of Geomatics, Vol. 6. No. 3, October 2017
310
The most abundant information for the updates of topographic data is due to
anthropogenic changes such as streets, roads, buildings and other infrastructures like power
lines etc. (Knudsen & Oslen 2003; Barber et al., 2008), which are instigated by fast
infrastructure developments in order to meet economic needs of the country. These changes
are largely experienced when there are new settlement developments, thus leading to an
urgent need for an up-to-date topographic information more than ever. The application of
settlement detection as an indicator of where major landscape changes occur to improve the
iTIS database update is proposed for this study. This leads to the aim of the study which
seeks to investigate the geographic object based image analysis (GEOBIA) as the semi-
automated settlement detection from satellite imagery for the advancement of the iTIS geo-
spatial update.
2. Study area
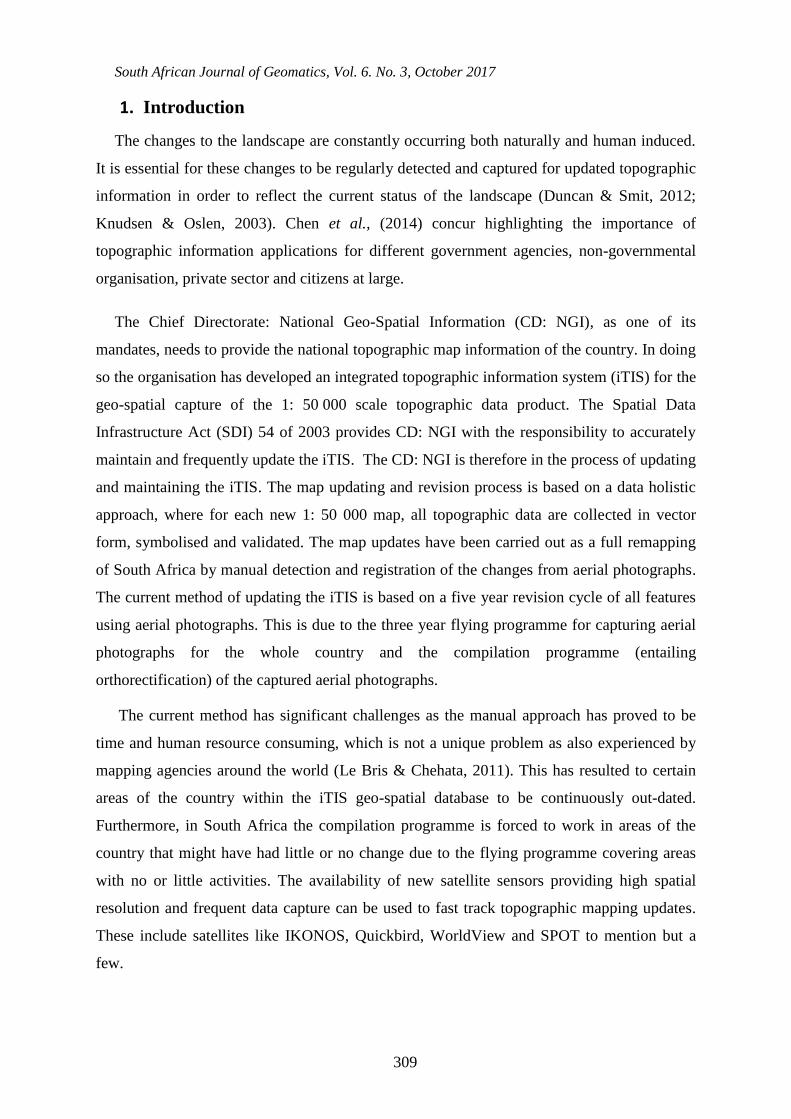
The study area is located in the KwaZulu-Natal Province characterised by an urban and
rural area respectively (Figure 1). The choice of this study area has been due to the recent
manual updating of the area using the 2012 aerial imagery. The study area covers 892.6 km2
of 2930 DD and 2931 CC sheet of 1: 50 000 scale.
For the investigation of semi-automated settlement detection, SPOT 5, 2012 imagery has
been used. The SPOT 5 imagery consist of four multispectral (Blue, Green, Red & Near
Infrared) bands and one panchromatic band. The multispectral bands have a spatial resolution
of 10 meters and 2.5 meters for panchromatic band. The multispectral bands were pan-
sharpened to 2.5 meter resolution in order to make use of spectral information and spatial
accuracy of both image resolutions. The study area (Figure 1) is displayed using 321 band
combination with red highlighting vegetation, cyan highlighting settlements with water
shown as blue.
South African Journal of Geomatics, Vol. 6. No. 3, October 2017
311
Figure 1: Location of the study area (2930DD and 2931 CC of 1: 50 000 scale) in KwaZulu-
Natal Province. The image is displayed as a false colour composite (RGB, 321) with red
highlighting vegetation, cyan indicating settlement, and blue as water.
3. Methodology
This study investigated GEOBIA semi-automated method for settlement detection.
3.1 Geographic Object Based Image Analysis (GEOBIA)
The GEOBIA is defined as a discipline to develop theory, methods and tools for
replicating and improving human interpretation of remotely sensed imagery in an automated
or semi-automated manner (Hay & Castilla, 2008; Blaschke & Hay, 2001). GEOBIA has
become accepted as an efficient method for extracting detailed information from very high
spatial resolution satellite imagery over the past decade (Belgiu & Drǎgut, 2014; Blaschke,
2010). However, it is still regarded as a relatively new approach for earth observation image
analysis when compared to traditional image (pixel) analysis. The GEOBIA involves the
partitioning of a scene into discrete entities or segments from which meaningful image
objects, based on their spatial and spectral attributes can be generated (Desclee et al., 2006;
Gao & Mas, 2008; Baatz & Schape 2000). The principal idea is that meaningful information

South African Journal of Geomatics, Vol. 6. No. 3, October 2017
312
is not presented in individual pixels but in meaningful image objects and their mutual
relationships (Schiewe, 2002).
This study concentrated on multiresolution segmentation (MRS) model implemented in
eCognition software (Definiens, 2007). MRS is a bottoms-up region-merging technique that
partitions the image into image objects on the basis of homogeneity criteria, controlled by
user-defined parameters such as colour, shape, compactness/smoothness and scale. The
combination of these parameters results in different image object and getting the correct
object is trial-and-error process. Through different trial-and-error segmentation parameter
investigations, suitable objects of interest were obtained. This entailed scale of 20, colour of
0.8 and smoothness of 0.5 parameters. This resulted to 23 759 objects for analysis for the
study area.
The next step was to determine variable obtained from image segmentation to classify the
image. There are several variable that are generated by eCognition software to assist towards
object feature classification. These include: layer values, geometry, position, texture,
hierarchy, thematic attributes (
Figure 2). The layer value option entails spectral statistics such as mean value and mean
brightness for image reflectance bands together with capability of further applying band ratio
combinations. Under the texture and geometry option also several alternatives are applicable
(such as length/width under extend and asymmetry under shape properties). Under the level
co-occurrence matrix (GLCM) the study explored the contrast textual measurements
developed by Haralick et al., (1973). This study assessed the following variables, mean
brightness, density, length/width and band ratios. After determining the variable to be further
used for settlement detection, the actual classification based on rule set was applied.

South African Journal of Geomatics, Vol. 6. No. 3, October 2017
313
Figure 2: Various variable parameters available in eCognition software
The rule based classification step entails determining the rule and values for each of the
chosen variable feature to attain class features of interest. The following classes: vegetation ,
water, roads, settlements and bare ground were discriminated
(
Figure 3). The inclusion of discriminated other classes (vegetation, bare ground, water
&roads) was due to enhance settlement detection when these classes were distinctly
separated. The final step was to export the results to ArcGIS 10.2.2 for further analysis. The
settlement class was extracted from other classes for precise examination and accuracy
assessment.

South African Journal of Geomatics, Vol. 6. No. 3, October 2017
314
Figure 3: The methodological approach for image classification from on rule based technique.
4. Results and Discussions
For the GEOBIA application the study area was characterised into five classes namely:
vegetation, water, roads, settlements and bare ground. The purpose of including other classes
for classification was to discriminate those areas that potentially have similar spectral
reflectance to the class of interest (the settlements class). For settlements detection, the roof
tops are the prominent feature of buildings which are identifiable by remote sensors. The
large variability in material composition, colour, shape, size and orientation of the roof tops
makes it difficult to grasp sematic properties by any consistent physical definable attributes
(Asmat & Zamzami, 2011; Le Bris & Chehata, 2011). This has proved to be evident with the
results from GEOBIA where by not full cover of the roof top could be captured or detected
(Figure 4).

South African Journal of Geomatics, Vol. 6. No. 3, October 2017
315
Figure 4: Geographic Object Based Image Analysis (GEOBIA) settlement detection results
overlaid on SPOT5, 2012 band combination 321 (RGB). The zoomed in-insert (1,2 &3)
reveal settlement detection capability of roof tops.

South African Journal of Geomatics, Vol. 6. No. 3, October 2017
316
To attain better understanding of GEOBIA settlement detection, visual analysis of results
were compared to the existing semi-automated settlement layer called South African global
human settlement layer (SA_GHSL) produced by the South African National Space Agency
(SANSA).The SA_GHSL was conducted using SPOT 5, 2012 imagery as utilised to derive
settlements by GEOBIA. The detailed methodology used to derive SA_GHSL has been
explained by Kemper et al., 2015. Through visual analysis the GEOBIA technique was
observed to better identify the roof tops while SA_GHSL better identified roof top edges
(Figure 5Figure 6). The ability to identify roof tops by GEOBIA is directly related to the
capability of an image segmentation process that seeks to also resemble the shape of the
features of interest, while variability of material composition remained a stabling block for
full detection.
Figure
5: South African Global Human Settlement Layer (SA_GHSL) settlement detection results
overlaid on SPOT5, 2012 band combination 321 (RGB). The zoomed in-insert (1,2 &3)
reveal settlement detection capability of roof tops.

South African Journal of Geomatics, Vol. 6. No. 3, October 2017
317
Figure 6: Visual identification of settlements (buildings) between A) Geographic Object
Based Image Analysis (GEOBIA) semi-automated detection against B) South African Human
Settlement Layer (SA_GHSL).
An error matrix accuracy assessment (Congalton & Green, 2009; Senseman et al., 1995)
was conducted for quantitative measure of the semi-automated settlement detection results.
The accuracy assessment was based on the generation of 65 random points from the manual
digitised settlement layer by CD: NGI. This carried an assumption that every random selected
point would be detected by the semi-automated settlement detection. The selected points
were then visually classified using 2012 aerial imagery with 0.5 meter resolution into the
following classes: buildings, bare ground, roads, shades, vehicle, water, and vegetation. The
65 random points were then examined and determined whether they were correctly detected
or not by the semi-automated settlements results. The overall accuracy assessment results for
correctly classified semi-automated settlements detection was 70.8% for GEOBIA (Table 1)
and 60% for SA_GHSL (Table 2). It has been observed that for GEOBIA method, only 2 out
of the 65 random points were not detected resulting to only 3.07% omission points for
analysis. While for the SA_GHSL, 12 out of 65 random points detected resulting to 18.5%
omission points for analysis.
Features Buildings/
settlements Bare
ground Roads Shades Vehicle Water Vegetation Row total

South African Journal of Geomatics, Vol. 6. No. 3, October 2017
318
Table 1: Accuracy assessment of GEOBIA
Table 2: Accuracy assessment of SA_GHSL
5. Conclusion
This study demonstrates the use of high-resolution imagery to facilitate settlement
detection in order to fast tracking topographic map updates. The semi-automated settlement
detection by GEOBIA approaches using 2012 SPOT 5 imagery obtained 70.8% accuracy.
The ability to obtain high accuracy results (70.8%) with minimum omission error (3.07%) for
GEOBIA settlement detection provides an opportunity to apply this method to target areas of
new settlement developments more efficiently and in a consistent repeatable manner. With
the successful launch of SPOT 6 in 2012 and SPOT 7 in 2014 with 6 meter multispectral
bands (Blue, Green, Red, Near Infrared) and 1.5 meter panchromatic band presents potential
capability for increase of semi-automated settlement detection accuracy.
Settlements 45 5 3 5 1 1 2 62
Not detected 2 1 0 0 0 0 0 3
Bare ground 0 0 0 0 0 0 0 0
Shades 0 0 0 0 0 0 0 0
Vehicle 0 0 0 0 0 0 0 0
Water 0 0 0 0 0 0 0 0
Vegetation 0 0 0 0 0 0 0 0
Column total 47 6 3 5 1 1 2 65
Features Buildings/
settlements
Bare ground Roads Shades Vehicle Water Vegetation
Row total
Settlements 35 2 1 4 4 0 1 47
Not detected 12 4 0 1 0 1 0 18
Bare ground 0 0 0 0 0 0 0 0
Shades 0 0 0 0 0 0 0 0
Vehicle 0 0 0 0 0 0 0 0
Water 0 0 0 0 0 0 0 0
Vegetation 0 0 0 0 0 0 0 0
Column total 47 6 1 5 4 1 1 65
Reference from aerial imagery
Class detected
Class detected
Reference from aerial imagery

South African Journal of Geomatics, Vol. 6. No. 3, October 2017
319
Acknowledgment
The authors would like to thank Debbie Sutherland for her tireless contribution towards
this paper. Thanks also goes to anonymous reviewers for their contributions in strengthening
this paper.
REFERENCES
Asmat, A., Zamzami, S.Z., 2012. Automated house detection and delineation using optical remote
sensing technology for informal human settlement. Procedia-Social and Behavioral Sciences, 36:
650-658.
Baatz, M., Schape, A., 2000. Multiresolution segmentation: an optimization approach for high quality
multi-scale image segmentation. In Strobl, J., Blaschke, T., Griesbner,G., (Eds) Angewandie
Geographische Informations-sverabeitung VII, Wichmann Verlag, Karsrushe, Germany, 12-23.
Barber, D.M., Holland, D., Mills, J.P., 2008. Change detection for topographic mapping using three
dimensional data structure. The International Archives of the Photogrammetry, Remote Sensing
and Spatial Information Sciences, Beijing.
Belgiu, M., Dragut, L., 2014. Comparing supervised and unsupervised multiresolution segmentation
approaches for extracting buildings from very high resolution imagery. ISPRS Journal of
Photogrammetry and Remote Sensing 96: 67-75.
Blaschke, T., 2010. Object based image analysis for remote sensing. ISPRS Journal of
Photogrammetry and Remote Sensing, 62: 2-16.
Blaschke, T., Hay, G.J., 2001. Object-oriented image analysis and scale-space: Theory and methods
for modelling and evaluating multiscale landscape structure. International Archives of
Photogrammetry and Remote Sensing, 4 (34): 22-29.
Chen, J., Wang, D., Zhao,R., Zhang,H., Liao, A., Liu, J., 2014. Fast updating of national Geo-Spatial
databases with high resolution imagery: China’s methodology and experiences. The International
Archives of the Photogrammetry, Remote Sensing and Spatial Information Science, 41-50.
Congalton, R.G., Green, K., 2009. Assessing the accuracy of remotely sensed data: Principles and
Practices 2nd Ed. Taylor and Francis Group, New York.
Definiens developer 7, 2007. Reference book. Definiens A.G., Munchen.
http://ecognition.cc/download/userguide.pdf. Accessed 17June 2017.
Desclee, B., Bogaert, P., Defourny, P., 2006. Forest change detection by statistical object-based
method. Remote Sensing of Environment, 102: 1-11.
Dey, V., Zhang, Y., Zhongm,M., 2010. A review on image segmentation techniques with remote
sensing perspective. ISPRS TC VII Symposium, Vienna, Austria, 31-42.
Duncan, P., Smit, J., 2012. An investigation of automatic change detection for topographic updating.
International Archives of the Photogrammetry, Remote Sensing and Spatial Information Sciences.
ISPRS congress, Melbourne, Australia.

South African Journal of Geomatics, Vol. 6. No. 3, October 2017
320
Gao, Y., Mas, J.F., 2008. A comparison of the performance of pixel based and object based
classification over images with various spatial resolution. Journal of Earth Sciences 2 (1): 27-35.
Haralick, R., Shanmugam, K., Dinstein, I., 1973. Textural features for image classification. IEE
Transactions on Systems Man and Cybernetics. 3(6): 610-621.
Hay, G.J., Castilla, G., 2008. Geographic Object-Based Image Analysis (GEOBIA): A new name for
a new discipline. In: Object-based image analysis: Spatial concept for knowledge-driven remote
sensing applications edited by Blascke T and Lang S. (Springer Publishers, Heidelberg), 93-112.
Kemper, T., Mudau, N., Mangara, P., Pesaresi, M., 2015. Towards an automated monitoring of human
settlements in South Africa using high resolution SPOT satellite imagery. 36 International
Symposium on Remote Sensing of Environment, 11-15 May, Berlin, Germany.
Knudsen, T., Olsen, B.P., 2003. Automated change detection for updates of digital map databases.
Photogrammetric Engineering and Remote Sensing, 69 (11): 1289-1296.
Le Bris, A., Chehata, N., 2011. Change detection in a topographic building database using submetric
satellite images. International Archives of Photogrammetry, Remote Sensing and Spatial
Information Sciences, 38 (3/W22).
Schiewe, J., 2002.Segmentation of high-resolution remotely sensed data-concepts, applications and
problems. International Archives of the Photogrammetry, Remote Sensing and Spatial Information
Sciences, 34: 380-385.
Senseman G.M., Bagley C.F., Tweddale S.A., 1995. Accuracy assessment of the discrete
classification of remotely-sensed digital data for land cover mapping. USACERL Technical Report
EN-95/04.