application of pv for electricity generation in …
TRANSCRIPT
AH
ME
D A
Ali B
EN
AM
IRA
A
PP
LIC
AT
ION
OF
PV
FO
R E
LE
CT
RIC
ITY
GE
NE
RA
TIO
N IN
TA
JO
UR
A
HE
AR
T H
OS
PIT
AL
ICU
-LY
BY
A &
A C
OM
PA
RA
TIV
E S
TU
DY
WIT
H
NE
AR
EA
ST
HO
SP
ITA
L
NE
U
2016
APPLICATION OF PV FOR ELECTRICITY
GENERATION IN TAJOURA HEART HOSPITAL ICU-
LIBYA & A COMPARATIVE STUDY WITH NEAR EAST
HOSPITAL
A THESIS SUBMITTED TO THE
GRADUATE SCHOOL OF APPLIED SCIENCES
OF
NEAR EAST UNIVERSITY
By
Ahmed A Ali Ben Amira
In Partial Fulfilment of the Requirements for
The Degree of Master of Science
In
Electrical and Electronic Engineering
NICOSIA, 2016

AHMED A Ali BEN AMIRA: APPLICATION OF PV FOR ELECTRICITY
GENERATION IN TAJOURA HEART HOSPITAL ICU-LIBYA & A
COMPARATIVE STUDY WITH NEAR EAST HOSPITAL
Approval of Director of Graduate
School of Applied Sciences
Assoc. Prof. Dr. Nadir CAVUS
We certify this thesis is satisfactory for the award of the degree of Masters of
Science in
Electrical and Electronic Engineering
Examining Committee in Charge:

I hereby declare that all information in this document has been obtained and presented in
accordance with academic rules and ethical conduct. I also declare that, as required by these
rules and conduct, I have fully cited and referenced all material and results that are original
to this work.
Name, Surname: Ahmed A Ali Ben Amira
Signature:
Date:

i
ACKNOWLEDGEMENTS
I would like to gratefully and sincerely thank Assist. Prof. Dr. Lida Ebrahimi VAFAEI For
her guidance, understanding, patience, and the most importantly, her supervision during the
preparation of my graduate thesis at Near East University. Her supervision was paramount
in providing a well-rounded experience consistent my long-term career goals. She
encouraged me to not only grow as an experimentalist, but also as an instructor and an
independent thinker.
Additionally, I am very grateful for my family, in particular my mother for her help
throughout my life. Thank you for giving me the chance to prove and improve myself
through all walks of life; and my father, who was always the source of my patience and
encouragement all over my life.

ii
To my parents and family….
iii
ABSTRACT
Solar energy is gaining more and more importance in the 21st century. The use of renewable
energy sources such as solar is becoming a beneficial investment from the commercial point
of view as much as the environmental point of view. The energy of sun arrive the earth daily
with different concentrations providing a lot of energy that can be collected and changed to
other forms of energy. The Libyan Republic is one of the richest North African countries of
oil and natural gas. However, the real wealth of Libya resides in its large area that receives
very high solar irradiation around the year. This led the strategic thinkers in Libya and the
world to spend more investments in the clean solar energy in the Libyan Desert. This work
concentrates on the study of the power generation of a solar system in Libya and to compare
it with a similar solar system. The study is pointed toward the study of solar generation
system adapted to generate the required power to feed the Tajoura Heart Intensive Care Unit
in Libya. This system has become very important and vital for the hospital as a result of the
economic, political and security problems in Libya after the civil war in 2011. The work
concentrates on the design and study of the power generation of the system during the last
year. The study will also study the power generation of solar system in TRNC to show the
differences and spot the light on the problem of energy in Libya. Results of experiments are
presented and discussed.
Keywords: Grid tied inverter; interactive inverter; irradiation; PV cell; solar energy.

iv
ÖZET
21 inci yüzyılda Solar enerji her geçen gün daha da fazla önem kazanmaktadır. Solar enerji
gibi yenilenebilir enerji kaynakları doğa için önemli olduğu gibi, ticari anlamda da önemli
bir yatırım alanıdır. Güneş enerjisi dünyamıza her güün farklı yoğunluklarda ulaşıp,
toplayarak farklı enerji formlarına çevirilebilecek, yüksek miktarda enerji sağlamaktadır.
Libya cumhuriyeti, petrol ve doğal gaz bakımından kuzey Afrikanın en zengin ülkelerinden
biridir. Buna reğmen, Libyanın gerçek zenginliği, yıl boyunca yüksek derecede güneş
ışınımı almasında yatmaktadır. Bu da dünyadaki ve Libyadaki yatırımcıları Libya çölünde
Solar Enerji alanında daha fazla yatırım yapmaya yönlendirmiştir. Bu tezdeki Çalışmanın
ana amacı, Libyadaki bir solar sistemdeki güç üretimini incelemek ve benzer solar
sistemlerle kıyaslamaktır. Bu çalışma Libyadaki Tajoura kalp yoğun bakım biriminin
beslenmesi için kullanılan solar sistemin incelenmesini içerir. 2011 yılında Libyada geçen
iç savaştan dolayı, ülkede poletik ve güvenlik sorunlar doğmuştur. Dolayısı ile bu system
hastane için hayati bir önem taşımaktadır. Bu çalışma sistemin dizayn ve güç üretimi üzerine
yoğunlaşmaktadır. Yıl içinde yapılan deneylerin sonuçları tezde sunulmuş ve tartışılmıştır.
Keywords: Şebeke invertörü; invertör interaktif; ışınlama; güneş enerjisi; PV cell.

v
TABLE OF CONTENTS
ACKNOWLEDGMENTS.........................................................................................i
ABSTRACT ..............................................................................................................iii
ÖZET .........................................................................................................................iv
TABLE OF CONTENTS ..........................................................................................v
LIST OF TABLES ....................................................................................................viii
LIST OF FIGURES ..................................................................................................ix
LIST OF ABBREVIATIONS ...................................................................................xi
CHAPTER 1: INTRODUCTION
1.1 Objectives of the Work..........................................................................................2
CHAPTER 2: RENEWABLE ENERGY RESOURCES AND ENERGY
SITUATION IN LIBYA 2.1 Energy Consumption .............................................................................................3
2.2 Power Resources in Libya .....................................................................................5
2.3 Renewable Resources Utilisation in Libya .............................................................7
2.4 History of Solar Energy .........................................................................................10
2.5 Photovoltaic Energy in Libya ................................................................................11
2.6 Energy in TRNC ...................................................................................................13
2.7 Development of PV Technologies ........................................................................15
2.8 Forms of Photovoltaic Systems ............................................................................17
2.8.1 Stand alone systems ..................................................................................... 17
2.8.2 Grid connected (tied) systems ...................................................................... 18
2.8.3 Hybrid systems ............................................................................................ 18
2.9 Photovoltaic Technology ...................................................................................... 19
2.9.1 Equivalent circuit of a solar cell ................................................................... 20

vi
CHAPTER 3: ELEMENTS OF SOLAR SYSTEM
3.1 PV Cell ................................................................................................................. 21
3.1.1 Equivalent circuit of the solar cell ................................................................ 22
3.1.1.1 Single diode simple solar cell model ......................................................... 22
3.1.1.2 Single diode detailed model ...................................................................... 23
3.1.1.3 The double diode model of the solar cell ................................................... 24
3.2 Open Circuit Voltage and Short Circuit Current .................................................... 24
3.3 Effects of Temperature and Irradiance Variation .................................................. 25
3.4 Photovoltaic Array ................................................................................................ 27
3.5 Effect of Shading on the Solar Cells and Partial Shading ...................................... 28
3.6 Balance of the System ........................................................................................... 29
3.6.1 Batteries ...................................................................................................... 29
3.6.1.1 Chemistry of batteries ............................................................................... 30
3.6.1.2 Lead acid batteries .................................................................................... 30
3.6.2 Battery chargers ........................................................................................... 31
3.6.3 Solar inverter ............................................................................................... 32
CHAPTER 4: TAJOURA HOSPITAL SOLAR SYSTEM
4.1 Tajoura Heart Hospital ......................................................................................... 34
4.2 Solar Power Systems Specifications ..................................................................... 36
4.2.1 Peak sun hours ............................................................................................. 36
4.2.2 Battery requirements .................................................................................... 38
4.2.3 Photovoltaic panels ....................................................................................... 39
4.2.4 Solar Inverters .............................................................................................. 40
4.3 Near East Hospital ................................................................................................ 43
4.4 Solar Energy Production in TRNS ........................................................................ 45
4.5 Comparative Energy Production in TRNC and Republic of Libya ......................... 45

vii
CHAPTER 5: RESULTS AND DISCUSSIONS
5.1 Daily and Monthly Power Generation .................................................................. 47
5.2 Power Generation in Libya vs. North Cyprus ........................................................ 52
CHAPTER 6: CONCLUSIONS AND RECOMMENDATIONS
REFERENCES ........................................................................................................ 57

viii
LIST OF TABLES
Table 2.1: Electrical energy consumption in Libya 2007 ....................................................5
Table 2.2 : Renewable energy resources in Libya ..............................................................8
Table 2.3 : Renewable energy resources investment in Libya until 2013 .......................... 10
Table 2.4 : Different PV projects in Libya (2014) ............................................................ 12
Table 2.5 : Renewable energy investments in Libya ........................................................ 12
Table 2.6: Target renewable energy production until 2025 in Libya ................................. 13
Table 2.7: Average solar irradiation and wind speed at different altitudes in TRNC ......... 14
Table 4.1: Partial ward measured load parameters during survey ..................................... 35
Table 4.2: Calculated load of the ICU based on measured values ..................................... 36
Table 4.3: The sun peak hour, temperature, and wind speed data in Tripoli, Libya ........... 37
Table 4.4: Specifications of the solar power panels .......................................................... 40
Table 4.5: Comparison of power efficiency of different solar panels ................................ 40
Table 4.6: Specifications of the used grid interactive inverter .......................................... 41
Table 4.7: Specifications of the used grid tie inverter ....................................................... 41
Table 4.8: Results of the power survey in Near East Hospital .......................................... 44
Table 4.9: Comparison of energy production in Libya and TRNC……………………….46

ix
LIST OF FIGURES
Figure 2.1: Electric power consumption in Libya between 2000-2014 (billion kWh) .........4
Figure 2.2: Power generation plan in Libya 2007 (Libya, 2009) ........................................5
Figure 2.3: Peak demand progress in Libya between 2003 and 2010..................................6
Figure 2.4: Forecasted electric power demand between the years 2009-2025 in Libya .......6
Figure 2.5: The map of solar irradiation in Libya ...............................................................7
Figure 2.6: Wind Atlas of Libya ........................................................................................8
Figure 2.7: Expected consumption and renewable energy investment in Libya until 2050 .9
Figure 2.8: Rural solar energy generation plan and solar systems before 2007 ...................9
Figure 2.9: Renewable energy percentage in the production map of Libya until 2025 ...... 13
Figure 2.10: Old wind turbine that is still in use in Famagusta (Biricik, 2014) ................. 14
Figure 2.11: METU solar power generation station (Oner, 2016)..................................... 15
Figure 2.12: Installed solar PV capacity in the OECD countries 1992-2009 ..................... 16
Figure 2.13: Installed PV capacities between the years 2000 until 2013 ........................... 16
Figure 2.14: Typical stand-alone solar (Pickard, 2008) .................................................... 16
Figure 2.15: Typical grid tied solar system ...................................................................... 16
Figure 2.16: Hybrid system structure and equipments...................................................... 16
Figure 2.17: Simplified model of a solar panel ................................................................ 16
Figure 3.1: The general structure of the PV cell ............................................................... 23
Figure 3.2: Single diode simple model of solar cell ......................................................... 23
Figure 3.3: Single diode detailed model of the solar cell or module ................................. 23
Figure 3.4: Double diode model equivalent circuit of solar cell ....................................... 24
Figure 3.5: I-V versus P-V curve of the solar module under standard conditions ............. 25
Figure 3.6: I-V curve of the solar module under different temperatures (Irradiation ......... 26
Figure 3.7: I-V curve of a solar cell under different irradiation levels (T= 25 C) .............. 27
Figure 3.8: Solar cell, module, and array structure ........................................................... 28
Figure 3.9: a- SP, b- TCT, c- BL, and d- HC connections of solar arrays ......................... 28
Figure 3.10: The effect of shading on the cells I-V curve ................................................. 29
Figure 3.11: Chemical status of the acids and plates in a battery ...................................... 31
Figure 3.12: Battery charger used for solar energy systems (Ridgeway, 2016) ................. 32
Figure 4.1: Upper view of the site of Tajoura Heart Centre, Libya (Wikimapia, 2016)..... 34

x
Figure 4.2: Load profile of one room (4 beds) of the ICU ................................................ 35
Figure 4.3: Sun peak hour term (Bowden & Honsberg, 2014) .......................................... 36
Figure 4.4: General structure of the solar system of the ICU ............................................ 38
Figure 4.5: Batteries used in the system for energy storage .............................................. 39
Figure 4.6: Installed solar panels on the roof of the hospital (PW750) ............................. 40
Figure 4.7: Data logging equipments and installations ..................................................... 42
Figure 4.8: Front view of near east hospital (NEU-Webteam, 2015) ................................ 43
Figure 4.9: Solar Panels system at Ekrim Solar Company................................................ 45
Figure 4.10:Monthly energy generation in Libya vs. TRNC system ................................. 45
Figure 5.1: Daily system power generation during January, April, and June .................... 48
Figure 5.2: Daily system power generation during July and November............................ 48
Figure 5.3: Peak power generation during Jan, Apr, May, and June ................................. 48
Figure 5.4: DC voltage (on load) of the first solar string (Jan, Apr, and Jun) .................... 49
Figure 5.5: DC voltage (on load) of the first solar string (Jul and Nov) ............................ 49
Figure 5.6: AC side current generated by the solar inverter.............................................. 49
Figure 5.7: AC side current generated by solar inverter ................................................... 50
Figure 5.8: Daily power generation during January ......................................................... 50
Figure 5.9: Daily power generation during February ....................................................... 50
Figure 5.10: Daily power generation during April and September ................................... 51
Figure 5.11: Monthly generated power except August and December (total 5262kW) ..... 51
Figure 5.12: Expected power generation of the system (total 10006kW) .......................... 52
Figure 5.13: Daily power generation of January, TRNC system ...................................... 53
Figure 5.14: Power records during the first day of February 2016 .................................... 53
Figure 5.15: DC voltage of the solar string, 1st February ................................................. 53
Figure 5.16: DC current of the solar string (1st February) ................................................ 54
Figure 5.17: Power generation during the month of May ................................................. 54
Figure 5.18: Power generation during one day of June (12 June 2016) ............................ 55
Figure 5.19: Average monthly power generation ............................................................. 55
Figure 5.20: Monthly Energy generation in Libya vs. TRNC system ............................... 55

xi
LIST OF ABBREVIATIONS
AC : Alternating current
BL : Bridge link
DC : Direct current
DOD : Depth of discharg
HC : Honey comb
ICU : Intensive care unit
Isc : Short circuit current
Iph : Photo electric current
kVA : Kilo Volt-Ampere
kW : Kilo watt
kWh : Kilo Watt hour
kWp : Kilo Watt peak
kv : Voltage constant of temperature
MPPT : Maximum power point tracking
PV : Photovoltaic
SP : Series parallel
STC : Standard test conditions
T : Temperature
t : Time
TCT : Total cross tied
TRNC : Turkish Republic of Northern Cyprus
UPS : Un-interruptible power supply
Vmpp : Voltage of maximum power point
Voc : Open circuit voltage
ns : Number of series cells

1
CHAPTER 1
INTRODUCTION
Energy is one of the most basic and important nerves of the life and modern economy. Every
day task at home, school, hospital, factory, and other fields of the life is energy based.
Conventional energy resources like fossil fuels suffer from rapid depletion under the
increasing energy demand worldwide. Scientists were aware of the energy problems and the
future of energy since the beginning of the last century. Different researches were established
and launched since then to find other non-conventional power resources. After the discovery
of solar cell’s effect by the experimental physicist Edmund Becquerel, many investors
started to invest in the solar energy in its actual form (Jones and Bouamane, 2012).
The excessive use of fossil fuels in the production of energy is affecting our daily life in two
directions. Form the one hand, it is providing us with the luxury life and cover all our need
from energy. On the other hand, the energy production is spoiling our environment and
affecting the earth’s atmosphere. Green gas effect is one of the most important problems
caused by the use of fossil fuels energy. In the last decades, governmental and environmental
organizations announced many alerts to save the environment by reduction of the use of
fossil fuels. Many governments started to work on reducing the environmental effects of
power production by reducing the power demand and finding new clean power resources.
Solar energy is clean, environment friend, renewable, and efficient source of energy. With
the increasing interest of the world population in the renewable energy production, the solar
energy production has witnessed a huge revolution in the last two decades. High efficiency
and low cost solar energy products are being produced nowadays. Many governments offer
financial and technical support for renewable energy projects to decrease the dependency on
fossil fuels. Libya is the second biggest North African country with Middle Eastern sunny
weather. Libya is one of the main sources of oil and natural gas in the Arabic region and the
world. The energy consumption in Libya is increasing every year with high rates. The
electrical energy consumption in Libya has increased from 16 billion kWh in 2000 to 25
billion kWh in 2014. The peak power demand is also increasing yearly forcing planners to
find power sources able to supply the demand. The use of renewable energy resources in
Libya is still timid and needs to be increased to reduce the use of fossil fuels. In 2007, the

2
share of renewable energy resources in the Libyan energy production was estimated by
electric authorities to be 0% (Libya, 2009).
After 2007, the Libyan renewable energy authority was created to establish long term plans
for the investment of renewable energy resources in power production. Since then, many
public and private projects were established for power generation. The scales of these
projects vary from small home projects to large stations. This project will study the power
generation and different parameters of a small size 5kWp power solar system. This system
was installed in Tajoura heart hospital to ensure continuity of energy and to reduce
dependency on the public grid. Production data of approximately one year will be collected,
analysed, and presented to show the efficiency of the system. Some recommendations will
be given based on the studied system and obtained results.
1.1 Aim of the work
The main objectives of this work can be resumed in the next points:
1- To provide theoretical and statistical information about the energy situation in Libya,
the difficulties and problem the energy sector is facing and some solutions.
2- Study and analysis the structures of solar systems, this include the solar cell’s
construction and general model, solar inverters, and batteries.
3- Study the power consumption and solar system requirements of the Tajoura heart
hospital.
4- Collect and analyse the solar system’s data to establish a better idea about the
different parameters of the solar system. Problems related to installation will be
discussed to be taken in consideration in next installations.
5- Compare the obtained results with the results of a similar system installed in the
Turkish Republic of Northern Cyprus.
6- Build a better idea and gain new experiences in the design and analysis of the solar
systems.
3
CHAPTER 2
RENEWABLE ENERGY RESOURCES AND ENERGY SITUATION IN LIBYA
2.1 Energy consumption
Libya is the second biggest North African country with a hundred percent of its area land
area. Figure 2.1 presents the energy consumption in Libya during the years 2000-2014. It
shows the growth in energy consumption and the increasing demand on the electrical power
(Libya Energy, 2015). The consumption in Libya in 2014 passed the limits of the 24 billion
kWh. The energy production in Libya has increased from 16.9 billion kWh in 2000 to 29.7
billion kWh in 2014. Most of the Libyan energy production is achieved by using oil and gas
resources. The share of renewable energy in this production in 2007 is 0%.
The total installed capacity in Libya exceeds the actual load, which means that the country
is able to meet the actual demands. The main problem in the actual situation resides in the
problems of distribution of electrical power especially after the civil war in 2011.
In 2004, local electric distribution company stated that they had 12000 km of high voltage
network; in addition to 12500 km of medium voltage network and 700 km of low voltage
network distributed all around the country. In spite of this huge amount of network
connections, there are a lot of remote areas and villages that are not covered by electrical
power distribution (Saleh, 2006). Over more, the war situation has caused the damage of
different transmission and distribution stations and networks reducing their total capability
to feed the country.
In Libya, the conventional energy sources are limited to two sources (Saleh, 2006).
Oil: with a total discovered estimated resources of about 40 billion barrel.
Natural gas: the total estimated discovered amount is about 1300 billion m3.
Based on different statistics of the average consumption and the existing amounts of oil and
natural gas resources; these resources are going to parish within the next 50 years. It is worth
to mention that the estimated oil barrel price in 2050 was $200; while this price has actually
been reached in the years 2010-2015.

4
Libya’s economic progress is driven by petrol profits. Mainly, oil and natural gas represent
90% of the national income in Libya. Since 1970’s renewable energy has been injected into
the Libyan energy policy. The centre of solar energy research and studies was established
early in the 1970s. Later in 2007, the Libyan renewable energy authority was created. It is
working on structured plans for the use of renewable energy in balance with the traditional
resources (Due-Gundersen, 2013).
Figure 2.1:Electric power consumption in Libya between 2000-2014 (billion kWh)
Due to economic development and investment in the oil and natural gas sectors, the
generation of electricity has doubled from 2000 to 2010. Because the power demands,
growth was higher than the installed generation capacity, electrical tripping occurs
continuously, even before the events of the civil war started in 2011. In 2010, Libya had a
total installed capacity of 6.8GW generated by oil or natural gas power plants. At that time,
99.8% of the Libyan population had access to electric supply with the highest rate in African
countries (Lybia energy situation, 2015).
In order to produce thermal electricity, traditional primary power sources are required. In
Libya these are usually natural gas or petroleum. Producing electricity from Renewable
Energy sources is a different issue; it needs no conventional resources other than the sun,
wind, sea wave, etc. The traditional energy sources that are reserved are an opportunity gain
for the economy of the country and future investment. Taking this into consideration, the
mean fuel rate for producing electricity is 216.1 gm of oil to produce 1kWh in 2008/2009.

5
2.2 Power Resources in Libya
According to (Libya, 2009), the Libyan republic power generation is divided between natural
gas, heavy oil, and light oil resources. The renewable energy dependency in Libya on 2007
was 0%. Looking at Figure 2.2 showing the distribution of electrical generation plan in Libya
2007, it shows that 41% of the power generation was based on natural gas; 26% on heavy
fuel oil; and 33% on light fuel oil. It is remarked that the use of renewable energy resources
was 0%. This can be explained by the fact that Libya is a petrol exporter country with huge
amount of petrol resources and natural gas. The use of renewable energy was – at that time-
more costly and less efficient compared to the available fuel oil.
Figure 2.2 : Power generation plan in Libya 2007 (Libya, 2009)
The same source published the electrical energy consumption statistics for the same year
2007 as shown in Table 2.1.
Table 2.1: Electrical energy consumption in Libya 2007
Category Percentage
Residential 32%
Industrial 10%
Agriculture 14%
Commercial 14%
General services 17%
Street lighting 13%

6
Figure 2.3 : Peak demand progress in Libya between 2003 and 2010
Figure 2.4 : Forecasted electric power demand between the years 2009-2025 in Libya
The evolution in the peak demand of electricity in Libya is shown inFigure 2.3. It shows a
huge change from 3.4MW to approximately 5.8MW. This demand is increasing rapidly and
force planners to issue new plans to cover the increasing demand. The forecasted demand
during the years 2009-2025 is presented in Figure 2.4. The demand is expected to reach the
limit of 14GW by the year 2025 and is increasing linearly (Lybia energy situation, 2015).

7
2.3 Renewable Resources Utilisation in Libya
Libya is an oil exporting country situated in the middle of North Africa region. It has a
population of 6 million habitants distributed over its area of 1.75 million Km2. Renewable
energy resources in the Libyan republic are mainly the solar energy and wind energy. The
weather in Libya is Middle Eastern with long sunny days during spring, summer and autumn,
And cold cloudy rainy in winter. Libya has a coast line of about 2000 km on the
Mediterranean. Its population in 2007 was about 6 million, and its main resources are petrol
and natural gas. Its daily average of irradiation in a horizontal plan is 7.1 (kWh/m2/day) in
the coastal regions in the summer. This average increases to reach the level of 8.1
(kWh/m2/day) in the southern parts of the country. The average sun hours is about 3500
(hours/year) with a daily average of approximately (9-9.5 hours/day). Figure below shows
the solar irradiation availability in Libya; as it is clear in the figure that the southern parts
are receiving more irradiation compared to the coastal regions. However, all the area of the
country is very well irradiated and reflects an excellent solar power generation possibilities
(Saleh, 2006).
Figure 2.5 : The map of solar irradiation in Libya
Wind power presents the second renewable energy source in Libya; the average wind speed
in Libya is over 6m/s. Libya has an attractive wind profile even under the conditions of
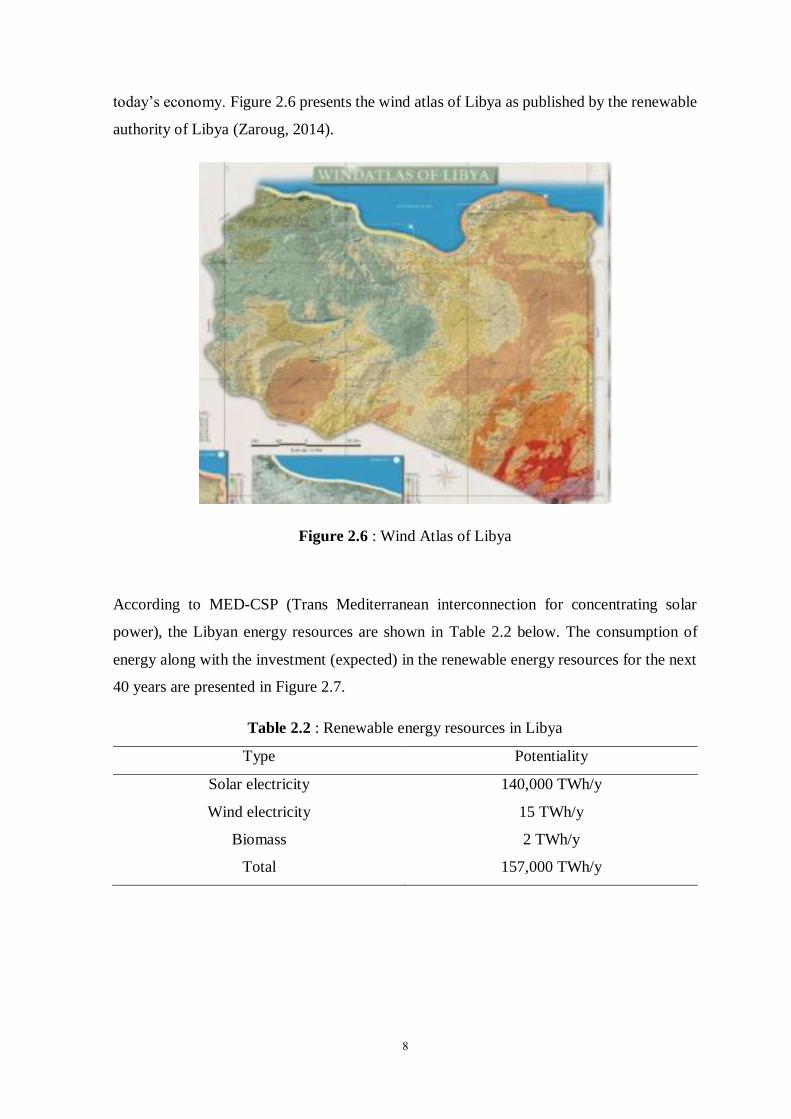
8
today’s economy. Figure 2.6 presents the wind atlas of Libya as published by the renewable
authority of Libya (Zaroug, 2014).
Figure 2.6 : Wind Atlas of Libya
According to MED-CSP (Trans Mediterranean interconnection for concentrating solar
power), the Libyan energy resources are shown in Table 2.2 below. The consumption of
energy along with the investment (expected) in the renewable energy resources for the next
40 years are presented in Figure 2.7.
Table 2.2 : Renewable energy resources in Libya
Type Potentiality
Solar electricity 140,000 TWh/y
Wind electricity 15 TWh/y
Biomass 2 TWh/y
Total 157,000 TWh/y

9
Figure 2.7 : Expected consumption and renewable energy investment in Libya until 2050
Despite the richness of Libyan republic with renewable energy resources, it is obvious that
the usage of these resources was negligible. In the period between 2000 and 2010 different
steps have been taken to increase the renewable energy resources investment in Libya;
especially to supply the rural regions with electricity. Statistics are showing the
implementation of about 300 different systems with total power generation of 210kW in the
rural regions as shown in Figure 2.8 (Libya, 2009).
Figure 2.8 : Rural solar energy generation plan and solar systems before 2007
Until 2013, the investment of renewable energy was concentrated on solar energy. The
investment is distributed between different PV solar sectors like rural electrification, water

10
pumping and communication networks. Table 2.3 shows the investments in renewable
energy resources in Libya until the year 2013 (Zaroug, 2014).
Table 2.3 : Renewable energy resources investment in Libya until 2013
Parameter Type MW
Wind 0
PV
Centralized systems 0.11
PV for rural electrification 0.725
Water pumping 0.12
Communication networks 2.81
Roof top systems 0.03
Street lighting PV systems 1.125
CSP 0
Hydro 0
Total renewable 5
2.4 History of Solar Energy
The idea of collecting the power of the sun for the use of humans is not a new idea. Sun has
been used as the source of light and heat since the first days of humanity on earth. In the 5th
century B.C., the ancient Greeks were designing their houses to attract the sun’s heat in the
winter. Later, the Romans introduced new improvements on solar architecture by covering
southern windows by materials like mica or glass, that prevent the radiation of heat collected
during the day. In the 1760s, the Swiss scientist Horace de Saussure constructed an insulated
glass covered box that became the prototype for solar water heaters (Jones & Bouamane,
2012).
The basis of the actual solar energy technologies were established in the 19th century by
European and American investors and researchers. The French experimental physicist
Edmund Becquerel discovered the photovoltaic effect while working on some electrolytic
cells. He noticed that some materials produce small amounts of electric current if subjected
to the sun light (Jones & Bouamane, 2012). On the other hand, the French mathematician
August Mouchet invented a steam engine powered by the sun energy in 1878. He used
parabolic collector dish to collect the sun shines and focus it to power the steam engine. In

11
1890s different types of solar water heaters were invented and presented by scientists. In the
50s and 60s of the 20th century, solar PV systems started to be used in providing satellite
systems with the required energy for their functions. Since then, the development of solar
energy systems has witnessed huge revolutions until it reached its actual modern form.
Nowadays, solar energy systems are improved and have different shapes and characteristics.
Different companies are developing high quality solar power products around the world. The
main investment in the development of solar energy equipments is in producing higher
efficiency PV panels. The efficiency of power PV panels range between 15-23%. Different
laboratories are working on increasing this efficiency to over than 30% or even more.
2.5 Photovoltaic energy in Libya
The plans of a Libyan renewable energy sector are not recent. However, Libya’s dependence
on hydrocarbons has increased due to damaged equipment in the war in 2011. Media and
governmental associations have neglected the dialogue of renewable energy in the analysis
of the future of Libyan energy sector. They relied mainly on the hydrocarbon products.
However, Libya is now in the race of implementing renewable energy sectors to support the
traditional energy production. The potential for Libya must still be considered within the
context of security conditions and political issues. Furthermore, oil industry must take in
consideration the actual situation in consideration. The requirements are increasing to the oil
firms to increase the investment in renewable energy development in Libya (Due-
Gundersen, 2013).
A plan was launched during the Gaddafi era, including solar and wind energy power
generation. It had a main focus on solar energy as the Libyan climate is sunny and has
excellent irradiation levels all around the year. In 2007, the Green Mountain Project outlined
a framework for the creation of a green village to preserve Roman history and allow the self
sustainability through the use of renewable energy resources (Due-Gundersen, 2013).
There are different projects in Libya that are in operation actually, these projects differ from
centralized projects, water pumping, and communication systems. The Table 2.4 presents
the different installed PV projects and their total capacities in the year 2014 (Zaroug, 2014).
This table shows that the communication systems and mobile phones share the main part of
PV investment until 2014. Street lighting also has other main part of PV investment. Small
scale projects investment is still the minimum and the total installed power is 42kW.

12
However, new large scale projects are in the phase of construction in Libya. Hun power plant
is a 14 MW capacity plant that is being constructed. It’s a public project developed to support
the national electrical grid in Libya. Table 2.5 shows the planned and under construction
renewable energy investments in Libya. Figure 2.9 shows the expected renewable energy
production percentage of total power production in Libya until 2025. It is expected according
to the Libyan renewable energy authority that 10% of power production in Libya will be
relied on renewable energy (Zaroug, 2014).
Table 2.4 : Different PV projects in Libya (2014)
Project Type Capacity
Wadi Marsit Centralized PV system 67.2kW
PV water pumping system Water pumping 120kW
Communication repeater
stations
Communication 950kW
Grid connected small scale
projects
Grid tied 42kW
Rural electrification Rural 725kW
Street lighting 15systems*75kW
Mobile phones 1859kW
Table 2.5 : Renewable energy investments in Libya
Project Type Size
Hun power plant PV 14MW
Dernah wind farm wind 60MW
Almagroun 1 farm wind 120MW
Almagroun 2 farm wind 120MW
Sobha PV powe rplant PV 40MW
Ghat PV power plant PV 15MW
Shahat power plant PV 50MW
PV roof top systems PV 3MW
Rural electrification PV 2MW

13
The target production of each type of renewable energy resources is shown in Table 2.6. A
total of 2219 MW is targeted to be produces using wind, solar, and CSP energy sources by
2025.
Table 2.6: Target renewable energy production until 2025 in Libya
RE-Targets (MW Installed Capacity)
Wind PV CSP Total Target Date
260 129 0 389 2015
600 344 125 1069 2020
1000 844 375 2219 2025
Figure 2.9 : Renewable energy percentage in the production map of Libya until 2025
2.6 Energy in TRNC
Electrical energy in the Turkish Republic of Northern Cyprus is provided by the electric
generation company that is owned by government. The main source is composed of 2 gas
turbines of 60 MW each. Small support generators are used to meet the demand at the peak
time (Ibrahim & Altunc, 2012). Cyprus is the largest Island in the Mediterranean after Sicily
and Sardinia. The climate of Cyprus is Mediterranean hot and dry during summer days;
humid during nights. Its winter is warm and rainy. The average solar irradiation is estimated
from historical data by 3 kWh/m2 during winter and 7 kWh/m2 during summer months

14
(Ibrahim & Altunc, 2012). The wind speed in Cyprus is generally about 6 m/s. In some few
areas this speed increases to reach 6.5-7 m/s. Based on some research it was estimated that
the island of Cyprus is able to generate approximately 150-250 MW using wind power.
According to the same estimations, the Northern Cyprus can share with one quarter of this
energy. Figure 2.10 shows an old wind turbine that has been installed in Famagusta and still
working yet (Biricik, 2014). Table 2.7 presents data about the solar irradiation and wind
speed in TRNC obtained from the METU Renewable Energy Design and Applications
Research (REDAR, 2016). The Middle East Technical University-TRNC Campus has
installed a solar power station of 1 MW capacity (Oner, 2016). Figure 2.11 shows the upper
view of the station after the installation.
Table 2.7: Average solar irradiation and wind speed at different altitudes in TRNC
Month Wind speed
(@60m) m/s
Wind Speed
(@50m) m/s
Wind Speed
(@30m) m/s
Temp.
degree
Solar
Irradiation
kWh/m2
3/2013 6.44 6.08 5.51 14.08 5.02
4/2013 5.04 4.74 4.37 17.29 6.30
5/2013 4.39 4.16 3.39 22.20 6.77
6/2013 5.56 5.20 4.78 24.73 8.31
7/2013 4.58 4.32 3.97 27.08 8.30
8/2013 4.53 4.24 3.89 27.85 7.41
9/2013 4.78 4.47 4.11 24.54 6.34
10/2013 3.71 3.39 3.00 23.22 4.99
11/2013 5.15 4.92 4.48 13.12 2.82
12/2013 5.26 5.05 4.61 11.05 2.47
1/2014 4.33 4.10 3.69 12.38 2.74
2/2014 4.10 3,93 3.60 12.12 4.10
Figure 2.10: Old wind turbine that is still in use in Famagusta (Biricik, 2014)

15
Figure 2.11: METU solar power generation station (Oner, 2016)
2.7 Development of PV Technologies
Solar PV was implemented firstly in satellite systems in the early 1950s. They were used to
provide energy to the satellites. In the 70s and 80s of the last century, PV technology started
to penetrate the rural areas as a source of power. The prices of PV systems were still high
and the usage is restricted for areas where local electrical grids are difficult to reach. Beyond
the 1990s and with the revolution in computerized systems and semiconductor technologies;
the production of PV systems took another curve and started to be easier and less costly
(IEA, 2009). The figure shows an approximately exponential increase in the installation of
PV systems in the countries of International Energy Agency (IEA) between the years 1992-
2009.
Figure 2.12 : Installed solar PV capacity in the OECD countries 1992-2009

16
Figure 2.13 : Installed PV capacities between the years 2000 until 2013
Figure 2.13 present the evolution of solar PV installation between the years 2000 and 2013
in the IEA and non IEA countries as reported by IEA in 2014 (IEA, 2014). Different
countries are working on increasing their investments in solar energy especially in the
Middle East and Africa. Investing in rural electrification in these countries is very important
to improve social services in rural houses, health centres, farms, water pumps, and small
businesses. The electrification of these areas is very important to the local economies of
these countries and help in improving life conditions of poorer areas. PV systems became an
important player in the rural electrification due to the significant cost reduction and improved
efficiency compared to the expansion of distribution grids to cover less populated areas.
Solar PV energy could be considered as a main force for the development of rural areas. As
an example, in Senegal PV rural electrification is very well known and has started an
important solar energy program 50 years ago. It has a huge potential of solar energy and still
they are working on electrification of wild areas (Admasu, 2010). Solar PV technology is
still relatively costly but it is a best choice for rural areas. The prices of solar energy are
decreasing annually with the development of new production technologies.

17
2.8 Forms of Photovoltaic Systems
Photovoltaic systems can be found in three main forms: stand-alone systems, grid connected
systems, and hybrid systems. Stand-alone systems are totally autonomous and employ
battery storage banks to store the energy during the day light. The stored energy is then used
during night where no power generation is available. This type of systems is one of the old
types that have been used. Its main advantage is in that it need no other power sources and
can work as a full generating system. One of its drawbacks is the need for expensive storage
batteries and its limited ability to store energy for many days in case of clouds and rainy
weather. The grid connected systems are another form of solar systems that can be connected
through suitable power electronic converters to the existing electric grid. It has the ability to
inject the solar power generated by the PV panels into public or local grids directly without
the need for storage batteries. The hybrid system is a combination of the grid connection and
battery back up in cases where the grid is absent for any reason.
2.8.1 Stand Alone Systems
This type of systems is the preferred for the rural areas where the public network can’t be
accessed. It is constructed using PV panels, back up batteries, charge controllers, and power
inverters. During the day light when the sun is available the PV panels produce electricity
that is stored to the batteries using special charge devices. Whenever there is need for energy,
it is taken directly from the batteries using the power inverters that convert DC battery power
to AC easy to use power. In the night when the sun is absent, the batteries are designed to
supply the electrical power needs of the client (Pickard, 2008).
Figure 2.14 : Typical stand-alone solar (Pickard, 2008)

18
2.8.2 Grid connected (tied) systems
This is recently the most used systems in the areas covered by electric grid. It is considered
low cost and more efficient than the standalone systems in the condition where a main power
source exists. It is considered the simplest and most cost effective type of solar energy
systems. There is no need for batteries to store excess generated power. Instead, the electrical
utility stores the excess energy in the so called net metering system based on the local tariffs.
The DC current produced by the PV panels is converted to AC power using the inverter. The
output of the inverter is connected directly to the distribution board. While the system is
generating energy, needs are being supplied by the system within its capacity. Extra power
is directed to the public utility by the inverter. Whenever the needs exceed the capacity of
the PV system, this energy is absorbed from the public grid. A net metering system is used
to measure the power being absorbed from or injected to the utility (Pickard, 2008).
Figure 2.15 : Typical grid tied solar system
2.8.3 Hybrid systems
Hybrid systems are systems that combine the advantages of both stand-alone and grid
connected topologies. This system relies on the coordination of multiple controllers to
monitor the flow of power from PV panels and control the power to fulfil the needs of the
structure. The equipments consist of PV panels, wind turbines, fuel generator, batteries,

19
Figure 2.16 : Hybrid system structure and equipments
Maximum power tracking devices, inverters, wind controllers, and the public utility grids.
All these power sources are combined together based on special algorithms to ensure
continuity of the electrical power. The charge controller observes the backup batteries and
decides whether or not to charge them. The inverter synchronizes with the power grid and
observes the grid to for any losses in power. This system is considered as a UPS that can
provide electricity even when the power grid is out of service (Bollinger, 2007). This system
is the most expensive that needs service and periodic replacement of batteries. It is limited
to industrial and critical applications where no trip in power supply is acceptable like
hospitals, TV and radio broadcasting stations, and some special industries.
2.9 Photovoltaic technology
Photovoltaic or solar cells are constructed of semiconductor materials that are able of
generating DC current if exposed to sunshine. Each solar cell is generally few centimetres
in size. The first actual solar cell was manufactured in Bell laboratories in 1954. The
efficiency of this cell was approximately 5% (EL-Moghany, 2011). Although the cost of
earlier solar cells was very expensive; it was not a problem as they were intended for space
applications. The efficiency of manufactured solar generators has risen since its invention.
In our days, the solar cells’ efficiency is about 15-22% with low prices. Solar cells are
produced in such a way to ensure the high efficiency and simplicity of use of produced
power. The power generated by solar semiconductors is a function of different such as the
intensity of illumination and the temperature.
A solar cell is mainly produced of doped p-n junction of two silicon layers. The n layer
contains an extra electron in the valence layer while in the p layer it contains a positive

20
charge due to the lack of one valence electron. When the two layers are joined, the electrons
travel from one layer to the other; this travel of electrons creates the flow of electric current.
2.9.1 Equivalent circuit of a solar cell
A solar cell can be mathematically modelled to simplify its theoretical function principle.
Figure 2.17 shows the simplified equivalent circuit of a solar cell. The relation between
current and voltage of a solar cell can be given by:
( )
0 (e 1)sq V IR
snkTL
sh
V IRI I I
R
(2.1)
LI dID shR
sR
v
Figure 2.17 : Simplified model of a solar panel
Solar panel is composed of series parallel combination of multiple solar cells to produce the
required commercial voltage and current levels. There are different types of commercial
solar panels such as mono crystalline PV which has an approximate efficiency of 22.5%,
poly crystalline cells with an efficiency of about 19%, and thin film PV panels with
efficiency of up to 15%. It is worth to mention that mono-crystalline panels are the most
expensive type of solar panels because they need special technologies for their production.

21
CHAPTER 3
ELEMENTS OF SOLAR SYSTEM
Photovoltaic cells generate electrical energy from the light of the sun. They have the ability
to convert directly the solar irradiation into electrical current that flows through conductors
to electric loads. The solar cells are constructed from semiconductors that catch the energy
of light photons to release some of its electrons to move freely in the material. Generally,
there are different types of solar cells in the market nowadays. These types differ in size,
production technologies, power, efficiency, flexibility, and other characteristics.
3.1 PV cell
PV cell generates electrical current when it is illuminated from any source of light. PV cell
include a junction that separates two different materials. A built in electric field exists in the
two materials. The fall of light photons with energy greater than the energy of the band gap
of the semiconductor material encourage electrons to move from the valence band to the
conduction band. This process creates hole-electron pairs through the illuminated parts of
the materials (Dzimano, 2008). The electrons and holes will flow through the junction in
opposite directions causing the flow of electrical current. The flow of electrons and holes
varies dependent mainly on the intensity of light falling on the surface of the semiconductor.
Figure 3.1: The general structure of the PV cell
Most manufacturers of photovoltaic generators use silicone semiconductor in the production
of their PV cells. There are mainly mono-crystalline silicone PV cells and polycrystalline

22
silicone cells. These two types differ in their efficiency and production complexity. The PV
cell is produced generally in square pieces of 10cm of dimension. These pieces are connected
in series and parallel to suit the industrial and commercial needs of solar energy clients. The
series connection of multiple PV cells produces higher voltage out from them while the
parallel connection provides higher currents under the same individual voltage.
3.1.1 Equivalent circuit of the solar cell
The models of solar cells are built to simplify the study of behaviours of solar cells and
enhance their functionality. It aims also to predict the generated power out from the solar
cell prior to its practical installation in different sites. The models are built based on different
experiments and calculations to find the different parameters of the solar cell and implement
these parameters on digital computers. The huge revolution in digital computing systems has
improved the possibilities of simulating different complex systems. It helps to predict their
behaviours without the need to install them physically. There are two basic models for the
solar cell that are generally used in literary. These are:
3.1.1.1 Single diode simple solar cell model
The equivalent circuit diagram of this model is presented in Figure 3.2. It consists of a DC
constant source of current; this current source is parallel connected with a diode. This model
takes in consideration the losses due to the internal series resistor. This model has a relatively
acceptable precision and can be considered as a good model due to its simplicity. The current
generated by the solar cell in this model is defined by:
0 ( 1)
s
t
V R I
V
phI I I e
(3.1)
Where the thermal voltage of the diode is defined by:
s st
n AkTV
q (3.2)

23
phIdID
sR
v
Ideal cell
Real cell
I
Figure 3.2: Single diode simple model of solar cell
3.1.1.2 Single diode detailed model
The equivalent circuit of this model is presented in Figure 3.3. This model takes into
consideration the losses due to the leakage currents in the solar module. These leakage
currents are caused by impurities and imperfections in the crystal. Some leakages occur also
in the junction of the solar cell also (Dzimano, 2008) (Liedholm, 2010). The addition of the
shunt resistor implies the use of an additional term to describe the current generated by this
model (EL-Moghany, 2011).
0 ( 1)
s
t
V R I
V sph
sh
V IRI I I e
R
(3.3)
phIdID shR
sR
v
Ideal cell
Real cell
I
Figure 3.3: Single diode detailed model of the solar cell or module

24
3.1.1.3 The double diode model of the solar cell
In this model, a second parallel diode is considered to take in consideration the carrier
recombination losses. The equivalent circuit of this model is presented in Figure 3.4. The
output current of the module is given by:
phI
1dI
1D shR
sR
V
Solar cell
I
2dI
2D
Figure 3.4: Double diode model equivalent circuit of solar cell
2
01 02( 1) ( 1)
s s
t t
V R I V R I
V V sph
sh
V IRI I I e I e
R
(3.4)
The three previously mentioned models are all suitable approaches for the description of the
function of the solar cell under different conditions. The difference in the accuracy of each
model is not that much affecting the results of modelling.
3.2 Open circuit voltage and short circuit current
While studying the function of the solar cell, two important notations must be taken in
consideration. These are the open circuit voltage and the short circuit current notation. At
these two points of the V-I curve of a solar module the generated power is equal to zero. The
open circuit voltage Voc can be extracted from the equation of the module current when the
current is zero. The short circuit current is found when the voltage across the two ends of the
module is zero (Morales, 2010).
0
ln( 1)phs
oc
In AkTV
q I (3.5)

25
sc phI I (3.6)
The curve that describes the relation between generated voltage and delivered current of a
solar module is shown in Figure 3.5. By multiplying the voltage and current value of each
point at the curve we can find the power generated at each value of the current and voltage.
Figure 3.5: I-V versus P-V curve of the solar module under standard conditions
Figure 3.5 shows that the power generated by a solar module or solar cell is not constant
even under the standard conditions. It is obvious that the generated power is totally
dependent on the output voltage of the solar cell. Increasing the output voltage of the solar
module increases the power generated by the cell under the same conditions. This increase
reaches a peak value beyond which no more power can be developed by the solar generator.
This peak is known in the solar applications by the convention of maximum power point. It
is to notice that the solar generators can be forced to generate the maximum possible power
by using special techniques. These techniques are going to be discussed later while speaking
about power inverters.
3.3 Effects of temperature and irradiance variation
Manufacturers of the solar energy generators usually provide datasheets describing the
function of their solar products. These datasheets contain information about the different
laboratory tests results and conditions under which their products were evaluated. Most of
manufacturers apply their main tests in laboratories under the standard test conditions
abbreviated STC. The STC represents the room temperature 25 Celsius, under 1 atmospheric

26
pressure and 1000w/squared meter of irradiance. Using the equations mentioned above, the
next figures describe the relation between irradiation, temperature, voltage and current of a
solar cell. Figure 3. presents the relation between the voltage and current generated by solar
module under different temperature values. Figure 3.7 shows the voltage current
combinations generated by the solar cell under different irradiation levels. As these figures
show, the irradiation levels affect the generated current from the solar cell. Decreased
irradiation or shadowed solar cells cause significant degradation in the generated current.
The temperature in general doesn’t affect too much the generated current from the cell or
group of cells. However, the increasing ambient temperature decreases the output voltage of
the solar cell and module. The power generated by the solar generator decreases slightly with
the increase of the cells’ temperature as depicted in Figure 3.. However, the decrease in the
irradiance degrades significantly the amount of the generated power and decreases the peak
power value. The open circuit voltage of the cell can be given under different temperatures
by (Morales, 2010):
( ) ( 273.15)STC
oc oc vV T V k T (3.7)
vk is a negative constant describing the change in generated voltage per one unit of
temperature compared to the standard 25 degrees.
Figure 3.6: I-V curve of the solar module under different temperatures (Irradiation
=1000W/m2)

27
Figure 3.7: I-V curve of a solar cell under different irradiation levels (T= 25 C)
3.4 Photovoltaic array
Technical and commercial limitations prevent the production of large solar cells. However,
electrical systems need to be equipped with large power and different voltage levels for
obtaining better performance. In order to fit the commercial needs of the market and the
technical possibilities, producers of solar energy equipments use small power, and voltage
cells to build bigger arrays. Solar cells are connected in series and parallel combinations to
produce higher voltage levels and more power. When solar modules are fixed together in a
single mount, they are called panel. The use of multiple panels is called solar array. Multiple
arrays can be connected in series or parallel as required to increase the voltage and power
generation. As in other electric sources and batteries, in series connection the voltages sums
up while the current keeps constant. In the parallel connection of the solar cells, the generated
voltage is fixed while the current is a multiple of the individual cells current. Figure 3.
explains the relation between solar cell, module and array structures (Idris, 2013). It is
important to mention here that there are different connection topologies in solar systems to
achieve better efficiency under different conditions of irradiation. These are the total cross
tied (TCT) connection, the series parallel (SP) connection, bridge linked (BL) connection,
and Honey comb (HC) connection (Shams El-Dein, 2012). Figure 3.2 presents the
schematics of each one of these topologies.

28
Figure 3.8: Solar cell, module, and array structure
Figure 3.2: a- SP, b- TCT, c- BL, and d- HC connections of solar arrays
3.5 Effect of shading on the solar cells and partial shading
Shading of photovoltaic cells or arrays is one of the dominant problems in small size solar
systems. Partial shading of the module will cause the shaded cells to heat up and reduce their
power. They start to act like electrical loads instead of generating electricity. The shaded
cells prevent the flow of full current provided by other cells connected in series. This can
reduce largely the power generation of the system. Partial shading of solar systems can
destroy the shaded cells or modules. It has a serious influence on the module output power.
For a typical series module, completely shading one cell can decrease the generated power

29
by approximately 80% (Idris, 2013). Figure 3.10 shows the curves of a solar cell under
shading conditions, it is clear that the generated current is less than the normal conditions.
Figure 3.10: The effect of shading on the cells I-V curve
3.6 Balance of the system
PV modules are integrated into systems to accomplish special tasks. Solar systems are
designed for specific tasks. The balance of system is the group of all components of the solar
system that are used to construct that system. There are mainly four main categories that
enter in the construction of solar systems.
3.6.1 Batteries
Batteries are the main storage elements in the solar systems. They are used to store excess
energy produced by the solar system. The stored energy in the batteries can be used when
there is no energy production by the system. In some systems where the produced energy is
less than the needs; other sources of energy like diesel generators can be used intermittently.
The capacity of batteries is measured in Ampere hour unit.
Batteries are electrochemical devices that have high sensitivity to the atmospheric conditions
like temperature and humidity. The life span of the battery is also a function of the
charging/discharging cycle. The faster the charge and discharge process happens the shorter
the life of the battery is. Manufacturers generally use the term CN where N is a number

30
describing the discharge time of the battery in hours. This term shows the life of the battery
under different discharging rates (Bringing Solar Energy Down to Earth, 2016).
Another important term that affects the life of a solar battery is the depth of discharge DOD.
The DOD is given in percentage of the battery full capacity and shows the amount of energy
being extracted from the battery (Team, 2008). Most batteries chemical components change
as they charge and discharge. This gradually reduces their energy storage ability (Martin,
2015). Depth of discharge is a critical factor that can decide the life of a battery as a storage
element. The bigger the depth of discharge the lower is the life of the battery. This is the
reason why the life cycle of the battery is always combined with the DOD. As an example a
battery can have a life of 10000 cycles at 20% DOD; whereas this life cycle reduces to 1000
cycles at 80% DOD.
3.6.1.1 Chemistry of batteries
Different types of batteries can be produced by combining different chemical materials
together. Some combinations are not expensive but not efficient also. They produce less
energy than other costly combinations. Lead acid batteries offer a good balance between cost
and power capability. They are common used in solar system applications to store energy
(Bringing Solar Energy Down to Earth, 2016). Other batteries like nickel-Cadmium batteries
may be used but still the lead acid batteries are considered the best and most famous choice.
3.6.1.2 Lead acid batteries
The lead-acid type battery is constructed from lead plates. These plates are positive and
negative of different compositions. They are drowning in an electrolytic solution of sulphuric
acid. When the battery is discharged, sulphur molecules releases electrons and attach to the
lead plates. When the battery recharges, excess electrons flow back to the electrolytic acid.
The battery develops electrical difference in potential as a result of this electrochemical
reaction. If given a path, the electrons flow through the path creating the electric current. By
applying a positive voltage between the poles of the battery, the electrons are forced back to
the electrolytic acid. In a standard lead acid battery, the average voltage is about 2 volts per
cell regardless the size of the cell. Electric current flows from the battery when there is a
circuit between its terminals. This happens when any electrical load that needs electricity is
connected to the battery.

31
Figure 3.3: Chemical status of the acids and plates in a battery
3.6.2 Battery chargers
These are special power electronic circuits used to convert either AC power into DC power
suitable to charge the batteries; or they are used to convert DC power from level to another
level that can be fed to battery during the charging phase. Generally, the converter from AC
power to DC power is known as rectifier. The converter that can extract DC power from the
solar cell and feed it to the battery can be either a buck or boost converter. The buck converter
converts DC voltage from higher to lower level. Boost converter converts the DC voltage
from lower level to a higher level (Rashid, 2001). New battery chargers are supplied with
maximum power point tracking capability to extract the maximum power under all
conditions. Figure 3.12 shows one commercial solar battery charger.
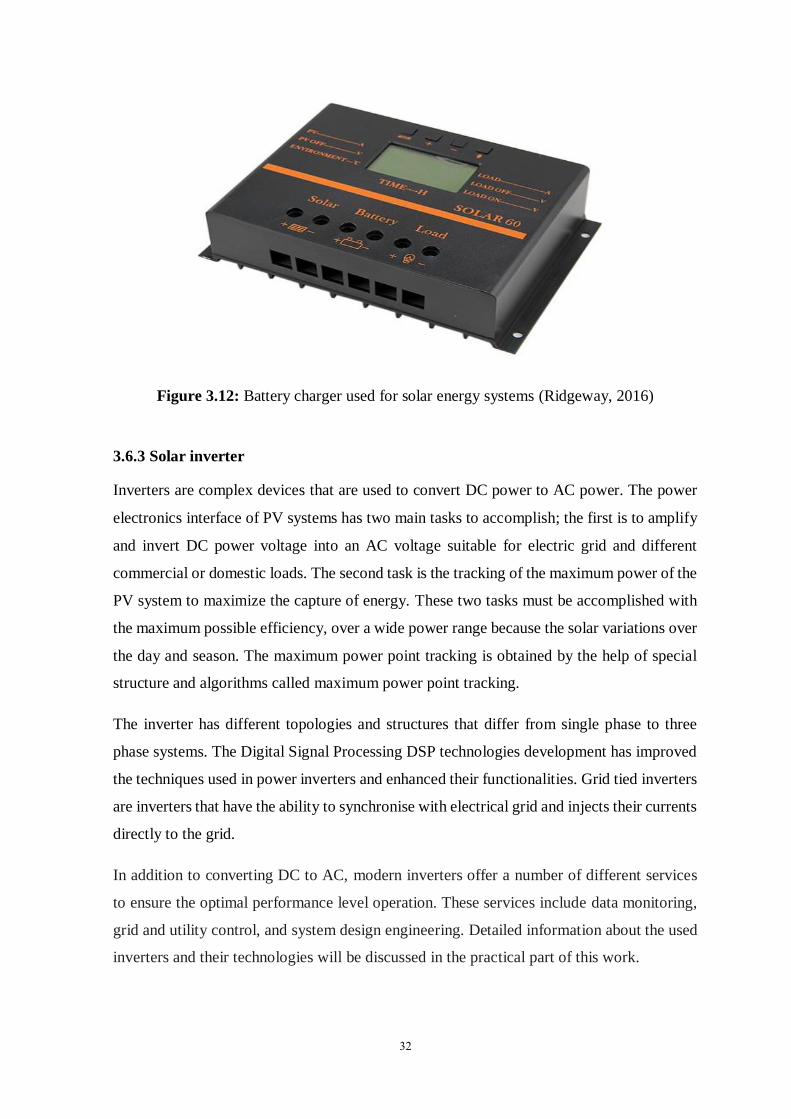
32
Figure 3.12: Battery charger used for solar energy systems (Ridgeway, 2016)
3.6.3 Solar inverter
Inverters are complex devices that are used to convert DC power to AC power. The power
electronics interface of PV systems has two main tasks to accomplish; the first is to amplify
and invert DC power voltage into an AC voltage suitable for electric grid and different
commercial or domestic loads. The second task is the tracking of the maximum power of the
PV system to maximize the capture of energy. These two tasks must be accomplished with
the maximum possible efficiency, over a wide power range because the solar variations over
the day and season. The maximum power point tracking is obtained by the help of special
structure and algorithms called maximum power point tracking.
The inverter has different topologies and structures that differ from single phase to three
phase systems. The Digital Signal Processing DSP technologies development has improved
the techniques used in power inverters and enhanced their functionalities. Grid tied inverters
are inverters that have the ability to synchronise with electrical grid and injects their currents
directly to the grid.
In addition to converting DC to AC, modern inverters offer a number of different services
to ensure the optimal performance level operation. These services include data monitoring,
grid and utility control, and system design engineering. Detailed information about the used
inverters and their technologies will be discussed in the practical part of this work.

33
CHAPTER 4
TAJOURA HOSPITAL SOLAR SYSTEM
This chapter will discuss the position, contents, power needs and characteristics of the
alternative power system’s elements. I was one of the team members who were in charge of
data collection about the hospital’s energy consumption and the design of a suitable solar
power system for the ICU unit. I was responsible for executing all required calculations of
the required energy and sizing of the solar system. Appendices contain certifications that
ensure my rule and position in the company that was responsible for the system. More details
about the system will be presented in this chapter.
The study will be restricted on the intensive care unit (ICU) of the hospital because of its
vital rule. Alternative power source that is able to ensure power continuity all over the time
is indispensable for the ICU of any hospital. In Most of cases, uninterruptible power supply
(UPS) systems are used for this purpose in vital sections of buildings like ICU in hospitals,
broadcasting units in TV and radio stations, and communication towers. The UPS system is
able to provide electricity for short periods of times that can extend to few hours.
In some cases where the electrical energy interrupts are likely to happen for long duration
like the case in Libya the last few years; a special auxiliary power source is essential to be
available and accessible all the time. This system can be either a power diesel generator or a
renewable solar or wind source. In our case, the diesel generator was not the best choice
because of the political and security situation of Libya, however, the solar source is seen as
the best choice from different points of view:
Firstly, the solar energy is available daily all over the year regardless the political and
security situation of the country.
Secondly, solar energy is clean and cost effective compared to the costs of auxiliary
generator.
Finally, the use of solar energy alternative is a one step in the new international and national
energy policies that encourage the use of alternative energy sources, to reduce the
dependency on traditional energy sources and to reduce the emission of greenhouse gases.

34
4.1 Tajoura Heart Hospital
Tajoura is a town in the north west of Libya, on the Mediterranean coast 14 km away from
Tripoli. Tajoura heart centre is a small hospital specialized in the cure of heart diseases. The
ICU of the heart hospital consists of two wards, the first is in the ground floor and the second
is directly above it in the first floor. The ward of the ground floor consists of three four bed
rooms. The first floor ward is a large open ward that contains 8 beds. The total capacity of
ICU is 20 beds. The ICU is supplied by a 3 phase 60 kVA UPS. The UPS is shared with the
other parts of the centre.
Figure 4.1: Upper view of the site of Tajoura Heart Centre, Libya (Wikimapia, 2016)
The UPS system is old and its batteries are dead, they can just supply the centre with power
for few minutes after the tripping down of public grid. In order to determine the required
photovoltaic system need for the ICU, a survey of the load was established for the period of
13 days. A power meter was fixed separately to measure the power supplied to one of the
rooms of the ground floor. The load profile of the measured power is shown in the next
figure.

35
Figure 4.2: Load profile of one room (4 beds) of the ICU
The acquired data is arranged in Table 4.1 showing the load profile of one part of the ICU.
As seen from the table, during the 13 days of the survey the consumed energy by the four
beds was 109.67 kWh. This means an average daily consumption of 8.44 kWh (for the 4
beds in the survey). By dividing the daily consumption by 24 hours, the hourly average
consumption is found to be 0.355 kWh. From this information and by dividing this value by
the number of beds the average energy consumption of each bed is found to be 0.0879 kWh.
The peak power flow for the four beds as illustrated in figure 4.2 is about 1.33 kW. Based
on the results of calculation, total predicted consumption is calculated in Table 4.2. An
assumption of continuous 25% of the full load was made in the calculation for worst cases,
while the rest of beds are considered to consume the average power all time. This means that
each one of the 5 beds will absorb 150 W continuously. The other 15 beds are assumed to
absorb 87.9 watt each in continuous mode. Based on these assumptions, the total system of
20 beds will consume the amount of 49.66 kWh daily. The solar system must be designed to
compensate for this amount of energy consumption.
Table 4.1: Partial ward measured load parameters during survey
Partial ward (measured values – 4 beds)
Voltage (v) 200 Average consumption (kWh) 0.355
Number of beds 4 Max. cont. demand 0.5
Time of survey (days) 12.99 Peak power (kW) 1.33
Total consumption
(kWh)
109.673 Average bed energy (Wh) 87.9
Daily consumption
(kWh)
8.443 Max. cont. bed demand (W) 150

36
Table 4.2: Calculated load of the ICU based on measured values
Full ICU calculated power
No. Of beds 20 Daily energy cons. (kWh/day) 49
Average energy/day
(kWh/d)
42.216 Peak power (kW) 4
Worst case (of all beds) 20*25%=5
4.2 Solar power systems specifications
4.2.1 Peak sun hours
The term peak sun hours is referred to the average daily solar irradiation or production in
kWh/m2/day. It shows the solar power a specific location would receive if the sun was
shining its maximum value for a number of hours. As the peak irradiation is 1 kW/m2, the
peak sun hour is same as the average sun irradiation. Figure 4.3 shows and explains the idea
of sun peak hour (Bowden & Honsberg, 2014). The areas under the two curves are identical
where as in the left curve the time of insolation extends for more hours with variable
irradiation levels. The right part of the figure shows the total number of hours to generate
same power under constant irradiation of 1 kW/m2.
Figure 4.3: Sun peak hour term (Bowden & Honsberg, 2014)
The Table 4.3 presents the monthly average sun peak hour in Libya-Tripoli (Tukiainen,
2016). The average annual sun peak hour from the table is 5.54 kWh/m2/day.

37
Table 4.3: The sun peak hour, temperature, and wind speed data in Tripoli, Libya
Variable/ Month I II III IV V VI VII VIII IX X XI XII
SPH (kWh/m²/day) 2.96 4.11 5.30 6.60 7.35 8.05 8.20 7.51 5.98 4.51 3.24 2.63
Clearness, 0 - 1 0.56 0.62 0.63 0.66 0.67 0.70 0.73 0.72 0.66 0.62 0.57 0.53
Temperature, °C 15.98 15.3
8
15.7
8
17.0
7
19.7
5
22.5
4
25.1
2
26.5
5
25.6
0
23.7
8
20.9
2
17.7
3
Wind speed, m/s 6.34 6.43 6.44 6.31 6.39 6.34 5.22 5.38 5.51 5.63 5.84 6.18
Precipitation, mm 54 30 28 16 3 1 0 0 12 44 43 53
Wet days, d 8.2 5.3 4.2 2.0 1.8 0.5 0.2 0.2 1.2 3.9 5.8 7.9
Based on the measurements and calculations shown above in this chapter, and taking in
consideration the next features for the solution:
1- The maximum load is 20 beds among which 5 beds operating at emergency peak.
Maximum daily energy consumption is 49 kWh.
2- The maximum power of short term loads is 4 kW.
3- The ICU will be powered only by a grid-connected solar system; the UPS will not be
included.
4- The system must be able to power the ICU for continuous 24 hours of electrical
power cut.
Based on the assumptions and features above, and considering the average sun peak hour
(5.5 kWp). A 5 kW peak system will be able to produce approximately 27.5 kWh per day in
average. Recalling that the system is grid connected and will not be responsible to feed
totally the loads. It will be able to feed approximately half of the total daily average load.
The most important parameter to calculate is the size of stock batteries. The batteries are the
main elements of the system that are responsible for the autonomy function of the system.
The sizing of batteries will be explained in the next part of the thesis.

38
Figure 4.4: General structure of the solar system of the ICU
4.2.2 Battery requirements
The batteries in our system are needed to provide the energy to the system in the case of
electric power cut. The size of the battery need to maintain the function of the system is
calculated. Considering the average case of solar irradiation which is 5.5kWp, the power
consumption is given by:
(4.1)
(4.2)
Considering the DOD of batteries of 65%, the nominal power of the batteries can be
calculated by:
(4.3)
During the day, the system of 5kWp will produce an energy of 27.5kWh. This energy will
be returned back to the batteries. The power of the batteries is then given by:
(4.4)

39
The capacity of the batteries energy of the system is 35 kWh; the batteries that are going to
be used are deep cycle gel batteries of 800 Ah and 2 v. In order to stock the required amount
of power, 24 batteries will be used and connected in series to form 48 v. During the normal
conditions, the batteries are going to be charged from the solar system whenever the solar is
available. If extra power is needed by the batteries, the system will provide that energy from
the public utility. Whenever the production of the system is more than the required energy,
the extra generated power is directed to the main grid. Figure 4.5 shows the used batteries in
the system and the series connection between them.
Figure 4.5: Batteries used in the system for energy storage
4.2.3 Photovoltaic panels
In order to generate the required system power; 70 small size solar panels PW750 model
from “MATRIX SOLAR TECHNOLOGIES” are used because it is the available in market.
The specifications of this panel type are shown in Table 4.4. The installed solar panels are
shown in Figure 4.6. The total maximum power generation of the 70 modules is 5600 Wp
calculated based on the datasheet of the solar modules. A comparison of the performance of
different solar modules including the type we are using before and after being exposed to
the sun was reported in (Carr & Pryor, 2004). The reported results are shown in table 4.5
below. It explains how the efficiency of the power panels changes after being exposed to the
sun for a period of time. Data is measured under STC conditions in laboratory before and
after exposure to the sun.
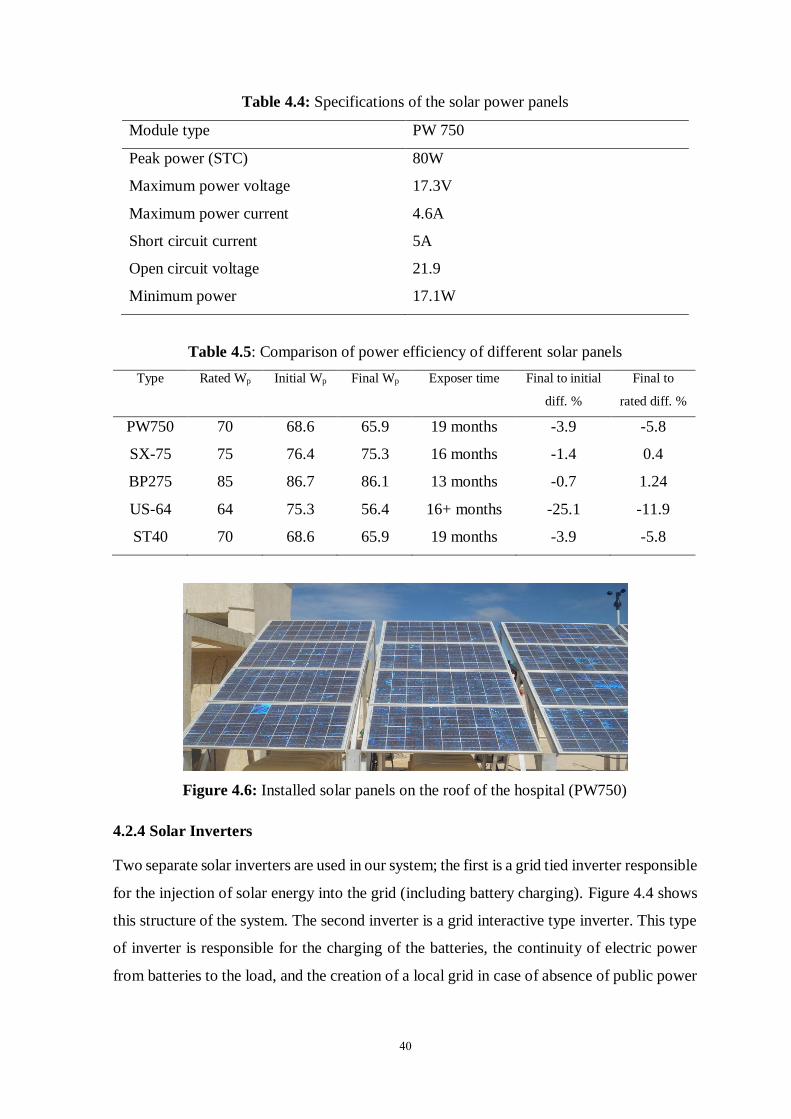
40
Table 4.4: Specifications of the solar power panels
Module type PW 750
Peak power (STC) 80W
Maximum power voltage 17.3V
Maximum power current 4.6A
Short circuit current 5A
Open circuit voltage 21.9
Minimum power 17.1W
Table 4.5: Comparison of power efficiency of different solar panels
Type Rated Wp Initial Wp Final Wp Exposer time Final to initial
diff. %
Final to
rated diff. %
PW750 70 68.6 65.9 19 months -3.9 -5.8
SX-75 75 76.4 75.3 16 months -1.4 0.4
BP275 85 86.7 86.1 13 months -0.7 1.24
US-64 64 75.3 56.4 16+ months -25.1 -11.9
ST40 70 68.6 65.9 19 months -3.9 -5.8
Figure 4.6: Installed solar panels on the roof of the hospital (PW750)
4.2.4 Solar Inverters
Two separate solar inverters are used in our system; the first is a grid tied inverter responsible
for the injection of solar energy into the grid (including battery charging). Figure 4.4 shows
this structure of the system. The second inverter is a grid interactive type inverter. This type
of inverter is responsible for the charging of the batteries, the continuity of electric power
from batteries to the load, and the creation of a local grid in case of absence of public power

41
grid. As discussed earlier, the peak power demand from the main grid was found to be 4.026
kW. An interactive inverter of 5 kVA is used to ensure the supply of the system in the worst
cases. SUNNY BOY Island 6.0H interactive inverter from SMA is used for this purpose.
Specifications of the inverter are shown in Table 4.6.
Table 4.6: Specifications of the used grid interactive inverter
Description Value Notes
Model / type Sunny Boy 6.0H SMA
Number of phase 1 OUTPUT AC
Rated grid voltage / AC voltage range (v) 230 / 202-253 OUTPUT AC
Rated frequency / frequency range (adjustable) (Hz) 50 / 45-65 OUTPUT AC
Rated power (for Unom / fnom / 25 °C / cos ϕ = 1) (W) 4600 OUTPUT AC
AC power at 25 °C for 30 min / 5 min / 3 sec (W) 6000/6800/11000 OUTPUT AC
Rated current / maximum output current (peak) 20A / 120A OUTPUT AC
Total harmonic factor output voltage / power factor <4% / -1..1 OUTPUT AC
Rated input voltage / AC input voltage range 230 / 172.5-264.5 INPUT AC
Rated input frequency / allowable input frequency range 50 / 40 - 70 INPUT AC
Maximum AC input current 50A INPUT AC
Maximum AC input power (W) 11500 INPUT AC
Rated input voltage / DC voltage range 48 / 41-63 INPUT DC
Maximum battery charging current 110 DC
Rated DC charging current / DC discharging current 90A / 103A DC
Table 4.7: Specifications of the used grid tie inverter
DC INPUT (SUNNY BOY 5000TL)
Maximum DC power (PF=1) 5200 W
Maximum input voltage 750v
MPP voltage range 175 – 500 v
Rated input voltage 400v
Minimum input voltage 125v
Maximum DC current (input A / B) 15A / 15A
Number of MPPT inputs 2
AC OUTPUT
Rated power (230v, 50 Hz) 4600W
Maximum apparent power 5000 VA
Rated voltage 230v
AC voltage range 180 – 280v
Maximum output current 22A
Inrush current ( of nominal current 10ms) <20%
Maximum efficiency 97%

42
The grid tied inverter used for the interface of solar field panels to the main grid is also SMA
SUNNY BOY 500TL grid tie inverter. The main specifications of this inverter are shown in
Table 4.7. It is a single phase grid connected inverter that has the ability to synchronise with
the electric grid and inject directly the electric solar power into the main utility. The main
important characteristics of this inverter are the MPPT inputs (2 inputs) that allow better
extraction of solar power under different irradiation conditions. Two separate (but identical
voltage) strings can be connected to each MPPT input of the inverter as shown in the table.
Figure 4.7 presents the data logging equipments used in our experiments. All data were
acquired using these installations and this acquisition system.
Figure 4.7: Data logging equipments and installations
The project started by carrying out a survey on the energy consumption of a part of the ICU
in the hospital for 13 days. The collected results of the survey were analysed and arranged
to specify the suitable solar energy size. I did all calculations of the required system assuming
that 25% of the ICU load will work at its maximum load while the rest of the ICU units will
absorb the average power as measured in the survey. Based on this assumption I calculated
the required solar system size. In the design of the system and due to the discontinuity of the
main power supply in Libya, I have chosen to use an on-grid solar system combined with
another off-grid solar system. The on-grid system is responsible for the injection of the
generated power directly to the grid without the use of backup batteries. In the absence of
the main grid, the off-grid system creates the main power supply to which the on-grid system
is connected.

43
After finishing the installation, I bought special data logger and measurement devices for the
purpose of logging the power generation data from the system. These equipments were
installed and all the data was collected, stored and processed in the aim of writing this thesis
work. I also have visited the Near East University Hospital and measured some data about
the consumption of the ICU of the hospital during many days in the aim of comparing the
consumption and determining the possible required system in case of NEU. All the
measurements and collected data are presented and discussed in this work.
4.3 Near East Hospital
Near east hospital is one of the largest parts of Near East University that has advanced
infrastructure offering as training and research institute. Near east hospital was established
in 2008 to meet the requirements of advanced medical technologies as the first privete
hospital in TRNC (NEU-Webteam, 2015).
Figure 4.8: Front view of near east hospital (NEU-Webteam, 2015)
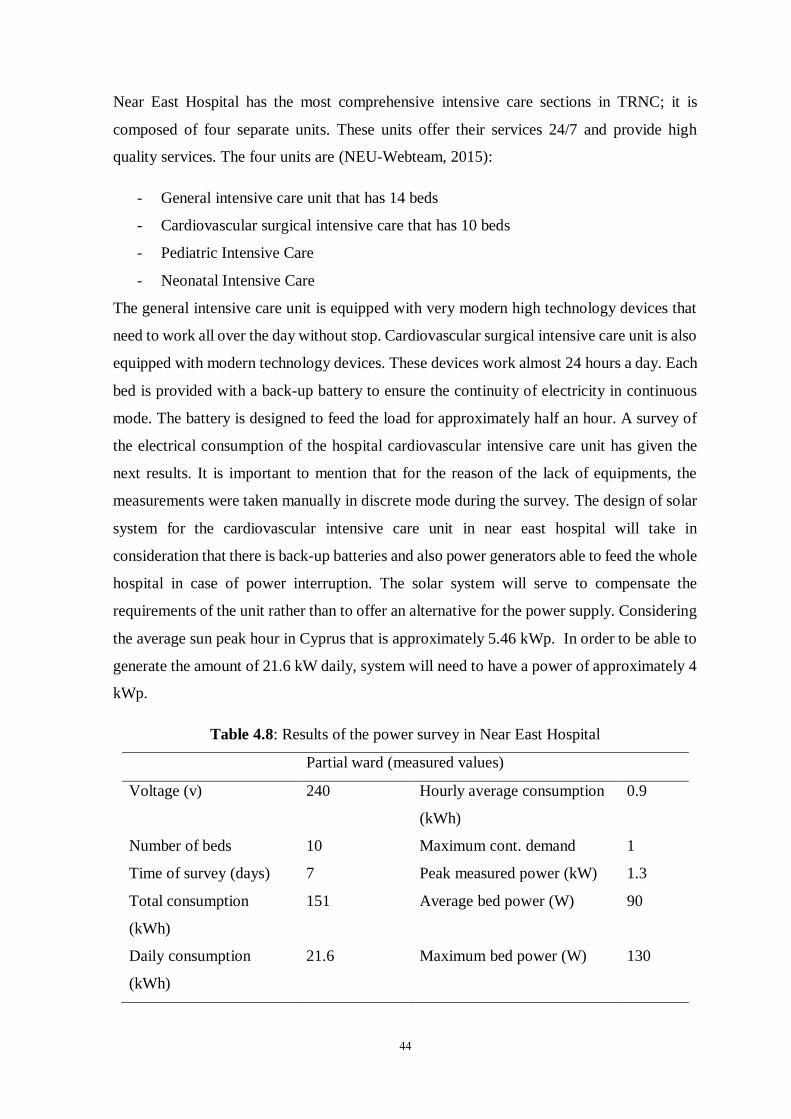
44
Near East Hospital has the most comprehensive intensive care sections in TRNC; it is
composed of four separate units. These units offer their services 24/7 and provide high
quality services. The four units are (NEU-Webteam, 2015):
- General intensive care unit that has 14 beds
- Cardiovascular surgical intensive care that has 10 beds
- Pediatric Intensive Care
- Neonatal Intensive Care
The general intensive care unit is equipped with very modern high technology devices that
need to work all over the day without stop. Cardiovascular surgical intensive care unit is also
equipped with modern technology devices. These devices work almost 24 hours a day. Each
bed is provided with a back-up battery to ensure the continuity of electricity in continuous
mode. The battery is designed to feed the load for approximately half an hour. A survey of
the electrical consumption of the hospital cardiovascular intensive care unit has given the
next results. It is important to mention that for the reason of the lack of equipments, the
measurements were taken manually in discrete mode during the survey. The design of solar
system for the cardiovascular intensive care unit in near east hospital will take in
consideration that there is back-up batteries and also power generators able to feed the whole
hospital in case of power interruption. The solar system will serve to compensate the
requirements of the unit rather than to offer an alternative for the power supply. Considering
the average sun peak hour in Cyprus that is approximately 5.46 kWp. In order to be able to
generate the amount of 21.6 kW daily, system will need to have a power of approximately 4
kWp.
Table 4.8: Results of the power survey in Near East Hospital
Partial ward (measured values)
Voltage (v) 240 Hourly average consumption
(kWh)
0.9
Number of beds 10 Maximum cont. demand 1
Time of survey (days) 7 Peak measured power (kW) 1.3
Total consumption
(kWh)
151 Average bed power (W) 90
Daily consumption
(kWh)
21.6 Maximum bed power (W) 130

45
4.4 Solar Energy Production in TRNC
In the aim of comparing the solar energy production of Libya and TRNC, I have visited the
company of Ekrim Solar and collected the data registered by the inverter of the system of
5.3 kWp. This system was built near to Ortakoy place in the city of Nicosia. The data
collected is presented in the tables of appendices while graphs of the power production are
shown in the next chapter. Better explanation of the collected data is discussed in chapter 5
of this work. The tilt angle of the system was chosen to be 30 degrees by the responsible
engineers.
Figure 4.9: Solar Panels system at Ekrim Solar Company
4.5 Comparative Energy production in TRNC and Republic of Libya
The next table 4.9 presents the average energy production in TRNC and Republic of Libya
during one year of experiments. The data shows that the energy production in TRNC was
obviously higher than its counterpart in Libya.
Figure 4.9: Monthly Energy generation in Libya vs. TRNC system
0
200
400
600
800
1000
jan feb mar apr may jun jul aug sep oct nov dec
Ener
gy k
wh
TRNC
Libya

46
Table 4.9: Comparison of the energy production during the year in Libya and TRNC
Month Libya energy Production (kWh) TRNC energy production (kWh)
January 261 480
February 576 590
March 370 800
April 530 840
May 650 820
June 580 380
July 504 550
August 530 600
September 563 750
October 667 620
November 522 560
December 490

47
CHAPTER 5
RESULTS AND DISCUSSION
This chapter presents the results obtained from the system during the period of the
experiments. All the collected data from the solar system were stored in excel files for
approximately one year. The experiments started in March 2015 and extended until February
2016. The huge amount of data was collected thanks to the recent data logging and inverter
technologies with data logging capabilities. However, some of the collected data was
inefficient and rejected due to system failures. The reason for these failures was because of
the very unstable electric power grid in Libya; and some faults related to the batteries set up
for the system. All the collected data from the experiments were transferred, stored, and
analysed using MATLAB software. The data collection was done regularly at each 5
minutes. Data about voltage levels of each string, currents generated by the string, power of
each string, total power, and AC side parameters were mainly collected. This chapter will
present some statistical analysis results for the collected data and discuss these results. Daily
and monthly production amounts will be presented and discussed. For the aim of comparing
some of the obtained results, data collected from a similar grid tie solar system in the Turkish
Republic of Northern Cyprus will be presented. This data was obtained from the region of
Nicosia. Data was collected for a period of 2 weeks due to restrictions of the source company.
5.1 Daily and monthly power generation
The next two figures show the daily power generation during different times of the year. The
power was measured from the AC side of the system at unity power factor. Figure 5.1
presents the daily generation of January, April, and June. It shows that the power generation
in April was better than the generation of January and June. The maximum generated power
in April was approximately 5 kW after midday between 12- 14 o’clock. During the month
of June the peak power was 4.6 kW between 14- 16 o’clock. Figure 5.3 shows that the peak
power generated by the system during the summer is less than the peak power generated
during spring months. This can be explained by the fact that the tilt angle was chosen to face
better the sun during winter and spring; and the temperature in summer affects the power
generation and reduces the efficiency of the system.

48
Figure 5.1: Daily system power generation during January, April, and June
Figure 5.2: Daily system power generation during July and November
Figure 5.3: Peak power generation during Jan, Apr, May, and June
Figure 5.4 and Figure 5.5 present the DC voltage generated by one of the strings in the
months of January, April, June, July, and November. The figures show more stability of the
voltage during the month of April over the other months although the time of generation is
shorter than summer time. The generation time extends in summer from 8 o’clock until 20
6 8 10 12 14 16 18 20 220
1000
2000
3000
4000
5000
6000
Hour
P (W
)
2 Jan
8 Apr
6 Jun
6 8 10 12 14 16 18 20 220
500
1000
1500
2000
2500
3000
3500
4000
4500
5000
Hour
P (W
)
22 Jul
11 Nov
0 5 10 15 20 25 30 350
1000
2000
3000
4000
5000
Day
Pow
er (
W)
Jan
Apr
May
Jun

49
o’clock during the months of June and July. This period shrinks in the winter from 9 o’clock
to 17 o’clock in the evening.
Figure 5.4: DC voltage (on load) of the first solar string (Jan, Apr, and Jun)
Figure 5.5: DC voltage (on load) of the first solar string (Jul and Nov)
Figure 5.6: AC side current generated by the solar inverter
6 8 10 12 14 16 18 20 220
100
200
300
400
500
600
Hour
DC
Va (
v)
2 Jan
8 Apr
6 Jun
6 8 10 12 14 16 18 20 220
100
200
300
400
500
600
Hour
DC
Va (
v)
22 Jul
11 Nov
6 8 10 12 14 16 18 20 220
5
10
15
20
25
Hour
I grid (
A)
2 Jan
8 Apr
6 Jun

50
Figure 5.7: AC side current generated by solar inverter
Figure 5.6 and Figure 5.7 present the generated Alternative current RMS values during one
day of the selected months. Current variations during the day and generation periods are
clear from the figures. Figures show that the system is generating maximum power during
the months of April and November than the summer months of June and July. The next few
figures show the daily power generation during selected months of the year.
Figure 5.8: Daily power generation during January
Figure 5.9: Daily power generation during February
6 8 10 12 14 16 18 20 220
1000
2000
3000
4000
5000
Hour
P (
W)
22 Jul
20 Nov

51
Figure 5.10: Daily power generation during April and September
Figure 5.11: Monthly generated power except August and December (total 5262 kW)
Figure 5.8 and Figure 5.9 show the daily power generation during the months of January and
February. The production of January shows too many fluctuations due to the weather
variations during the winter days. The total power generation of January was about 230kW.
The generation of February was more stable with total generation of about 580kW.
Figure 5.10 shows the daily power generation during April and September. Figure 5.11
shows the monthly generation of the installed solar system except from months of August
and December. The figure shows stable power generation around the year but less than
expected average. Assuming linear power generation during August, September, also

52
between November, and January; the total power generated in August could be evaluated to
be 535kW and that of December could be approximated to 390kW. Based on these
expectations, the total power generation with reach the value 6187kW during the year.
Comparing these values to the expected generation as given in table 4.3 and illustration of
Figure 5.12, it can be found that the system is working at 52% of its expected power. The
power generation during the months of February and October was near to the expected
values, this comparison is not true for the summer months where real generation was less
than half of the expected values. The main cause for these results can be explained by the
number of system failures during the last year due to the continuous grid problems. However,
the main cause for this low efficiency of the system is the use of higher tilt angle that is more
suitable for winter days other than summer days. As the level of sun in winter is lower than
its level in summer, the tilt angle for winter must be high to face the sun and obtain more
sunshine. During the summer, the tilt angle must be reduced so that the solar panels face the
sun.
Figure 5.12: Expected power generation of the system (total 10006kW)
5.2 Power generation in Libya vs. North Cyprus
In the last part of the thesis, the power generation of the hospital’s 5.3kWp solar system in
Libya was discussed. In this part, comparison of the important parameters of the system and
an equivalent installed system in TRNC-Nicosia will be established. Figure 5.13 presents
the daily average power generation of January.
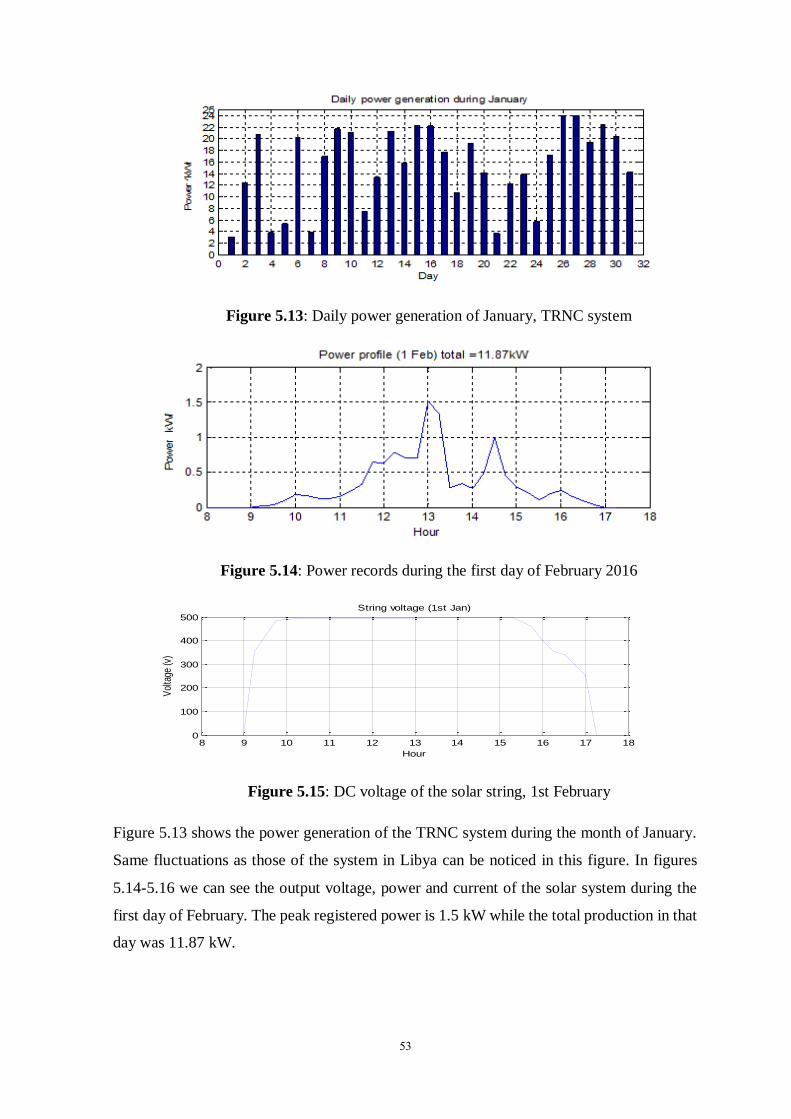
53
Figure 5.13: Daily power generation of January, TRNC system
Figure 5.14: Power records during the first day of February 2016
Figure 5.15: DC voltage of the solar string, 1st February
Figure 5.13 shows the power generation of the TRNC system during the month of January.
Same fluctuations as those of the system in Libya can be noticed in this figure. In figures
5.14-5.16 we can see the output voltage, power and current of the solar system during the
first day of February. The peak registered power is 1.5 kW while the total production in that
day was 11.87 kW.
8 9 10 11 12 13 14 15 16 17 180
100
200
300
400
500
Hour
Vol
tage
(v)
String voltage (1st Jan)

54
Figure 5.16: DC current of the solar string (1st February)
Figure 5.17: Power generation during the month of May
Figure 5.17 presents the generated power during the month of May. This figure shows that
the power production of the TRNC system is much higher than the Libyan solar system. The
peak value of the power generation shown in figure 5.18 during one day of June was 4kW.
However, the system is generating more power during the month of June than the Libyan
system. Records show that the system has generated 340 kW during the first 12 days of June
2016 compared to 200 kW generated by the Libyan solar system during the same period of
last year. Figure 5.19 shows the power generation over the last 10 months of the TRNC solar
system. Figure 5.20 presents a comparison between the power generations of the two
systems. It shows that the TRNC system is generating twice the generated power from the
Herat hospital system during most of the months except from winter months were the
production is about the same.
8 9 10 11 12 13 14 15 16 17 180
1
2
3
4
Hour
Curr
ent
(A)
1st Feb

55
Figure 5.18: Power generation during one day of June (12 June 2016)
Figure 5.19: Average monthly power generation
Figure 5.20: Monthly Energy generation in Libya vs. TRNC system
0
100
200
300
400
500
600
700
800
900
jan feb mar apr may jun jul aug sep oct nov dec
Ener
gy k
Wh
TRNC
Libya

56
CHAPTER 6
CONCLUSIONS AND RECOMMENDATIONS
In this work, a 5 kWp grid tie solar power system with batteries was studied and discussed.
Records of the system parameters and power generation were collected, stored, and
evaluated for a period of about one year. The system was installed at the Tajoura heart
hospital’s intensive care unit (ICU) in Tajoura-Tripoli, Libya. The main aim of the system
is to provide low cost, environmentally friend, continuous power supply for the ICU. The
project was launched in 2013 due to the security problems and lack of fuels and electric grid
problems.
The analysis of the collected data has shown that the system is producing approximately
52% of its nominal expected power. It was found that the efficiency of the installed system
during the spring months was better than its efficiency in the summer. The total energy
production during the year was estimated to be 6187 kWh while the expected value was
approximately 10006 kWh. This was explained mainly by the use of higher tilt angle that is
more suitable for spring days more than summer days. The use of such an angle is suitable
in the case of standalone systems were no public grid is available. In that case, the need for
continuous power during the winter has more weight and importance. The harvesting of
more power during the summer is not that important because of the availability of the sun
irradiation. However, in our case, the public grid is available and suffers from some
intermittent disconnections that can’t be avoided. The solar system is mainly intended to
help providing power to the system under unordinary situations where the power cut lasts
for long periods. It was found also that the daily and monthly power generation during spring
and summer is more stable compared to the winter where a lot of fluctuations were noticed.
Simple comparison between this system and a similar system installed during August 2015
in TRNC was carried out. The power of the installed system was 5.3 kWp. The comparison
showed that the TRNC system production was better than that of the Tajoura hospital and
more stable. As a result, this work recommends that the tilt angle of the Tajoura hospital’s
centre is revised and reduced to meet the expected power generation levels. An angle of 30
degrees is recommended to increase the efficiency of the system and need to be considered
for future installations.

57
REFERENCES
Biricik, S. (2014). KKTC'de Rüzgar Enerjesinin Elektriksel Uygulamaları. Retreived June
20, 2016 from:http://www.ktemo.org/uploads/documents/22-
03_kktc_de_ruzgar _enerjis inin_elektriksel_uygulamalari.pdf
Bollinger, J. D. (2007). Applications of Solar Energy to Power Stand-Alone Area and Street
Lighting. University Of Missouri-Rolla.
Bowden, S., & Honsberg, C. (2014). PVcdrom. Retrieved November 29, 2015, from: pv
education org: http://www.pveducation.org/pvcdrom/solar-cell-operation/iv-
curve
Carr, A. J., & Pryor, T. L. (2004). A Comparison of the Performance of Different PV Module
Types in Temperate Climates. Elsevier, 285-294.
CSERS, (2015). Centre of Solar Energy and Renewable Sources, Libya.
Due-Gundersen, N. (2013, 4 15). Never mind oil. Retrieved April 22, 2016, from:
http://oilprice.com/Alternative-Energy/Solar-Energy/Never-Mind-Oil-Libya-
could-Supply-Europe-with-Solar-Power.html
Dzimano, G. (2008). Modeling of Photovoltaic Systems, Master thesis. The Ohio State
University.
EL-Moghany, M. S. (2011). Sun and Maximum Power Point Tracking in Solar Array
Systems Using Fuzzy Controllers Via FPGA. Gaza, The Islamic University,
Palestine.
Ibrahim, D., & Altunc, M. (2012). Using Solar Energy in the Cleaning of Swimming Pools
in North Cyprus . Journal of Sustainable Energy & Environment, 31-34.
Idris, S. M. (2013). Technical and Economical Feasibility Study of a Photovolatic Plant
System Connected to the Electricity Grid in Al-Jufrah. Tripoli, Lybia: University
of Tripoli.
IEA, I. E. (2009). Trends in Photovoltaic applications, Survey 1992-2009. IEA.
Jones, G., & Bouamane, L. (2012). Power from Sunshine: A Business History of Solar
Energy. Harvard Business School .
Libya Energy (2015). Retrieved April 22, 2016, from: http://www.indexmundi.com/g/g.
aspx ?c=ly&v=81

58
Libya, T. R. (2009). Renewable Energy in Libya, Present Situation and future plans. Solar
Energy in the MENA Region. Erfurt, Germany.
Liedholm, E. (2010). Tracking the maximum power point, Master thesis. Chalmers
University of Technology.
Libya energy situation. (2015). Libya energy situation, Retrieved April 24, 2016, from:
https://energypedia.info/wiki/Libya_Energy_Situation
Martin, J. (2015). Depth of Discharge for Solar Battery Storage. Retrieved from Solar
choice: http://www.solarchoice.net.au/blog/depth-of-discharge-for-solar-
battery-storage
REDAR. (2016). Renewable Energy Design & Applications Researches. Retrieved May
2016, from: http://redar.ncc.metu.edu.tr/
Morales, D. S. (2010). Maximum Power Point Tracking Algorithms for Photovoltaic
Applications. Aalto university.
NEU-Webteam. (2015). Near East Hospital. Retrieved Jul 2016, from:
http://neareasthospital .com/institutional/our-hospital/?lang=en
Oner, H. (2016). ODTÜ Kuzey Kıbrıs Kampüsü, güneş enerjisi santralini açtı. Retrieved
Jul 30, 2016, from METU: http://redar.ncc.metu.edu.tr/odtu-kuzey-kibris-kampusu-gunes-
enerjisi-santralini-acti/
Pickard, C. (2008). Standalone PV systems. Retrieved April 25, 2016, from Alladdin Solar:
http://www.aladdinsolar.com/standalonediagram.html
Rashid, M. H. (2001). Power Electronics Handbook. Academic Press.
Ridgeway, M. (2016). Car battery chargers. Retrieved from: http://www.carbatterycharger
scentral.com/solar-car-battery-chargers-best-buying-tips/
Saleh, I. M. (2006). Prospects of Renewable Energy in Libya. Paper Presented in the
International Symposium on Solar Physics and Solar Eclipses, (pp. 153-161).
Shams El-Dein, M. Z. (2012). Novel Designs for Photovoltaic Arrays to Reduce Partial
Shading Losses and to Ease Series Arc Fault Detection, PhD Dessertation.
University of Waterloo.
Solar direct. (2016). Bringing solar energy down to earth, Retrieved May 5, 2016 from:
http://www.solardirect.com/pv/batteries/batteries.htm
Team, M. E. (2008). A Guide to Understanding Battery Specifications. MIT.

59
Tukiainen, M. (2016). Sunrisen Sunset, and dusk times, Retrieved May 2, 2016 from:
http://www.gaisma.com/en/location/tarabulus.html
Wikimapia. (2015). Tajoura Heart Hospital. Retrieved May 4, 2016 from:
http://wikimapia.org/1320896/Tajura-Heart-Hospital
Zaroug, M. R. (2014). Country Energy Profile, Libya. Renewable Energy Authority of
Libya.