application of full-cost of urban passenger … of full-cost of urban passenger transportation case...
TRANSCRIPT

Technical Report Documentation Page 1. Report No. 2. Government Accession No.
FHWA/TX-97 /1 356-6
4. Title and Subtitle
APPLICATION OF FULL-COST OF URBAN PASSENGER TRANSPORTATION CASE STUDY: SAN ANTONIO NORTHEAST (IH-35) CORRIDOR
7. Author(s)
Jiefeng Qin, Michael T. Martello, jose Weissmann, and Mark A. Euritt
3. Recipient's Catalog No.
5. Report Date
September 1996
6. Performing Organization Code
8. Performing Organization Report No.
Research Report 1356-6
1 0. Work Unit No. (TRAIS) 9. Performing Organization Name and Address
Center for Transportation Research The University of Texas at Austin 11. Contract or Grant No. 3208 Red River, Suite 200 Research Study 0-1 356 Austin, Texas 78705-2650
1-----------~~---------------l 13. Type of Report and Period Covered 12. Sponsoring Agency Nome and Address
Texas Department of Transportation Interim Research and Technology Transfer Office P. 0. Box 5080 Austin, Texas 78763-5080
14. Sponsoring Agency Code
15. Supplementary Notes
Study conducted in cooperation with the U.S. Department of Transportation, Federal Highway Administration. Research study title: "Development of an Urban Transportation Investment Model"
16. Abstract
Using a full-cost approach, we evaluated the different transportation improvement alternatives (developed by Rust Lichliter/jameson) available for the Northeast (IH-35) corridor in San Antonio, Texas. Through MODECOST- a computer model based on the full-cost analysis concept- we found that the current facility cannot meet future traffic demands. As a result, travelers on this facility will continue to bear substantial external costs, including congestion and air pollution costs. The results clearly show that, to meet future demand, the San Antonio/Bexar County Metropolitan Planning Organization will need to expand the current facility from downtown San Antonio to Loop 1604. As our investigation revealed, the savings that will accrue from the reduction of external costs and users costs exceed the cost of initial investment.
Indeed, the case study described in this report shows that, in many cases, external costs and user costs are more relevant than the initial investment in the facility. Expanding the current facility to add HOV lanes to accommodate ride-sharing and special transit service can reduce the external costs and user costs, which in turn, reduce the full cost of the facility.
The study also shows that full-cost analysis is an effective tool for valuing transportation investment alternative comparisons - and one capable of enhancing qualitative assessments and planning/engineering judgment. The actual value calculated by the full-cost analysis sometimes can be used as an assessment indicator to policy-makers and transportation professionals.
17. Key Words 18. Distribution Statement
MODECOST, full cost, facility cost, user cost, external cost, agency cost, San Antonio, Texas
No restrictions. This document is available to the public through the National Technical Information Service, Springfield, Virginia 22161.
19. Security Classif. (of this report)
Unclassified
Form DOT F 1700.7 [8-72)
20. Security Classif. [of this page)
Unclassified
Reproduction of completed page authorized
21 . No. of Pages
56
22. Price
I

APPLICATION OF FULL COST OF URBAN PASSENGER TRANSPORTATION
CASE STUDY: SAN ANTONIO NORTHEAST (IH-35) CORRIDOR
by
Jiefeng Qin
Michael T. Martello
Jose Weissmann
Mark A. Euritt
Research Report Number 1356-6
Research Project 0-1356 Development of an Urban Transportation Investment Model
conducted for the
Texas Department of Transportation
in cooperation with the
U.S. Department of Transportation Federal ffighway Administration
by the
CENTER FOR TRANSPORTATION RESEARCH Bureau of Engineering Research
THE UNIVERSITY OF TEXAS AT AUSTIN
September 1996

ii

IMPLEMENTATION RECOMMENDATIONS
This report, which describes one of the five case studies assessing the full cost of urban passenger transportation alternatives, evaluates the different transportation improvement alternatives available for the Northeast (IH-35) corridor in San Antonio, Texas. Given its effectiveness for valuing transportation investment alternative comparisons, full-cost analysis represents a critical element in developing a multimodal transportation investment plan. In terms of implementation, the findings in this report demonstrate that full-cost analysis is capable of enhancing qualitative assessments and planning/engineering judgment.
Prepared in cooperation with the Texas Department of Transportation and the U.S. Department of Transportation, Federal Highway Administration.
REPORTS FOR TIDS PROJECT
1356-1, "Full-Cost Analysis of Urban Passenger Transportation," by Jiefeng Qin, Karen M. Smith, Michael T. Martello, Mark A. Euritt, and Jose Weissmann. This report examines methods for evaluating and comparing urban passenger transportation projects regardless of mode. After identifying the full-cost approach as an effective tool for undertaking such comparisons, this report describes MODECOST, a full-cost evaluation model developed by the Center for Transportation Research (CTR) of The University of Texas at Austin.
1356-2, "Development of a Multimodal Full-Cost Model- MODECOST," by Jiefeng Qin, Jose Weissmann, Michael T. Martello, and Mark A. Euritt. This report summarizes the development of MODECOST, a multimodal full-cost model. First, various cost categories for three modes of a passenger transportation system - auto, bus, and light rail - are identified. This is followed by a discussion of procedures used for annualizing the life-cycle costs of each component of a transportation system. The report also summarizes the unit cost data found in the literature and data received from officials at the Texas Department of Transportation as well as from staff of other public agencies around the country.
1356-3, "Full-Cost Analysis of the Katy Freeway Corridor," by Jiefeng Qin, Michael T. Martello, Jose Weissmann, and Mark A. Euritt. Using a full-cost approach, this report evaluated the different transportation improvement alternatives (developed by Parsons Brinckerhoff Quade & Douglas, Inc.) available for the IH-10 Katy Freeway corridor. Through MODECOST -a computer model based on the full-cost analysis concept- we found that the current facility cannot meet future traffic demands.
1356-4, "The Houston-Harte of San Angelo: A Case Study Application of a Full-Cost Model for Evaluating Urban Passenger Transportation," by Karen M. Smith, Jiefeng Qin, Jose Weissmann, Mark A. Euritt, and Michael T. Martello. This report evaluates the full costs of transportation alternatives on the Houston-Harte corridor in San Angelo, Texas. The alternatives examined are those considered by the San Angelo District of the Texas Department of Transportation, which include: (1) the continuation of the existing frontage lanes-only configuration and (2) the construction of the mainlanes for completion of the facility. The results of MODECOST - a
iii

computer model developed by a Center for Transportation Research (CTR) team- indicate that the addition of mainlanes to the Houston-Harte corridor is both feasible and cost effective.
1356-5, "US 59 Harris County/Fort Bend County: A Case Study Application Of A Full-Cost Model For Evaluating Urban Passenger Transportation," by Michael T. Martello, Jiefeng Qin, Jose Weissmann, and Mark A. Euritt. This report evaluated transportation improvement alternatives for the US 59 Southwest Freeway corridor from the full-cost, life-cycle approach perspective. The alternatives involve hypothetical facility improvements as well as vehicle occupancy improvements. Our findings suggest that the current facility will not be able to service the projected peak-hour traffic demand; and after running MODECOST- a computer model based on the full-cost analysis concept - we observed that travelers bore a significant amount of external costs, including congestion costs and air pollution costs.
1356-6, "Application of Full Cost of Urban Passenger Transportation Case Study: Northeast (Th-35) Corridor," by Jiefeng Qin, Michael T. Martello, Jose Weissmann, and Mark A. Euritt. Using a full-cost approach, we evaluated the different transportation improvement alternatives (developed by Rust Lichliter/Jameson) available for the Northeast (IH-35) corridor in San Antonio, Texas. Through MODECOST- a computer model based on the full-cost analysis concept- we found that the current facility cannot meet future traffic demands.
1356-7, .. Full-Cost Evaluation of the Northeast Transit Terminal in El Paso, Texas," by Michael T. Martello, Jiefeng Qin, Jose Weissmann, and Mark A. Euritt. This report presents the results of an evaluation of the cost effectiveness of the Northeast Transit Terminal, an existing Sun Metro bus transit terminal located 23 km north of downtown El Paso, Texas. The evaluation of the transit terminal's cost effectiveness was conducted from a full-cost perspective and consisted of hypothesizing the amount of existing bus ridership that is attributable to the presence of the transit terminal. MODECOST, a computer model developed through this project, was used for the analysis.
1356-SF, "Development of an Urban Transportation Investment Model: Executive Summary," by Michael T. Martello, Jose Weissmann, Mark A. Euritt, and Jiefeng Qin. This final report summarizes the objectives of the project and provides recommendations for implementation.
DISCLAIMERS
The contents of this report reflect the views of the authors, who are responsible for the facts and the accuracy of the data presented herein. The contents do not necessarily reflect the official views or policies of the Federal Highway Administration or the Texas Department of Transportation. This report does not constitute a standard, specification, or regulation.
NOT INTENDED FOR CONSTRUCTION, BIDDING, OR PERMIT PURPOSES
Mark A. Euritt Jose Weissmann
Research Supervisors
iv

TABLE OF CONTENTS
~~~)\Jri()~~<:()~~)\Jrl()~~ .......................................................... iU
~~y .................................................................................................. vii
C:llAP'TER 1. IN1'RC>DUC:1ll()~ ........................................................................... 1
1.1 The <:oncept of Full-<:ost i\nalysis .......................................................... 1
1. 2 i\ Brief Review of MC>DE<:C>~T Model ..................................................... 2 1.3 ~cope of the Report ............................................................................ 2
C:Hi\PTER 2. Bi\C:KGRC>U~D ............................................................................. 3
2.1 Background of <:ase ~tudy ~ite .............................................................. 3
C:Hi\PTER 3. DE~<:RIPTIC>~ ()F I~PUT Di\Ti\ ...................................................... 11
3.1 Person-Trip Demand ......................................................................... 11
3.2 Freight Truck Demand ....................................................................... 11
3. 3 Mode ~plit and Vehicle C>ccupancy ........................................................ 13
3.4 Traffic Distribution in Peak and ~on-Peak Period ....................................... 14
3.5 Value of Time ................................................................................. 14
3.6 Facility <:ost Data ............................................................................ 14
3. 7 Emission Value Data ......................................................................... 14
3.8 Transit i\gency Data ......................................................................... 15
3. 9 <:apital and C>perating Data for Personal Vehicle ......................................... 16 3.10 Rail Data ....................................................................................... 16 3.11 C>ther Data ..................................................................................... 17
C:Hi\PTER 4. RE~U~T~ ................................................................................... 19
4.1 Base Ntemative .............................................................................. 19 4.2 C>ther Ntematives ............................................................................ 21
C:Hi\PTER 5. <:C>~<:~U~I()~ ............................................................................ 27
~FE~~<:E~ .............................................................................................. 29
i\PPE~IX A E~TIMJ\ Jrl()~ C>F ~IGHT TRU<:K DE~ .AND TRU<:K MIX ......... 31
i\PPE~DIX B. rnPUT .AND C>UTPUT Di\T i\ C>F MC>DE<:C>~T .................................... 35
v

VI

SUMMARY
Using a full-cost approach, we evaluated the different transportation improvement alternatives (developed by Rust Lichliter/Jameson) available for the Northeast (lli-35) corridor in San Antonio, Texas. Through MODECOST- a computer model based on the full-cost analysis concept - we found that the current facility cannot meet future traffic demands. As a result, travelers on this facility will continue to bear substantial external costs, including congestion and air pollution costs. The results clearly show that, to meet future demand, the San Antonio/Bexar County Metropolitan Planning Organization will need to expand the current facility from downtown San Antonio to Loop 1604. As our investigation revealed, the savings that will accrue from the reduction of external costs and users costs exceed the cost of initial investment.
Indeed, the case study described in this report shows that, in many cases, external costs and user costs are more relevant than the initial investment in the facility. Expanding the current facility to add HOV lanes to accommodate ride-sharing and special transit service can reduce the external costs and user costs, which in tum, reduce the full cost of the facility.
The study also shows that full-cost analysis is an effective tool for valuing transportation investment alternative comparisons - and one capable of enhancing qualitative assessments and planning/engineering judgment. The actual value calculated by the full-cost analysis sometimes can be used as an assessment indicator to policy-makers and transportation professionals.
vii

Vlll

CHAPTER 1. INTRODUCTION
The main objective of this report is to assist Texas policy-makers in evaluating the various investment alternatives available for improving mobility within the Northeast (IH-35) corridor in San Antonio, Texas. Using full-cost analysis, we have calculated costs for five specific transportation alternatives for the Northeast (IH-35) corridor. This chapter reviews the background of full-cost analysis and outlines key elements of the report.
1.1. THE CONCEPT OF FULL-COST ANALYSIS
Over the past several decades, a vast transportation network has been developed to address mobility and accessibility needs in Texas. This state transportation network is dominated by more than 466,900 km of public roads (Ref 1), with more than 70 percent of local travel occurring within Texas cities having populations of 200,000 or more (Ref 2). Most of these trips are made by personal vehicles. And as is well known, such dependence on personal vehicles in Texas has created new problems for transportation professionals, environmentalists, and the public. These problems include congestion in many major metropolitan areas, air pollution and global weather change, noise, accidents, and energy depletion. The Federal Highway Administration (FHW A) reported that 25 percent of Texas' urban interstate highways exceed 95 percent of their capacity, and that 43 percent are operating at over 80 percent of their carrying capacity. Moreover, San Antonio, one of the largest cities in the nation, is very close to being classified as a non-attainment area. With the coming new standards by Environmental Protection Agency (EPA) and Texas Natural Resource Conservation Commission (TNRCC), it appears that the metropolitan area will be labeled as a non-attainment area.
Prior to 1990, transportation policy focused primarily on the development of the interstate system, with cost evaluations of urban transportation alternatives typically considering only initial capital investments. However, the passage of the Intermodal Surface Transportation Efficiency Act of 1991 (ISTEA) and the Clean Air Act Amendments of 1990 (CAAA) provided an opportunity to take a more comprehensive approach to evaluating transportation options. The ISTEA and CAAA shifted traditional planning and decision-making to a broader, multimodal transportation perspective, a process that examines highway, transit, and rail issues in combination. Using this broader view ensures that the transportation planning process looks at the problem from the perspective of an integrated system, emphasizing efficient and productive people and goods transfer from one location to another. Costs, including indirect social and environmental costs, must be fully accounted for in a comparison of modes and management strategies, in order to identify the most cost-effective options.
Transportation full-cost analysis is the first step in developing a multimodal transportation investment plan. Full-cost analysis takes into account not only infrastructure costs, but also user and external costs, thus enhancing transportation planning decisions significantly. Focus on any singular cost may result in an inefficient system and can lead to reduced long-term economic investment. The full-cost approach provides a stronger platform from which to evaluate
1

2
transportation investment decisions without modal bias. It identifies least-cost alternatives, and promotes efficient use of the system.
1.2. A BRIEF REVIEW OF MODECOST MODEL
Previous reports (Refs 3, 4) have identified current practices relating to full-cost transportation planning. And in a previous effort, the Center for Transportation Research (CTR) of The University of Texas at Austin developed MODECOST, a computer model capable of comparing multimodal transportation alternatives by accounting for the full-cost for each mode. MODECOST incorporates many aspects of modal costs that have not traditionally been accounted for, such as air pollution cost, accident cost, and personal vehicle user cost. These costs are not usually included in decision matrices for transportation investment. By taking costs such as these into account, MODECOST can estimate the direct and indirect costs from the perspective of how much society or the taxpayer is paying for that mode of transportation.
In summary, MODECOST allows the transportation planner to compare the full-cost of three major urban transportation modes - auto, bus, and rail - along a particular corridor. It is based on the full-cost and life-cycle-cost concepts discussed in previous reports (Refs 3, 4). MODECOST is an easy-to-operate, interactive, and menu-driven software capable of comparing transportation alternatives. The software can be run on any ffiM-PC or compatible computers using Microsoft Windows (Ref 5). Examples of MODECOST' s input data dialog boxes and output files can be found in Appendix B.
1.3. SCOPE OF THE REPORT
This report summarizes and compares the five transportation alternatives for the Northeast (IH-35) corridor developed in the Major Investment Study (MIS) prepared by Rust Lichliter/Jameson. Comparing costs among alternatives can determine under what circumstances one alternative is more efficient than another in terms of the resources it uses to provide a given service. Accordingly, cost comparisons -particularly full-cost comparisons- can aid policymakers in planning for new transportation infrastructure.
Chapter 2 is concerned with the background and development of the five alternatives for the Northeast (IH-35) developed by Rust Lichliter/Jameson. Chapter 3 describes the data inputs and assumptions made in the analysis. Chapters 4 builds on the calculations of MODECOST to present the full-cost of urban passenger transportation for different investment alternatives, presenting the results for each alternative. The last chapter, Chapter 5, summarizes the fmdings of this report.
CHAPTER2. BACKGROUND
2.1. BACKGROUND OF CASE STUDY SITE
The Northeast (IH-35) corridor study section is 26 km long and extends from the intersection of IH-37 and US 281 in the downtown area to Loop 1604 on the north. The corridor is centered around IH-35, which is important not only as a major transportation corridor within Bexar County and San Antonio, but also as a heavily traveled interstate section connecting the North, Central, and South Texas regions with destinations to other important Texas cities. Increases in NAFf A-related trade moving through the corridor, along with projected growth in Bexar County's population and consumer-based economy, will certainly result in increased competition for the corridor's transportation capacity. Presently, IH-35 directly links Mexico to Canada, with easy connections to the northeastern manufacturing and population hubs.
In early 1996, the San Antonio/Bexar County Metropolitan Planning Organization (San Antonio MPO) undertook (with Rust Lichliter/Jameson) a comprehensive transportation study. The primary objective of that study was to provide the San Antonio MPO with a framework for evaluating the future transportation needs of the IH-35 Northeast corridor, particularly that portion running from the San Antonio Central Business District to Loop 1604.
Because sections of the current Northeast (IH-35) corridor were constructed several decades ago, planners fear that the corridor will be unable to accommodate future traffic growth. In addition, the escalating frequency of accidents has led to safety and mobility problems.
The study (dubbed a Major Investment Study, or MIS) is designed to comply with federal guidelines under the Intermodal Surface Transportation Efficiency Act (ISTEA) of 1991 (Ref 6). Specifically, the preliminary study by Rust Lichliter/Jameson accomplished the following tasks:
1. Developed an initial set of transportation improvement alternatives for the corridor, from the perspective of a multimodal transportation concept (highway, bus, rail, etc.).
2. Based on input from the public and from the participating transportation agencies, performed an initial evaluation and screening of the alternatives.
Based on the above guidelines, Rust Lichliter/Jameson identified three broad investment strategies for the Northeast (IH-35) corridor. These included:
1. No Investment, (i.e., Base Case)
2. Minimum improvements, (i.e., TSMffDM)
3. Major improvements
Based on these criteria, ten alternatives were developed, including
1. A no-build alternative, (i.e., Base Case)
2. Two minimum investment alternative (i.e., minimal corridor operating system
3

4
improvement, and bus service improvements)
3. Seven major investment build alternatives (ranging from major interchange improvements to building rail transit)
The above options offer a varying degree of capacity enhancements meant to achieve study goals and objectives. In order to accommodate varying travel and physical characteristics along the full length of the corridor, the 25.9-km stretch of lli-35 was divided into six segments. Those segments included:
Segment 1: Loop 1604 to Pratt (8.29 km) Segment 2: Pratt to Walzem (1.3 km) Segment 3: Walzem to lli-35 and lli-410 Split (3.66 km) Segment 4: lli-35 and lli-410 Split to BAMC (2.86 km) Segment 5: BAMC to Pine Street (5.79 km) Segment 6: Pine Street to Commerce Street (3.98 km)
Figure 2.1 depicts the study limits in San Antonio.
to Austin
to Houston
San Antonio
Figure 2.1 Study limits within San Antonio, Texas

5
The initial screening of each alternative was based on comparing the alternatives within a particular investment strategy. In comparing the alternatives within each investment strategy, it became clear that the alternatives under the same category had many similar characteristics. Differences among the alternatives occurred only across the investment strategies.
After comparing each investment category, we eliminated five alternatives that did not perform well, based on the initial screening criteria. The remaining five alternatives, including the Base Case, are shown in Figures 2.2 through 2.6. The details of these alternatives are summarized below:
Alternative 1: No Build (Base Case) This alternative assumes that the current roadway configuration can meet future traffic demands. The Base Case is the benchmark alternative strategy to which all others are compared. It includes the existing system of highways and local streets and the presently operating transit system plus previously committed and funded improvements.
Alternative 2: General Pwpose Lanes This alternative includes major investments in General Purpose lanes. These investments include: ( 1) adding one general purpose lane in each direction from Fratt to Walzem, providing a total of ten general purpose lanes; (2) adding two general purpose lanes in each direction from Walzem to IH-35 and IH-410 Split, providing a total of five general purpose lanes in each direction; and (3) adding two general purpose lanes in each direction from BAMC to Pine Street, providing a total of ten general purpose lanes.
Alternative 3: HOV Lanes This alternative includes major investments in HOV lanes. These investments include providing a one-lane, two-way HOV facility from Fratt to Commerce Street on the Northeast (IH-35) corridor.
Alternative 4: Express Lanes This alternative includes major investments in express lanes. These investments include adding a two-lane, two-way Expressway facility from Fratt to Pine Street along the Northeast (IH-35) corridor.
Alternative 5: Rail Transit This alternative includes major investments in rail facilities. These investments include adding a high-level fixed guideway between Loop 1604 and Pine Street.
The next step in the study process, and the focus of this report, is to "screen" these five alternatives using a full-cost perspective to determine the alternative that performs best.

0\
Figure 2.2. Alternative 1: No Buildt
Split: Commerce Pine BAMC 1-35 & IH410 Walzem Pratt Loop 1604
ML(4) ML(3) ML (3) ML(3) ML (4) ML (4)
3.98 k:ms 5.79 kms 2.86 kms 3.66 k:ms 1.30 k:ms 8.29kms
ML(4) ML(3) ML(3) ML(3) ML(4) ML(4)
t - Number of lanes in each direction are shown in parentheses.

Figure 2.3. Alternative 2: General Purpose Lanesf
Split: Commerce Pine BAMC I-35 & lli-410 Walzem Fratt Loop 1604
ML (4) ML(5) ML(3) ML(5) ML(5) ML(4)
3.98 kms 5.79 kms 2.86 kms 3.66 kms 1.30 kms 8.29 kms
ML(4) ML(5) ML (3) ML (5) ML(5) ML(4)
t - Number of lanes in each direction are shown in parentheses.
....,J

00
Figure 2.4. Alternative 3: HOV Lanes t
Split: Commerce Pine BAMC 1-35 & IH-410 Walzem Pratt Loop 1604
ML(4) ML(3) ML(3) ML(3) ML (4) HOV(l) HOV (1) HOV (I) HOV (1) HOV (I) ML(4)
3.98 kms 5.79 kms 2.86kms 3.66kms 1.30 kms 8.29kms
HOV (1) HOV (I) HOV (I) HOV (1) HOV (1) ML(4) ML(4) ML(3) ML(3) ML(3) ML(4)
t - Number of lanes in each direction are shown in parentheses.

Figure 2.5. Alternative 4: Express Lanes t
Split: Commerce Pine BAMC 1-35 & lli-410 Walzem Fratt Loop 1604
ML(3) ML(3) ML(3) ML(4) ML(4) EX(2) EX(2) EX(2) EX(2) ML(4)
3.98 kms 5.79kms 2.86kms 3.66 kms 1.30kms 8.29kms
ML(4) EX(2) EX(2) EX(2) EX(2) ML(4) ML(3) ML(3) ML(3) ML(4)
t - Number of lanes in each direction are shown in parentheses. EX represents express lanes.
\0

,_. 0
Figure 2.6. Alternative 5: Railf
Split: Commerce Pine BAMC 1-35 & IH-410 Walzem Fratt Loop 1604
ML(4) ML(3) ML(3) ML(3) ML(4) ML(4)
3.98 kms 5.79kms 2.86 kms 3.66kms 1.30 kms 8.29 kms
ML(4) ML(3) ML(3) ML (3) ML(4) ML(4) I t - Number of lanes in each direction are shown in parentheses.

CHAPTER 3. DESCRIPTION OF INPUT DATA
The objective of this study is to evaluate the future transportation needs of the Northeast (IH-35) corridor. Unlike the Major Investment Study, which examines only the transportation needs to the year 2015, we assume the planning horizon for Northeast (IH-35) corridor to be from the year 2000 to the year 2030. It is the purpose of this study to identify the investment that represents the best transportation alternative during this period, rather than that for a single year. In this chapter we discuss the data and assumptions used in our calculation.
3.1. PERSON-TRIP DEMAND
One of the most critical factors affecting final results is the person-trip demand. The San Antonio MPO and KPMG Peat Marwick LLP (KPMG) have already estimated future person-trip volumes on the corridor. Table 3.1 shows the average weekday 24-hour person-trip volumes for the year 2000. These data are estimated using the KPMG projection for the year 2015, assuming a 2 percent average annual growth rate during the analysis period (Ref 7). The weekend demand for each section, which is also shown in Table 3.1, is calculated based on our assumption that it is 75 percent of the corresponding weekday demand.
Table 3.1. Average Weekday Person-Trip Demand (year 2000)
Section on IH-35 Weekday Weekend
Freeway Inbound Outbound Inbound Outbound
Looo 1604 - Fratt 71,800 70,100 53,900 52,500
Fratt - W alzem 95,800 98,300 71,800 73,700
Walzem- Solit 77,000 76,900 57,700 57,700
Solit- BAMC 46,400 57,700 34,800 43,300
BAMC-Pine 77,900 73,700 58,500 55,31lfl
Pine - Commerce 94,600 92,400 70,900 69,300
Source: KPMG (Ref 7).
3.2. FREIGHT TRUCK DEMAND
The movement of truck freight has a significant impact on local access within the Northeast (IH-35) corridor. Truck traffic uses the Northeast (IH-35) corridor to distribute goods to the local market and to access regional warehouse facilities. Truck traffic currently represents a significant percentage of the vehicle traffic in the study area, and freight movement through the corridor is expected to increase as trade with Mexico continues to grow as a result ofNAFIA.
While the preliminary Major Investment Study does not estimate the corridor freight truck demand, it is the intention of our study to combine both person and freight movements. Our
11

12
estimation of truck movement on Northeast (IH-35) corridor is based on the historical data obtained from a manual classification study that focused on an area northeast of Loop 1604 (Sta: M-1315). During the years 1987, 1988, 1990, and 1992, 86.63 percent of the vehicles moving through this station were classified as cars, pickups, and vans; 0.2 percent were categorized as buses; and the remainder was classified as freight trucks. Converted to a vehicle-trip basis, the truck demand at each section during weekday and weekend is described in Table 3.2.
In addition to the truck movements on IH-35, Station M-1315 also recorded the truck classification on the corridor. There are nine truck categories reported in the data, namely, 2-axle single unit, 3-axle single unit, 4-axle single unit, 3-axle semi-trailer, 4-axle semi-trailer, 5-axle semi-trailer, 6-axle semi-trailer, 5-axle trailer, and 6-axle trailer. Table 3.3 shows the truck mix on the corridor. The details of the calculation can be found in Appendix A.
Table 3.2. Weekday and Weekend Truck Demand (year 2000)
Section on Katy Weekday Weekend
Freewav Inbound Outbound Inbound Outbound
Loop 1604 - Pratt 9,550 9,320 7,170 6,980
Pratt - W alzem 12,740 13,070 9,550 9,800
Walzem - Split 10,240 10,230 7,670 7,670
Split- BAMC 6,170 7,670 4,630 5,760
BAMC- Pine 10,360 9,800 7,780 7,360
Pine - Commerce 12,580 12,290 9,430 9,220
Table 3.3. Freight Truck Mix
Truck Category Percentage (%)
2-axle Single Unit 21.2
3/4-axle Single Unit 4.3
3/4-axle Semi-Trailer 8.5
5-axle Semi-Trailer 61.4
6-axle Semi-Trailer 1.0
5-axle Trailer 2.6
6-axle Trailer 1.0
Total 100.0

13
3.3. MODE SPLIT AND VEHICLE OCCUPANCY
In addition to traffic demand along the corridor, mode split is another important issue affecting the transportation investment alternative comparisons. The mode split on the Northeast (IH-35) corridor varies from segment to segment, depending on the services provided by the transportation authorities in the region. As shown in the Travel Demand Forecasting Results Report (Ref 7), the number of bus users represents less than 1 percent of the total person-trip volumes, while the majority of travelers are using cars or carpools as their transportation. These figures are listed in Table 3.4.
Vehicle occupancy is another important factor. Higher vehicle occupancies reduce the total full cost of the facility. In this case study, the auto occupancy on the general purpose lanes and/or on the express lanes is 1.2 passengers per vehicle. The high-occupancy-vehicle has 2.4 passengers per vehicle, while bus has 8.6 passengers per bus and rail40.0 passengers per rail car.
Table 3.4. Mode Split
Alternative Section Drive-Alone Camool* Bus Rail Total
L1604 - Pratt 99.8% N/A 0.2% N/A 100o/o Pratt- W alzem 99.8% N/A 0.2% N/A 100%
1 or 2 Walzem- Split 99.2% N/A 0.8% NIA 100% Split- BAMC 99.2% NIA 0.8% N/A 100% BAMC -Pine 99.7% N!A 0.3% N/A 100% Pine - Commerce 99.7% N/A 0.3% N/A 100%
L1604 - Pratt 99.8% N/A 0.2% N!A 100% Pratt - W alzem 92.6% 7.2% 0.2% N/A 100%
3 W alzem - Split 87.7% 11.5% 0.8% N/A 100% Split- BAMC 82.4% 16.8% 0.8% N/A 100% BAMC- Pine 78.8% 20.9% 0.3% N/A 100%
Pine - Commerce 82.7% 17.0% 0.3% N/A 100%
L1604 - Pratt 99.8% N/A 0.2% N!A 100% Pratt- Walzem 80.3% 19.5% 0.2% NIA 100%
4 Walzem - Split 76.0% 23.2% 0.8% N/A 100% Split- BAMC 66.5% 32.7% 0.8% N/A 100% BAMC -Pine 54.3% 45.4% 0.3% N/A 100% Pine - Commerce 99.7% N/A 0.3%
~t 100%
L1604- Pratt 97.3% N/A 0.2% 100% Pratt- Walzem 97.3% N/A 0.2% 2.5% 100%
5 Walzem- Split 96.7% N/A 0.8% 2.5% 100% Split-BAMC 96.7% N/A 0.8% 2.5% 100% BAMC-Pine 97.2% N/A 0.3% 2.5% 100% Pine - Commerce 97.2% N/A 0.3% 2.5% 100%
* In alternative 4, this column expresses auto mode split on express lanes.

14
3.4. TRAFFIC DISTRIBUTION DURING PEAK AND NON-PEAK PERIODS
The Major Investment Study does not estimate the traffic distribution during peak and nonpeak periods. Since there is no historical data collected for this region, we used the data reported in our previous report (Ref 8). The figures shown in Table 3.5 are in terms of percent of total movements, representing simply the traffic for each direction as a fraction of total vehicle-trips on that section. There is a 1-hour peak period in the morning and afternoon. The share during the "Night" period (10:00 p.m.-6:00a.m.) in each direction is assumed to be 3.0 percent of the total trips, based on the national average derived by Hu (Ref 9). The remaining trips are assumed to occur during the "Day" period.
Table 3.5. Weekday Traffic Distribution (in% of Vehicle-Trips)
AM Peak PM Peak Day Ni~ht
Weekday/Weekend Inbound Outbound Inbound Outbound Inbound Outbound Inbound Outbound
Weekday 5.0 5.0 5.0 5.0 37.0 37.0 3.0 3.0 Weekend 0.0 0.0 0.0 0.0 47.0 47.0 3.0 3.0
Since there were no data collected for weekends, it is assumed that there is no peak-hour period on the weekends. Ninety-four percent of weekend traffic is assumed to travel through the Northeast (IH-35) corridor during the "Day" period (6:00a.m.- 10:00 p.m.), and the remaining during the "Night" period, as shown in Table 3.5.
3.5. VALUE OF TIME
Although the inclusion of travel time costs in the analysis renders the results more meaningful, it also introduces questions about some of the assumptions. Passenger travel-time values are difficult to measure, and various studies have disagreed regarding the appropriate estimate for the value of travel time. Furthermore, some planners are skeptical of methods that rely on a single assumed value for travel time. However, from the perspective of alternative comparisons, the single value method is adequate. In this analysis we assume a value of $7.09 per passenger per hour for travel time. The value equals to 80 percent of the Bexar County wage rate (Ref 7).
3.6. FACILITY COST DATA
Most data on facility unit costs have been taken from the General Guidelines for Estimates provided by the Texas Department of Transportation. We assume the existing right-of-way is large enough to accommodate either the expansion of the facility or the addition of a new facility; therefore, the purchase of right-of-way is not included in this study.
3.7. EMISSION VALUE DATA
The emission values, which are based primarily on damage value estimates of stationary source emissions, are calculated based on the following formulas (Ref 10):

15
VNox = 1640 ·ln(pop) + 4220 ·ln( 0 3 )
V HC = 871·ln(pop)+ 2310 ·ln(03 )
ln(V PMIO) = 0. 764 ·ln(pop)+ 0.685 ·ln(PM10 )
ln(Vsox) = 5.41 +0.325 ·ln(pop)+0.0138 ·ln(S02 )
V co= -6390+ 579·ln(pop)+ 2110·ln(CO)
where
vp = damage value ($/ton) for pollutant p;
pop = total population (in 103);
03 = highest second daily maximum 1-hr ozone concentration (ppm);
PM10 = highest arithmetic mean PM10 concentration (J.Lg/m3);
SOz = highest arithmetic mean S02 concentration (ppm); and
co = highest second maximum nonoverlapping 8-hr CO concentration (ppm).
Using the above relationships, we have estimated emission values for the San Antonio metropolitan area. Table 3.6 presents data on air pollutant concentrations and population in the San Antonio area. In applying these data to the regression relationships to estimate emission values, we found that the values are $2,447 per ton for nitrogen oxides (NOx), $1,150 per ton for hydrocarbons (HC), $4,090 per ton for soot-like particulate (PMlO), $2,150 per ton for sulfur oxides (SOx), and $1,160 per ton for carbon monoxide (CO).
Table 3.6. Input Data Used in Regression Relationships
Population (in l 03) 1,302
0 3 (ppm) 0.11
PM10 (Jlg/m3) 63
502 (ppm) 0.008
CO (ppm) 5
3.8. TRANSIT AGENCY DATA
The bus fleet running on the Northeast (lli-35) corridor consists of the Low-Floor, 12m, New Flyer, which has an initial capital cost of $257,000 per bus and a life span of 12 years. In

16
1992, VIA Metropolitan Transit had an operating expense $49,457.403 on 153,004,068 total passenger miles of travel (PMT), which is equivalent to $0.32 per PMT.
3.9. CAPITAL AND OPERATING DATA FOR PERSONAL VEIDCLE
The cost of owning and operating a motor vehicle is of major significance. The data listed in Table 3.7, provided by the FHW A, trace selected vehicles in personal use and their costs through a 12-year lifetime (Ref 11). The costs were based on operation of typical vehicles.
Table 3. 7. Auto Capital and Operating Data
Cost Category Cost
Average Vehicle Price ($/vehicle) 13,534
Average Pickup and Van Price ($/vehicle) 15,813
Percent being Financed 75%
Loan Period (year) 5
Loan Rate 10.0%
Salvap;e Value ($/vehicle) 1,000
Vehicle Life (year) 12
A veraJ!;e Annual Driven Miles (Irule) 10,700
Annual Scheduled Maintenance ($/vehicle) 232
Annual Unscheduled Maintenance ($/vehicle) 195
Annual Oil Change ($/vehicle) 59
Annual Tire Change ($/vehicle) 97
Annual Insurance ($/vehicle) 600
Annual ParkinJ!: ($/vehicle) 360
Enhanced 11M ($/vehicle) 55
Average Gasoline Price without Taxes ($/gallon) 0.70 Source: Cost of Owning & Operating Automobiles, Vans & Light Trucks
1991. U.S. DepartmentofTransportation, Washington, D.C., 1992.
3.10. RAIL DATA
Table 3.8 reports the additional data used to calculate the capital cost of the fixed guideway system (Ref). All rail facilities are assumed to have 40-year life spans in this study. The rehabilitation costs and maintenance costs of the facilities, as well as the operation data of the rail system, are detailed in the previous report (Ref 4).

17
Table 3.8. Capital Cost Data of Fixed Guideway
Guideway Unit Cost (per km) $1,770,000
Len2th 27.7 miles
Stations Unit Cost (per Station) $9,000,000
Number 10 Stations
Yards and Shops Cost $13,250,000
Number 1 Yard
Rail Car Unit Cost (per Car) $2,000,000
3.11. OTHER DATA
In 1992, the annual vehicle-miles of travel (AVMT) in San Antonio was 9 billion, 40.2 percent of which was on expressways (Ref 1). By using a Tx.DOT-projected VMT growth rate,1 it is expected that the A VMT will grow to 10.5 billion by the year 2000.
Concerning the value of money over time, the discount rate used in the study to convert all costs into 1995 dollars is 10 percent
1 Statewide VMT projection by the Texas Department of Transportation.

18

CHAPTER 4. RESULTS
4.1. BASE ALTERNATIVE
Alternative 1 (No Build) was considered as the base case in our analysis. The analysis for this alternative consists of cost calculations for each of the six previously defined sections along Northeast (IH-35) corridor. The cost summary reflects the impact of future traffic on the current facilities. The details, summarized in Table 4.1, are divided into eight cost categories, namely, facility costs, transit agency costs, travel time costs, air pollution costs, incident delay costs, accident costs, other external costs, and user costs.
Facility costs include roadway construction, rehabilitation, routine maintenance, and administration costs. Transit agency costs consist of the capital and operating cost paid by transit agencies if there is a transit service running on the corridor. Travel time costs are the time costs expended on the road by users. This part of the costs includes non-incident, congestion-related time costs. Air pollution costs, which are closely related to the congestion levels of the facility, are the result of tailpipe emissions. Incident delay costs result from the delay caused by incidents, while accident costs are those costs not covered by insurance the part paid by society. Other external costs include energy security, weather change, water pollution, and noise costs. Finally, user costs include the costs paid by private vehicle owners to operate and maintain their vehicles.
In Base Case, the travel time costs on Northeast (IH-35) corridor for the 30-year analysis period is a dominant force among all the cost categories. The annual user travel time and incident delay costs will account for more than 60 percent of the total annual cost. The pollution costs, which are closely related to the dimension of the facility, rank third with $42 million a year. Auto users spend about $310 million per year, or slightly more than one quarter of the total cost, to own and operate their vehicles. The facility costs, which include all the labor and material costs to maintain the current roadway facility, occupy only 2 percent of the pie.
Looking at the annual cost by section, the section from BAMC to Pine has the largest share - about 30 percent of the total cost occurring within this segment. The travel time cost within this section is about 34 percent of the total travel time cost of the entire corridor, though its personmiles of travel (PMT) is only 22 percent of the total PMT, a result of the insufficient capacity in this section. The v/c ratio during peak hours in this section is 1.22 for the year 2000, almost onefourth over the current capacity. It will quickly reach 1.49 by the year 2010 and 1.81 by the year 2020. The inadequate capacity causes excessive delay to through traffic and local traffic. The frequent stop-and-go caused by large v/c ratio results in a tremendous amount of tailpipe emissions from the traffic, which in tum leads to large air pollution costs. The same situations occur on the sections from Walzem to Split (IH-35 and IH-410) and from Pine to Commerce. This suggests that the expansion of the capacity on these sections is very urgent and necessary.
In the next section, we will evaluate the other proposed alternatives and the potential of these alternatives in terms of alleviating congestion and reducing total cost.
19

Commerce
Aftaem~tllwe 1 Nc IBl!llllftrll
Agency
Highway Faciltiy
Transit Agency
Auto User
Annual External
Cost Travel Time
Air Pollution
Incident Delay
Accident
Other External
Total
Table 4.1. Annual Life-Cycle Cost of Alternative 1 (in million dollars)
Split: Pine BAMC 1-35 & IH-410 Walzem Fratt
ML(4) ML(3) ML (3) ML (3) ML (4)
3.98 kms 5.79kms 2.86 kms 3.66 kms 1.30 kms
ML(4) ML(3) ML (3) ML (3) ML(4)
2.95 4.44 2.29 2.81 1.10
2.77 4.23 2.10 2.44 1.06
0.18 0.21 0.19 0.36 0.04
59.02 69.75 23.56 44.61 20.11
158.45 289.11 26.83 199.25 66.14
131.78 254.00 17.35 176.27 56.63
7.79 12.80 1.92 8.66 3.08
6.52 7.71 2.62 4.95 2.22
1.74 2.06 0.70 1.32 0.59
10.62 12.55 4.25 8.05 3.62
220.41 363.30 52.68 246.66 87.34
Loop1604
ML(4) 'li'iO>l~
8.29 kms 25.86 kms
ML (4)
6.34 19.93
6.15 18.76
0.19 1.17
93.47 310.51
110.08 849.85
72.51 708.53
7.70 41.94
10.32 34.33
2.76 9.16
16.81 55.90
209.89 1180.29
I Initial Capital Costt II 19.61 I 31.17 I 15.49 I 17.83 I 7.66 I 43.87 II 135.64 I t Initial capital cost is the initial lump-sum highway facility (excluding frontage roads) cost, excluding rail grade separation, interchange improvements, and
mobilization and traffic control cost.
tv 0

21
4.2. OTHER ALTERNATIVES
The major objective of this report is to identify and evaluate the alternatives available for reducing total transportation costs on the Northeast (IH-35) corridor throughout a planning horizon of 30 years. The base alternative presented previously provides the baseline to compare the other four alternatives. The base alternative reflects the current situation for the Northeast (IH-35) corridor, as well as the future trend based on no additional investment. In this section, we discuss four other alternatives:
Alternative 2: General Purpose Lanes Alternative 3: HOV Lanes Alternative 4: Express Lanes Alternative 5: Rail
The analysis was completed using both the MODECOST program and the same assumptions as those used for the base case reported previously. The analysis includes not only facility costs, but also external costs as well as user and agency costs. The costs are categorized according to eight cost groups, as described in the previous section. In addition, we also estimated the initial capital cost for each alternative, based on the output from MODECOST.
The four alternatives, discussed in Chapter 2, proposed the expansion of the current facility, which was shown clearly in the previous section as being unable to handle future traffic growth. The four investment strategies range from expanding the existing general purpose lanes, to building HOV lanes, express lanes, or a light rail system. The results for the analysis are presented in Tables 4.2 through 4.4.
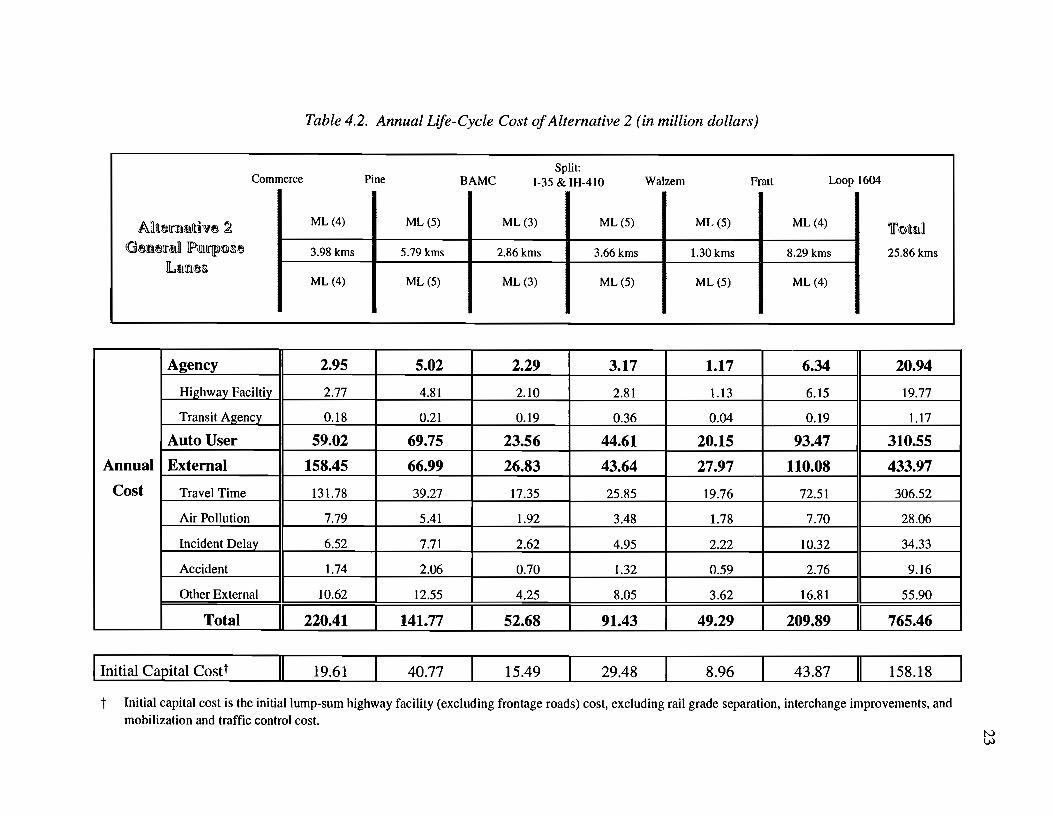
Table 4.2 lists the annual life-cycle cost of Alternative 2, which shows a clear improvement from the base alternative. The annual total cost drops more than one-third from $1.18 billion to $765 million. Among eight cost categories, the travel time costs have the largest drop, from over $708 million a year to $307 million a year. The next is air pollution costs, which drop by one-third a year. This implies that the traffic flow on the corridor has been dramatically improved.
Looking at the results by section, the travel time and pollution costs on sections from Walzem to Split and from BAMC to Pine show tremendous improvement, which implies that the congestion level is eased significantly. The remainder of the sections, however, shows minimum gains.
Table 4.3 shows the cost results for Alternative 3. Compared with the base alternative, Alternative 3 has the same impact as Alternative 2 in alleviating congestion on the corridor. The travel time savings of Alternative 3 top $360 million a year. And the annual air pollution savings total almost $14 million.
The travel time and delay cost on the section from Pine to Commerce improves significantly, reducing from $138 million to only $65 million a year. This shows the tremendous advantage of improving the current roadway geometry on this section.
22
Breaking down the cost by categories, as shown in Table 4.3, we can see that auto user costs are a major contributor to the total cost, reaching more than one-third of the annual cost. Comparing this with the base scenario, travel time cost is down, from 60 percent to 44 percent. This illustrates that the current facility is incapable of handling future traffic growth. Although Alternative 3 increases annual agency costs by $4 million, the tremendous savings on external costs and automobile user costs reduce the total annual cost by one-third from the base scenario.
The results for Alternative 4 are listed in Tables 4.4. This alternative can effectively reduce travel time cost and air pollution cost, achieving the same goal as did Alternatives 2 and 3.
Table 4.5 lists the full-cost results obtained from MODECOST for Alternative 5- the rail alternative. The results show that including a fixed guideway option is not a feasible alternative. This is because the light rail system cannot attract large ridership, leaving the existing Northeast (lli-35) corridor as the major corridor to serve commuters. As shown in the demand forecasting report (Ref 7), the mode split shifting from automobile to rail transit is minimum. The sections from Walzem to Split and from BAMC to Pine remain heavily congested.
As discussed above, Alternative 2, Alternative 3, and Alternative 4 have a tremendous positive impact on the total future transportation cost. Overall, Alternative 2 has a lower annual cost as well as a lower initial investment. The extension of an HOY lane from Pine to downtown San Antonio in Alternative 3 alleviates the congestion on this section considerably. In both Alternative 2 and 4, however, the roadway expansion is restricted to the north of Pine, leaving the section from Pine to Commerce congested with future traffic.
Commerce
J\.31temillltive 2 <Ge1m:erm hlf]p)Os:e
Lules
Agency
Hi~hwav Faciltiy
Transit Agency
Auto User
Annual External
Cost Travel Time
Air Pollution
Incident Delay
Accident
Other External
Total I
Table 4.2. Annual Life-Cycle Cost of Alternative 2 (in million dollars)
Split: Pine BAMC 1-35 & IH-410 Walzem Frau
ML (4) ML(5) ML(3) ML(5) ML(5)
3.98 kms 5.79 kms 2.86kms 3.66kms 1.30 kms
ML(4) ML(5) ML(3) ML(5) ML(5)
2.95 5.02 2.29 3.17 1.17
2.77 4.81 2.10 2.81 1.13
0.18 0.21 0.19 0.36 0.04
59.02 69.75 23.56 44.61 20.15
158.45 66.99 26.83 43.64 27.97
131.78 39.27 17.35 25.85 19.76
7.79 5.41 1.92 3.48 1.78
6.52 7.71 2.62 4.95 2.22
1.74 2.06 0.70 1.32 0.59
10.62 12.55 4.25 8.05 3.62
220.41 I 141.77 I 52.68 I 91.43 I 49.29 I
Loop 1604
ML(4) Toll~
8.29 kms 25.86kms
ML(4)
6.34 20.94
6.15 19.77
0.19 l.l7
93.47 310.55
110.08 433.97
72.51 306.52
7.70 28.06
10.32 34.33
2.76 9.16
16.81 55.90
209.89 I 765.46
I Initial Capital Costt II 19.61 I 40.77 I 15.49 I 29.48 I 8.96 I 43.87 II 158.18 I t Initial capital cost is the initial lump-sum highway facility (excluding frontage roads) cost, excluding rail grade separation, interchange improvements, and
mobilization and traffic control cost. N w

Commerce
ARaem!lltive 3 HCV lLmues
Agency
Highway Faciltiy
Transit Agency
Auto User
Annual External
Cost Travel Time
Air Pollution
Incident Delay
Accident
Other External
Total
Table 4.3. Annual Life-Cycle Cost of Alternative 3 (in million dollars)
Pine BAMC 1-35 & IH-410 Walzem Fratt
ML(4) ML(3) ML(3) ML(3) ML(4) HOV (1) HOV (1) HOV (1) HOV (I) HOY (1)
3.98 kms 5.79kms 2.86kms 3.66kms 1.30 kms
HOY (l) HOY (1) HOY (1) HOY (1) HOY (1) ML(4) ML(3) ML(3) ML(3) ML(4)
3.81 5.96 3.05 3.63 1.47
3.63 5.75 2.86 3.27 1.43
0.18 0.21 0.19 0.36 0.04
53.98 62.44 21.57 42.02 19.38
82.20 106.22 21.83 107.19 46.30
58.36 77.82 12.57 87.54 37.52
5.09 6.27 1.75 5.41 2.38
6.52 7.71 2.62 4.95 2.22
1.61 1.87 0.65 1.25 0.57
10.62 12.55 4.25 8.05 3.62
139.99 174.62 46.45 152.85 67.15
30.88 51.49 25.62 28.79 12.59
Loop 1604
ML(4) 'li' o1lrrul
8.29 kms 25.86kms
ML(4)
6.34 24.25
6.15 23.08
0.19 1.17
93.47 292.86
110.08 473.83
72.51 346.31
7.70 28.59
10.32 34.33
2.76 8.71
16.81 55.90
209.89 II 790.94
43.87 193.23
t Initial capital cost is the initial lump-sum highway facility (excluding frontage roads) cost, excluding rail grade separation, interchange improvements, and mobilization and traffic control cost.
~
i

Table 4.4. Annual Life-Cycle Cost of Alternative 4 (in million dollars)
Commerce
Aft1lemative 4 !B:xpJJ:~ess Lamles
Agency
Highway Faciltiy
Transit Agency
Auto User
Annual External
Cost Travel Time
Air Pollution
Incident Delay
Accident
Other External
Total
ML(4)
3.98kms
ML(4)
2.95
2.77
0.18
59.02
158.45
131.78
7.79
6.52
1.74
10.62
220.41
19.61
Pine BAMC
ML(3) EX(2)
5.79 kms
EX (2) ML(3)
6.46
6.25
0.21
69.75
67.95
40.19
5.45
7.71
2.06
12.55
144.17
57.48
Split: I-35 & IH-410 Walzem Frau
ML(3) ML(3) ML(4) EX(2) EX (2) EX (2)
2.86 kms 3.66 kms 1.30 kms
EX (2) EX (2) EX (2) ML(3) ML(3) ML(4)
3.30 3.95 1.58
3.11 3.59 1.54
0.19 0.36 0.04
23.56 44.61 20.11
20.06 65.48 28.76
10.61 46.96 20.47
1.89 4.21 1.86
2.62 4.95 2.22
0.70 1.32 0.59
4.25 8.05 3.62
46.91 114.04 50.45
28.58 32.59 13.94
Loop 1604
ML(4) TtU.~1l!ill
8.29 kms 25.86 kms
ML(4)
6.34 24.58
6.15 23.41
0.19 1.17
93.47 310.51
110.08 450.78
72.51 322.51
7.70 28.89
10.32 34.33
2.76 9.16
16.81 55.90
209.89 I 785.87
196.06
t Initial capital cost is the initial lump-sum highway facility (excluding frontage roads) cost, excluding rail grade separation, interchange improvements, and mobilization and traffic control cost.
N Vt

Table 4.5. Annual Life-Cycle Cost of Alternative 5 (in million dollars)
Split: Commerce Pine BAMC I-35 & IH-410 Walzem Frau Loop 1604
ADtem111liive 5 ML(4) ML(3) ML(3) ML(3) ML(4) ML(4) ']['I!) till 3.98kms 5.79kms 2.86 kms 3.66 kms 1.30kms 8.29kms 25.86kms
ML(4) ML(3) ML(3) ML(3) ML(4) ML(4) J Agency 4.38 5.60 3.09 3.98 2.59 7.42 27.06
Hi£hway Faciltiy 2.77 4.23 2.10 2.44 1.06 6.15 18.76
Transit Agency 1.61 1.37 0.99 1.54 1.52 1.27 8.30
Auto User 57.54 68.00 22.97 43.49 19.60 91.13 302.73
Annual External 140.68 252.32 25.87 173.81 58.75 104.84 756.27
Cost Travel Time 115.10 219.05 16.61 152.09 49.68 68.14 620.67
Air Pollution 7.12 11.44 1.86 7.72 2.79 7.47 38.39
Incident Delay 6.38 7.54 2.56 4.84 2.17 10.09 33.57
Accident 1.70 2.01 0.68 1.29 0.58 2.70 8.96
Other External 10.39 12.28 4.16 7.87 3.54 16.45 54.68
Total 202.60 325.92 51.93 221.28 80.94 203.39 1086.05
Initial 19.61 31.17 15.49 17.83 7.66 135.64
Canital Cost I Ra:l 168.85 168.85
t Initial capital cost is the initial lump-sum highway facility (excluding frontage roads) cost, excluding rail grade separation, interchange improvements, and mobilization and traffic control cost.
N 0\

CHAPTER 5. CONCLUSION
This case study followed the development ofMODECOST, a computer model capable of estimating the total costs of transportation alternatives for a given corridor. The estimations are based on the characte~istics of the corridor, the characteristics of traffic on the corridor, the transportation modes to be evaluated, and on the modal split.
Our analysis of the five alternatives indicates that there is potential for a one-third decrease in total transportation costs on the Northeast (IH-35) corridor. This decrease in total transportation costs is relative to the current facility being used from the years 2000 through 2030. Compared with the potential total savings, including time savings and air pollution savings from easing congestion, the initial capital investment is relatively small
As reported in a previous chapter, the current facility from Walzem to Split (IH-35 and IH-41 0) and from BAMC to downtown San Antonio cannot accommodate future traffic growth. The section from BAMC to Pine is the poorest in terms of traffic delay and air pollution costs. The demand on the section will exceed the current capacity by 25 percent by the year 2000, and 80 percent by the year 2020; adding General Purpose lanes or HOV lanes can result in tremendous savings.
We should point out that building a rail facility along the corridor cannot adequately alleviate future traffic congestion on the Northeast (IH-35) corridor, simply because the mode shift from auto to rail is not large enough.
Comparing the four investment strategies proposed by Rust Lichliter/Jameson, we found that Alternative 2 (adding general purpose lanes) is the best. Alternative 3 (adding HOV lanes) and Alternative 4 (adding express lanes) are nearly equivalent. These three alternatives have a clear advantage over Alternative 5 (rail). The differences among the results of these three alternatives are largely due to the estimation of traffic demand and mode split.
In the base alternative with no investment, travel time and delay costs dominated the cost categories owing to the insufficient capacity of the facility. In Alternative 2 through Alternative 4, the user/agency costs account for the largest share, being responsible for almost 40 percent of the total cost.
As discussed earlier, full-cost analysis allows us to look at the transportation planning process from the perspective of an integrated system. Full-cost evaluations of urban transportation alternatives take into account not only initial capital investments, but also indirect social and environmental costs. If we use only initial investment as our "screen" criteria, we will obviously choose Alternative 1 as our final recommendation, as shown in Figure 5 .1. From the perspective of full cost, however, Alternative 2 is the best choice, as shown in Figure 5.2. Compared with Alternatives 1 and 5, Alternative 2, Alternative 3, and Alternative 4 have a clear advantage, based on their over $400 million annual savings obtained largely from reductions in user and external costs. Figures 5.1 and 5.2 illustrate that when evaluating transportation alternatives, a full-cost approach has an obvious advantage over traditional transportation planning. Emphasizing initial capital investment could, over the long-term, redound to an inefficient transportation system.
27

28
$350
$300
$250 -c ~ $200
! $150 .... rl} Q
$100 u
$50
$0 1 2 3 4 5
Alternative
Figure 5.1. Initial Investment by Alternatives
$1,200
$1,000
- $800 c .$! a $600 e '-' .... ~ $400 u
$200
$0 1 2 3 4 5
Alternative
Figure 5.2. Annual Cost by Alternatives
The full-cost approach takes into account not only facility investment, but also external costs and user expenditures. The case study conducted in this report shows that, in many cases, the latter is more important than the former. The full-cost analysis results reported are effective not only in comparing alternatives, but also in enhancing qualitative assessments and planning/engineering judgment. The full-cost values calculated for the several alternatives can thus be used by policy-makers and transportation professionals as an assessment indicator.

REFERENCES
1. Highway Statistics. U.S. Department of Transportation, Washington, D.C., 1992.
2. Mark A Euritt, Angela Weissmann, Rob Harrison, Michael Martello, Jiefeng Qin, S. Varada, Steve Bemow, J. Decicco, M. Fulmer, J. Hall, and L Peters. An Assessment of Transportation Control Measures, Transportation Technologies, and Pricing/Regulatory Policies. Prepared for the Texas Sustainable Energy Development Council, Center for Transportation Research, The University of Texas at Austin, and The Tellus Institute, 1995.
3. Jiefeng Qin, Karen M. Smith, Michael T. Martello, Mark A Euritt, Jose Weissmann. Full-Cost Analysis of Urban Passenger Transportation. Draft Report 1356-1, Center for Transportation Research, The University of Texas at Austin, 1996.
4. Jiefeng Qin, Michael T. Martello, Mark A. Euritt, and Jose Weissmann. A Model to Evaluate Full-Cost of Urban Passenger Transportation. Draft Report 1356-2, Center for Transportation Research, The University of Texas at Austin, 1996.
5. Jiefeng Qin, Jose Weissmann, Mark A Euritt, and Michael T. Martello. "Evaluating Full Costs of Urban Passenger Transportation," paper accepted for publication in the Transportation Research Record, 1996 (forthcoming).
6. Rust Lichliter/Jameson. Northeast (IH-35) Corridor MIS San Antonio, Texas Screening Evaluation Report. Prepared for San Antonio-Bexar County Metropolitan Planning Organization, 1996.
7. KPMG Peat Marwich LLP. Northeast (IH-35) Corridor Major Investment Study: Travel Demand Forecasting Results Report. Prepared for Rust Lichliter/Jameson under contract to San Antonio-Bexar County Metropolitan Planning Organization, 1996.
8. Jiefeng Qin, Michael T. Martello, Mark A. Euritt, and Jose Weissmann. Application of Full Cost of Urban Passenger Transportation Case Study: IH-10 Katy Freeway Corridor. Draft Report 1356-3, Center for Transportation Research, The University of Texas at Austin, 1996.
9. Patricia S. Hu. "Changes in Americans' Journeys-to-Work," presented at the 1993 Annual Meeting of the Association of American Geographers, Atlanta, GA, 1993.
10. Michael Q. Wang, D. J. Santini, and S. A. Warinner. Methods of Valuing Air Pollution and Estimated Monetary Values of Air Pollutants in Various U.S. Regions. Research Report ANL/ESD-26, Center for Transportation Research, Argonne National Laboratory, Argonne, IL, 1994.
11. U.S. Department of Transportation. Cost of Owning & Operating Automobiles, Vans & Light Trucks 1991. U.S. Department of Transportation, Washington, D.C., 1992.
29

30

APPENDIX A
ESTIMATION OF FREIGHT TRUCK DEMAND AND TRUCK MIX
31

32
33
APPENDIX A
ESTIMATION OF FREIGHT TRUCK DEMAND AND TRUCK MIX
The following table lists the number and classification of vehicles observed at Station M-1315 near Northeast (IH-35) corridor (Bexar County) for the years 1987, 1988, 1990, and 1992.

Year
Number
Cars 23316
Busses 90
Panel & Pickup 9735
Other 2-Axle Single Unit 1151
3-Axle Single Unit 220
4-Axle Single Unit 14
3-Axle Semi-Trailer 121
4-Axle Semi-Trailer 446
5-Axle Semi-Trailer 2718
6-Axle Semi-Trailer 32
5-Axle Trailer 119
6-Ax1eTrailer 38
Total 38000
Table A.1. Vehicles Classified at Manual Count Station (M-1315)
1987 1988 1990
Percentage Number Percentage Number Percentage Number
61.36% 28043 56.79% 24376 59.24% 29277
0.24% 88 0.18% 89 0.22% 73
25.62% 14737 29.84% 11245 27.33% 6366
3.03% 1272 2.58% 1273 3.09% 1009
0.58% 350 0.71% 199 0.48% 180
0.04% 5 0.01% 11 0.03% 2
0.32% 155 0.31% 173 0.42% 137
1.17% 397 0.80% 261 0.63% 207
7.15% 4005 8.11% 3297 8.01% 3729
0.08% 123 0.25% 25 0.06% 33
0.31% 172 0.35% 165 0.40% 164
0.10% 35 0.07% 36 0.09% 88
100.00% 49382 100.00% 41150 100.00% 41265
1992
Percentage
70.95%
0.18%
15.43%
2.45%
0.44%
0.00%
0.33%
0.50%
9.04%
0.08%
0.40%
0.21%
100.00%
Average
Percentage
62.08%
0.20%
24.55%
2.79%
0.55%
0.02%
0.35%
0.78%
8.08%
0.12%
0.36%
0.12%
100.00%
w ~

APPENDIX B
INPUT AND OUTPUT DATA OF MODECOST
35

36
37
APPENDIX B
INPUT AND OUTPUT DATA OF MODECOST
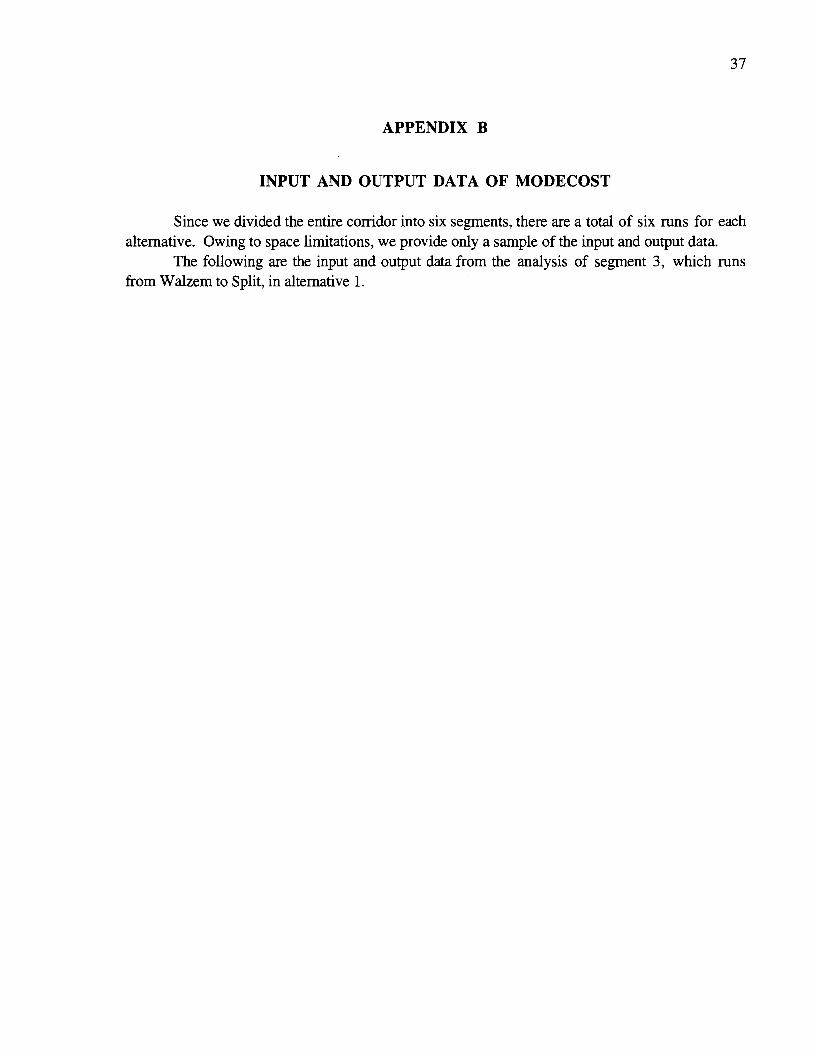
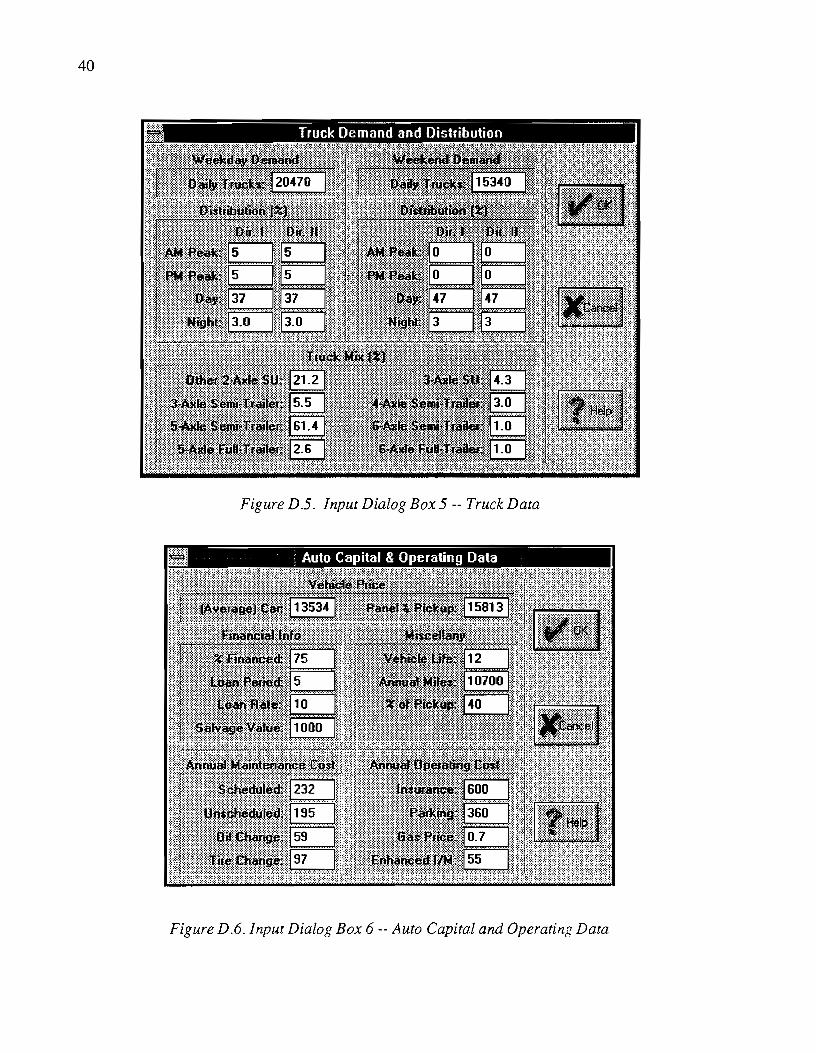
Since we divided the entire corridor into six segments, there are a total of six runs for each alternative. Owing to space limitations, we provide only a sample of the input and output data.
The following are the input and output data from the analysis of segment 3, which runs from Walzem to Split, in alternative 1.

38
. Initialization
Figure D.l. Input Dialog Box 1 --Initialization
Geometry and Demand Data
Figure D-2. Input Dialog Box 2 --Geometry and Demand Data

39
Figure D.3. Input Dialog Box 3 --Mode Split and Occupancy Data
Figure D.4. Input Dialog Box4 --Regular Lane Trqtfic Dara
40
Figure D.5. Input Dialog Box 5 --Truck Data
Figure D.6. Input Dialog Box 6-- Auto Capital and Operating Data

41
Figure D.7. Input Dialog Box 7 --Auto External Data
Figure D.8. Input Dialog Box 8 --Bus Vehicle Data

42
Figure D.9. Input Dialog Box 9 --Bus Station Data
Figure D.JO. Tnput Dialog Box 10-- Bus Operating Data

43
Figure D.11. Input Dialog Box 11 --Other Data

44
OU~PU? (C:\CIEFENG\SA\SAl 3.0U?)
1. Auto and/or Bus
Roadway Sec~ion (~ain Lane):
Annual Cost (in S/yr) Mode
FaciliLy CosL Trave: Time Cost Air Pol1uLior. Cost Incident Delay CosL Accident Cost Other Ex~erna1 Cost User/Agency Cos~
Highway Facili~y Cost
by Modes Auto & Pickup
1,357,815 154' 227' 152
7,122,664 4,336,406 1, 133,764 7,075,810
44,609,696
Bus 53,765
1,363,939 8,106
34, 97: 0
21, 4 69 361,448
2
Truc:-c ?ocal ,032,292 2,4.:;3,872 ,678,~60 176,269,552 ,533,710 8,66S,L:80
581,349 1;,952,726 182,394 l' 316, 58 9s8,60~ 8,045,880
A 44,971, 41; v
Annual Cost ($/yr) 0
~n ~ial Lu~p-s~m ($)
Right-of-way Cost of Preparing Roadway-Bed Sho~lder, Sewer, Signage, LighLing Cost of InLerchange/InLersection Pavement Cost RehabiliLation COSL Annual Main~enance CosL Cost of AdminisLraLion, SafeLy, etc.
?ravel ~ime Cost (in S/yr) of Different Period (Direction) Auto & Pickup
Weekday AM Peak (1) 13,453,163 (2. 199) Weekday PM Peak (l) 13,453,:63 (2 .199) Weekday Day ( 1) 46,783,644 (1.033) Weekday Night. ( 1) 360,566 (0. 098) Weekend AM Peak ( 1) 0 (0. 000) Weekend PM Peak ( 1) 0 (0. 000) Weekend :Jay ( l) 2, 954' 542 (0.170) Weekend Nigh:. ( 1) ::.08,507 (0. 098) Weekday AM Peak (2) 2.3,453,163 (2. l99) Weekday PM Peak (2) 13,453,163 (2 .199) Weekday Day (2) 46,783,644 (1.033) Weekday Night (2) 360,566 (0. 098) Weekend AM Peak (2) 0 (0. 000) Weekend PM Peak (2) 0 (0.000) Weekend Day (2) 2,954,542 ( 0. 17 0) Weekend Night (2) 108,507 (0. 098)
63,851 870,698 759,527 197,745
78,164 136,800 337,086
Periods (Unit: CosL: Bus
113, lOS (2. 2 92) 113,105 (2. 2 92) 411,416 (1.127)
5,675 (0.192) 0 (0. 000) 0 (0. coo)
36,955 (0.263) 1,713 (0 .191)
ll3,105 (2. 292) 113,105 (2. 292) 411,416 (1.127)
5, 67 5 (0.192) 0 (0.000) 0 (0. 000)
36,955 (0. 2 63) 1' 713 (0.191)
60:,928 8,288,080
, ~60, OC8 :,864,122
S ;p:.:Tl ':::::uck
2.,803,8:!.5 (2. 199) :,803,815 (2. 199) 6,272,803 (1.033)
48,345 (0.098)
" (0. 000) v
J ( 0. 000) 395,911 (0 .170)
14,548 (0. 098) 1,803,8'5 (2. l99) 1,803,815 (2. 99) 6,272,803 ( 1. 033)
48,3.;5 (0. 098) 0 ( 0. OCOJ 0 (0. 000)
395,91: ( 0. 17 0) 14,540 { 0 4 098}
Po:lution Cost (in S/yr) of Differen:. Periods (Unit Cost: S/?:'1T) Period (DirecLion) AULD & Pickup Bus ':'reck
weekday AM Peak (:) 557,514 ( 0. 091) 555 (0. 011) ·os,474 j r'\ ~...., c \ tv . .... L.;;i
Weekday PM Peak (1) 557,514 (0.091) 555 (0. 01:.) 105,474 (0. 12 9) Weekday Day ( l) 2, 126,376 (0. 047) 2 r 164 (0. 006) 400,797 ( ~. C66) Weekday Night { l) 67,328 (0. 0 18) 12:. (0. 004) 29,453 (0. 060) Weekend AfVT Peak (' \ 0 (0.000) 0 (0. 000) " (O.COC}
" I v
Weekend PM Peak (::.) 0 (C. 000) 0 (c. 000) "· (G. 000) v
Weekend Day (' \ '-I 231, 742 (0.013) 621 (0.004) :16,651 ( 0. 050) Weekend Nigh:. ( 1) 20,857 ( 0. 019) 37 (0 .004) 9,00:' (0. 060) Weekday AM Peak (2) 557,514 ( 0. 091) 555 ( 0. 011) :85,474 ( J. 12 9) Weekday PM Peak (2) 557,514 (0 .091) 555 (0. 011) :J5, 04 (0. l29) Weekday Day (2) 2,l26,376 ( 0. 04 7) 2, 164 (0. 006) t;08, 797 (0. 066) Weekday Night (2) 67,328 (0. 018) 121 (0 .004) 29,453 ( 0. 060) Weekend AM Peak (2) 0 (0.000) 0 (0.000) J ( 0. 000) Weekend PM Peak (2) 0 (0. 000) 0 (0.000) A (0. COO) v
Weekend Day (2) 231,742 (0. 013) 621 (0.004) _16,651. (0. 050) Weekend Nigl:t: (2) 20,857 ( 0. 019) 37 (0.004} 9,007 (0. 060)

Cost Year
2 3 4 5 6 7 8 9
10 l1 12 l3 14 15 l6 17 18 19 20 21 22 23 24 25 26 27 28 29 30
{rr:i.:..lion S) Facilicy
1.358 1 358 1.358 1.358 l. 358 1.358 1.358 1. 358 1.358 1.358 l. 358 l. 358 1.358 1.358 1.358 l. 358 1.358 •. 358 1.358 1.358 1.358 l. 358 1. 3 58 l. 358 l. 358 1.358 1.358 ::..358 1.358 1. 358
Cost (millior. S) Year Facility
1 c.occ 2 0.080 3 0.000 4 0.000 5 0.000 6 0.000 7 0.000 8 0.000 9 0.000
10 0.000 11 0.000 12 0.000 13 0.000
4 0.000 15 0.000 16 0.000 17 0.000 18 0.000 19 0.000 20 0.000 21 0.000 22 0.000 23 0.000 24 0.000 25 0.000 26 0.000 27 0.000 28 C~OCO
29 o.occ 30 0.000
by year and by categories: Auto Time Air Pollu~ Inci Delay 39.259 2.499 3.649 4' .868 2.601 3.722 ~4.605 2.708 3.797 47.474 2.820 3.872 50.482 2.938 3.950 53.636 56.940 60. 4 0 3 64.031 67.832 71.8:!.4 75.984 80.353 84.927 89.7 8 94.735 99.988
115.208 216.:J2l 322.829 435.917 555.574 682. :i09 815.840 957.098
1106.232 1263.604 1473.778 1701.299 1941.372
3.060 3.189 3. 32 3 3.463 3.610 3.764 3. 92 5 4.093 4.269 4. 4 53 4. 64 6 4.847 5.377 9.535
13.701 8.252
23.133 28.329 33.843 39.681 45.854 52.377 61.067 70.377 80.284
4.029 4.109 4.192 4. 27 6 4.361 4.448 4.537 4. 62 8 4.721 4.815 4. 911 5.009 5.110 5.212 5.316 5.422 5. 5 31 5.641 5.754 5.869 5.987 6.106 6. 22 9 6.353 6.480
Main Lane Accicent
0.954 0. 97 3 0.993 1. 012 1.033 1.053 1.074 l.G-96 1.118 1.140 :. 16 3 1.186 1.210 1.234 1. 259 1.284 1.310 1. 336 1.363 1.390 1.418 1. 4 4 6 l. 4 7 5 1. 504 1. 535 1.565 1.597 1. 62 8 1.66i 1.694
0y year a~d by categories: Aucc HOV Lane TiDe Air Pc11uc Inci Delay Acciden_
O.C80 O.OOC 0.000 O.CC8 0.008 0.000 0.000 0.008 0.000 0.000 0.000 0.000 0.000 0.000 0.000 0.000 0.000 0.000 0.000 0.000 0.000 0.000 0.000 0.000 0.000 0.000 0.000 0.000 0.000 0.000 0.000 0.000 0.000 0.000 0.000 0.000 0.000 0.000 0.000 0.000 0.000 0.000 0.000 0.000 0.000 0.000 0.000 0.000 0.000 0.000 0.000 0.000 0.000 0.000 0.000 0.000 0.000 0.000 0.000 0.000 0.000 0.000 0.000 0.000 0.000 0.000 0.000 0.000 o.ccc 0.000 0.000 0.000 0.000 0.000 0.000 0.000 0.000 c.coo r. fit"<("' v.vvv
G.OOC c.ccc
O.GOG 0.000 0.000 0.000 0.000 0.000 0.000 0.000 0.000 0.000 o.occ o.co:; O.OOJ
0.000 0.000 0.000 0.000 0.000 0.000 0.000 0.000 0.000 0.000 c.oco 0.000 0.000
0.000 0.000 0.000 0.000 0.000 0.000 0.000 0.000 0.000 ('\ i")r.f\ v.vvv
o.oc:; O.OC:J ("\ .""./"\(', v.Vvv
:::xt:.ernal 5.954 6.073 6.2.95 5.3 9 6.445 6.5 4 6.7J6 5.840 6. 97 6 /.ll6 7.238 7.483 7.552
.703 7.857 8.014 8.174 8.338 8.504 8.674 8.848 9. 025
9.577 9 0 7 69 9.964
_0.367 C.574
2.8JC .-. !"\"'.('\ v,vJV ..... ('\!"',,.,
v.vvu
:.o::o ~.o:::o
c.oso c.ooo o.o:;o c.oco 0.08C 0.000 0.0 0 O.OJO /"\ 1"\'"\1"\ v. v ,,.,..,
C.880 ~.880 8.08C C.8CO C.OJC 0.000 C.C80 c.coc D.OCC O.OJC 8. 0~'0 .--, !'\'"'~"" v.v,;v ,..._ 1'\'"\t'> v*vvv
Use:::/Age 37.539 38.290 39.036 39.837 40.634 t;l.~n
<;2.275 0 .l2" 0. 983 ~~.863 45.760 46. 67 5 ~7.609
.:;8~56
t;9.532
5 . 53{ 52.56~
53.615 54.688 55.782 56.897 :;8.0-l:J 59.196 60.380 61.587 62 . 819 6C075 65.357 66.55t;
User/Age c.o c C.OC8 o.ccc G~O~
.occ 0.000 0.000 0.000 0.000 c.ooa 0.000 0.000 0.000 0.000 C.8CO 0.000 0.000 C.008 o.ooc 0.000 0.000 0.000 0.000 C.OJC 0.800 C~08C
c.ooc C.8C0 C.OJO
45

46
Cost (million $) by year and by categories: B:Js ;;lain Lane Year Facility T irr.e Air Pollut Inci Delay Acciden:. :=:x:.ernal User/Age
1 0.054 0.4::..8 0.006 0.029 0.000 0.018 0.304 2 0.054 0.441 0.006 0.030 0.000 0.018 0.32.0 3 0.054 0.465 0.006 0. 03::.. 0.000 0.019 0.3::..6 4 0.054 0. 4 90 0.006 0.031 0.000 0.019 0.323 5 0.054 0.517 0.006 0.032 0.000 0.020 0. 32 9 6 0.054 0.544 0.006 0.032 0.000 0.020 0.336 7 0.054 0.573 0.006 0.033 0.000 0.020 0.343 8 0.054 0.603 0.007 0.034 0.000 C.02l 0. 34 9 9 0.054 0.635 0.007 0.034 0.000 0. 021 0.356
10 0.054 0.668 0.007 0.035 0.000 0.022 0.36<: 11 0.054 0.702 0.007 0.036 0.000 0.022 0. 3-, l 12 0.054 0.739 0.007 0.037 0.000 0.022 0.378 13 0.054 0.776 0.007 0.037 0.000 0.023 0.386 14 0.054 0.816 0.008 0.038 0.000 0.023 0.393 15 0.054 0.857 0.008 0.039 0.000 0.024 0.401 16 0.054 0.900 0.008 0.040 0.000 0.024 0.(09 17 0.054 0.945 0.008 0.040 0.000 0.025 0.418 18 0.054 1.071 0.009 0.041 0.000 0.025 0. 42 6 19 0.054 1.887 0.013 0.042 0.000 8. 02 6 0.04 20 0.054 2.751 0.015 0. 04 3 0.000 c. 02 6 0.443 21 0.054 3.666 0.016 0.044 0.000 0.027 0.452 22 0.054 4.634 0.017 0.045 0.000 8.027 0.461 23 0.054 5.657 0. 018 0.045 0.000 0.828 c. 4 7 0 24 0.054 6.739 0.019 0. 04 6 0.000 0.028 0. 88 25 0.054 7.881 0.020 0.047 o.oco ~. 02 9 0.489 26 0.054 9.087 0.022 0.048 0.000 8.830 0.499 27 0.054 0.360 0. 023 0. 04 9 0.000 ~ 30 0.509 v.
28 0.054 2.058 0. 02 6 0.050 0.000 8.831 0.519 29 0.054 3. 896 0.028 0.051 0.000 8.03: C.53C 30 0.054 5.836 0.030 0.052 0.000 0.032 0.548
Cost {millior. $) by year ar.d by categories: Bus HOV Lane Year Facility Time Air Polluc. Inci Delay Accider.:. ::x:.erna.;. Jse:::/Age
1 0.000 0.000 0.000 0.000 0.000 0.000 0.000 2 0.000 0.000 0.000 0.000 0.000 0.000 o.ooc 3 0.000 0.000 0.000 0.000 0.000 O.O:JO 0.000 4 0.000 0.000 0.000 0.000 0.000 S.028 r-. 0"'-('"1
1...:. vv v
5 o.oco Q.OOC 0.000 0.000 0.000 C.OJO 0.008 6 0.000 0.000 0.000 0.000 0.000 0.000 0.000 7 0.000 0.000 0.000 0.000 0.000 0.000 0.000 8 0.000 0.000 0.000 0.000 0.000 :.oco c.occ 9 0.000 0.000 0.000 0.000 0.000 0.000 0.000
::..o 0.000 c.coo 0.000 0.000 0.000 0.000 0.000 1::.. 0.000 0.000 0.000 0.000 0.000 8. Q::JQ 0.000 12 0.000 0.000 0.000 0.000 0.000 0.000 0.000 :3 0.000 0.000 0.000 0.000 0.000 8.880 0.008 14 0.000 0.000 0.000 0.000 0.000 0.000 0.000 15 0.000 0.000 (). 000 0.000 0.000 8~8JO C.08C • c 0.000 " ""~ 0.000 0.000 0.000 8.080 c ,...,....,(\ .o.O v.vvu .vvv
17 0.000 0.008 0.000 0.000 0.000 r\ I"\."\ r'l c.ooo v.Vvv
18 0.000 0.000 0.000 0.000 0.000 ::.:: J 0 C.OOQ ::..9 0.000 11 (\f'i(\ 0.000 0.000 0.000 0 I"',."',.., C r_n "''<
v.vvu v. v-..)V ~vvv
20 0.000 0.000 0.000 0.000 0.000 8.088 8.000 21 0.000 0.000 0.000 0.000 0.000 " 1"'\,'\1"1 0.000 v.vvv
22 0.000 0.000 0.000 0.000 0.000 0.000 0.000 23 0.000 0.000 0.000 0.000 0.000 0.000 0.000 24 0.000 o.cco 0.000 0.000 0.000 c.coo 0.000 25 0.000 0.000 0.000 0.000 0.000 0.000 0.000 26 0.000 0.000 0.000 0.000 0.000 c ~ 8-J 0 0.000 27 0.000 0.000 0.000 0.000 0.000 """ .Vv'v c.coo 28 0.000 0.000 0.000 0.000 0.000 "~~ C.8C8 .vvv
29 0.000 c.oco 0.000 0.000 0.008 /"',?'\r, • V\..: V c.cos
30 0.000 c.oco 0.000 0.000 0.000 . Q:JC C:.008

Cost Year
1 2 3 4 5 6 7 8 9
lO l1 12 :3 14 15 16 17 18 19 20 21 22 23 24 25 26 27 28 29 30
(million S) Fac lity
0.000 0.000 0.000 0.000 0.000 0.000 0.000 0.000 0.000 0.000 0.000 0.000 0.000 0.000 0.000 0.000 0.000 0.000 0.000 0.000 0.000 0.000 0.000 0.000 0.000 0.000 0.000 0.000 0.000 0.000
by year and by caLegcries: Rail :ime Ai~ ?c 1 lu~ Inci Delay
0.000 0.000 0.000 0.000 0.000 0.000 0.000 0.000 0.000 O.JCC 0.000 0.000 0.000 0.000 0.000 0.000 0.000 0.000 0.000 0.000 0.000 0.000 0.000 0.000 0.000 0.000 0.000 o.occ o.ooc 0.000
0.000 0.000 0.000 0.000 0.000 0.000 0.000 0.000 0.000 0.000 0.000 0.000 0.000 0.000 0.000 0.000 0.000 0.000 0.000 0.000 0.000 0.000 0.000 0.000 0.000 0.000 0.000 0.000 0.000 0.000 0.000 0.000 0.000 0.000 0.000 0.000 0.000 0.000 0.000 0.000 0.000 0.000 0.000 0.000 0.000 0.000 0.000 0.000 0.000 0.000 0.000 0.000 0.000 0.000 0.000 0.000 0.000 0.000 0.000 0.000
Acciden~ 0.000 0.000 0.000 0.000 0.000 0.000 0.000 0.000 0.000 0.000 0.000 0.000 0.000 0.000 0.000 0.000 0.000 0.000 0.000 0.000 0.000 0.000 C~C88
C.C00 0.000 o.ooc 0.000 0.088 0.000 0.008
0.000 8.0~
0.000 J.G~O
0.000 0.000 0.000 0.000 8.080 0.000 0.000
.000 0.000 0.000 ().coo 0.000 8.000 8.000 8.0 0 ~.8~0
C~OCO
8~880 8.0~C ~, 1'\ ""!", v.vvv '"' li""li v.u....;V
c.ooo 8.808 0.800 C.C 0
Vse~/Age
o.coo c.occ 0.000 C.OOG 0.000 0.000 0.000 0.000 0.000
1'\ r,r..r.. v~vvv
o.cco 0. r. 0"'"'~ li. vv v
0.000 0.000 0.000 0.00
.000 0.000 0.000 0.000 c.ooc 0.000 c.coo 1'\ ~'"'~ ''\r. v.vvv
c.coo " " " v.v v
O.OJ o.ooc
47