application of a technology assignment process at the
TRANSCRIPT
Tenth International Conference on Remediation and Management of Contaminated Sediments
February 11‐14, 2019 New Orleans, LA
February 13, 2019
Application of a Technology Assignment Process at the Hunters Point Naval Shipyard Site
Eric Blischke

Site Background

Site Background – Hunters Point Naval Shipyard Former naval shipyard in San
Francisco Site operations resulted in releases
of PCBs, copper, mercury, and lead to San Francisco Bay
Site designated for closure by the Navy in 1991
Sediment investigations and assessments were conducted between 1996 and 2013
Feasibility Study completed in 2017 Proposed plan issued in 20183
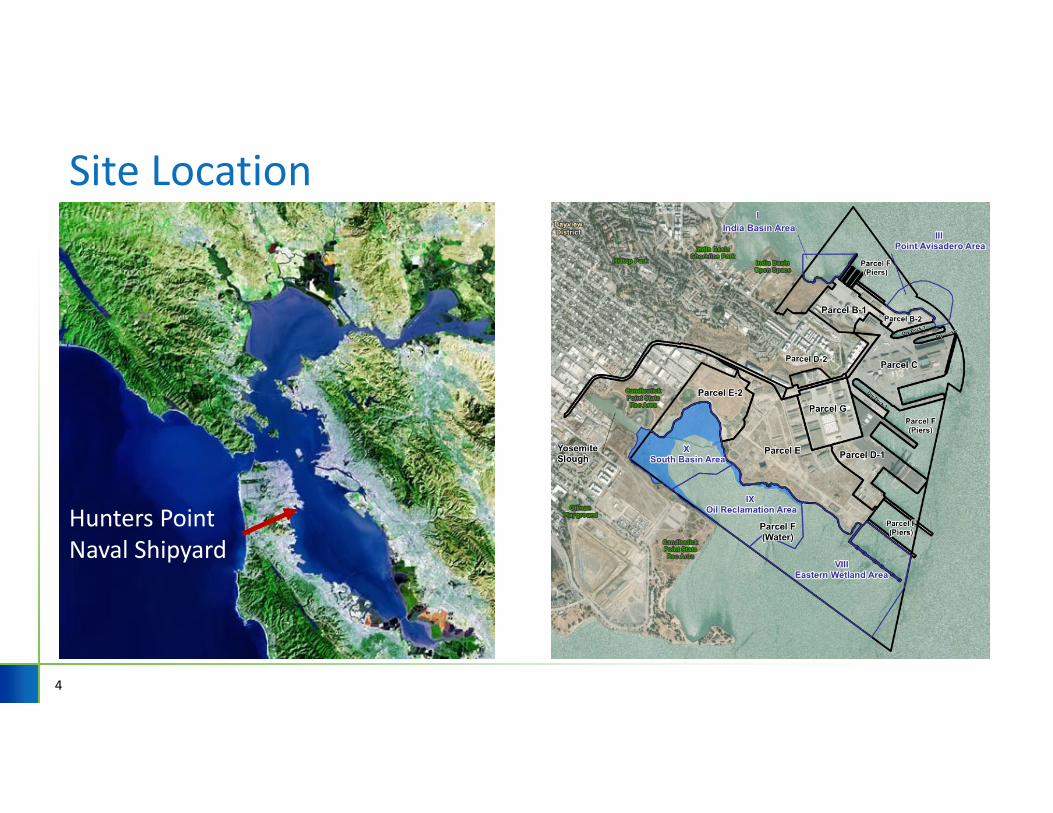
Site Location
4
Hunters Point Naval Shipyard
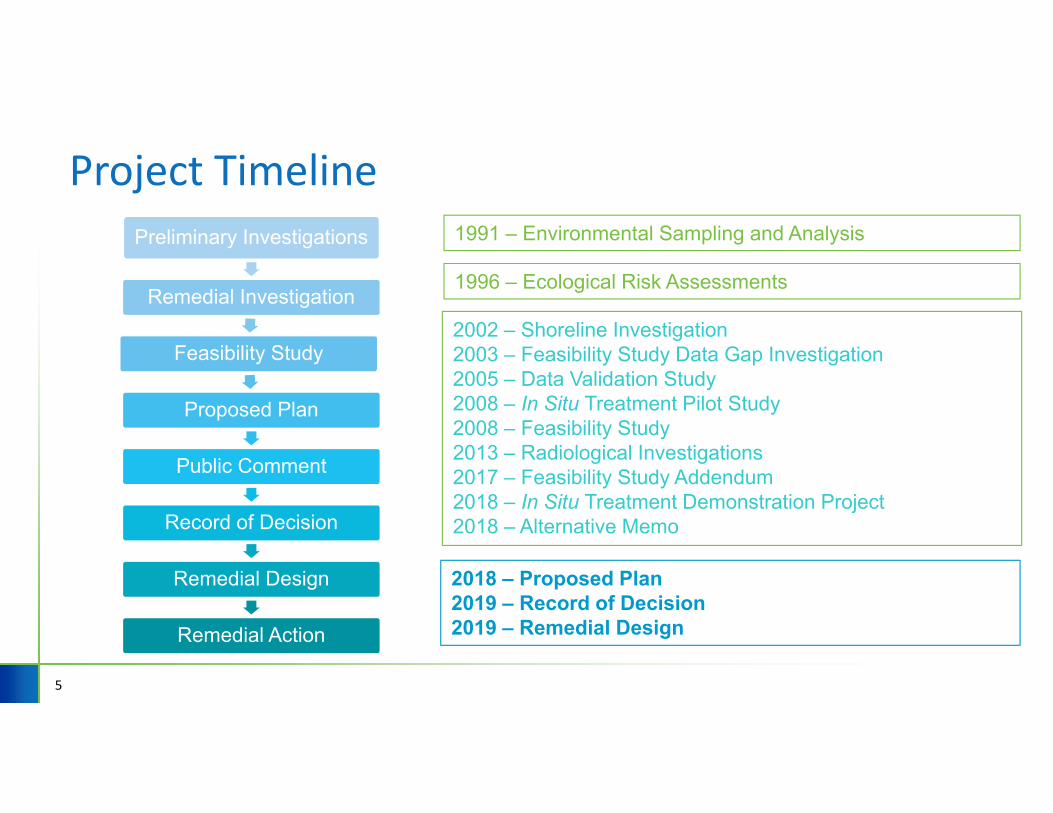
Project Timeline
5
Preliminary Investigations
Remedial Investigation
Feasibility Study
Proposed Plan
Public Comment
Record of Decision
Remedial Design
Remedial Action
2002 – Shoreline Investigation2003 – Feasibility Study Data Gap Investigation2005 – Data Validation Study2008 – In Situ Treatment Pilot Study2008 – Feasibility Study2013 – Radiological Investigations2017 – Feasibility Study Addendum2018 – In Situ Treatment Demonstration Project2018 – Alternative Memo
2018 – Proposed Plan2019 – Record of Decision2019 – Remedial Design
1996 – Ecological Risk Assessments
1991 – Environmental Sampling and Analysis

Basis for Technology Assignment Approach EPA Contaminated Sediment Guidance (USEPA 2005)
No presumptive remedy for contaminated sediment sites Site characteristics should be reviewed to ensure that the selected alternative will
be effective Alternatives that combine a variety of approaches are frequently the most
promising Guidance provides tables of site, sediment, and contaminant characteristics that
should be considered when characterizing a sediment site
ITRC Contaminated Sediments Remediation Guidance (ITRC 2014) Provides guidance for selecting appropriate remedial technologies based on site‐
specific conditions Chemical, sediment, biological, and land and water way use characteristics
6

Optimized Remedial Alternative Incorporates new information
Updated PRG for fish consumption exposure pathway Advances in the application of in situ treatment to contaminated sediments
Based on systematic method for assigning remedial technologies (dredging, capping, in situ treatment, and MNR) Consider range of site‐specific factors relevant to the effectiveness and
implementability of remedial technologies
Uses technology assignment process to develop optimized remedial alternative
Optimized alternative evaluated against previously developed remedial alternatives
7
Technology Assignment Approach

Remedial Action Objectives
9
RAO Description
RAO 1 Reduce the risk of benthic feeding and piscivorous birds, including surf scoters, to acceptable levels from exposure to copper, lead, mercury, and total PCBs through the consumption of contaminated prey and incidental ingestion of sediment
RAO 2 Limit or reduce the potential risk to human health from the consumption of shellfish from Parcel F
RAO 3 Limit or reduce the potential biomagnifications of total PCBs at higher trophic levels in the food chain to reduce the potential risk to human health from the consumption of sport fish

Preliminary Remediation Goals
10
RAOCopper (mg/kg)
Lead (1) (mg/kg)
Mercury (mg/kg)
Total PCBs (µg/kg)
Basis
RAO 1 271 NA 1.87 1240 Not to exceed threshold
RAO 2 NA NA NA 1350 Area‐weighted average
RAO 3 NA NA NA (2) Area‐weighted average
1. A numerical PRG was not developed for lead due to uncertainty associated with the bioavailability and toxicity of this analyte
2. 200 µg/kg total PCBs represents a long‐term goal based on background total PCB estimates for nearshore sediments within San Francisco Bay

Area III Alternative Summary
11
Alternative Description FS Effectiveness Ranking
Cost ($M)
1 No Action Not Protective $0
2 Removal/Backfill and Off‐Site Disposal Low‐Medium $12.2
3 Focused Removal/Backfill, Off‐Site Disposal, Armored Cap, and ICs
Medium‐High $10.2
3A Focused Removal/Backfill, Off‐Site Disposal, AquaBlok® Cap, and ICs
Medium‐High $12.6
4 Focused Removal/Backfill, Off‐Site Disposal, Modified Armored Cap, and ICs
Medium $5.8
4A Focused Removal/Backfill, Off‐Site Disposal, Modified Aquablok® Cap, and ICs
Medium $7.3

Areas IX and X Alternative Summary
12
Alternative Description FS Effectiveness Ranking Cost ($M)
1 No Action Not Protective $0
2 Removal/Backfill and Off‐Site Disposal Medium $31.6
3 In‐Situ Stabilization (Treatment) and ICs Low $14.4
4 MNR and ICs Low‐Medium $2.1
5 Focused Removal/Backfill, Off‐Site Disposal, MNR, and ICs
High $16.6
5A Focused Removal/Activated Backfill, Off‐Site Disposal, MNR, and ICs
High $21.7
6 Focused Removal/Backfill, Modified Shoreline Removal/Backfill, Off‐Site Disposal, MNR, and ICs
High $16.9
6A Focused Removal/Activated Backfill, Modified Shoreline Removal/Backfill, Off‐Site Disposal, MNR, and ICs
High $22.4

Technology Assignment Framework COC Sediment Concentrations
Active remediation will be required for all sediments exceeding the RAO 1 PRGs
Water Depth and Hydrodynamics Strong tidal currents offshore of Point Avisadero (Area III) may limit the
effectiveness of in situ treatment Hydrodynamic studies found wave action to be the most significant mode
of sediment resuspension in the South Basin In situ treatment may not be effective for intertidal sediments subject to
wave induced erosion. In situ treatment is expected to be effective in the more stable subtidal
sediments within the South Basin
13

Technology Assignment Framework Natural Recovery Rate
Hydrodynamic evaluations determined that the South Basin is generally depositional – approximately 1 cm per year
Natural recovery was simulated using the SEDCAM model (Jacobs et al., 1988)
SEDCAM assumes that reductions in sediment concentrations are the result of deposition and mixing with the sediment bed
𝐶 𝑡 𝐶 𝑝 1 𝑒 / 𝐶 0 𝑒 /
Constructability Shoreline considerations Optimized alternative applies remedial technologies contiguously to
increase efficiency during construction
14

Reduction in HPNS Sediment PCBs – Area X
15
0.0000
0.0500
0.1000
0.1500
0.2000
0.2500
0.3000
0.3500
0 5 10 15 20 25 30 35 40 45 50
Total P
CBs (m
g/kg)
Time (Years)
PCB at time (t) [mg/kg] Background PCB Level [mg/kg]
Post‐Construction Surface Sediment PCB Sediment Concentration = 0.329 mg/kgSediment Deposition Rate = 0.5 cm/yearSediment Mixing Depth = 4 cmIncoming Sediment Concentration = 0.121 mg/kgBackground PCB Level = 0.200 mg/kgTime to background = 8 years

Technology Assignment Results

Technology Assignment Results Area III: Optimized alternative was not deemed necessary due to
limited remedial footprint and concentration levels Intertidal Sediments within Area IX and X:
Removal and backfill of all intertidal sediments exceeding the RAO 1 PRGs Subtidal Sediments within Areas IX and X:
All subtidal sediments with metals exceeding the RAO 1 PRGs will be remediated through removal
Based on an assumed 90% reduction in bioavailability, subtidal sediment with PCBs exceeding 12,400 µg/kg (10X the RAO 1 PRG) will be remediated through removal and backfill
Subtidal sediments with PCBs between 1,240 µg/kg and 12,400 µg/kg will be remediated through in situ treatment
Subtidal sediments between 200 µg/kg and 1,240 µg/kg will be remediated through MNR
17

18

19

Optimized Alternative Benefits The optimized remedial alternative incorporates the in situ treatment of
contaminated sediments to a larger degree in conjunction with other remedial technologies
The optimized alternative removes intertidal sediments above not‐to exceed PRGs where in situ treatment may not be effective due to the presence of metals and the potential for wave‐induced erosion
The optimized alternative was evaluated against the NCP evaluation criteria and identified as the preferred remedial alternative in the Proposed Plan for Parcel F sediments at the HPNS Site
This alternative is expected to effectively reduce site risks by removing significant amounts of COCs and safely contain or treat the remaining contaminants
20