application: 2005-2006, no child left behind - blue · web view2005-2006 no child left behind...
TRANSCRIPT

Revised - March 7, 2006
2005-2006 No Child Left Behind - Blue Ribbon Schools Program
U.S. Department of Education
Cover Sheet Type of School: (Check all that apply) X Elementary __ Middle __ High __ K-12 __Charter
Name of Principal Mrs. Donna Hoover (Specify: Ms., Miss, Mrs., Dr., Mr., Other) (As it should appear in the official records)
Official School Name Tarpon Springs Fundamental Elementary School (As it should appear in the official records)
School Mailing Address 400 E. Harrison Street____________________________________(If address is P.O. Box, also include street address)
__Tarpon Springs ___________________________________________________Florida_________________34689-_4599______City State Zip Code+4 (9 digits total)
County Pinellas State School Code Number* 524661 Telephone ( 727 ) 943-5508 Fax ( 727 ) 942-5443
Website/URL www.tarponfund-es.pinellas.k12.fl.us E-mail [email protected]
I have reviewed the information in this application, including the eligibility requirements on page 2, and certify that to the best of my knowledge all information is accurate.
Date____________________________(Principal’s Signature)
Name of Superintendent* Dr. Clayton Wilcox (Specify: Ms., Miss, Mrs., Dr., Mr., Other)
District Name Pinellas Tel.( 727 ) 586-1818
I have reviewed the information in this application, including the eligibility requirements on page 2, and certify that to the best of my knowledge it is accurate.
Date____________________________ (Superintendent’s Signature)
Name of School Board President/Chairperson Mrs. Carol J. Cook________________________________________________
(Specify: Ms., Miss, Mrs., Dr., Mr., Other)
I have reviewed the information in this package, including the eligibility requirements on page 2, and certify that to the best of my knowledge it is accurate.
Date____________________________(School Board President’s/Chairperson’s Signature)
2005-2006 Application Page 1 of 26

PART I - ELIGIBILITY CERTIFICATION
The signatures on the first page of this application certify that each of the statements below concerning the school's eligibility and compliance with U.S. Department of Education, Office for Civil Rights (OCR) requirements is true and correct.
1. The school has some configuration that includes grades K-12. (Schools with one principal, even K-12 schools, must apply as an entire school.)
2. The school has not been in school improvement status or been identified by the state as "persistently dangerous" within the last two years. To meet final eligibility, the school must meet the state’s adequate yearly progress requirement in the 2005-2006 school year.
3. If the school includes grades 7 or higher, it has foreign language as a part of its core curriculum.
4. The school has been in existence for five full years, that is, from at least September 2000 and has not received the 2003, 2004, or 2005 No Child Left Behind – Blue Ribbon Schools Award.
5. The nominated school or district is not refusing the OCR access to information necessary to investigate a civil rights complaint or to conduct a district-wide compliance review.
6. The OCR has not issued a violation letter of findings to the school district concluding that the nominated school or the district as a whole has violated one or more of the civil rights statutes. A violation letter of findings will not be considered outstanding if the OCR has accepted a corrective action plan from the district to remedy the violation.
7. The U.S. Department of Justice does not have a pending suit alleging that the nominated school, or the school district as a whole, has violated one or more of the civil rights statutes or the Constitution's equal protection clause.
8. There are no findings of violations of the Individuals with Disabilities Education Act in a U.S. Department of Education monitoring report that apply to the school or school district in question; or if there are such findings, the state or district has corrected, or agreed to correct, the findings.
NCLB-BRS 2005-2006 Application Page 2 of 26

PART II - DEMOGRAPHIC DATA
All data are the most recent year available. DISTRICT (Questions 1-2 not applicable to private schools)
1. Number of schools in the district: 82 Elementary schools 22 Middle schools 0 Junior high schools 16 High schools 6 Other 126 TOTAL
2. District Per Pupil Expenditure: $6,167
Average State Per Pupil Expenditure: $6,483
SCHOOL (To be completed by all schools)
3. Category that best describes the area where the school is located:
[ ] Urban or large central city[ ] Suburban school with characteristics typical of an urban area[X ] Suburban[ ] Small city or town in a rural area[ ] Rural
4. 15 Number of years the principal has been in her/his position at this school.
If fewer than three years, how long was the previous principal at this school?
5. Number of students as of October 1 enrolled at each grade level or its equivalent in applying school only:
Grade # of Males
# of Females
Grade Total
Grade # of Males
# of Females
Grade Total
PreK 7K 14 26 40 81 17 28 45 92 20 26 46 103 24 22 46 114 27 29 56 125 31 24 55 Other6
NCLB-BRS 2005-2006 Application Page 3 of 26

TOTAL STUDENTS IN THE APPLYING SCHOOL 288
NCLB-BRS 2005-2006 Application Page 4 of 26

[Throughout the document, round numbers to avoid decimals.]
6. Racial/ethnic composition of 89 % Whitethe students in the school: 6 % Black or African American
2 % Hispanic or Latino 3 % Asian/Pacific Islander % American Indian/Alaskan Native 100% Total
Use only the five standard categories in reporting the racial/ethnic composition of the school.
7. Student turnover, or mobility rate, during the past year: 1 %
[This rate should be calculated using the grid below. The answer to (6) is the mobility rate.]
(1) Number of students who transferred to the school after October 1 until the end of the year.
4
(2) Number of students who transferred from the school after October 1 until the end of the year.
3
(3) Total of all transferred students [sum of rows (1) and (2)]
7
(4) Total number of students in the school as of October 1
288
(5) Total transferred students in row (3) divided by total students in row (4)
.01
(6) Amount in row (5) multiplied by 100 1
8. Limited English Proficient students in the school: 0 % 1 Total Number Limited English Proficient
Number of languages represented: 1 Specify languages: Japanese
9. Students eligible for free/reduced-priced meals: 6 %
Total number students who qualify: 18 If this method does not produce an accurate estimate of the percentage of students from low-income families or the school does not participate in the federally-supported lunch program, specify a more accurate estimate, tell why the school chose it, and explain how it arrived at this estimate.
NCLB-BRS 2005-2006 Application Page 5 of 26

10. Students receiving special education services: 14 % 40 Total Number of Students Served
Indicate below the number of students with disabilities according to conditions designated in the Individuals with Disabilities Education Act. Do not add additional categories.
____Autism 1 Orthopedic Impairment____Deafness 6 Other Health Impaired____Deaf-Blindness 12 Specific Learning Disability 2 Emotional Disturbance 18 Speech or Language Impairment____Hearing Impairment ____Traumatic Brain Injury____Mental Retardation ____Visual Impairment Including Blindness
1 Multiple Disabilities
11. Indicate number of full-time and part-time staff members in each of the categories below:
Number of Staff
Full-time Part-Time
Administrator(s) 1 ________
Classroom teachers 13 ________
Special resource teachers/specialists 3 6
Paraprofessionals _______ ________
Support staff _______ 9
Total number 17 15
12. Average school student-“classroom teacher” ratio, that is, the number of students in the school divided by the FTE of classroom teachers: 22:1_
13. Show the attendance patterns of teachers and students as a percentage. The student dropout rate is defined by the state. The student drop-off rate is the difference between the number of entering students and the number of exiting students from the same cohort. (From the same cohort, subtract the number of exiting students from the number of entering students; divide that number by the number of entering students; multiply by 100 to get the percentage drop-off rate.) Briefly explain in 100 words or fewer any major discrepancy between the dropout rate and the drop-off rate. Only middle and high schools need to supply dropout rates and only high schools need to supply drop-off rates.
2004-2005 2003-2004 2002-2003 2001-2002 2000-2001Daily student attendance 95% 96% 96% 96% 96%Daily teacher attendance 96% 95% 97% 96% 96%Teacher turnover rate 5% 5% 15% 5% 15%
NCLB-BRS 2005-2006 Application Page 6 of 26

Student dropout rate (middle/high) % % % % %Student drop-off rate (high school) % % % % %
NCLB-BRS 2005-2006 Application Page 7 of 26

PART III - SUMMARY
Established in 1980, Tarpon Springs Fundamental Elementary School was one of the first fundamental schools in Pinellas County, Florida. The doctrine of fundamental policy is that all teachers, parents, and students must sign a commitment letter agreeing to abide by all established school board policies, attend monthly PTA meetings, attend three parent conferences, adhere to a more stringent dress code, support a four night-a-week homework policy (parents sign the homework nightly), and provide transportation to and from school. Even with these additional requirements, we have a waiting list for each grade level we service. All Pinellas County elementary children are encouraged to enroll through our district’s Choice Program. Student registration is awarded by a blind computer lottery held before parents have to make their final school choice for the new school year. Students not selected by the lottery are held in a waiting list and are contacted when an opening becomes available. Our school has a very stable population; over 90% percent of our kindergarteners graduate from our school as fifth graders.Our students, parents, staff and community are united in helping us pursue our school mission – “to maintain our structured, nurturing learning environment in order to encourage optimum achievement for all students.” Faithfulness to this mission is demonstrated by the extraordinary parental participation in our volunteer program. While we have less than 160 families in our school, over 8,000 volunteer hours were logged in last year’s records. These volunteers were curriculum mentors, teacher assistants, library media aides, cafeteria or clinic helpers, program developers, food preparers for teacher workshops, technology “gophers,” and workers on various committees. They served the school in direct student contact as well as in easing the detail load for teachers so that teachers could spend more time with students. They raised money for programs, developed programs, and helped implement programs under the instruction of our professional staff. Through their help and the help of our nine local businesses, we are able to inspire our students to succeed to their highest potential. Our community partners are also integral to our students success: The Citizen’s Alliance for Progress and Cops and Kids work with us to provide remediation for our students who attend their after-school programs; the YMCA provides before and after-school care along with extra curricular programs such as yoga, dance, and Spanish instruction; the Tarpon Springs Chamber of Commerce honors students of the month by hosting a monthly luncheon; Carrabbas Restaurants supplement gift certificate purchases for staff recognition; the Tarpon Springs Police Department authored a grant allowing us to have a resource officer on campus; and Entenmann’s Bakery donates food items for various student and staff events. The Tarpon Springs Fundamental staff takes these community resources and high parental involvement and uses these strengths to create an environment where students can receive exactly what they need in order to thrive. Students are monitored with performance diagnosis throughout their stay at our school. If they are under performing, the data will show deficiencies and a cadre of professionals will pinpoint the problem(s) and devise strategies to help the child overcome learning challenges. But, concern is not limited only to those not succeeding. All students are monitored to be sure they are motivated to achieve to the best of their abilities. Tarpon Springs Fundamental Elementary believes that to be successful in educating our population we must also create an opportunity for them to learn to live harmoniously by promoting teamwork, focusing on responsibility and mutual respect, and by demonstrating to students that they must take responsibility for their own learning. To promote these tenets we give the students opportunities to work on committees to help the less fortunate (collections for hurricane victims, food banks at Thanksgiving, toy drives for Christmas, etc.), provide them with real life problems to solve (care of the landscape around the school, growing a garden, etc.), inspire them to be risk-takers, and encourage them to ask questions when they do not understand. While Tarpon Springs Fundamental has maintained an “A” grade by the rigorous Florida grading system, we do not hold this as our highest honor. That distinction is given when our many returning students come back to us with success stories, particularly the ones that come through our halls as newly certified
NCLB-BRS 2005-2006 Application Page 8 of 26

teachers. PART IV – INDICATORS OF ACADEMIC SUCCESS
1. Assessment Results in Reading and Math:
Our state website providing information about Florida’s educational assessment system may be found at: www.firn.edu/doe/sas/fcat.htm
The Florida Comprehensive Assessment Test (FCAT) is part of Florida’s overall plan to increase student achievement by implementing higher standards. The FCAT, administered to students in Grades 3-11, contains two basic components: 1. Criterion-referenced tests (CRT) which measure selected benchmarks in mathematics, reading, science, and writing from the Sunshine State Standards (SSS); and 2. Norm-referenced tests (NRT) in reading and mathematics which measure individual student performance against national norms. The Sunshine State Standards portion of the FCAT measures the curriculum benchmarks established by the Florida State Board of Education. The assessment includes performance-based questions in grades 3 through 5 which require students to write responses or explain a solution for solving a mathematical problem. FCAT scores are reported in five Achievement Levels. If a student’s Achievement Level improves from one year to the next, that student has clearly made progress. A student also makes progress by scoring within the same Achievement Level for two years in a row. This is because the content assessed at the higher grade is more difficult. Students who score at Levels 3, 4, or 5 are performing at or above expectations and meet the requirements of the Sunshine State Standards. Students who score in Level 1 and Level 2 are performing below expectations and need additional instruction in the content assessed at his or her grade. The Stanford Achievement Test 10, published by Harcourt Assessment, is the currently used norm-referenced test (NRT) to compare the performance of Florida students to the performance of students across the nation. This battery of tests is delivered to Florida students in early March each year. Using the information from these tests, Florida public schools are graded using a scale of “A” to “F”. Tarpon Springs Fundamental has consistently scored “A” for five of the six years the test has been used. Adequate Yearly Progress (AYP), as required by No Child Left Behind, has also been achieved by our school since its implementation.
Tarpon Springs Fundamental has consistently scored above both state and county levels since the inception of the FCAT. The table below provides the percent of students at our school scoring 3 and above in FCAT reading and mathematics assessments.
Grade Level
Reading Scores Math Scores
2001 2002 2003 2004 2005 2001 2002 2003 2004 2005
3 NA 84 91 89 96 NA 89 83 87 91
4 79 80 97 91 95 NA 76 92 88 93
5 NA 84 89 93 94 75 66 81 77 92
NA indicates the test was not given for that year or grade level, or achievement levels had not been established.
Tarpon Springs Fundamental does not have enough students in any of the No Child Left Behind subgroups to comprise a group large enough to gather data. 100% of our 3-5 grade students took the FCAT assessment, but only our white student population was reported in the NCLB Adequate Yearly Progress report. Looking at all of our scores, the results indicate all 9 students at Level 1 or Level 2 in
NCLB-BRS 2005-2006 Application Page 9 of 26

2004 and all 7 students in 2005 made 10% gain in both reading and math. We are particularly impressed with the gain made by all students in their math scores.
2. Using Assessment Results:
Our assessment action plan begins in April for the following school year. Teachers, specialists, and administrators meet for cross grade level discussions of individual students. This series of meetings help the present teacher provide continuity for the child’s next teacher. During these discussions, the present teacher reviews the status (academic, maturity, and special needs levels) of each of her students to both of the teachers in the next grade. This information, as well as all the assessment information generated over the preceding year, is passed on to the new teacher. The upper level teacher will then have a basis for planning individual student expectations for the next school year. During this time period the faculty is busy putting the final touches on its School Improvement Plan. The plan reflects activities the staff feels should be modified to enhance academic achievement for the upcoming school year.
Over the course of the school year, the students are formally assessed in reading, writing and math five times. This data is used to generate spreadsheets and graphs for each student, as well as class and grade level reports. The teachers use this information as they meet in a professional learning community format to discuss individual, class and grade level data. Then each grade level devises an action plan and reports it to the whole faculty. Based on these results, specialists and grade level teachers meet weekly to discuss individual students and make any necessary modifications to the daily curriculum delivery schedules needed to promote success.
Our administrator monitors the students scoring in the lower 35% on the FCAT assessment as well as those students showing academic problems in grades K-2. A service matrix is devised so that an Academic Improvement Plan can be created for each of these students. Additional testing is administrated to these students. Some examples of assessments used include: Diagnostic Indicators of Basic Early Literacy Skills (DIBELS), Diagnostic Assessment of Reading (DAR), and the Early Readiness Diagnostic Assessment (ERDA). These tests provide a more specific description of learning impediments, helping to pinpoint the problems experienced by our lower 35% so that early remediation can keep these students on track.
3. Communicating Assessment Results:
Florida schools receive data on FCAT scores just before the end of the school year. This data sheet reports the student’s individual scores, comparing them to last year’s test results and to the state norm. The report shows how the student did on each component within the test. Our scores are posted on the state FCAT website, the Pinellas County Schools website, and in the local newspapers. Parents receive individual printouts of their child’s scores with information that demonstrates how to judge the child’s success on the tests.
Over the course of the school year assessments are shared with the school population in a variety of manners. Progress reports are distributed to the children’s parents three times during the school year. Midterm reports are provided within each term. Parents have three mandatory formal conferences with teachers during the year, but teachers are available daily for follow-up discussions. During the school year parents are required to attend eight PTA meetings. During these meetings parents are exposed to informative sessions related to the school’s curriculum, services available for students, methods of helping students with learning at home, demonstration of curriculum delivery, and comparative assessment data. This information allows them to understand how their child is progressing within the school’s curriculum. Graphs and charts are posted in the classrooms that monitor student achievement. Students are able to see their progress, write goals, and build portfolios. Students at all grade levels are responsible for planning a student-led conference where they present to their parents their portfolio work, progress reports, and projects, then explain how their work reflects the grade they received. This format has been very successful, as both parent and child come to a better understanding of expectations when
NCLB-BRS 2005-2006 Application Page 10 of 26

they have to verbalize them to each other.Communication between parents and teachers takes place daily through planners sent home with
the evening’s homework assignment. Teachers and parents are free to make any concerns known as this tool passes between them. On Fridays, a communication envelope travels home and returns on Monday. This is a vehicle that allows more specific and lengthy weekly messages between parents and teachers.
4. Sharing Success:
Tarpon Springs Fundamental teachers are a very active group within our district. They attend curriculum meetings where they share best practices used in our classrooms, give presentations for parental groups, and attend training and articulation meetings with other fundamental school faculties. Our teachers and specialists welcome beginning, intermediate, and final interns into their classrooms each year so that the expertise displayed in their classroom will be duplicated by future professionals in the field. Not only do they attend district and state conferences, they also participate by providing break out sessions and presenting papers. Most of our teachers have long standing memberships in a variety of professional organizations, many of them having served as officers and committee chairs. Teachers also serve as mentors in the district’s beginning teacher program, lead professional learning committees, and compile lists of successful learning strategies to be shared with other teachers. Our principal attends the district’s monthly Principal’s Meeting where ideas are freely shared.
Our school’s School Improvement Plan is posted on the state website allowing other schools to see how Tarpon Springs Fundamental plans for success. Our plan details the strategies we will employ for the next school year and we welcome other schools to take our ideas and build on them.
Our school is also open for visitation. Parents have advertised our success throughout the community, resulting in many inquiries for visits from outside groups. The latest call has been from a school in Nashville, Tennessee. The principal and two teachers arrived in December to visit our facility and talk to our instructors. Our staff welcomes all chances for collaboration, for any contact with other educators will only result in good ideas and practices to be developed for everyone involved.
PART V – CURRICULUM AND INSTRUCTION
1. Curriculum:
The Florida State Legislature has mandated that all public school curriculums be delivered through the specific benchmarks provided in the Sunshine State Standards. Teachers are required to adhere to these benchmarks and document evidence of having taught them by citing them in their daily lesson plans. Pinellas County Schools provides teachers with a website that not only organizes the standards, but also indicates our district’s Essential Learnings. These Essential Learnings are aligned with the Sunshine State Standards, Pinellas County Grade Level Expectations, and Pinellas County’s Strategic Directions and Goals. The Essential Learnings encompass and prioritize all student achievement and require that students be proficient in reading, writing, mathematics, and science. They are identified by grade level and include common assessments that are administered five times a year to monitor student growth and mastery. This assessment framework provides remedial activities for students with low scores as well as opportunities for students who have demonstrated mastery.
Language arts: Our curriculum delivery demands a 90 minute, uninterrupted period each day for the teaching of reading. The teachers use this time to teach phonemic awareness, phonics, fluency, vocabulary, and comprehension. Writing is taught during the writing workshop section of the school day. The writer’s workshop period is divided into several components: instructional, where teachers provide direct instruction through a mini-lesson; quiet writing and conferencing time with individual students, where students practice what has been taught by composing, revising, and editing their work; and sharing
NCLB-BRS 2005-2006 Application Page 11 of 26

time, which is when students share their work in pairs or with the entire class. Our district has further fine-tuned writing instruction by introduction units of study. These units provide teachers with instructional teaching points to enhance student writing skills.
Math: Our curriculum focuses on five content strands: (1) Number sense, concepts and operations; (2) Measurement – understanding units and processes of measurement and applying techniques, tools, and formulas to determine measurements; (3) Geometry and special sense – analyzing characteristics of two and three-dimensional shape; (4) Algebraic thinking – understanding patterns, relations, and functions; and (5) Data analysis and probability – collecting, organizing and displaying relevant data to answer questions. Focusing on higher level questioning, per Bloom’s Taxonomy, encourages students to apply what they have learned on a more advanced level as they learn to be competent and competitive mathematicians.
Social Studies: Our curriculum includes the study of patriotism, history, current events, heritage, heroes, citizenship, and geography. Through social studies, students learn to clarify, think critically, read for detail and main idea, explain ideas, predict, summarize, describe, retell and support ideas. Our Multi-Cultural Club allows students to participate in projects that explore other cultures through speakers, movies, and games. Our character education activities teach students to hold class meetings to solve interrelationship problems equitably and to develop personal characteristics of honesty, motivation, respect, and responsibility.
Science: Effective science learning enables our students to connect and apply science concepts and processes to everyday events. Students learn science by being actively engaged in the following ways: quantitative and qualitative observations, investigation of thoughtful questions, designing and conducting experiments and other types of investigations, collecting and organizing data, making logical predictions and offering reasonable explanations, exploring possible conclusions, and communicating their understanding.
The Arts: Our art and music curriculum incorporates the Florida Sunshine State Standards in the Arts. Both art and music curriculums stress skills and technique instruction, cultural and historical connections, and aesthetic and critical analysis. Our students receive 40 minutes of art and 20 minutes of music instruction once a week from teachers who are certified and highly qualified in their subject areas. Our students participate in two musical performances a year that showcase our 4th and 5th grade choruses, our violin class, and the instrumental talents of all of our students. Art students participate in weekly art displays located throughout the school building. At the end of the year the art instructor displays art work covering the entire school year at a Parents Celebrate Art night.
2. Reading:
The reading program at Tarpon Springs Fundamental insures student learning by using direct and indirect instruction, large group instruction, small group instruction, individual instruction, and by incorporating technology resources and skills. Our teachers use a balanced literacy program for at least 90 uninterrupted minutes a day. This program has five components: (1) WordWork, a method of teaching phonics and other principles of word construction, provides students with instruction and practice to foster word recognition and meaning. (2) Read Aloud, where the teacher chooses favorite texts and passages to read to students, provides one of the critical factors in students becoming successful and fluent readers. (3) Shared Reading, or students reading to students, allows teachers to show students how to read and then support them in the reading process. (4) Guided Reading, where students read challenging text, encourages discussion and reflection and gives the teacher a vehicle for teaching more about the reading process. (5) Independent Reading, where students select their own reading materials, gives daily, extended periods of reading time to develop the persistence and stamina needed for optimum performance.
The tools our teachers use for delivery of this instruction includes the Harcourt Brace textbook series Trophies, Scholastic’s computer software Reading Counts!, Lexiled classroom libraries (so students can select appropriately leveled books), and FCAT Explorer (state website providing FCAT practice).
NCLB-BRS 2005-2006 Application Page 12 of 26

Students are provided a print rich environment, including classroom word walls, reading centers, cooperative learning techniques, and assistance in building reading endurance.
Classroom teachers and specialists meet weekly to evaluate student performance data in order to insure that instruction challenges or remediates individual students as necessary. Specific student needs are addressed as differentiating instruction plans are developed for providing for each student’s needs.
3. Mathematics:
Students in all grades, kindergarten through 5th, practice skills and concepts in each of the five content strands. The curriculum has a spiral design so students receive continued exposure to critical content at increasing levels of challenge as they progress through the grades. There are five standards that describe how the content is taught: (1) Problem Solving or engaging in tasks for which the solution method is not known in advance; (2) Reasoning and Proof or learning to think analytically; (3) Communication or sharing ideas and clarifying understanding; (4) Representation or understanding ways in which mathematical ideas are represented; and (5) Connections or understanding how mathematical ideas interconnect and build on one another. To facilitate math curriculum delivery, our teachers use the 8-step Continuous Improvement Model as well as the Essential Learnings Calendar and Common Assessments. Teachers model reasoning and problem solving skills and strategies as well as provide manipulatives for student use during instruction. Instruction includes the use of math journals and technology programs (Harcourt Math on-line resources, Harcourt Math electronic assessments and networked software including Destination Math and FCAT Explorer). Supplemental student support and challenge is provided with the use of Every Day Counts Calendar Math, Roads to Reasoning and continuous implementation of Harcourt Math components. The textbook used by the students is Harcourt Brace’s Math.
To guide mathematics instruction and to document that all students are achieving to their potential, teachers use Pinellas County’s Common Assessment, Harcourt electronic assessments, and FCAT 2005 mathematics data. As the results of these evaluations are received (Common Assessments are received three times a year, FCAT once a year, and Harcourt electronic assessment data is ongoing at the teacher’s professional desecration based on specific needs), teachers are able to monitor all students’ progress, adapt instruction to meet all students’ needs, and evaluate the success of the instruction of our mathematics objectives.
4. Instructional Methods:
Based on the Plan-Do-Study-Act of the Continuous Improvement Model, our teachers strive to meet the individual student’s needs in all areas of the curriculum. They have at their fingertips best practices, research-based strategies, scientifically based teaching methods, and problem solving skills lessons ready to assist students through the Sunshine State Standards and the Essential Learnings for their grade level. The teachers must follow the county’s pacing calendars for reading, math, and science, but they may employ any teaching method that meets their student’s learning style to meet that goal. Students are tested at the beginning of the year to see how they best process information and then the teachers use this information to choose methods of curriculum delivery.
Classroom teachers have a variety of technology to deliver curriculum. They have wireless SchoolPads that allow them to operate their computers from any part of the room. Visual information (movies, TV broadcasts, DVDs, computer programs, or overhead projections) are projected through a ceiling mounted LCD projector. This insures that all students have a clear and close-up view of the information presented. Each teacher has a laptop computer for curriculum delivery and three computers for student access to FCAT Explorer, Reading Counts!, the internet, and various networked, curriculum based software. Teachers and students also have access to two computer labs, one located in the media center with 30 workstations, and another on a rolling cart with 29 laptops that may be used in any of the
NCLB-BRS 2005-2006 Application Page 13 of 26

classrooms.Teachers on the same grade level collaboratively plan instructional units, delivery methods and
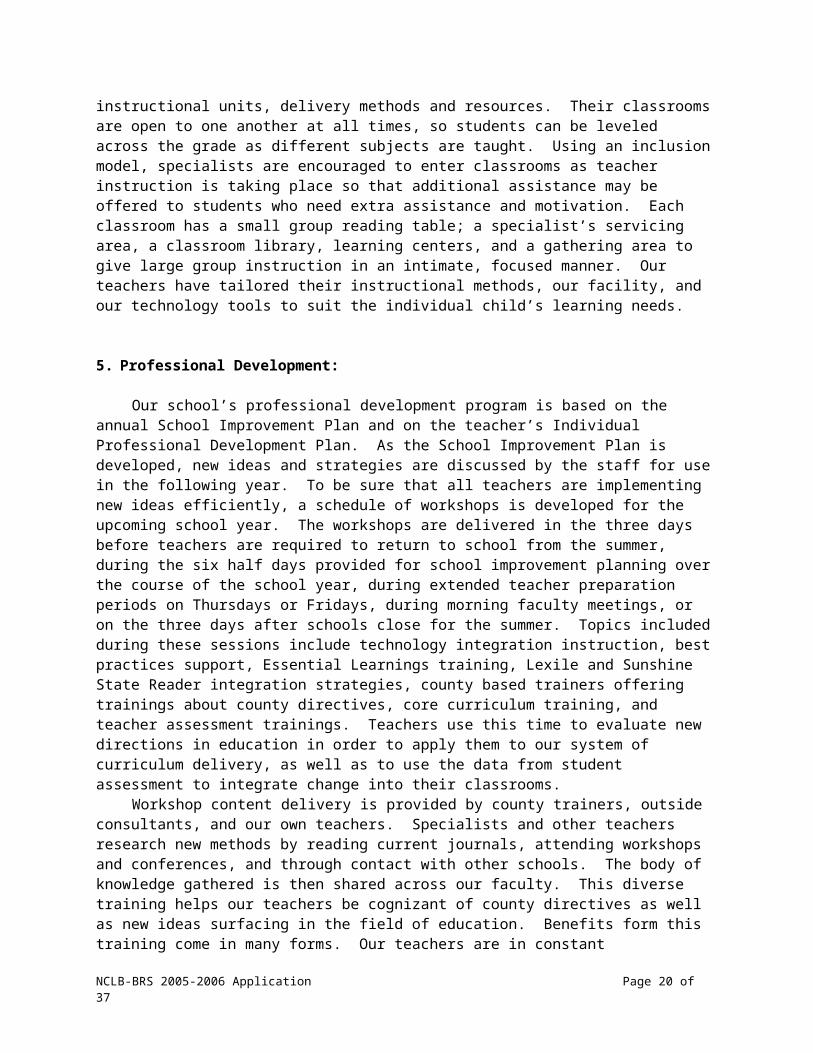
resources. Their classrooms are open to one another at all times, so students can be leveled across the grade as different subjects are taught. Using an inclusion model, specialists are encouraged to enter classrooms as teacher instruction is taking place so that additional assistance may be offered to students who need extra assistance and motivation. Each classroom has a small group reading table; a specialist’s servicing area, a classroom library, learning centers, and a gathering area to give large group instruction in an intimate, focused manner. Our teachers have tailored their instructional methods, our facility, and our technology tools to suit the individual child’s learning needs.
5. Professional Development:
Our school’s professional development program is based on the annual School Improvement Plan and on the teacher’s Individual Professional Development Plan. As the School Improvement Plan is developed, new ideas and strategies are discussed by the staff for use in the following year. To be sure that all teachers are implementing new ideas efficiently, a schedule of workshops is developed for the upcoming school year. The workshops are delivered in the three days before teachers are required to return to school from the summer, during the six half days provided for school improvement planning over the course of the school year, during extended teacher preparation periods on Thursdays or Fridays, during morning faculty meetings, or on the three days after schools close for the summer. Topics included during these sessions include technology integration instruction, best practices support, Essential Learnings training, Lexile and Sunshine State Reader integration strategies, county based trainers offering trainings about county directives, core curriculum training, and teacher assessment trainings. Teachers use this time to evaluate new directions in education in order to apply them to our system of curriculum delivery, as well as to use the data from student assessment to integrate change into their classrooms.
Workshop content delivery is provided by county trainers, outside consultants, and our own teachers. Specialists and other teachers research new methods by reading current journals, attending workshops and conferences, and through contact with other schools. The body of knowledge gathered is then shared across our faculty. This diverse training helps our teachers be cognizant of county directives as well as new ideas surfacing in the field of education. Benefits form this training come in many forms. Our teachers are in constant communication on curriculum related topics, which keeps our educational goals forefront in their minds. Staff members work in cooperative learning teams to do book studies. Over the past two years our faculty has read Professional Learning Communities at Work by DuFour, Art of Teaching, by Calkins, The 7 Habits of Highly Effective People by Covey, and Classroom Discussions Using Math Talk to Help Students Learn by Chapin. Using cooperative learning groups as a means of information delivery, builds mutual respect and dialog within groups of colleagues. When teachers have open communication, they will find a wider variety of methods to solve problems, particularly ones dealing with student achievement. By learning together, our staff has created a learning environment that has accelerated student achievement.
NCLB-BRS 2005-2006 Application Page 14 of 26

Tarpon Springs Fundamental ElementaryFlorida Comprehensive Assessment Test (FCAT) Sunshine State Standards (SSS)
State Criterion-Referenced Test
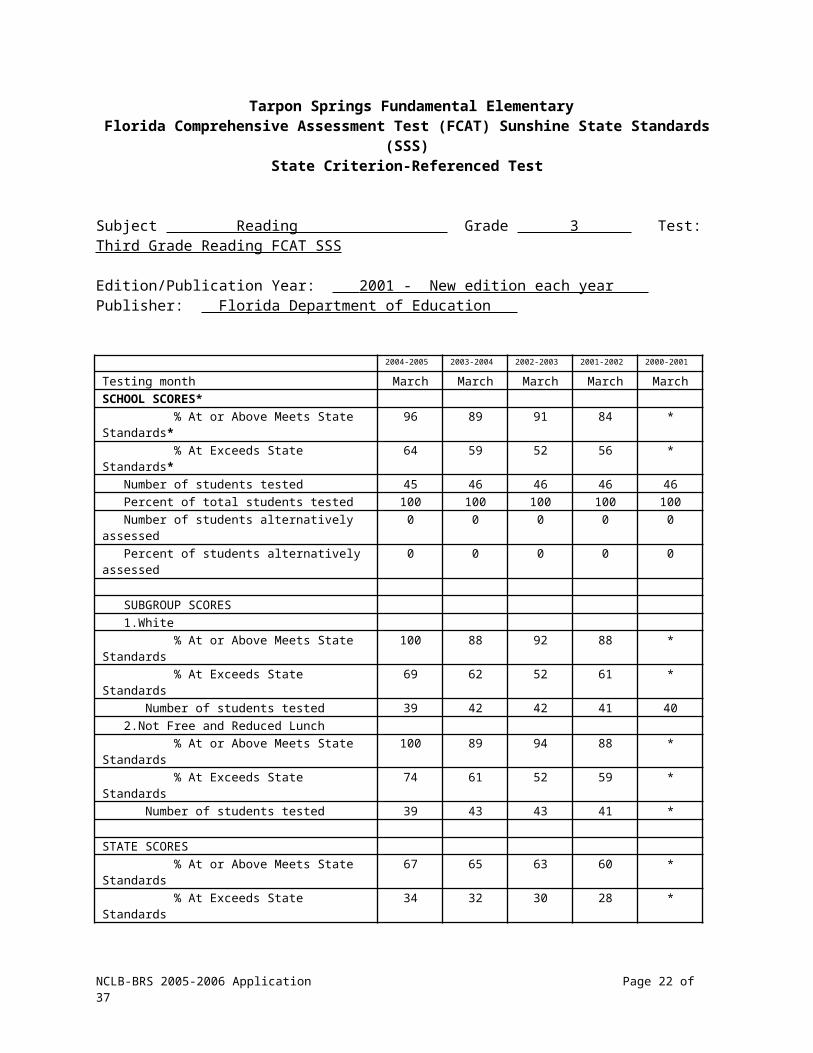
Subject Reading Grade 3 Test: Third Grade Reading FCAT SSS
Edition/Publication Year: 2001 - New edition each year Publisher: Florida Department of Education
2004-2005 2003-2004 2002-2003 2001-2002 2000-2001
Testing month March March March March MarchSCHOOL SCORES* % At or Above Meets State Standards* 96 89 91 84 * % At Exceeds State Standards* 64 59 52 56 * Number of students tested 45 46 46 46 46 Percent of total students tested 100 100 100 100 100 Number of students alternatively assessed 0 0 0 0 0 Percent of students alternatively assessed 0 0 0 0 0 SUBGROUP SCORES 1.White % At or Above Meets State Standards 100 88 92 88 * % At Exceeds State Standards 69 62 52 61 * Number of students tested 39 42 42 41 40 2.Not Free and Reduced Lunch % At or Above Meets State Standards 100 89 94 88 * % At Exceeds State Standards 74 61 52 59 * Number of students tested 39 43 43 41 * STATE SCORES % At or Above Meets State Standards 67 65 63 60 * % At Exceeds State Standards 34 32 30 28 *
*Data not gathered during this testing period
Tarpon Springs Fundamental ElementaryFlorida Comprehensive Assessment Test (FCAT) Sunshine State Standards (SSS)
NCLB-BRS 2005-2006 Application Page 15 of 26

State Criterion-Referenced Test
Subject Reading Grade 4 Test: Fourth Grade Reading FCAT SSS
Edition/Publication Year: 2001 – New edition each year Publisher: Florida Department of Education
2004-2005 2003-2004 2002-2003 2001-2002 2000-2001
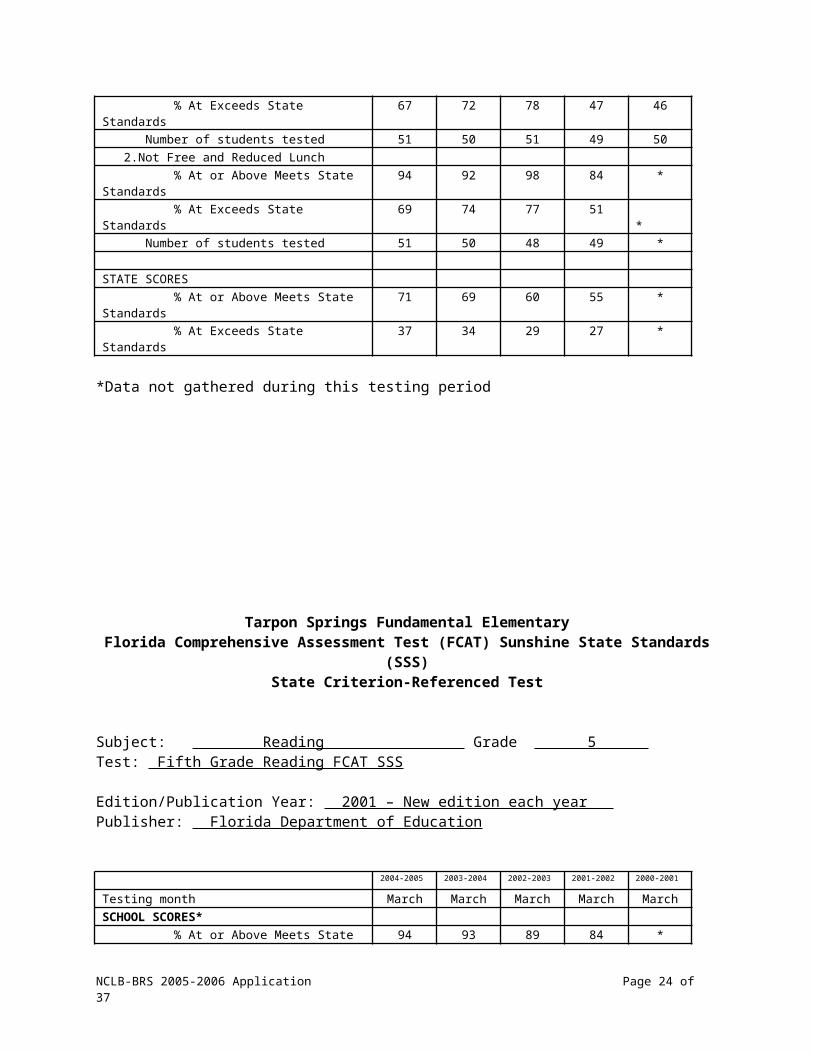
Testing month March March March March MarchSCHOOL SCORES* % At or Above Meets State Standards* 95 91 97 80 79 % At Exceeds State Standards* 67 69 77 44 43 Number of students tested 56 56 55 56 56 Percent of total students tested 100 100 100 100 100 Number of students alternatively assessed 0 0 0 0 0 Percent of students alternatively assessed 100 100 100 100 100 SUBGROUP SCORES 1.White % At or Above Meets State Standards 94 92 98 84 80 % At Exceeds State Standards 67 72 78 47 46 Number of students tested 51 50 51 49 50 2.Not Free and Reduced Lunch % At or Above Meets State Standards 94 92 98 84 * % At Exceeds State Standards 69 74 77 51 * Number of students tested 51 50 48 49 * STATE SCORES % At or Above Meets State Standards 71 69 60 55 * % At Exceeds State Standards 37 34 29 27 *
*Data not gathered during this testing period
Tarpon Springs Fundamental ElementaryFlorida Comprehensive Assessment Test (FCAT) Sunshine State Standards (SSS)
State Criterion-Referenced Test
NCLB-BRS 2005-2006 Application Page 16 of 26

Subject: Reading Grade 5 Test: Fifth Grade Reading FCAT SSS
Edition/Publication Year: 2001 – New edition each year Publisher: Florida Department of Education
2004-2005 2003-2004 2002-2003 2001-2002 2000-2001
Testing month March March March March MarchSCHOOL SCORES* % At or Above Meets State Standards* 94 93 89 84 * % At Exceeds State Standards* 66 65 59 52 * Number of students tested 51 57 56 56 56 Percent of total students tested 100 100 100 100 100 Number of students alternatively assessed 0 0 0 0 0 Percent of students alternatively assessed 100 100 100 100 100 SUBGROUP SCORES 1.White % At or Above Meets State Standards 96 92 90 84 * % At Exceeds State Standards 64 68 61 53 * Number of students tested 45 51 49 49 50 2.Not Free and Reduced Lunch % At or Above Meets State Standards 96 92 91 88 * % At Exceeds State Standards 67 65 62 58 * Number of students tested 45 49 52 47 * STATE SCORES % At or Above Meets State Standards 66 59 58 53 * % At Exceeds State Standards 33 28 25 23 *
*Data not gathered during this testing period
Tarpon Springs Fundamental ElementaryFlorida Comprehensive Assessment Test (FCAT) Sunshine State Standards (SSS)
State Criterion-Referenced Test
NCLB-BRS 2005-2006 Application Page 17 of 26

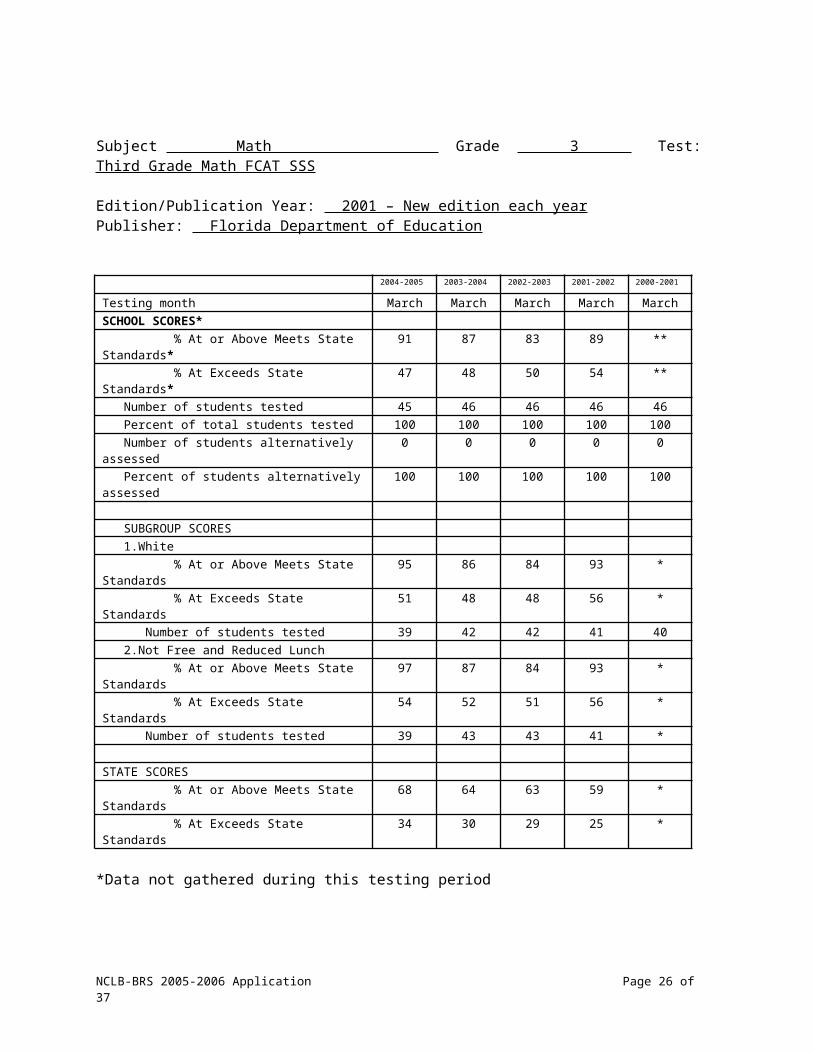
Subject Math Grade 3 Test: Third Grade Math FCAT SSS
Edition/Publication Year: 2001 – New edition each yearPublisher: Florida Department of Education
2004-2005 2003-2004 2002-2003 2001-2002 2000-2001
Testing month March March March March MarchSCHOOL SCORES* % At or Above Meets State Standards* 91 87 83 89 ** % At Exceeds State Standards* 47 48 50 54 ** Number of students tested 45 46 46 46 46 Percent of total students tested 100 100 100 100 100 Number of students alternatively assessed 0 0 0 0 0 Percent of students alternatively assessed 100 100 100 100 100 SUBGROUP SCORES 1.White % At or Above Meets State Standards 95 86 84 93 * % At Exceeds State Standards 51 48 48 56 * Number of students tested 39 42 42 41 40 2.Not Free and Reduced Lunch % At or Above Meets State Standards 97 87 84 93 * % At Exceeds State Standards 54 52 51 56 * Number of students tested 39 43 43 41 * STATE SCORES % At or Above Meets State Standards 68 64 63 59 * % At Exceeds State Standards 34 30 29 25 *
*Data not gathered during this testing period
Tarpon Springs Fundamental ElementaryFlorida Comprehensive Assessment Test (FCAT) Sunshine State Standards (SSS)
State Criterion-Referenced Test
Subject Math Grade 4 Test: Fourth Grade Math FCAT SSS
Edition/Publication Year: 2001 – New edition each year
NCLB-BRS 2005-2006 Application Page 18 of 26

Publisher: Florida Department of Education
2004-2005 2003-2004 2002-2003 2001-2002 2000-2001
Testing month March March March March MarchSCHOOL SCORES* % At or Above Meets State Standards* 93 88 92 76 * % At Exceeds State Standards* 65 49 54 35 * Number of students tested 56 56 55 56 56 Percent of total students tested 100 100 100 100 100 Number of students alternatively assessed 0 0 0 0 0 Percent of students alternatively assessed 100 100 100 100 100 SUBGROUP SCORES 1.White % At or Above Meets State Standards 92 90 92 80 * % At Exceeds State Standards 65 46 55 37 * Number of students tested 51 50 51 49 50 2.Not Free and Reduced Lunch % At or Above Meets State Standards 94 90 92 80 * % At Exceeds State Standards 67 48 59 39 * Number of students tested 51 50 48 49 * STATE SCORES % At or Above Meets State Standards 64 63 54 51 * % At Exceeds State Standards 27 26 20 19 *
*Data not gathered during this testing period
Tarpon Springs Fundamental ElementaryFlorida Comprehensive Assessment Test (FCAT) Sunshine State Standards (SSS)
State Criterion-Referenced Test
Subject Math Grade 5 Test: Fifth Grade Math FCAT SSS
Edition/Publication Year: 2001 – New edition each yearPublisher: Florida Department of Education
NCLB-BRS 2005-2006 Application Page 19 of 26
2004-2005 2003-2004 2002-2003 2001-2002 2000-2001
Testing month March March March March MarchSCHOOL SCORES* % At or Above Meets State Standards* 92 77 81 66 75 % At Exceeds State Standards* 64 58 38 41 39 Number of students tested 56 57 56 56 56 Percent of total students tested 100 100 100 100 100 Number of students alternatively assessed 0 0 0 0 0 Percent of students alternatively assessed 100 100 100 100 100 SUBGROUP SCORES 1.White % At or Above Meets State Standards 93 83 82 70 80 % At Exceeds State Standards 64 61 39 43 44 Number of students tested 45 51 49 49 50 2.Not Free and Reduced Lunch % At or Above Meets State Standards 93 81 81 71 * % At Exceeds State Standards 64 59 41 43 * Number of students tested 45 49 52 47 * STATE SCORES % At or Above Meets State Standards 57 52 48 48 % At Exceeds State Standards 30 28 25 26
*Data not gathered during this testing period
Tarpon Springs Fundamental ElementaryFlorida Comprehensive Assessment Test (FCAT) Results
REFERENCED AGAINST NATIONAL NORMS
Grade 3 Test Reading FCAT NRT
Florida Comprehensive Assessment Test (FCAT), norm-referenced test (NRT) – The reading comprehension and mathematics problem solving portions of the Stanford Achievement Test Series,
NCLB-BRS 2005-2006 Application Page 20 of 26

Ninth Edition is a Customized Secure Form; revised and modified annually for Florida, selected to be administered to Florida students, in grades 3-10.
Edition/Publication Year: Stanford Achievement Test Series Ninth Edition, Customized Secure Form, revised and modified annually for Florida.
Publisher: Harcourt Educational Measurement
Scores are reported here as (check one): NCEs____ Scaled scores ____ Percentiles X
2004-2005 2003-2004 2002-2003 2001-2002 2000-2001
Testing month March March March March MarchSCHOOL SCORES Total Score 73 84 81 81 79 Number of students tested 45 46 46 46 46 Percent of total students tested 100 100 100 100 100 Number of students alternatively assessed 0 0 0 0 0 Percent of students alternatively assessed 100 100 100 100 100 SUBGROUP SCORES 1.White 77 82 81 84 80 Number of students tested 39 42 42 41 40 2..Not Free/Reduced Lunch 78 84 81 80 * Number of students tested 39 43 43 42 *
* Data not gathered during this testing period
Tarpon Springs Fundamental ElementaryFlorida Comprehensive Assessment Test (FCAT) Results
REFERENCED AGAINST NATIONAL NORMS
Grade 4 Test Reading FCAT NRT
Florida Comprehensive Assessment Test (FCAT), norm-referenced test (NRT) – The reading comprehension and mathematics problem solving portions of the Stanford Achievement Test Series, Ninth Edition is a Customized Secure Form; revised and modified annually for Florida, selected to be
NCLB-BRS 2005-2006 Application Page 21 of 26
administered to Florida students, in grades 3-10.
Edition/Publication Year: Stanford Achievement Test Series Ninth Edition, Customized Secure Form, revised and modified annually for Florida.
Publisher: Harcourt Educational Measurement
Scores are reported here as (check one): NCEs____ Scaled scores ____ Percentiles X
2004-2005 2003-2004 2002-2003 2001-2002 2000-2001
Testing month March March March March MarchSCHOOL SCORES Total Score 77 80 87 80 80 Number of students tested 56 56 54 56 56 Percent of total students tested 100 100 100 100 100 Number of students alternatively assessed 0 0 0 0 0 Percent of students alternatively assessed 100 100 100 100 100 SUBGROUP SCORES 1.White 77 81 88 81 82 Number of students tested 51 50 50 49 50 2..Not Free/Reduced Lunch 78 80 88 81 * Number of students tested 50 49 47 49 *
* Data not gathered during this testing period
Tarpon Springs Fundamental ElementaryFlorida Comprehensive Assessment Test (FCAT) Results
REFERENCED AGAINST NATIONAL NORMS
Grade 5 Test Reading FCAT NRT
Florida Comprehensive Assessment Test (FCAT), norm-referenced test (NRT) – The reading comprehension and mathematics problem solving portions of the Stanford Achievement Test Series, Ninth Edition is a Customized Secure Form; revised and modified annually for Florida, selected to be administered to Florida students, in grades 3-10.
NCLB-BRS 2005-2006 Application Page 22 of 26

Edition/Publication Year: Stanford Achievement Test Series Ninth Edition, Customized Secure Form, revised and modified annually for Florida.
Publisher: Harcourt Educational Measurement
Scores are reported here as (check one): NCEs____ Scaled scores ____ Percentiles X
2004-2005 2003-2004 2002-2003 2001-2002 2000-2001
Testing month March March March March MarchSCHOOL SCORES Total Score 82 83 79 74 80 Number of students tested 51 57 56 56 56 Percent of total students tested 100 100 100 100 100 Number of students alternatively assessed 0 0 0 0 0 Percent of students alternatively assessed 100 100 100 100 100 SUBGROUP SCORES 1.White 84 85 80 77 82 Number of students tested 45 51 49 49 50 2..Not Free/Reduced Lunch 84 83 79 77 * Number of students tested 45 49 52 47 *
* Data not gathered during this testing period
Tarpon Springs Fundamental ElementaryFlorida Comprehensive Assessment Test (FCAT) Results
REFERENCED AGAINST NATIONAL NORMS
Grade 3 Test Math FCAT NRT
Florida Comprehensive Assessment Test (FCAT), norm-referenced test (NRT) – The reading comprehension and mathematics problem solving portions of the Stanford Achievement Test Series, Ninth Edition is a Customized Secure Form; revised and modified annually for Florida, selected to be administered to Florida students, in grades 3-10.
NCLB-BRS 2005-2006 Application Page 23 of 26
Edition/Publication Year: Stanford Achievement Test Series Ninth Edition, Customized Secure Form, revised and modified annually for Florida.
Publisher: Harcourt Educational Measurement
Scores are reported here as (check one): NCEs____ Scaled scores ____ Percentiles X
2004-2005 2003-2004 2002-2003 2001-2002 2000-2001
Testing month March March March March MarchSCHOOL SCORES Total Score 80 80 78 81 75 Number of students tested 45 46 46 46 46 Percent of total students tested 100 100 100 100 100 Number of students alternatively assessed 0 0 0 0 0 Percent of students alternatively assessed 100 100 100 100 100 SUBGROUP SCORES 1.White 83 79 78 83 77 Number of students tested 39 42 42 41 40 2..Not Free/Reduced Lunch 85 81 79 80 * Number of students tested 39 43 43 42 *
* Data not gathered during this testing period
Tarpon Springs Fundamental ElementaryFlorida Comprehensive Assessment Test (FCAT) Results
REFERENCED AGAINST NATIONAL NORMS
Grade 4 Test Math FCAT NRT
Florida Comprehensive Assessment Test (FCAT), norm-referenced test (NRT) – The reading comprehension and mathematics problem solving portions of the Stanford Achievement Test Series, Ninth Edition is a Customized Secure Form; revised and modified annually for Florida, selected to be administered to Florida students, in grades 3-10.
NCLB-BRS 2005-2006 Application Page 24 of 26

Edition/Publication Year: Stanford Achievement Test Series Ninth Edition, Customized Secure Form, revised and modified annually for Florida.
Publisher: Harcourt Educational Measurement
Scores are reported here as (check one): NCEs____ Scaled scores ____ Percentiles X
2004-2005 2003-2004 2002-2003 2001-2002 2000-2001
Testing month March March March March MarchSCHOOL SCORES Total Score 87 82 86 81 82 Number of students tested 56 56 54 56 56 Percent of total students tested 100 100 100 100 100 Number of students alternatively assessed 0 0 0 0 0 Percent of students alternatively assessed 100 100 100 100 100 SUBGROUP SCORES 1.White 87 82 87 82 82 Number of students tested 51 50 50 49 50 2..Not Free/Reduced Lunch 88 82 87 83 * Number of students tested 50 49 47 49 *
* Data not gathered during this testing period
Tarpon Springs Fundamental ElementaryFlorida Comprehensive Assessment Test (FCAT) Results
REFERENCED AGAINST NATIONAL NORMS
Grade 5 Test Math FCAT NRT
Florida Comprehensive Assessment Test (FCAT), norm-referenced test (NRT) – The reading comprehension and mathematics problem solving portions of the Stanford Achievement Test Series, Ninth Edition is a Customized Secure Form; revised and modified annually for Florida, selected to be administered to Florida students, in grades 3-10.
Edition/Publication Year: Stanford Achievement Test Series Ninth Edition, Customized Secure Form, revised and modified annually for Florida.
NCLB-BRS 2005-2006 Application Page 25 of 26
Publisher: Harcourt Educational Measurement
Scores are reported here as (check one): NCEs____ Scaled scores ____ Percentiles X
2004-2005 2003-2004 2002-2003 2001-2002 2000-2001
Testing month March March March March MarchSCHOOL SCORES Total Score 82 89 80 83 77 Number of students tested 51 57 56 56 56 Percent of total students tested 100 100 100 100 100 Number of students alternatively assessed 0 0 0 0 0 Percent of students alternatively assessed 100 100 100 100 100 SUBGROUP SCORES 1.White 84 90 82 84 80 Number of students tested 45 51 49 49 50 2.Not Free/Reduced Lunch 84 90 83 85 * Number of students tested 45 49 52 47 *
* Data not gathered during this testing period
NCLB-BRS 2005-2006 Application Page 26 of 26