the economic imperative behind no child left behind
TRANSCRIPT
The Economic Imperative Behind No Child Left Behind

The primary goal of NCLB is to: Increase the academic achievement of
all children and Eliminate the education gap
experienced by economically disadvantaged and minority children.

Three Aspects of the Economic Imperative The Labor Shortage The Skills Gap The Education Gap
THE LABOR SHORTAGE
The U.S. population is aging.
By 2050, persons over the age of 55 will constitute 38% of the population

Share of Civilian Population by Age
Years
Age 16-34
Age 35-54
Age 55 +
1950 40% 36% 24%
2000 34% 39% 27%
2050 32% 30% 38%
The civilian labor force is also aging.
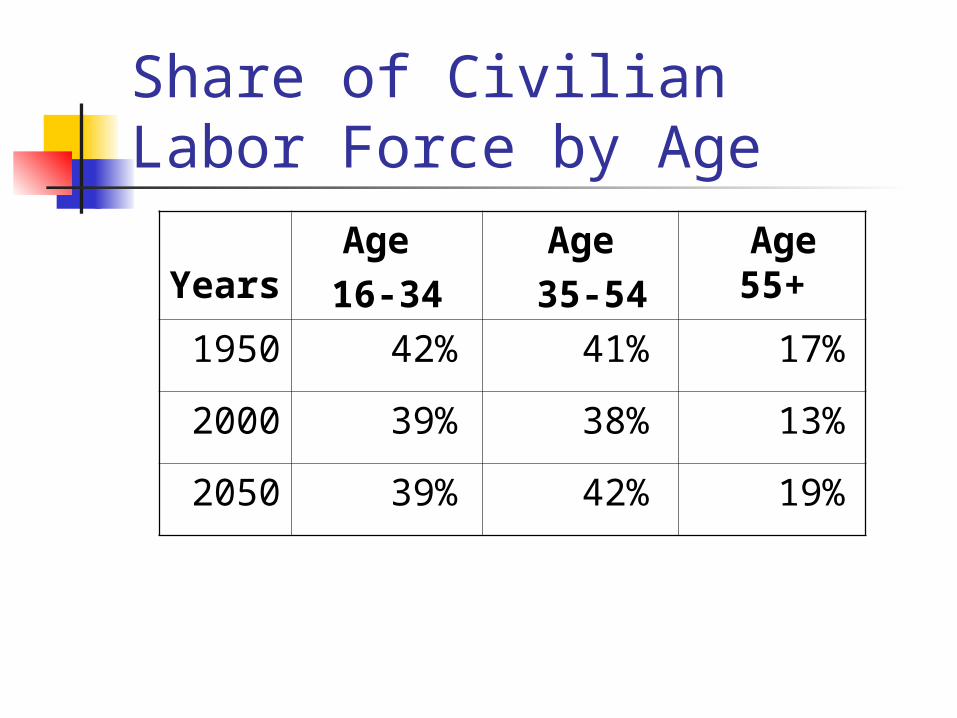
Share of Civilian Labor Force by Age
Years
Age 16-34
Age 35-54
Age 55+
1950 42% 41% 17%
2000 39% 38% 13%
2050 39% 42% 19%

Percentages of Population and Labor Force By Age
Years Age 16-34 Age 35-54 Age 55+
Pop LF Ratio Pop LF Ratio Pop LF Ratio
1950 40% 42% 1.05
36% 41% 1.14
24% 17% .71
2000 34% 39% 1.15
39% 48% 1.23
27% 13% .48
2050 32% 39% 1.22
30% 42% 1.40
38% 19% .50

Minority groups are growing faster than the white majority. By 2050, Whites will constitute less
than 50% of the population.

Proportion of Population by Ethnic Origin
2004 2010 2020 2050
White 69.7% 67.3% 63.8% 46.8%
Hispanic
13.0% 14.6% 17.0% 28.6%
Black 12.3% 12.5% 12.8% 13.2%
Asian 4.2% 4.8% 5.7% 10.6%
Indian 0.8% 0.8% 0.8% 0.8%
Between 2004 and 2050 There will be an increasing
concentration of minorities within the younger population cohorts.
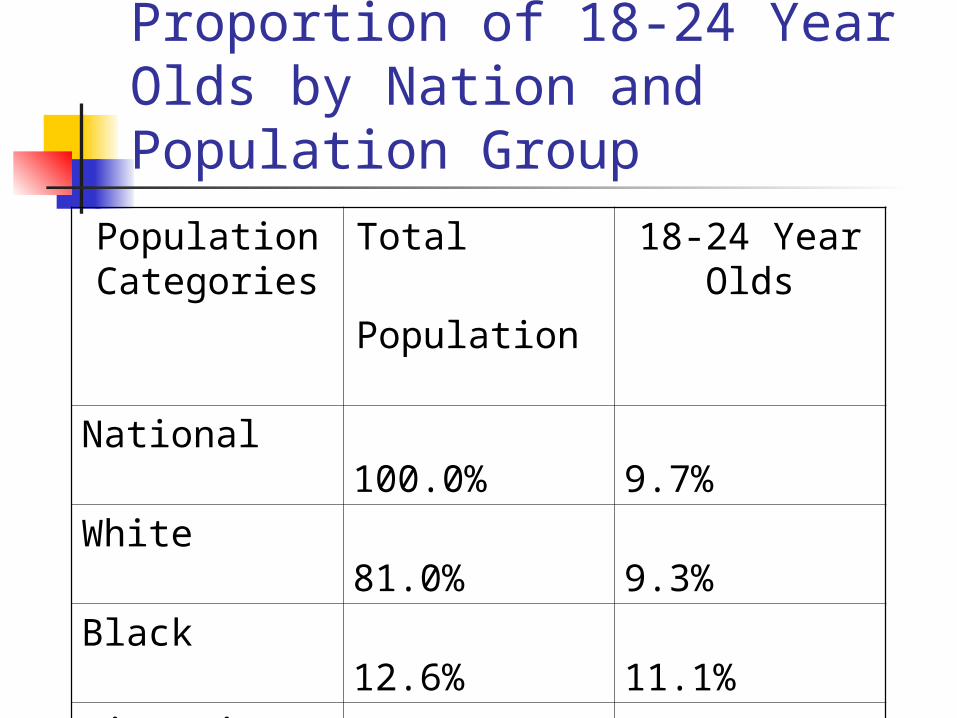
Proportion of 18-24 Year Olds by Nation and Population Group
Population Categories
Total Population
18-24 Year Olds
National 100.0% 9.7%
White 81.0% 9.3%
Black 12.6% 11.1%
Hispanic 12.6% 13.4%

In other words, as the U.S. population ages, the
younger cohorts decline in relative size and become increasingly minority in
composition. We can expect the workforce to
also become increasingly minority in composition.
Another way of looking at the same information
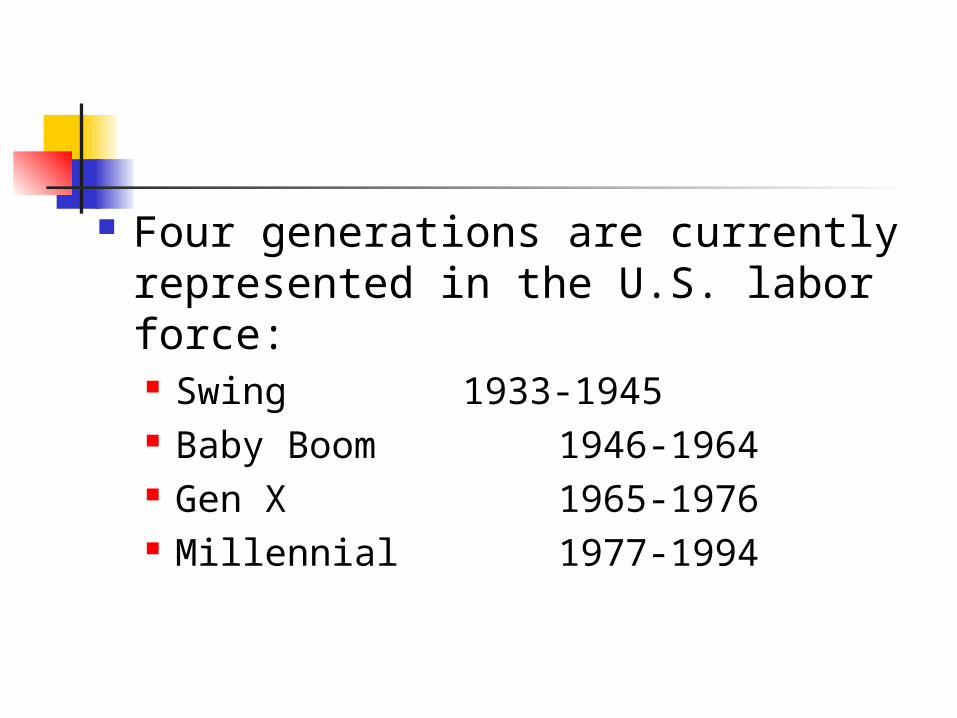
Four generations are currently represented in the U.S. labor force: Swing 1933-1945 Baby Boom 1946-1964 Gen X 1965-1976 Millennial 1977-1994

As of 1994 % Pop
Birth Period
First 16
First 55
Last 75
SW 11 33-45 1949 1988
2020
BB 28 46-64 1952 2001
2039
GX 16 65-76 1981 2020
2051
Mill 26 77-94 1993 2032
2069
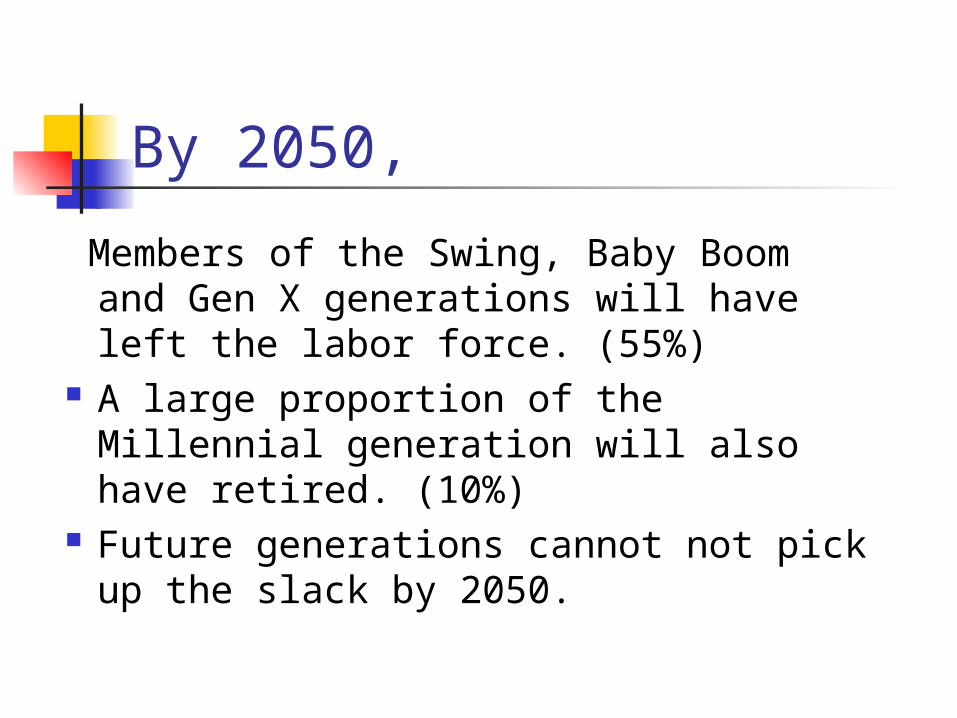
By 2050,
Members of the Swing, Baby Boom and Gen X generations will have left the labor force. (55%)
A large proportion of the Millennial generation will also have retired. (10%)
Future generations cannot not pick up the slack by 2050.
The result will be that: The pool from which new native
workers may be drawn will be both smaller and made up primarily of minority individuals.
The Aspen Institute says that From now until 2021, there will be
no additional native-born workers in this prime age. None.

Indeed, What we will be experiencing will
be labor shortages.

As of 2010, BLS projects the following numbers.
Population 299,862,000
Employment 167,754,000
Workforce 159,993,000
Shortage 7,761,000

Other Projections NAM – Up to 12 million skilled
foreign workers will have to be imported by 2020.
Herman, Olivo, Gioia – By 2010, there will be 10,033,000 more jobs than workers*
* Impending Crisis: Too Many Jobs, Too Few Workers

The Shortage Is Already Here! NAM claims that almost all current
and near-term job growth will come from immigrants and their children.
Between 1996 and 2000, immigrants accounted for almost half of all labor force growth.
1 out of 8 workers in the U.S. come from other countries.

THE SKILLS GAP

65% of the fastest growing occupations require some postsecondary education or training.
By 2010, 42% of all U.S. jobs will require a vocational certificate, associate degree, bachelor’s degree or higher.

Percent Growth of Educational Certificates By 2010
Level of Certification
Percent Growth
Associate Degree 32%
Vocational Certificate
24%
Bachelor’s Degree 22%

By contrast, Only 10% of the top 50 declining
occupations require postsecondary education or training.

Fact Three
While worker educational requirements are increasing, the educational attainment of the U.S. workforce is declining.

From 1980 to 2000, The number of workers with some post
high school education rose by 19 percent.*
The growth for the next 20 years is projected to be 4 percent.*
* Richard Kazis, Double the Numbers: Postsecondary Attainment and Underrepresented Youth

From 1980 to 2000, The proportion of the labor force
with a college education increased by 8.6%.*
The increase of that proportion over the next 20 years is projected at 1.5% to 5%.*
* Atlantic Monthly, February 2004
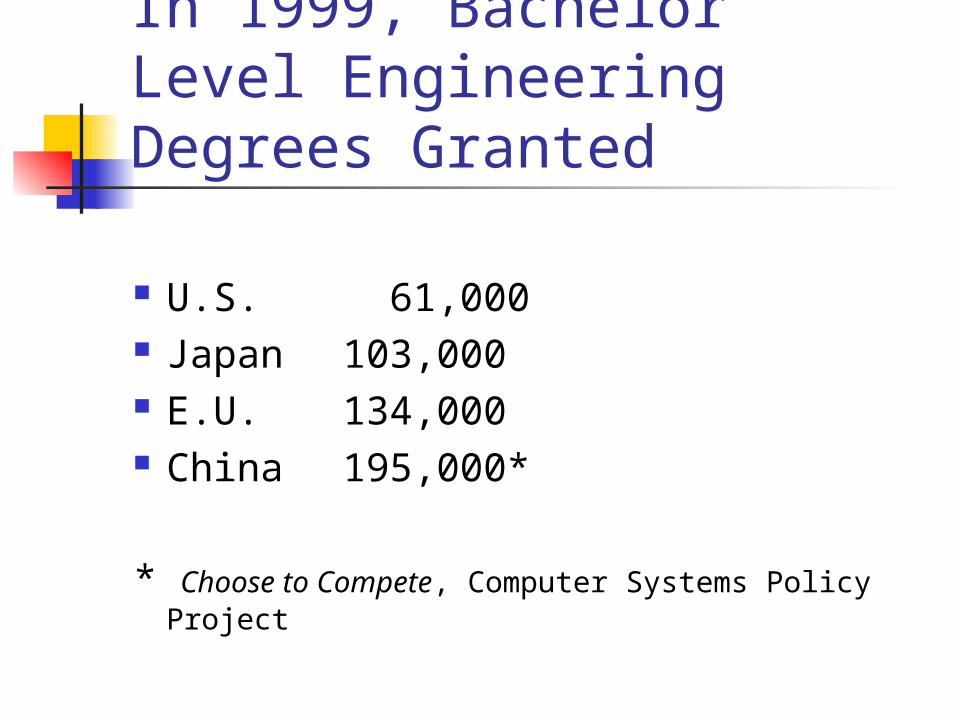
In 1999, Bachelor Level Engineering Degrees Granted
U.S. 61,000 Japan 103,000 E.U. 134,000 China 195,000*
* Choose to Compete, Computer Systems Policy Project

Regarding Competitive Advantage
“If you look at India, China, and Russia… even if you discount 90 percent of the people there as uneducated farmers…you still end up with about 300 million people who are educated. That’s bigger than the U.S. work force.”
Bob Herbert, New York Times

Fact Four
Almost half of this nation’s adult population reads at a level below that expected of the average high school graduate.

Percent of Illiterate Adults by Number of States
Number of States
Percent of Adults
14 50% or More
20 40% to 49%
16 32% to 30%

These individuals: Make up 39% of the workforce Work in low paying, unstable jobs
that are disappearing from the economy
Cannot—without extensive remediation—profit from projected economic growth

So What Does This Have To Do With NCLB?
The Education Gap

National Statistics on High School Students
For every 100 students who enter the 9th grade: 21 do not graduate 79 graduate from high school 50 enter college within 2 years 49 complete some college 21 receive at least a baccalaureate
degree

Moreover, Only 32% of all students in public
high school leave high school prepared to attend college.*
The Manhatten Institute

The Education Gap The rates of graduation, college
enrollment, postsecondary remediation, and completion vary significantly by race or ethnicity.

Achievement
White
Black Hispanic
Graduate from High School
93% 82% 63%
Enroll in College
48% 44% 35%
Leave Prior to Award
44% 61% 62%
Achieve BA/BS Degree
33% 18% 11%

Why is this important? Because minorities are the fastest
growing source of workers for the U.S. economy.

And
Because Black and Hispanic students are: Less likely to graduate from high
school Less likely to enroll in college Less likely to complete a degree Less likely to be prepared for the
economy of the 21st century

The economic picture as it stands today: We have an aging workforce. We have a growing labor shortage
driven by demographics. We have a significant number of
unemployed persons who do not have the knowledge or skills to become employed.
Forty percent of our working adults do not read at the level expected of the average high school student.

We expect to import millions of skilled foreign workers to meet our labor demand.
One-third of the immigrants entering our country lack a high school education.

Many of the young people coming out of our high schools are not prepared to enter the 21st century workforce.

The “Economic Crisis” facing the United States is an “Educational Crisis”
The educational question is: Whether, in the future, we will
have a workforce of sufficient size and educational attainment to be globally competitive.

The social question is: Whether our Black and Hispanic
citizens will be empowered to fully take part in the economy of the 21st Century?
As the data I have presented show: The two questions are one.

As Alan Greenspan recently put it”:
…Equal opportunity requires equal access to knowledge. We cannot expect everyone to be equally skilled. But we need to pursue equality of opportunity to ensure that our economic system works at maximum efficiency and is perceived as just in its distribution of rewards.*
* Address to Greater Omaha Chamber of Commerce 2/20/04
This is the economic (and social) imperative behind No Child Left Behind

And NCLB is just the beginning.