appendix j hydropower and electric grid analysis
TRANSCRIPT

Appendix J Hydropower and Electric Grid Analysis of Lower
San Joaquin River Flow Alternatives

Evaluation of San Joaquin River Flow and Southern Delta Water Quality Objectives and Implementation
J-i September 2016
ICF 00427.11
Appendix J Hydropower and Electric Grid Analysis of Lower
San Joaquin River Flow Alternatives
TABLE OF CONTENTS J.1 Introduction .................................................................................................................................. J-1
J.2 Energy Generation Effects ............................................................................................................ J-2
J.2.1 Methodology .................................................................................................................... J-2
J.2.2 Results .............................................................................................................................. J-5
J.3 Overview of the Transmission System in Central California ......................................................... J-7
J.3.1 California Independent System Operator ........................................................................ J-8
J.3.2 Ancillary Service Market ................................................................................................ J-12
J.3.3 Balancing Authority of Northern California and Sacramento Municipal Utility
District ............................................................................................................................ J-12
J.3.4 Turlock Irrigation District ............................................................................................... J-15
J.4 Effects on Generating Capacity and Electric Grid ....................................................................... J-15
J.4.1 Peak Generating Capacity .............................................................................................. J-16
J.4.2 Power Flow Assessment Methodology .......................................................................... J-18
J.4.3 Power Flow Simulation Tools ......................................................................................... J-21
J.4.4 Assumptions for Facilities .............................................................................................. J-21
J.4.5 Results and Conclusions ................................................................................................. J-22
J.5 References Cited ......................................................................................................................... J-23
Tables
J-1 List of Hydropower Facilities in the LSJR Watershed ..................................................................... J-3
J-2 Average Annual Baseline Energy Generation and Difference from Baseline by
Tributary (GWh) ............................................................................................................................. J-5
J-3 Average Annual Energy Generation Difference as Percent Change from Baseline by
Tributary......................................................................................................................................... J-5
J-4 Balancing Authority of Power Plants Under Study ........................................................................ J-7
J-5 Local Capacity Needs vs. Peak Load and Local Area Generation for Greater Fresno Area ......... J-10
J-6 Reliability Based Transmission Projects in Greater Fresno .......................................................... J-11
J-7 Expected New Generator Additions in Greater Fresno ............................................................... J-11

State Water Resources Control Board California Environmental Protection Agency
Hydropower and Electric Grid Analysis of Lower San Joaquin River Flow Alternatives
Evaluation of San Joaquin River Flow and Southern Delta Water Quality Objectives and Implementation
J-ii September 2016
ICF 00427.11
J-8 Proposed Transmission Upgrades in SMUD 2016–2020 ............................................................. J-14
J-9 Existing Maximum Potential Power Generation Capacity ........................................................... J-16
J-10 Representation of the California Electric Grid ............................................................................. J-19
J-11 Description of Test Cases Modeled ............................................................................................. J-20
J-12. WECC Paths Monitored ............................................................................................................... J-21
J-13 Unit Assumptions for the Engineering Assessment ..................................................................... J-21
Figures
J-1. Location of Hydropower Facilities in the LSJR Watershed ............................................................ J-2
J-2a Average (across 82 Years of Simulation) of Total Monthly Energy Generation from
Hydropower Facilities in the Stanislaus, Tuolumne, and Merced River Watersheds .................... J-6
J-2b Change in Average (across 82 Years of Simulation) of Total Monthly Energy
Generation Compared to Baseline ................................................................................................. J-7
J-3 Local Capacity Area Map of CAISO ................................................................................................. J-9
J-4 SMUD Service Territory and Other Territories in California ........................................................ J-13
J-5 Turlock Irrigation District Service Area (Source: California Transmission Planning
Group 2011 .................................................................................................................................. J-15
J-6 Exceedance Plot of Total Generating Capacity (megawatts) in July, Across 82 Years of
Simulation, from the Three Major Tributary Hydropower Facilities, Comparing LSJR
Alternatives 2–4 and Baseline...................................................................................................... J-17
J-7 Exceedance Plot of Total Generating Capacity (megawatts) in August, Across 82
Years of Simulation, from the Three Major Tributary Hydropower Facilities,
Comparing LSJR Alternatives 2–4 and Baseline ........................................................................... J-17

State Water Resources Control Board California Environmental Protection Agency
Hydropower and Electric Grid Analysis of Lower San Joaquin River Flow Alternatives
Evaluation of San Joaquin River Flow and Southern Delta Water Quality Objectives and Implementation
J-iii September 2016
ICF 00427.11
Acronyms and Abbreviations
AGC Automatic Generation Control
BA Balancing Authority
BANC Balancing Authority of Northern California
CAISO California Independent System Operator
Commission California Energy Commission
CPUC California Public Utilities Commission
CVP Central Valley Project
ft feet
kV kilovolt
LCR local capacity requirement
LCT Study Local Capacity Technical Study
LSE load serving entity
LTE Long-Term Emergency
Merced ID Merced Irrigation District
MID Modesto Irrigation District
MSS metered subsystem
MW megawatts
NERC North American Electric Reliability Corporation
PSLF Positive Sequence Load Flow
RA Resource Adequacy
RPS Renewable Portfolio Standard
SCs Scheduling coordinators
SMUD Sacramento Municipal Utility District
SNR Sierra Nevada Region
TID Turlock Irrigation District
WECC Western Electricity Coordinating Council

Evaluation of San Joaquin River Flow and Southern Delta Water Quality Objectives and Implementation
J-1 September 2016
ICF 00427.11
J.1 Introduction This appendix provides estimates of the potential effects on hydropower generation and electric
grid reliability in the Lower San Joaquin River (LSJR) Watershed caused by implementation of the
LSJR alternatives. The LSJR alternatives propose a specified percent of unimpaired flows1 (i.e., 20,
40, or 60 percent) from February–June on the Stanislaus, Tuolumne, and Merced Rivers (three
eastside tributaries). The proposed LSJR alternatives could affect reservoir operations and surface
water diversions and the associated timing and amount of hydropower generation from the LSJR
Watershed, which includes the plan area2 as described in Chapter 1, Introduction.
This analysis relies on the State Water Resources Control Board’s (State Water Board’s) water
supply effects (WSE) model to estimate the effects of the LSJR alternatives on reservoir releases and
storage (elevation head), and allowable diversions to off-stream generation facilities, and then
calculates the associated change in monthly and annual energy production This output then
provides input to electric grid reliability modeling, which evaluates the potential impacts of these
changes on the electric grid reliability under peak load and outage contingency scenarios.
There are three different LSJR alternatives, each consisting of a specified percentage of unimpaired
flow requirement for the Stanislaus, Tuolumne, and Merced Rivers. For a particular alternative, each
tributary must meet the specified percentage of its own unimpaired flow at its mouth with the LSJR
during the months of February–June.3 Details of the LSJR alternatives are presented in Chapter 3,
Alternatives Description, Section 3.3, Lower San Joaquin River (LSJR) Alternatives, of this recirculated
substitute environmental document (SED).
Numerous hydropower generation facilities on the three eastside tributaries are evaluated in this
analysis. The major facilities potentially affected, however, are those associated with the New
Melones Reservoir (New Melones Dam) on the Stanislaus River, New Don Pedro Reservoir (New
Don Pedro Dam) on the Tuolumne River, and Lake McClure (New Exchequer Dam) on the Merced
River.4 Figure J-1 shows the location of these and other hydropower facilities in and around the LSJR
Watershed.
1Unimpaired flow represents the water production of a river basin, unaltered by upstream diversions, storage, or by export or import of water to or from other watersheds. It differs from natural flow because unimpaired flow is the flow that occurs at a specific location under the current configuration of channels, levees, floodplain, wetlands, deforestation and urbanization. 2 In this appendix plan area and project area are used interchangeably and refer to the area described in Chapter 1, Introduction. 3 Any reference in this appendix to 20 percent unimpaired, 40 percent unimpaired, and 60 percent unimpaired is the same as LSJR Alternative 2, LSJR Alternative 3, and LSJR Alternative 4, respectively. The specific minimum unimpaired flow requirement on a tributary for a particular alternative would not apply once flows in the river or downstream are at a level of concern for flooding or public safety. As described in the program of implementation for the flow objectives, such levels will be coordinated by the State Water Board with the appropriate federal, state, and local agencies. 4 In this document, the term rim dams is used when referencing the three major dams and reservoirs on each of the eastside tributaries: New Melones Dam and Reservoir on the Stanislaus River; New Don Pedro Dam and Reservoir on the Tuolumne River; and New Exchequer Dam and Lake McClure on the Merced River.

State Water Resources Control Board California Environmental Protection Agency
Hydropower and Electric Grid Analysis of Lower San Joaquin River Flow Alternatives
Evaluation of San Joaquin River Flow and Southern Delta Water Quality Objectives and Implementation
J-2 September 2016
ICF 00427.11
Figure J-1. Location of Hydropower Facilities in the LSJR Watershed (Source: Ventyx n.d.)
J.2 Energy Generation Effects The analysis in this section estimates the timing and amount of energy in gigawatt hours (GWh)
generated by hydropower facilities on the eastside tributaries for the different LSJR alternatives and
compares them against baseline. The timing and amounts of energy generated are calculated from
the timing, rates of release, and elevation head of reservoirs at in-stream hydropower facilities and
allowable diversions to off-stream facilities, estimated across 82 years (between water years 1922
and 2003) by the WSE model for the LSJR alternatives and baseline. The average annual energy
generation and the distribution of average monthly energy generation across these 82 years for each
LSJR alternative are then compared to those for baseline.
J.2.1 Methodology
For each of the LSJR alternatives, this analysis estimates the amount of energy (GWh) that would be
generated on a monthly and annual basis from the various facilities on the eastside tributaries for
comparison against the amount generated under baseline conditions. Unless otherwise specified,
the quantitative results presented in the figures, tables, and text of this appendix present WSE
modeling of the specified unimpaired flow requirement of each LSJR alternative (i.e., 20, 40, or 60
percent). The specified unimpaired flow requirements include the potential range of effects at other
percentages of unimpaired flow (i.e., 30 percent and 50 percent) that could occur under adaptive
management. Hydropower facilities on the eastside tributaries were grouped into four categories
for this analysis based on where they are located relative to the three rim dams, and whether they
are in-stream facilities or off-stream. Table J-1 contains a list of the hydropower facilities on the LSJR
grouped into these categories, along with some basic facility information.

State Water Resources Control Board California Environmental Protection Agency
Hydropower and Electric Grid Analysis of Lower San Joaquin River Flow Alternatives
Evaluation of San Joaquin River Flow and Southern Delta Water Quality Objectives and Implementation
J-3 September 2016
ICF 00427.11
Table J-1. List of Hydropower Facilities in the LSJR Watershed (CEC 2012)
River Basin
Hydro-electric Power Plant Name
Nameplate Capacity (MW)
% of Power Capacity in Basin
Location Relative to Rim Dams
Stan
isla
us
Woodward 2.85 0.4 Off-stream
Frankenheimer 5.04 0.6 Off-stream
Tulloch 17.10 2.2 Inline
Angels 1.40 0.2 Upstream
Phoenix 1.60 0.2 Upstream
Murphys 4.50 0.6 Upstream
New Spicer 6.00 0.8 Upstream
Spring Gap 6.00 0.8 Upstream
Beardsley 9.99 1.3 Upstream
Sand Bar 16.20 2.1 Upstream
Donnells-Curtis 72.00 9.2 Upstream
Stanislaus 91.00 11.6 Upstream
Collierville Ph 249.10 31.8 Upstream
New Melones 300.00 38.3 Rim Dam
Upstream Capacity 457.79 58.5 NA
Affected Capacity 324.99 41.5 NA
Tu
olu
mn
e
Stone Drop 0.20 0.0 Off-stream
Hickman 1.08 0.2 Off-stream
Turlock Lake 3.30 0.5 Off-stream
La Grange 4.20 0.7 Inline
Upper Dawson 4.40 0.7 Upstream
Moccasin Lowhead 2.90 0.5 Upstream
Moccasin 100.00 16.6 Upstream
R C Kirkwood 118.22 19.6 Upstream
Dion R. Holm 165.00 27.4 Upstream
Don Pedro 203.00 33.7 Rim Dam
Upstream Capacity 390.52 64.8 NA
Affected Capacity 211.78 35.2 NA
Mer
ced
Fairfield 0.90 0.8 Off-stream
Reta - Canal Creek 0.90 0.8 Off-stream
Merced ID – Parker 3.75 3.2 Off-stream
Mcswain 9.00 7.6 Inline
Merced Falls 9.99 8.4 Inline
New Exchequer 94.50 79.4 Rim Dam
Upstream Capacity 0.00 0.0 NA
Affected Capacity 119.04 100% NA
NA = not applicable

State Water Resources Control Board California Environmental Protection Agency
Hydropower and Electric Grid Analysis of Lower San Joaquin River Flow Alternatives
Evaluation of San Joaquin River Flow and Southern Delta Water Quality Objectives and Implementation
J-4 September 2016
ICF 00427.11
Energy generated from in-stream facilities, and at the rim dams, is estimated by the power equation
presented below (Eqn. J-1) using reservoir head and release rates obtained from the WSE model. As
described in Appendix C, Technical Report On The Scientific Basis For Alternative San Joaquin River
Flow And Southern Delta Salinity Objectives, the WSE model provides estimates of reservoir
operations and allowable surface water diversions associated with the different LSJR alternatives.
As operations change for each LSJR alternative, reservoir release rates and storage levels also
change, thus affecting the power generated.
The monthly energy generated from facilities at the rim dams, or facilities in-stream and
downstream of the rim dams, was calculated using the following power equation on a monthly time
step:
(Eqn. J-1)
where HP is the total horsepower generated by the facility, ep is the power plant efficiency, (assumed
to be 80 percent for all facilities), γ is weight of 1 cubic foot of water (62.4 pounds), Q is the flow
released from the reservoir and through the turbines (in cubic feet per second), and hg is the
elevation head (in feet) behind the dam (The Engineering Toolbox 2016). The reservoir release
rates (Q) and reservoir elevations (hg ) are obtained from the WSE model output. All hydropower
facilities were assumed to operate within the constraints of the facility; spills causing flows greater
than capacity do not produce energy above the maximum capacity. In-stream facilities located
downstream of the rim dams were assumed to have constant hg equal to the maximum head of the
reservoir as these facilities are generally run-of-the-river. Horsepower obtained from the above
equation is then converted to megawatts and multiplied by the number of hours in the month to
provide the total energy generated in GWh for that month. Annual energy estimates are the sum of
the associated monthly estimates.
An off-stream facility is one supplied by diversions of surface water from the associated river.
Energy generated from off-stream facilities for each LSJR alternative was estimated by multiplying
the monthly percent of surface water demand met (100 percent means surface water demand is
fully met) on the associated river by the facility’s nameplate capacity. Additional information related
to calculation methods and terminology related to surface water demands is found in Appendix F.1,
Hydrologic and Water Quality Modeling. The calculation of hydropower generation is completed
using the following equation to determine the off-stream generation of each alternative and baseline
on a monthly basis:
Power = (% of Surface Water Demand Met) x (Off-stream Nameplate Capacity) (Eqn. J-2)
where the Power is calculated in megawatts (MW), % of Surface Water Demand Met is taken from the
WSE model and only includes demands by irrigation districts that are routed through the off-stream
reservoirs, for theassociated tributary (for the respective alternative and baseline), and the Off-
Stream Nameplate Capacity is the maximum generating capacity of the off-stream power generation
facility. This methodology assumes that facilities have been designed and are operated at the
nameplate capacity when surface water demands are met in full, but would not be able to operate at
nameplate capacity if those demands are not met in full. This methodologyis a simplifying and
conservative assumption for facilities that represent a relatively small portion of the overall
generating capacity in their respective watersheds (1.0 percent on the Stanislaus, 0.7 percent on the
Tuolumne, and 4.8 percent on the Merced as shown in Table J-1). The power calculated by Eqn.J-2 is

State Water Resources Control Board California Environmental Protection Agency
Hydropower and Electric Grid Analysis of Lower San Joaquin River Flow Alternatives
Evaluation of San Joaquin River Flow and Southern Delta Water Quality Objectives and Implementation
J-5 September 2016
ICF 00427.11
then multiplied by the number of hours in the month to provide the total amount of energy in GWh
generated for that month. Annual energy estimates are the sum of the associated monthly estimates.
Hydropower generated from facilities upstream of the rim dams on the Stanislaus and Tuolumne
Rivers is not included in the WSE model because the largest hydrologic effects in terms of volume of
water will be at and downstream of the rim dams. The Merced River has no major hydropower
reservoirs upstream of Lake McClure (New Exchequer Dam). This appendix focuses on the modeling
of hydropower at and downstream of the rim dams. Upstream hydropower effects are qualitatively
discussed in Chapter 14, Energy and Greenhouse Gases, in Section 14.4.4, Impacts and Mitigation
Measures: Extended Plan Area.
J.2.2 Results
The LSJR alternatives slightly reduce the annual energy generation and change the monthly
generation pattern. Table J-2 contains a summary of the average annual change in total energy
generation (GWh) on each of the tributaries due to the LSJR alternatives. Generally, as the percent of
unimpaired flow increases from 20 percent to 60 percent, the amount of energy generated annually
is slightly reduced. Relative to baseline, hydropower generation is expected to increase with LSJR
Alternative 2, remain about the same with LSJR Alternative 3, and decrease with LSJR Alternative 4.
These changes are also represented as a percent of baseline energy generation in Table J-3. Although
annual generation is only slightly affected, the effect on the monthly pattern is slightly more
pronounced.
Table J-2. Average Annual Baseline Energy Generation and Difference from Baseline by Tributary (GWh) (Note: 20% unimpaired flow, 40% unimpaired flow, and 60% unimpaired flow represent LSJR Alternative 2, 3, and 4, respectively)
Alternative Stanislaus Tuolumne Merced Plan Area
Baseline 586 656 408 1,650
20% UF 18 2 8 29
40% UF 4 -6 -3 -4
60% UF -23 -41 -23 -87
GWh = gigawatt hours
UF = unimpaired flow
Table J-3. Average Annual Energy Generation Difference as Percent Change from Baseline by Tributary (Note: 20% unimpaired flow, 40% unimpaired flow, and 60% unimpaired flow represent LSJR Alternative 2, 3, and 4, respectively)
Alternative
Stanislaus
(% difference from Baseline)
Tuolumne
(% difference from Baseline)
Merced
(% difference from Baseline)
Plan Area
(% difference from Baseline)
Baseline 0% 0% 0% 0%
20% UF 3% 0% 2% 2%
40% UF 1% -1% -1% 0%
60% UF -4% -6% -6% -5%
UF = unimpaired flow

State Water Resources Control Board California Environmental Protection Agency
Hydropower and Electric Grid Analysis of Lower San Joaquin River Flow Alternatives
Evaluation of San Joaquin River Flow and Southern Delta Water Quality Objectives and Implementation
J-6 September 2016
ICF 00427.11
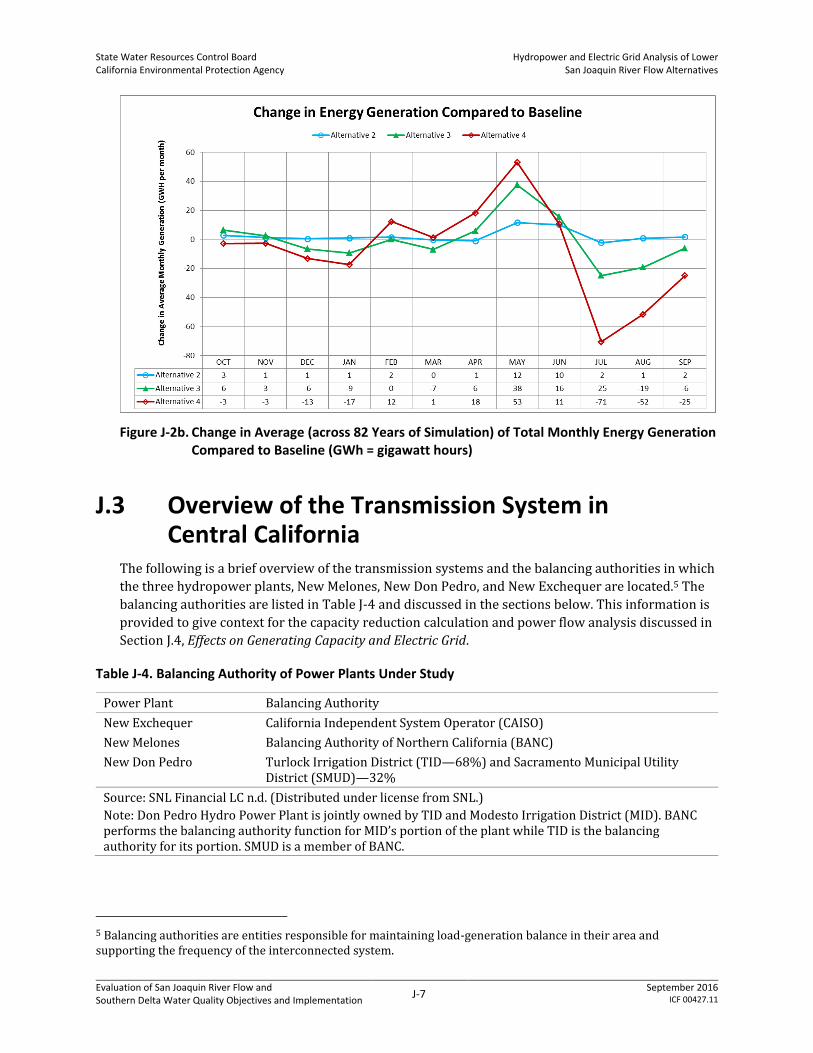
The pattern of total monthly energy generation (over 82 years of simulation) for the LSJR
alternatives and baseline are presented in Figure J-2a and the associated average changes in
monthly energy generation are presented in Figure J-2b. These figures show an increase in energy
produced in February–June, greatest in May, due to increases in flow relative to baseline (i.e.,
reservoir releases) in those months under each LSJR alternative. This is followed by reductions in
July–September for LSJR Alternatives 3 and 4, primarily due to less water being released from the
major reservoirs as a result of reduced diversions downstream, reduced flood control releases, and,
to a lesser extent, reduced reservoir elevations relative to baseline. From December–January, a
decrease in hydropower generation associated with LSJR Alternatives 3 and 4 is primarily related to
reduced flood control releases and, to a lesser extent, lower reservoir elevations. These effects are
more pronounced as the percentage of unimpaired flow requirement of the LSJR alternatives
increases.
Changes in summer hydropower generation will have a slightly greater effect on revenues because
the price of energy is generally greater in summer than during the cooler months. An evaluation of
the corresponding revenue loss and associated economic effects is evaluated Chapter 20, Economic
Analyses.
Figure J-2a. Average (across 82 Years of Simulation) of Total Monthly Energy Generation from Hydropower Facilities in the Stanislaus, Tuolumne, and Merced River Watersheds (GWh = gigawatt hours)
State Water Resources Control Board California Environmental Protection Agency
Hydropower and Electric Grid Analysis of Lower San Joaquin River Flow Alternatives
Evaluation of San Joaquin River Flow and Southern Delta Water Quality Objectives and Implementation
J-7 September 2016
ICF 00427.11
Figure J-2b. Change in Average (across 82 Years of Simulation) of Total Monthly Energy Generation Compared to Baseline (GWh = gigawatt hours)
J.3 Overview of the Transmission System in Central California
The following is a brief overview of the transmission systems and the balancing authorities in which
the three hydropower plants, New Melones, New Don Pedro, and New Exchequer are located.5 The
balancing authorities are listed in Table J-4 and discussed in the sections below. This information is
provided to give context for the capacity reduction calculation and power flow analysis discussed in
Section J.4, Effects on Generating Capacity and Electric Grid.
Table J-4. Balancing Authority of Power Plants Under Study
Power Plant Balancing Authority
New Exchequer California Independent System Operator (CAISO)
New Melones Balancing Authority of Northern California (BANC)
New Don Pedro Turlock Irrigation District (TID—68%) and Sacramento Municipal Utility District (SMUD)—32%
Source: SNL Financial LC n.d. (Distributed under license from SNL.)
Note: Don Pedro Hydro Power Plant is jointly owned by TID and Modesto Irrigation District (MID). BANC performs the balancing authority function for MID’s portion of the plant while TID is the balancing authority for its portion. SMUD is a member of BANC.
5 Balancing authorities are entities responsible for maintaining load-generation balance in their area and supporting the frequency of the interconnected system.

State Water Resources Control Board California Environmental Protection Agency
Hydropower and Electric Grid Analysis of Lower San Joaquin River Flow Alternatives
Evaluation of San Joaquin River Flow and Southern Delta Water Quality Objectives and Implementation
J-8 September 2016
ICF 00427.11
J.3.1 California Independent System Operator
The California Public Utilities Commission (CPUC) adopted the Resource Adequacy (RA) program in
2004 with the twin objectives of providing sufficient resources to the California Independent System
Operators (CAISO) to ensure the safe and reliable operation of the grid in real time; and providing
appropriate incentives for the siting and construction of new resources needed for reliability in the
future (CPUC 2011). As part of the RA program, each load serving entity (LSE) is required to procure
enough resources to meet 100 percent of its total forecast load plus a 15 percent reserve. In
addition, each LSE is required to file with CPUC demonstrating procurement of sufficient local RA
resources to meet its RA obligations in transmission-constrained local areas. Each year CAISO
performs the Local Capacity Technical Study (LCT Study) to identify local capacity requirements
within its territory. The results of this study are provided to CPUC for consideration in its RA
program. These results are also be used by CAISO for identifying the minimum quantity of local
capacity necessary to meet the North American Electric Reliability Corporation (NERC) reliability
criteria used in the LCT Study (California Independent System Operator 2010).
The LCT Study identifies the local capacity requirement (LCR) under normal and contingency
system conditions. The three system conditions under which LCR is evaluated are given below.
Category A: No Contingencies
Category B: Loss of a single element (N-1)
Category C: Category B contingency followed by another Category B contingency but with time
between the two to allow operating personnel to make any reasonable and feasible adjustments
to the system to prepare for the second Category B contingency.
For any given area or sub-area, the requirement for Category A, B, and C are compared and the most
stringent one will dictate that area’s LCR requirement. Figure J-3 shows the 10 LCR areas in CAISO
for study year 2012. The New Exchequer hydropower plant lies in the Greater Fresno LCR area. The
Greater Fresno LCR area is therefore discussed briefly below.
Locational Capacity Requirement in Greater Fresno Area
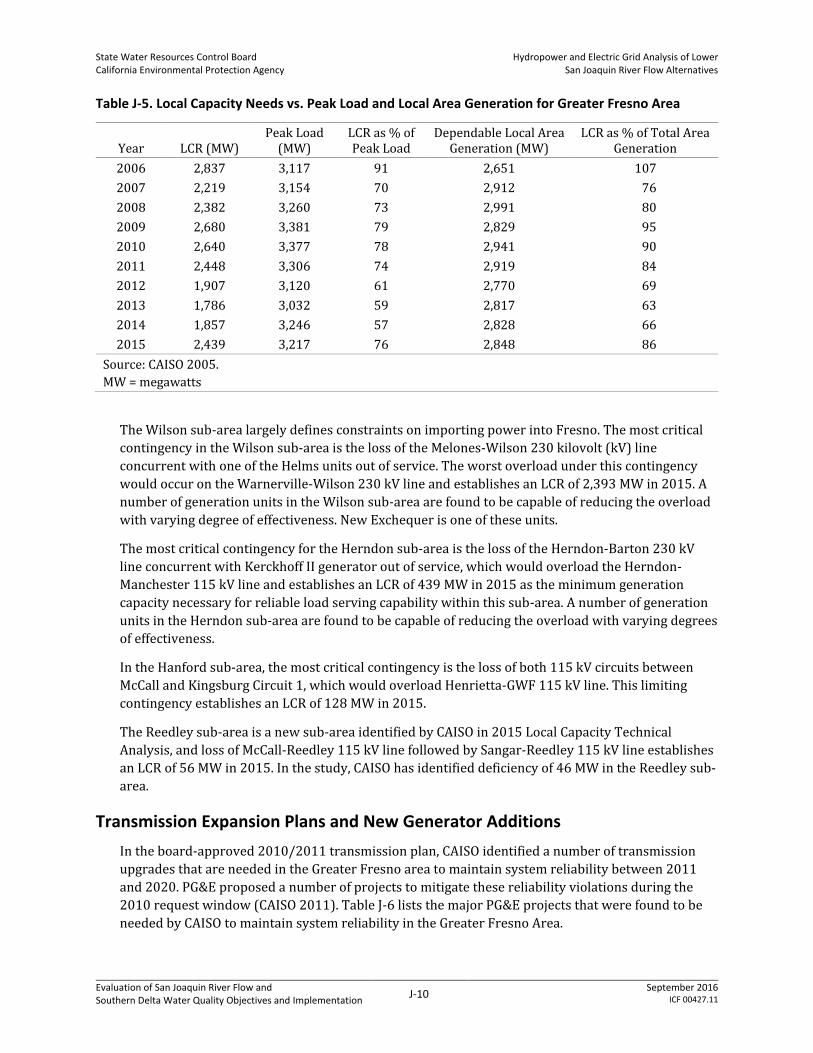
Table J-5 shows the historical LCR, peak load, and total dependable local area generation for the
Greater Fresno area from 2006 to 2015. The exhibit also shows the LCR as a percentage of the total
dependable local generation. For example, in 2011, the LCR in Greater Fresno was 2,448 MW while
the peak load stood at 3,306 MW; the LCR was 74 percent of the peak load. At the same time, the
total dependable generation stood at 2,919 MW, which meant that the LCR was 84 percent of the
total dependable generation. In other words, the Greater Fresno has had sufficient local resources
available to meet its LCR requirements.
CAISO also identifies sub-areas within the larger LCR area. It is possible that the sub-areas are
resource deficient even though the larger area may have sufficient resources to meet its LCR
requirement. For 2015, the Greater Fresno LCR area is divided into four sub-areas: Wilson, Herndon,
Handford and Reedley. While Wilson, Herndon, and Hanford have sufficient resources to meet their
current LCR requirement, Reedley shows a deficiency of 46 MW under Category C contingency
conditions. A summary of each sub-area critical contingencies and LCRs is presented below.

State Water Resources Control Board California Environmental Protection Agency
Hydropower and Electric Grid Analysis of Lower San Joaquin River Flow Alternatives
Evaluation of San Joaquin River Flow and Southern Delta Water Quality Objectives and Implementation
J-9 September 2016
ICF 00427.11
Figure J-3. Local Capacity Area Map of CAISO (Source: CAISO 2010b)
State Water Resources Control Board California Environmental Protection Agency
Hydropower and Electric Grid Analysis of Lower San Joaquin River Flow Alternatives
Evaluation of San Joaquin River Flow and Southern Delta Water Quality Objectives and Implementation
J-10 September 2016
ICF 00427.11
Table J-5. Local Capacity Needs vs. Peak Load and Local Area Generation for Greater Fresno Area
Year LCR (MW) Peak Load
(MW) LCR as % of Peak Load
Dependable Local Area Generation (MW)
LCR as % of Total Area Generation
2006 2,837 3,117 91 2,651 107
2007 2,219 3,154 70 2,912 76
2008 2,382 3,260 73 2,991 80
2009 2,680 3,381 79 2,829 95
2010 2,640 3,377 78 2,941 90
2011 2,448 3,306 74 2,919 84
2012 1,907 3,120 61 2,770 69
2013 1,786 3,032 59 2,817 63
2014 1,857 3,246 57 2,828 66
2015 2,439 3,217 76 2,848 86
Source: CAISO 2005.
MW = megawatts
The Wilson sub-area largely defines constraints on importing power into Fresno. The most critical
contingency in the Wilson sub-area is the loss of the Melones-Wilson 230 kilovolt (kV) line
concurrent with one of the Helms units out of service. The worst overload under this contingency
would occur on the Warnerville-Wilson 230 kV line and establishes an LCR of 2,393 MW in 2015. A
number of generation units in the Wilson sub-area are found to be capable of reducing the overload
with varying degree of effectiveness. New Exchequer is one of these units.
The most critical contingency for the Herndon sub-area is the loss of the Herndon-Barton 230 kV
line concurrent with Kerckhoff II generator out of service, which would overload the Herndon-
Manchester 115 kV line and establishes an LCR of 439 MW in 2015 as the minimum generation
capacity necessary for reliable load serving capability within this sub-area. A number of generation
units in the Herndon sub-area are found to be capable of reducing the overload with varying degrees
of effectiveness.
In the Hanford sub-area, the most critical contingency is the loss of both 115 kV circuits between
McCall and Kingsburg Circuit 1, which would overload Henrietta-GWF 115 kV line. This limiting
contingency establishes an LCR of 128 MW in 2015.
The Reedley sub-area is a new sub-area identified by CAISO in 2015 Local Capacity Technical
Analysis, and loss of McCall-Reedley 115 kV line followed by Sangar-Reedley 115 kV line establishes
an LCR of 56 MW in 2015. In the study, CAISO has identified deficiency of 46 MW in the Reedley sub-
area.
Transmission Expansion Plans and New Generator Additions
In the board-approved 2010/2011 transmission plan, CAISO identified a number of transmission
upgrades that are needed in the Greater Fresno area to maintain system reliability between 2011
and 2020. PG&E proposed a number of projects to mitigate these reliability violations during the
2010 request window (CAISO 2011). Table J-6 lists the major PG&E projects that were found to be
needed by CAISO to maintain system reliability in the Greater Fresno Area.

State Water Resources Control Board California Environmental Protection Agency
Hydropower and Electric Grid Analysis of Lower San Joaquin River Flow Alternatives
Evaluation of San Joaquin River Flow and Southern Delta Water Quality Objectives and Implementation
J-11 September 2016
ICF 00427.11
Table J-6. Reliability Based Transmission Projects in Greater Fresno
Transmission Project Name Purpose In-Service
Date
Kerckhoff PH #2–Oakhurst 115 kV Line Project
Relieve expected overload on the Corsgold to Oakhurst 115 kV line under 2016–2020 system conditions
2015
Wilson 115 kV Area Reinforcement Project
Relieve a number of reliability violations expected under 2015–2020 system conditions
2015
Oro Loma 70 kV Area Reinforcement Project
Relieve overloads on lines and transformers in the Oro Loma Area under 2015–2020 system conditions
2015
Gates-Gregg 230 kV Transmission Line
Improve transmission reliability in the Greater Fresno area. Assist in the integration of renewable energy, helping to meet California’s Renewable Portfolio Standard (RPS). Alleviate constraints at the Helms pumped storage plant.
2022
Source: CAISO 2015a.
kV = kilovolt
A number of generators are also seeking interconnection in the Greater Fresno Area through 2018. Table
J-7 provides a list of selected projects that are at an advanced stage of the interconnection process.
Table J-7. Expected New Generator Additions in Greater Fresno
Fuel Type Interconnecting Sub-Station
Capacity
(MW) Expected In-Service Date County
Natural Gas Gates Substation 230kV bus 600 6/1/2017 Kings
Solar Schindler-Coalinga #2 70kV line 20 12/31/2015 Fresno
Solar Corcoran- Kingsburg #1 115kV line 20 6/1/2015 Kings
Solar Schindler-Huron-Gates 70kV line 20 12/1/2016 Fresno
Solar Panoche-Oro Loma 115kV Line 20 3/31/2016 Fresno
Solar Merced #1 70 kV 20 5/31/2018 Merced
Solar Los Banos-Westley 230kV 110 1/26/2016 Merced
Solar Henrietta-GWF 115 kV Line 100 1/10/2016 Kings
Solar Mendota Substation 115 kV bus 60 1/12/2016 Fresno
Solar Henrietta-Tulare Lake 70kV 20 12/30/2015 Kings
Solar Gates-Gregg 230 kV and Gates-McCall 230 kV 100 9/30/2016 Kings
Solar Helm-Panoche 230 kV and Panoche-Kearney 230kV 200 9/30/2016 Fresno
Solar Dairyland - Legrand 115 kV 20 12/1/2015 Madera
Solar Henrietta-Tulare Lake 70kV 20 12/31/2015 Kings
Solar Panoche-Schindler #1 & #2 115kV 60 10/1/2016 Fresno
Solar Giffen substation 70 KV 20 12/20/2016 Fresno
Solar Borden Sub 230 KV Bus 50 4/10/2016 Madera
Solar Los Banos-Panoche #1 230kV 200 10/1/2016 Merced
Solar Mustang Switchyard 230kV 150 30/9/2016 Kings
Source: CAISO 2015b.
Note: All above listed generators have signed interconnection agreements. kV = kilovolt

State Water Resources Control Board California Environmental Protection Agency
Hydropower and Electric Grid Analysis of Lower San Joaquin River Flow Alternatives
Evaluation of San Joaquin River Flow and Southern Delta Water Quality Objectives and Implementation
J-12 September 2016
ICF 00427.11
J.3.2 Ancillary Service Market
CAISO procures various ancillary services in the market. In the day-ahead and real-time markets,
CAISO procures regulation reserve, spinning reserve, and non-spinning reserve. In the hour-ahead
market, it procures only operating reserves, which comprise spinning and non-spinning reserves.
The ancillary services procured in the market are defined below.
Regulation Reserves: The generating resources that are running and synchronized with the grid,
which can provide reserve capacity so that the operating levels can be increased or decreased
within 10 minutes through Automatic Generation Control (AGC) signal based on the regulating
ramp rate of the resource. CAISO operates two distinct capacity markets for this service, upward
and downward regulation reserve.
Spinning Reserves: Reserved capacity provided by generating resources that are running with
additional capacity that is capable of ramping over a specified range within 10 minutes and able
to run for at least 2 hours. CAISO needs this reserve to maintain system frequency stability
during emergency operating conditions.
Non-Spinning Reserves: Reserved capacity provided by the generating resources that are
available but not running. These generating resources must be capable of being synchronized to
the grid and ramping to a specified level within 10 minutes, and then able to run for at least
2 hours. The CAISO needs non-spinning reserve to maintain system frequency stability during
emergency conditions.
The market participants (i.e., electricity providers) can self-provide any or all of these ancillary
service products, bid them into the CAISO markets, or purchase them from CAISO. The same
resource capacity may be offered for more than one ancillary service into the same CAISO market at
the same time. In addition, resources that have registered with a metered subsystem (MSS) that has
elected the load following option may submit self-provision bids for load following up and load
following down. Scheduling coordinators (SCs) simultaneously submit bids to supply the ancillary
service products to CAISO in conjunction with their preferred day-ahead and hour-ahead schedules.
J.3.3 Balancing Authority of Northern California and Sacramento Municipal Utility District
The Balancing Authority of Northern California (BANC) is a joint powers authority comprised of the
Sacramento Municipal Utility District (SMUD), MID, Roseville Electric, Redding Electric Utility and
Trinity Public Utility District. The third largest balancing authority in California, BANC assumed
balancing authorities from SMUD in 2011.
The SMUD, established in 1946, is the nation’s sixth largest community-owned electric utility in
terms of customers served (approximately 590,000) and covers a 900 square-mile area that
includes Sacramento County and a small portion of Placer County. The service territory of SMUD is
shown in Figure J-4.

State Water Resources Control Board California Environmental Protection Agency
Hydropower and Electric Grid Analysis of Lower San Joaquin River Flow Alternatives
Evaluation of San Joaquin River Flow and Southern Delta Water Quality Objectives and Implementation
J-13 September 2016
ICF 00427.11
Figure J-4. SMUD Service Territory and Other Territories in California (Source: CEC 2012)

State Water Resources Control Board California Environmental Protection Agency
Hydropower and Electric Grid Analysis of Lower San Joaquin River Flow Alternatives
Evaluation of San Joaquin River Flow and Southern Delta Water Quality Objectives and Implementation
J-14 September 2016
ICF 00427.11
As part of the biennial resource adequacy and resource plan assessments for publically owned
utilities, California Energy Commission (Commission) published its biennial report in November
2009 detailing the need and availability of generation resources to meet the future load and
planning reserve margin requirements within the territory of publically owned utilities (California
Energy Commission 2009). The report indicates that SMUD will be able to meet its resource
adequacy requirements in the near term; however, in 2018 SMUD’s generation resources may not be
sufficient to meet its load and planning reserve margin obligations. The deficiency expected in 2018
is estimated at 347 MW, but the Commission does not expect this to be an issue due to the lead time
available to resolve the expected deficiency.
Transmission Expansion Plans and New Generator Additions
SMUD also carries out an annual 10-year transmission planning process to ensure that NERC and
Western Electricity Coordinating Council (WECC) Reliability Standards are met each year of the 10-
year planning horizon. Major projects that have been proposed in the 2010 transmission plan for the
2016 to 2020 time period are listed in Table J-8 (Sacramento Municipal Utility District 2010). These
projects are expected to improve the reliability of SMUD’s electric system as well as increase its load
serving capability.
Table J-8. Proposed Transmission Upgrades in SMUD 2016–2020
Project Name Project Description Expected In-Service Date
Franklin 230/69 kV Substation New Distribution Substation May 31, 2016
O’Banion-Sutter 230 kV Double Circuit Transmission Line Conversion
Add circuit breakers to convert O’Banion-Sutter line to double circuit tower line
May 31, 2016
Installation of 200 MVAr transmission capacitors
Install transmission capacitors May 31, 2019
400 MW Iowa Hill Pump Storage Facility New Hydropower Plant in the Upper American River Project
May 31, 2020
Lake-Folsom 230 kV and Folsom -Orangevale 230 kV Reconductoring
Reconductor the Lake-Folsom –Orangevale 230 kV Lines
May 31, 2020
kV = kilovolt
MW = megawatts
The New Melones Power Plant physically resides in the CAISO Balancing Authority (BA) Area.
However, Sierra Nevada Region (SNR)6, SMUD, and the CAISO operate New Melones as a pseudo-tie
generation export from CAISO into the SMUD BA Area (Western 2010). This arrangement implies
that New Melones is electronically and operationally included as part of the SMUD BA Area. For
purposes of qualifying capacity, SNR has designated the New Melones Power Plant as part of the
Central Valley Project (CVP) resource in the SMUD BA Area. The location of New Melones is shown
in Figure J-1.
6 Sierra Nevada Region (SNR), is a certified scheduling coordinator and an LSE for certain loads and resources within the CAISO Balancing Authority Area.

State Water Resources Control Board California Environmental Protection Agency
Hydropower and Electric Grid Analysis of Lower San Joaquin River Flow Alternatives
Evaluation of San Joaquin River Flow and Southern Delta Water Quality Objectives and Implementation
J-15 September 2016
ICF 00427.11
J.3.4 Turlock Irrigation District
The Turlock Irrigation District (TID) operates as a BA located between Sacramento and Fresno in
California’s Central Valley (California Transmission Planning Group 2011). Westley 230 kV and
Oakdale 115 kV lines provide import access for TID. The TID BA incorporates all 662 square miles of
TID’s electric service territory (Figure J-5) as well as a 115 kV loop with three 115 kV substations
owned by the Merced Irrigation District (Merced ID). The Merced ID facilities are interconnected to
TID’s August and Tuolumne 115 kV substations and are located just south of TID’s service territory
and north of the city of Merced. TID is the majority owner and operating partner of the Don Pedro
Hydroelectric Project, with 68.46 percent ownership; MID has a 31.54 percent ownership.
Figure J-5. Turlock Irrigation District Service Area (Source: California Transmission Planning Group 2011)
J.4 Effects on Generating Capacity and Electric Grid In Section J.2, Energy Generation Effects, the total annual or monthly amounts of energy generated
(in GWh) by each LSJR alternative and the baseline were estimated and compared. This section
considers the effect of the LSJR alternatives on the amount of available power generating capacity
during the peak energy-use months of July and August (peak generating capacity) from the major
hydropower facilities in the LSJR Watershed (New Melones, New Don Pedro, and New Exchequer)
and the corresponding potential to affect the functioning of the electric grid (power flow
assessment) during the peak energy-use months of July and August.

State Water Resources Control Board California Environmental Protection Agency
Hydropower and Electric Grid Analysis of Lower San Joaquin River Flow Alternatives
Evaluation of San Joaquin River Flow and Southern Delta Water Quality Objectives and Implementation
J-16 September 2016
ICF 00427.11
J.4.1 Peak Generating Capacity
Peak generating capacity, expressed as MW, refers to the available generating capacity during the
peak energy-use months of July and August. This is the power that can be generated with full design
flow through the turbines at a given set of reservoir storages during July and August. As the storage
elevation in the reservoir is increased, the generating capacity through the turbines is increased.
The WSE model was used to estimate the end-of-month reservoir storage elevations for each LSJR
alternative and baseline across the 82 years of simulation.
Generating capacity during July and August is calculated based on estimates of the available head
(i.e. the difference between end-of-month reservoir storage elevation and tail-water elevation) for
generating electric power. The maximum potential capacity is assumed to occur at maximum head
(i.e., difference between the maximum elevation and tail-water elevation). Table J-9 shows the
maximum head and the corresponding maximum potential capacity for the New Melones, Don
Pedro, and New Exchequer hydropower facilities. Since the power generation capacity in MW is
directly proportional to the available head, the available capacity of affected hydropower plants in
any month under each LSJR alternative is estimated by prorating the maximum plant capacity by the
available head estimated from the WSE model. For example, if for any month, the model estimated
available head for New Melones is 500 feet (ft); using the maximum head and maximum capacity
values from Table J-9, its available capacity for that month is estimated at 256 MWor (300 MW x
[500 ft/585 ft]).
Available capacity = maximum potential capacity X (available head/maximum potential head)
Figures J-6 and J-7 present the total available generating capacity (MW) from New Melones, New
Don Pedro, and New Exchequer using this approach for peak demand months July and August
respectively across the 82 years of WSE model simulated hydrology for the LSJR alternatives and
baseline.At times when reservoir levels and hydropower capacity has been low under baseline,
reservoir levels and hydropower capacity under all three LSJR alternatives are higher. This is
primarily due to the increased storage in the driest years. These figures also show a decrease in the
available generation capacity for LSJR Alternatives 3 and 4 relative to baseline during at times when
reservoir levels and generating capacities were relatively high under baseline. LSJR Alternative 2 is
either similar to or higher than baseline at all capacity levels.
Table J-9. Existing Maximum Potential Power Generation Capacity
Power Plants
Maximum Potential Elevation
(Feet) Tail-water
Elevation (Feet)
Maximum Potential Head
(Feet)
Maximum Potential Capacity
(MW)
New Melones 1,088 503 585 300
Don Pedro 830 310 520 203
New Exchequer 867 400 467 95
MW = megawatt

State Water Resources Control Board California Environmental Protection Agency
Hydropower and Electric Grid Analysis of Lower San Joaquin River Flow Alternatives
Evaluation of San Joaquin River Flow and Southern Delta Water Quality Objectives and Implementation
J-17 September 2016
ICF 00427.11
Figure J-6. Exceedance Plot of Total Generating Capacity (megawatts) in July, Across 82 Years of Simulation, from the Three Major Tributary Hydropower Facilities, Comparing LSJR Alternatives 2–4 and Baseline.
Figure J-7. Exceedance Plot of Total Generating Capacity (megawatts) in August, Across 82 Years of Simulation, from the Three Major Tributary Hydropower Facilities, Comparing LSJR Alternatives 2–4 and Baseline.

State Water Resources Control Board California Environmental Protection Agency
Hydropower and Electric Grid Analysis of Lower San Joaquin River Flow Alternatives
Evaluation of San Joaquin River Flow and Southern Delta Water Quality Objectives and Implementation
J-18 September 2016
ICF 00427.11
J.4.2 Power Flow Assessment Methodology
As shown in the previous section, the LSJR alternatives have the potential to reduce hydropower
generation in the summer months because less water would be stored during those months as a
result of it being released earlier in the year, thereby reducing the amount of water available for
hydropower generation. Because California’s electric grid is most stressed during the summer
months of June–August, with peak demand typically occurring in the month of July, a reduction in
hydropower capacity during this time has the potential to further stress the grid.
LSJR Alternative 2 would not cause a reduction in power capacity from the baseline condition. LSJR
Alternatives 3 and 4 resulted in reductions of 2 percent and 4 percent, respectively, to median July
hydropower capacity of the three main facilities. The largest reductions in the distributions of the
July-August hydropower capacities occurred at the 60th to 70th percentiles (i.e., 40th to 30th percent
exceedance levels) and were 3 percent and 7 percent under LSJR Alternatives 3 and 4, respectively.
Percent reductions during August were similar to July.
In the WSE modeling, the reduced capacity available from hydropower facilities is not materially
different from the previous WSE model results provided in the Public 2012 SED used for the power
flow analysis. The previous power flow analysis conducted for LSJR Alternatives 3 and 4 assumed a
reduction in July capacity of 5 percent and 8 percent, respectively (slightly greater than the
currently modeled largest reductions of 3 percent and 7 percent). The results of 5 percent and 8
percent can inform potential impacts on California’s electric grid.
According to NERC, reliability of an electric system comprises two interrelated elements—adequacy
and security. Adequacy refers to the amount of capacity resources required to meet peak demand
and security refers to the ability of the system to withstand contingencies or other system
disturbances, such as the loss of a generating unit or transmission line. Both of these reliability
aspects can be gauged from sub-station voltages and transmission line loadings. A steady state
power flow assessment of the California grid was performed to check if reduction in hydropower
capacities of the three rim dams would adversely impact the grid reliability as defined by NERC.7
The power flow assessment was a multi-step process. These steps and assumptions are listed below.
Prepare a Base Case (California electric grid model under normal and contingency conditions,
assuming the facility is in normal operation).8
Prepare two separate Change Cases (California electric grid model under normal and
contingency conditions assuming reduced output of the facilities) assuming a 5 percent and 8
percent reduction in available hydropower generating capacity from the New Melones, New Don
Pedro, and New Exchequer hydropower facilities.
Develop criteria for selection of generator and transmission contingencies.
Develop criteria for voltage and thermal limits.
Select the areas where transmission line/transformer loadings and sub-station voltages would
be monitored.
7 Power flow software models simulate the operation of the grid and calculate substation voltages and power flowing on transmission lines/transformers. These calculated values can then be compared with standard voltage limits and line/transformer thermal ratings to identify violations. 8 Under normal conditions, all generation and transmission facilities are assumed to be in service. Contingency conditions refer to the unplanned outage of power system equipment.

State Water Resources Control Board California Environmental Protection Agency
Hydropower and Electric Grid Analysis of Lower San Joaquin River Flow Alternatives
Evaluation of San Joaquin River Flow and Southern Delta Water Quality Objectives and Implementation
J-19 September 2016
ICF 00427.11
Base and Change Case Development
The base case was the latest 2011 heavy summer (high summer power demand) electric grid model
of the entire Western Interconnection developed by WECC. This case had a detailed representation
of the California electric grid. A summary of load, generation, area interchange, and area losses in
the base case is shown in Table J-10.
Table J-10. Representation of the California Electric Grid (Base Case)
Power Flow Area #
Power Flow Area Name
Area Generation (MW)
Area Load (MW)
Area Interchange (MW)
Area Loss (MW)
10 NEW MEXICO 2,955 2,690 105 159
11 EL PASO 978 1,644 -730 64
14 ARIZONA 26,323 19,753 6,284 286
18 NEVADA 5,721 6,338 -708 91
20 MEXICO-CFE 2,108 2,304 -230 34
21 IMPERIALCA 1,100 978 90 31
22 SANDIEGO 3,666 4,930 -1,371 107
24 SOCALIF 17,929 25,278 -7,842 492
26 LADWP 4,554 6,537 -2,410 427
30 PG AND E 27,231 27,050 -784 966
40 NORTHWEST 30,956 25,165 4,507 1,285
50 B.C.HYDRO 11,137 7,900 2,572 665
52 FORTISBC 879 733 127 20
54 ALBERTA 9,971 10,022 -400 349
60 IDAHO 4,058 3,703 139 216
62 MONTANA 3,192 1,837 1,252 102
63 WAPA U.M. 56 -44 92 7
64 SIERRA 1,889 2,037 -208 60
65 PACE 7,914 8,528 -918 304
70 PSCOLORADO 7,531 7,840 -510 200
73 WAPA R.M. 5,998 4,870 941 188
MW = megawatt
Two change cases were developed for the hydropower generation facilities. One change case was
prepared with the peak generating capacity of each hydropower facility (New Melones, New Don
Pedro, and New Exchequer) reduced by 5 percent of its value in the base case (5 percent less
available peak generating capacity than in the base case). The second change case was prepared
assuming 8 percent of its value in the base case. Table J-11 summarizes the modeled cases. The total
peak generating capacity for these three hydropower facilities assumed in the WECC base case
simulation is approximately 400 MW and represents a level that is exceeded about 90 percent of
years in both July and August as shown in Figures J-6 and J-7, respectively.

State Water Resources Control Board California Environmental Protection Agency
Hydropower and Electric Grid Analysis of Lower San Joaquin River Flow Alternatives
Evaluation of San Joaquin River Flow and Southern Delta Water Quality Objectives and Implementation
J-20 September 2016
ICF 00427.11
Table J-11. Description of Test Cases Modeled
Case Description Peak Generating Capacity Normal Conditions Contingency Conditions
Base Case Normal(a) √ √
Change Case #1 Reduced by 5% √ √
Change Case #2 Reduced by 8% √ √ a. WECC base case peak generating capacities for New Melones, New Don Pedro, and New Exchequer
facilities.
Contingency Selection Criteria
Base and change cases were analyzed for single contingency outage of all the transmission facilities
rated 115 kV and above within the BA of the generating facilities, and 230 kV and above in the
neighboring BAs or regions.9 Single contingency outage of all generators rated 100 MW or above,
both within the BA of the facilities and in the neighboring BAs, were also used to analyze the
performance of electric grid under base and change cases. In the power flow, all the facilities are
shown to be a part of PG&E area with Southern California Edison, Northwest, and Sierra as
neighboring regions.
Voltage and Transmission Line Limits
The transmission line limits used in the study were the normal and Long-Term Emergency (LTE)
ratings. Under normal and contingency conditions, transmission line flows are expected to remain
within the normal and long-term emergency ratings, respectively. Similarly, voltage limits were
established relative to the nominal voltages. Under normal conditions, system operators regulate
nodal voltages within ±5 percent of their nominal values. Under contingency conditions, this limit is
relaxed to ±10 percent of the nominal value.
Criteria for Monitoring Transmission Elements
Within the BA of the facilities, the following criteria for monitoring transmission line/transformer
loadings and sub-station voltages were used:10
All transmission lines with nominal voltage greater than 115 kV.
All transformers with both nominal primary and secondary voltage greater than 115 kV.
In the neighboring Balancing Authorities, the following criteria for monitoring
transmission/transformer loadings and sub-station voltages were used:
All transmission lines with nominal voltage greater than 230 kV.
All transformers with both primary and secondary voltage greater than 230 kV.
9 In the context of this analysis, neighboring region or neighboring BA is defined as a region which has a direct transmission link with the region in which the facility is located. 10 The loading of a transmission line or transformer is measured as a ratio of the actual flow across the facility in amperes or mega-volt amperes to the rated value of current. In this analysis, only those lines/transformers whose loading exceeds 90% of the applicable rating are recorded.

State Water Resources Control Board California Environmental Protection Agency
Hydropower and Electric Grid Analysis of Lower San Joaquin River Flow Alternatives
Evaluation of San Joaquin River Flow and Southern Delta Water Quality Objectives and Implementation
J-21 September 2016
ICF 00427.11
The WECC paths in California (referred to as “interfaces” hereafter) were also monitored. These are
listed in Table J-12.11
Table J-12. WECC Paths Monitored
WECC Path Number WECC Path Name
15 Midway-Los Banos
24 PG&E-Sierra
25 PacifiCorp/PG&E 115 kV Interconnection
26 Northern-Southern California
52 Silver Peak-Control 55 kV
60 Inyo-Control 115 kV Tie
66 COI
76 Alturas Project
Source: Western Congestion Analysis Task Force 2006.
kV = kilovolt
J.4.3 Power Flow Simulation Tools
The GE® Positive Sequence Load Flow (PSLF) model was used for this analysis. PSLF is ideal for
simulating the transfer of large blocks of power across a transmission grid or for importing or
exporting power to neighboring systems. The model can be used to perform comprehensive and
accurate load flow, dynamic simulation, short circuit and contingency analysis, and system fault
studies. Using this tool, engineers can also analyze transfer limits while performing economic
dispatch. PSLF can simulate large-scale power systems of up to 80,000 buses.12
J.4.4 Assumptions for Facilities
The assumptions for the generation facility characteristics and interconnection substations are
shown in Table J-13. Other assumptions, including transmission facility normal and long-term
emergency ratings, transmission line impedances, and substation nominal voltages were defined in
the WECC power flow cases used for the assessment.
Table J-13. Unit Assumptions for the Engineering Assessment
Unit Name Unit Bus Number in WECC Power Flow Case Interconnection Voltage (kV)
New Melones 37561, 37562 230
Don Pedro 38550, 38552, 38554 69
New Exchequer 34306 115
kV = kilovolt
11 WECC Paths refer to either an individual transmission line or a combination of parallel transmission lines on which the total power flow should not exceed a certain value to maintain system reliability. 12 In Power Flow modeling a “bus” represents all the sub-station equipment that is at the same voltage level and is connected together.

State Water Resources Control Board California Environmental Protection Agency
Hydropower and Electric Grid Analysis of Lower San Joaquin River Flow Alternatives
Evaluation of San Joaquin River Flow and Southern Delta Water Quality Objectives and Implementation
J-22 September 2016
ICF 00427.11
J.4.5 Results and Conclusions
Thousands of transmission lines, nodal voltages, and interfaces under normal system conditions and
contingency outages of hundreds of transmission lines and generators were monitored under the
base and change cases. The base case sub-station voltages and line/transformer loadings were then
compared with those of the change cases. If the comparison showed that sub-station voltages or
transmission line/transformer loadings are within limits in the base case, but outside the limits in
the change cases (i.e., the 5 percent and 8 percent identified in Section J.4.2, Power Flow Assessment
Methodology), the unimpaired flow alternatives could be considered to have an adverse impact on
the reliability of California’s electric grid. Results of the power flow assessment are discussed below.
Comparison between Base and Change Case Line/Transformer Loadings under Normal Conditions
Under normal operating conditions, no transmission line or transformer was found that violated the
ratings exclusively in the change cases.
Comparison between Base and Change Case Line/Transformer Loadings under Line/Transformer Contingencies
When base and change cases were studied under transmission line and transformer contingencies,
no line/transformer limit violation was found for the base case and change case #1. However, for
change case #2, the 230 kV line between Borden and Gregg substations showed a minor violation
(100.04 percent of its LTE rating) under the outage of the 230 kV line between Gregg and Storey
substations. This minor overload was mitigated through a 5 MW reduction in the total power
dispatch (1,148 MW in the base case) of the three Helms units. The new loading of the monitored
element after this re-dispatch was 99.81 percent.
Comparison between Base and Change Case Line/Transformer Loadings under Generator Contingencies
Under generator contingencies, no line/transformer limit violations were found that could be
exclusively attributed to either change case.
Comparison between Base and Change Case Substation Voltages under Normal and Line/Transformer/Generator Contingencies
No voltage violations were found that could be exclusively attributed to the reduced hydropower
capacity in the change cases.
Comparison between Base and Change Case Interface Loadings under Normal and Line/Transformer/Generator Contingencies
No interface limit violations were found that could be exclusively attributed to the reduced
hydropower capacity in the change cases.
In conclusion, an engineering assessment was performed to determine if implementation of the
unimpaired flow alternatives on the tributaries, and the resulting change in hydropower generation
at the hydropower plants, would adversely impact the reliability of California’s electric grid.

State Water Resources Control Board California Environmental Protection Agency
Hydropower and Electric Grid Analysis of Lower San Joaquin River Flow Alternatives
Evaluation of San Joaquin River Flow and Southern Delta Water Quality Objectives and Implementation
J-23 September 2016
ICF 00427.11
As described in Section J.4.1, Peak Generating Capacity, there is a less-than-significant reduction in
available hydropower generating capacity associated with the LSJR alternatives in the peak summer
load months of July and August. Additional evaluation determined the electric grid could adapt to 5
percent and 8 percent reductions in available generating capacity from the New Melones, New Don
Pedro, and New Exchequer hydropower facilities with less-than-significant impact on its reliability.
Based on the results of this study, the San Joaquin River Flow Objectives project would not adversely
impact the reliability of California’s electric grid.
J.5 References Cited California Energy Commission (CEC). 2009. An Assessment of Resource Adequacy and Resource Plans
of Publicly Owned Utilities in California, California Energy Commission. November. Available:
http://www.energy.ca.gov/2009publications/CEC-200-2009-019/CEC-200-2009-019.PDF.
Accessed: November 2011.
———. 2012. California Power Plant Database (Excel File). Available:
http://energyalmanac.ca.gov/electricity/index.html#table. Accessed: February 2012.
California Independent System Operators (CAISO). 2005. Local Capacity Technical Analysis.
Overview of Study Report and Final Results. September 23.
———. 2010a. 2011 Local Capacity Technical Analysis. Final Report and Study Results.
———. 2010b. Final Manual: 2012 Local Capacity Area Technical Study. December.
———. 2011. 2010–2011 Transmission Plan. May 18.
———. 2015a. Board-approved 2014–2015 Transmission Plan. March 27.
———. 2015b. Generator Interconnection Queue. Available:
http://www.caiso.com/planning/Pages/GeneratorInterconnection/Default.aspx.
California Public Utilities Commission (CPUC). 2011. California Public Utilities Commission. Available:
http://www.cpuc.ca.gov. Accessed: November 2011.
California Transmission Planning Group. 2011. Turlock Irrigation District (TID) Minimum Generation
Requirements. Available: http://www.ctpg.us/images/stories/ctpg-plan-
development/2011/07-Jul/2011-07-18_TID_min_gen_req.pdf. Accessed: November 2011.
Sacramento Municipal Utility District (SMUD). 2010. Ten-Year Transmission Assessment Plan.
December 22. Available:
http://westconnect.com/filestorage/2010_SMUD_10YearPlan_Final.pdf. Accessed: November
2011.
SNL Financial LC. n.d. Accessed: August 2016.
The Engineering Toolbox. 2016. Hydropower. Available:
http://www.engineeringtoolbox.com/hydropower-d_1359.html. Accessed: August 2016
Ventyx Velocity Suite. n.d. Licensed mapping database.

State Water Resources Control Board California Environmental Protection Agency
Hydropower and Electric Grid Analysis of Lower San Joaquin River Flow Alternatives
Evaluation of San Joaquin River Flow and Southern Delta Water Quality Objectives and Implementation
J-24 September 2016
ICF 00427.11
Western Area Power Administration (Western). 2010. Final Resource Adequacy (RA) Plan. Federal
Register 72 FR 41317.
Western Congestion Analysis Task Force. 2006. Western Interconnection 2006 Congestion Assessment
Study. Available:
http://nietc.anl.gov/documents/docs/DOE_Congestion_Study_2006_Western_Analysis.pdf.
Accessed: December 2012.