appendix i sediment data redwood city navigation ... and programs/navigation...0.96 1.1: 0.75 0.85:...
TRANSCRIPT

Appendix I
Sediment Data
Redwood City Harbor Navigation Improvement Integrated Feasibility Report and EIS/EIR
June 2015

Table I-1Redwood City Harbor Navigation Improvement Integrated Feasibility Study and EIS/EIR
Sediment Chemistry
2 of 53
Analyte
1 2 3 4 5 6 7 8 9 10 9A 9B 10A 10B
Grain Size (%, dry wt)
Sand/Gravel (>0.063 mm) 2.6 1.4 1 1.2 2.2 1 0.3 0.4 0.6 0.7 7 7.6 6 5
Silt (0.004 mm - 0.063 mm 40.6 40 41 37.4 34.4 33.3 30.7 32.1 30.3 29.4 29 30 29 29
Clay (<0.004 mm) 56.8 58.6 58 61.4 63.4 65.7 69 67.5 68.8 69.9 64 64 66 66
Conventionals
% Solids (%) 41.5 44.1 43 41 40.4 41.8 39.6 38.8 36.7 37.4 37 33 34 35
TOC (%) 1.48 1.25 1.2 1.42 1.33 1.31 1.35 1.36 1.47 1.46 0.68 0.85 1.4 1.2
Metals (mg/kg, ppm, dry wt)
Antimony
Arsenic 8.2 7.4 7.2 7.9 8.3 8.2 7.9 9.4 7.8 7.7 9.4 9.9 9.2 7.4
Barium
Beryllium
Cadmium 0.18 0.14 0.1 0.17 0.24 0.2 0.2 0.26 0.29 0.27 0.2 0.39 0.35 0.36
Chromium 97.4 76.2 75 82.2 92.3 93.6 92.2 103 95.3 86.7 190 170 140 160
Cobalt
Copper 47.1 40.7 41 46 50.6 51.4 49.4 60.8 57.9 58.3 74 75 68 75
Lead 37.4 33.4 33 37.6 41.1 41.7 42.5 49 47.4 45.2 54 50 47 45
Mercury 0.32 0.33 0.3 0.33 0.36 0.36 0.34 0.39 0.41 0.4 0.84 0.48 0.54 0.53
Nickel 89.1 77 75 84.1 91 90.6 89.3 99.5 95.1 90.6 140 160 110 130
Selenium <0.5 <0.5 <0.5 <0.5 <0.5 <0.5 <0.5 <0.5 <0.5 <0.5 0.41 0.35 0.38 0.37
Silver 0.65 0.57 0.6 0.62 0.66 0.71 0.68 0.66 0.87 0.96 1.1 0.75 0.85 0.89
Thallium
Vanadium
Zinc 116 108 106 118 129 128 126 146 138 132 190 200 150 190
Butyltins (microgram/kg, ppb, dry wt)
Monobutylin <10 <10 <10 <10 <10 <10 <10 <10 <10 <10 <1.0 <1.0 <1.0 <1.0
Dibutylin <10 <10 <10 <10 <10 <10 <10 <10 19 14 8.2 6.3 6.5 8.3
Tributylin <10 11 14 12 12 17 <10 <10 26 19 5.9 6.6 5.1 6
Tetrabutylin -- -- -- -- -- -- -- -- -- -- <1.0 <1.0 <1.0 <1.0
Total (Σ detected) Butyltins 0 11 14 12 12 17 0 0 45 33 14.1 12.9 11.6 14.3
Pesticides (microgram/kg, ppb, dry)Aldrin <2 <2 <2 <2 <2 <2 <2 <2 <2 <2 <3.0 <3.0 <3.0 <3.0
alpha-BHC <2 <2 <2 <2 <2 <2 <2 <2 <2 <2 <3.0 <3.0 <3.0 <3.0
beta-BHC <2 <2 <2 <2 <2 <2 <2 <2 <2 <2 <3.0 <3.0 <3.0 <3.0
delta-BHC <2 <2 <2 <2 <2 <2 <2 <2 <2 <2 <3.0 <3.0 <3.0 <3.0
Gamma-BHC (Lindane) <2 <2 <2 <2 <2 <2 <2 <2 <2 <2 <3.0 <3.0 <3.0 <3.0
Total BHCs
alpha-Chlordane
gamma-Chlordane
Nov-95 Nov-97

Table I-1Redwood City Harbor Navigation Improvement Integrated Feasibility Study and EIS/EIR
Sediment Chemistry
3 of 53
Analyte
1 2 3 4 5 6 7 8 9 10 9A 9B 10A 10B
Nov-95 Nov-97
Chlordane -- -- -- -- -- -- -- -- -- -- <6.0 <6.0 <6.0 <6.0
Total Chlordane
4,4'-DDD <2 <2 <2 <2 <2 5 <2 <2 <2 <2 <3.0 <3.0 <3.0 <3.0
4,4'-DDE <2 <2 <2 <2 2 6 2 5 3 3 5.4 3.6 4.4 4.5
4,4'-DDT <2 <2 <2 <2 <2 <2 <2 <2 <2 <2 <3.0 <3.0 <3.0 <3.0
2,4'-DDD -- -- -- -- -- -- -- -- -- -- -- -- -- --
2,4'-DDE -- -- -- -- -- -- -- -- -- -- -- -- -- --
2,4'-DDT -- -- -- -- -- -- -- -- -- -- -- -- -- --
Total (Σ detected) DDTs 0 0 0 0 2 11 2 5 3 3 5.4 3.6 4.4 4.5
Dieldrin <2 <2 <2 <2 <2 <2 <2 <2 <2 <2 <3.0 <3.0 <3.0 <3.0
Endosulfan I <2 <2 <2 <2 <2 <2 <2 <2 <2 <2 <3.0 <3.0 <3.0 <3.0
Endosulfan II <2 <2 <2 <2 <2 <2 <2 <2 <2 <2 <3.0 <3.0 <3.0 <3.0
Endosulfan sulfate <10 <10 <10 <10 <10 <10 <10 <10 <10 <10 <3.0 <3.0 <3.0 <3.0
Endrin <2 <2 <2 <2 <2 <2 <2 <2 <2 <2 <3.0 3 7.6 6.2
Endrin Aldehyde <2 <2 <2 <2 <2 <2 <2 <2 <2 <2 <3.0 <3.0 <3.0 <3.0
Endrin Ketone
Heptachlor <2 <2 <2 <2 <2 <2 <2 <2 <2 <2 <3.0 <3.0 <3.0 <3.0
Heptachlor epoxide <10 <10 <10 <10 <10 <10 <10 <10 <10 <10 <3.0 <3.0 <3.0 <3.0
Methoxychlor
Toxaphene -- -- -- -- -- -- -- -- -- -- <45 <45 <45 <45
trans-Nonachlor
Aroclor PCBs (microgram/kg, ppb dry wt)PCB 1016 -- -- -- -- -- -- -- -- -- -- -- -- -- --
PCB 1221 -- -- -- -- -- -- -- -- -- -- -- -- -- --
PCB 1232 -- -- -- -- -- -- -- -- -- -- -- -- -- --
PCB 1242 <50 <50 <50 <50 <50 <50 <50 <50 <50 <50 <30 <30 <30 <30
PCB 1248 <50 <50 <50 <50 <50 <50 <50 <50 <50 <50 <30 <30 <30 <30
PCB 1254 <50 <50 <50 <50 <50 180 <50 180 84 73 <30 <30 <30 <30
PCB 1260 <50 <50 <50 <50 <50 <50 <50 <50 <50 <50 51 33 56 42
Total (Σ detected) PCBs 0 0 0 0 0 180 0 180 84 73 51 33 56 42
PCB Congeners (microgram/kg, ppb dry wt)PCB008
PCB018
PCB028
PCB031
PCB033
PCB044
PCB049
PCB052

Table I-1Redwood City Harbor Navigation Improvement Integrated Feasibility Study and EIS/EIR
Sediment Chemistry
4 of 53
Analyte
1 2 3 4 5 6 7 8 9 10 9A 9B 10A 10B
Nov-95 Nov-97
PCB056
PCB060
PCB066
PCB070
PCB074
PCB087
PCB095
PCB097
PCB099
PCB101
PCB105
PCB110
PCB118
PCB128

Table I-1Redwood City Harbor Navigation Improvement Integrated Feasibility Study and EIS/EIR
Sediment Chemistry
5 of 53
Analyte
1 2 3 4 5 6 7 8 9 10 9A 9B 10A 10B
Nov-95 Nov-97
PCB132
PCB138/158
PCB141
PCB149
PCB151
PCB153
PCB156
PCB170
PCB174
PCB177
PCB180
PCB183
PCB187
PCB194
PCB195
PCB201
PCB203Total (∑ detected) PCB Congeners
PAHs (micrograms/kg, ppb, dry wt) 1-Methylnaphthalene
1-Methylphenanthrene
2,3,5-Trimethylnaphthalene
2,6-Dimethylnaphthalene
2-Methylnaphthalene
Acenapthene <20 <20 <20 <20 <20 <20 <20 <20 <20 <20 <22 <22 <22 <22
Acenaphthylene <20 <20 <20 <20 <20 34 <20 <20 <20 <20 <22 <22 <22 <22
Anthracene <20 <20 <20 <20 <20 74 <20 32 21 27 22 57 59 54
Benzo(a)anthracene 40 36 43 29 34 120 38 53 41 45 65 120 120 120
Benzo(a)pyrene 90 81 95 68 84 290 98 110 110 120 200 390 380 400
Benzo(b)fluoranthene 93 78 100 74 92 340 110 120 130 130 140 290 350 340
Benzo(e)pyrene
Benzo(g,h,i)perylene 98 86 100 73 98 310 110 120 120 130 210 390 380 400
Benzo(k)fluoranthene 28 30 26 21 27 99 30 44 39 48 120 240 230 230
Biphenyl
Chrysene 47 40 48 34 39 150 46 65 54 57 87 160 180 160
Dibenzo(a,h)anthracene <20 <20 <20 <20 <20 32 <20 <20 <20 <20 <57 <57 <57 <57
Dibenzothiophene
Fluoranthene 150 130 150 120 120 440 130 180 130 150 150 270 270 270
Fluorene <20 <20 <20 <20 <20 <20 <20 <20 <20 <20 <22 <22 <22 <22
Indeno(1,2,3-cd)pyrene 75 69 81 57 82 280 100 110 100 110 250 480 500 540

Table I-1Redwood City Harbor Navigation Improvement Integrated Feasibility Study and EIS/EIR
Sediment Chemistry
6 of 53
Analyte
1 2 3 4 5 6 7 8 9 10 9A 9B 10A 10B
Nov-95 Nov-97
Naphthalene <20 <20 <20 <20 <20 29 <20 <20 <20 <20 <22 <22 <22 <22
Perylene
Phenanthrene 58 45 53 42 40 130 38 63 41 47 70 120 130 130
Pyrene 210 170 210 170 180 690 180 230 220 250 240 420 440 420
Total LPAHs
Total HPAHs
Total (Σ detected )PAHs 889 765 926 688 796 3018 880 1127 1006 1114 1600 2900 3000 3100
Dioxins/Furans (ng/kg, dry wt)2,3,7,8-Tetra CDD
1,2,3,7,8-Penta CDD
1,2,3,4,7,8-Hexa CDD
1,2,3,6,7,8-Hexa CDD
1,2,3,7,8,9-Hexa CDD
1,2,3,4,6,7,8-Hepta CDD
Total Octa CDD
Total Tetra CDD
Total Penta CDD
Total Hexa CDD
Total Hepta CDD
2,3,7,8-Tetra CDF
1,2,3,7,8-Penta CDF
2,3,4,7,8-Penta CDF
1,2,3,4,7,8-Hexa CDF
1,2,3,6,7,8-Hexa CDF
2,3,4,6,7,8-Hexa CDF
1,2,3,7,8,9-Hexa CDF
1,2,3,4,6,7,8-Hepta CDF
1,2,3,4,7,8,9-Hepta CDF
Octa CDF
Total Tetra CDF
Total Penta CDF
Total Hexa CDF
Total Hepta CDF
Total TEQ
Effects Range-Median Quotient (ERMq)FOOTNOTES:
Exceeds SF Bay Ambient Levels
Exceeds SF-DODS Database Values*
Exceeds more than one reference value

Table I-1Redwood City Harbor Navigation Improvement Integrated Feasibility Study and EIS/EIR
Sediment Chemistry
7 of 53
Analyte
Grain Size (%, dry wt)
Sand/Gravel (>0.063 mm)
Silt (0.004 mm - 0.063 mm
Clay (<0.004 mm)
Conventionals
% Solids (%)
TOC (%)
Metals (mg/kg, ppm, d
Antimony
Arsenic
Barium
Beryllium
Cadmium
Chromium
Cobalt
Copper
Lead
Mercury
Nickel
Selenium
Silver
Thallium
Vanadium
Zinc
Butyltins (microgram/k
Monobutylin
Dibutylin
Tributylin
Tetrabutylin
Total (Σ detected) Butyltins
Pesticides (microgram Aldrin
alpha-BHC
beta-BHC
delta-BHC
Gamma-BHC (Lindane)
Total BHCs
alpha-Chlordane
gamma-Chlordane
1 2 3 4 5 6 7 SF-11
2.9 2 1.1 0.7 0.8 0.8 1.7 90.7
56.7 56.7 61.7 65.6 86.9 69.4 71.1 0.5
40.3 41.3 37.1 33.7 30.4 29.8 27.2 1.8
43.6 44 41.1 40 38.3 38.3 38.6 83.5
1.4 1.3 1.4 1.5 1.4 1.5 1.6 0.2
8.8 8.8 9.3 9.4 9.4 9.2 8.9 5.4
<0.2 <0.2 <0.2 <0.3 <0.3 <0.3 0.4 <0.1
80.5 7.8 79.8 86.2 87.2 86.6 88.7 18
42.4 44.4 44.6 46 49.6 49.6 67 2.5
27.9 31.5 27.7 28.6 30.7 32 42.9 3.1
0.31 0.29 0.25 0.29 0.33 0.32 0.42 <0.02
78.8 80 84.7 86.9 90.5 87 93.1 18.8
0.7 0.6 0.7 0.7 0.7 0.6 0.7 <0.1
0.4 0.5 0.3 2 0.4 0.3 0.8 <0.1
102 107 108 112 118 120 134 13.5
<4.6 <4.5 <4.9 <5.0 <5.2 <5.2 <5.2 <2.4
<4.6 <4.5 <4.9 <5.0 <5.2 <5.2 <5.2 <2.4
<2.3 <2.3 <2.4 <2.5 <2.6 <2.6 <2.6 <1.2
<2.3 <2.3 <2.4 <2.5 <2.6 <2.6 <2.6 <1.2
0 0 0 0 0 0 0 0
<1.22 <1.20 <1.29 <1.33 <1.38 <1.38 <1.37 <0.63
<2.29 <2.27 <2.43 <2.51 <2.61 <2.61 <2.59 <1.20
<1.41 <1.40 <1.5 <1.54 <1.61 <1.61 <1.59 <1.74
<1.47 <1.45 <1.56 <1.6 <1.67 <1.67 <1.66 <1.77
<1.44 <1.43 <1.53 <1.58 <1.64 <1.64 <1.63 <0.75
May-01

Table I-1Redwood City Harbor Navigation Improvement Integrated Feasibility Study and EIS/EIR
Sediment Chemistry
8 of 53
Analyte
Chlordane
Total Chlordane
4,4'-DDD
4,4'-DDE
4,4'-DDT
2,4'-DDD
2,4'-DDE
2,4'-DDT
Total (Σ detected) DDTs
Dieldrin
Endosulfan I
Endosulfan II
Endosulfan sulfate
Endrin
Endrin Aldehyde
Endrin Ketone
Heptachlor
Heptachlor epoxide
Methoxychlor
Toxaphene
trans-Nonachlor
Aroclor PCBs (microgr PCB 1016
PCB 1221
PCB 1232
PCB 1242
PCB 1248
PCB 1254
PCB 1260
Total (Σ detected) PCBs
PCB Congeners (micro PCB008
PCB018
PCB028
PCB031
PCB033
PCB044
PCB049
PCB052
1 2 3 4 5 6 7 SF-11
May-01
<5.42 <5.29 <5.75 <5.93 <6.17 <6.17 <6.13 <2.83
<1.41 <1.40 <1.5 <1.54 <1.61 <1.61 <1.59 <0.74
<1.23 <1.22 <1.3 <1.34 <1.40 <1.40 <1.39 <0.64
<2.29 <2.27 <2.43 <2.51 <2.61 <2.61 <2.59 <1.20
<1.41 <1.40 <1.5 <1.54 <1.61 <1.61 <1.59 <0.74
<1.23 <1.22 <1.3 <1.34 <1.40 <1.40 <1.39 <0.64
<2.29 <2.27 <2.43 <2.51 <2.61 <2.61 <2.59 <1.20
0 0 0 0 0 0 0 0
<1.49 <1.48 <1.58 <1.63 <1.70 <1.70 <1.69 <0.78
<1.87 <1.85 <1.98 <2.04 <2.13 <2.13 <2.11 <0.98
<1.95 <1.93 <2.07 <2.13 <2.22 <2.22 <2.20 <1.02
<1.65 <1.64 <1.75 <1.80 <1.88 <1.88 <1.87 <0.86
<1.72 <1.70 <1.82 <1.88 <1.96 <1.96 <1.94 <0.90
<1.86 0.84 <1.97 <2.03 <2.11 <2.11 <2.10 <0.97
<1.92 <1.90 <1.03 <2.09 <2.18 <2.18 <2.16 <1.00
<1.90 <1.89 <2.02 <2.08 <2.17 <2.17 <2.15 <0.99
<10.1 <10.0 <10.7 <11 <11.5 <11.5 <11.4 <5.27
-- -- -- -- -- -- -- --
-- -- -- -- -- -- -- --
-- -- -- -- -- -- -- --
<5.3 <5.2 <5.6 <5.8 <6.0 <6.0 <6.0 <2.8
<5.3 <5.2 <5.6 <5.8 <6.0 <6.0 <6.0 <2.8
<5.3 <5.2 <5.6 <5.8 <6.0 <6.0 <6.0 <2.8
<5.3 <5.2 <5.6 <5.8 <6.0 <6.0 <6.0 <2.8
0 0 0 0 0 0 0 0

Table I-1Redwood City Harbor Navigation Improvement Integrated Feasibility Study and EIS/EIR
Sediment Chemistry
9 of 53
Analyte
PCB056
PCB060
PCB066
PCB070
PCB074
PCB087
PCB095
PCB097
PCB099
PCB101
PCB105
PCB110
PCB118
PCB128
1 2 3 4 5 6 7 SF-11
May-01

Table I-1Redwood City Harbor Navigation Improvement Integrated Feasibility Study and EIS/EIR
Sediment Chemistry
10 of 53
Analyte
PCB132
PCB138/158
PCB141
PCB149
PCB151
PCB153
PCB156
PCB170
PCB174
PCB177
PCB180
PCB183
PCB187
PCB194
PCB195
PCB201
PCB203Total (∑ detected) PCB Co
PAHs (micrograms/kg 1-Methylnaphthalene
1-Methylphenanthrene
2,3,5-Trimethylnaphthalene
2,6-Dimethylnaphthalene
2-Methylnaphthalene
Acenapthene
Acenaphthylene
Anthracene
Benzo(a)anthracene
Benzo(a)pyrene
Benzo(b)fluoranthene
Benzo(e)pyrene
Benzo(g,h,i)perylene
Benzo(k)fluoranthene
Biphenyl
Chrysene
Dibenzo(a,h)anthracene
Dibenzothiophene
Fluoranthene
Fluorene
Indeno(1,2,3-cd)pyrene
1 2 3 4 5 6 7 SF-11
May-01
<8.3 <8.2 <8.8 <9.0 <9.4 <9.4 <9.3 <4.3
<10.8 <10.7 <11.4 <11.8 <12.3 <12.3 <12.2 <5.6
<14.4 <14.3 <15.3 <15.8 <16.4 <16.4 <16.3 <7.5
64 59 <16.3 <16.8 <17.5 <17.5 <17.4 <8.0
149 140 40 40 30 27 20 <8.9
100 92 <21.7 27 <23.2 25 <23.1 <10.7
85 96 <23.6 <24.3 <25.3 <25.3 <25.1 <11.6
50 44 <16.5 <17.0 <17.8 <17.8 <17.6 <8.1
67 67 13 13 <10.2 <10.2 <10.1 <4.7
<21.1 <20.9 <22.4 <23.1 24 <24 <23.8 <11
191 176 80 91 45 91 21 <6.9
<10.6 <10.5 <11.2 <11.5 <12 <12 <11.9 <5.5
99 92 <24.3 27 27 <26.1 <25.9 <12

Table I-1Redwood City Harbor Navigation Improvement Integrated Feasibility Study and EIS/EIR
Sediment Chemistry
11 of 53
Analyte
Naphthalene
Perylene
Phenanthrene
Pyrene
Total LPAHs
Total HPAHs
Total (Σ detected )PAHs
Dioxins/Furans (ng/kg 2,3,7,8-Tetra CDD
1,2,3,7,8-Penta CDD
1,2,3,4,7,8-Hexa CDD
1,2,3,6,7,8-Hexa CDD
1,2,3,7,8,9-Hexa CDD
1,2,3,4,6,7,8-Hepta CDD
Total Octa CDD
Total Tetra CDD
Total Penta CDD
Total Hexa CDD
Total Hepta CDD
2,3,7,8-Tetra CDF
1,2,3,7,8-Penta CDF
2,3,4,7,8-Penta CDF
1,2,3,4,7,8-Hexa CDF
1,2,3,6,7,8-Hexa CDF
2,3,4,6,7,8-Hexa CDF
1,2,3,7,8,9-Hexa CDF
1,2,3,4,6,7,8-Hepta CDF
1,2,3,4,7,8,9-Hepta CDF
Octa CDF
Total Tetra CDF
Total Penta CDF
Total Hexa CDF
Total Hepta CDF
Total TEQ
Effects Range-Median
1 2 3 4 5 6 7 SF-11
May-01
<4.4 <4.3 <4.6 <4.8 <5.0 <5.0 <4.9 <5.0
80 72 25 16 <11 <11 <10.9 <2.3
263 231 117 128 79 148 102 <7.3
1148 1069 275 342 181 239 291 143

Table I-1Redwood City Harbor Navigation Improvement Integrated Feasibility Study and EIS/EIR
Sediment Chemistry
12 of 53
Analyte
Grain Size (%, dry wt)
Sand/Gravel (>0.063 mm)
Silt (0.004 mm - 0.063 mm
Clay (<0.004 mm)
Conventionals
% Solids (%)
TOC (%)
Metals (mg/kg, ppm, d
Antimony
Arsenic
Barium
Beryllium
Cadmium
Chromium
Cobalt
Copper
Lead
Mercury
Nickel
Selenium
Silver
Thallium
Vanadium
Zinc
Butyltins (microgram/k
Monobutylin
Dibutylin
Tributylin
Tetrabutylin
Total (Σ detected) Butyltins
Pesticides (microgram Aldrin
alpha-BHC
beta-BHC
delta-BHC
Gamma-BHC (Lindane)
Total BHCs
alpha-Chlordane
gamma-Chlordane
1 2 3 4 5 SF-11
7.3 6.5 9.6 4.1 4.3 100
73.7 76.4 73.4 78 75.5 0
19 17 17.1 17.9 20.1 0
40.5 34.6 40.5 37.6 37 37.1
1.28 1.38 1.34 1.45 1.6 0.04
7.12 8.42 7.38 8.75 8.62 8.4
0.15 0.22 0.18 0.21 0.32 0.33
116 139 106 135 148 137
38.7 48.8 36.8 49 66 61.5
22.4 27.4 21.1 28.2 38.5 35.3
0.288 0.395 0.284 0.364 0.588 0.44
80.7 99.5 75 95.1 112 103
0.037 <0.025 0.09 <0.02 0.0457 <0.025
<0.025 0.27 0.16 0.21 0.64 0.67
102 130 100 127 156 151
<1 <1 <1 <1 <1 <1
<1 <1 <1 <1 <1 <1
<1 <1 <1 <1 <1 <1
<1 <1 <1 <1 <1 <1
0 0 0 0 0 0
<1 <1 <1 <1 <1 <1
<1 <1 <1 <1 <1 <1
<1 <1 <1 <1 <1 <1
<1 <1 <1 <1 <1 <1
<1 <1 <1 <1 <1 <1
Jun-05

Table I-1Redwood City Harbor Navigation Improvement Integrated Feasibility Study and EIS/EIR
Sediment Chemistry
13 of 53
Analyte
Chlordane
Total Chlordane
4,4'-DDD
4,4'-DDE
4,4'-DDT
2,4'-DDD
2,4'-DDE
2,4'-DDT
Total (Σ detected) DDTs
Dieldrin
Endosulfan I
Endosulfan II
Endosulfan sulfate
Endrin
Endrin Aldehyde
Endrin Ketone
Heptachlor
Heptachlor epoxide
Methoxychlor
Toxaphene
trans-Nonachlor
Aroclor PCBs (microgr PCB 1016
PCB 1221
PCB 1232
PCB 1242
PCB 1248
PCB 1254
PCB 1260
Total (Σ detected) PCBs
PCB Congeners (micro PCB008
PCB018
PCB028
PCB031
PCB033
PCB044
PCB049
PCB052
1 2 3 4 5 SF-11
Jun-05
<2 <2 <2 <2 <2 <2
<1 <1 <1 <1 <1 <1
<1 <1 <1 <1 <1 <1
<1 <1 <1 <1 <1 <1
<1 <1 <1 <1 <1 <1
<1 <1 <1 <1 <1 <1
<1 <1 <1 <1 <1 <1
0 0 0 0 0 0
<1 <1 <1 <1 <1 <1
<1 <1 <1 <1 <1 <1
<1 <1 <1 <1 <1 <1
<1 <1 <1 <1 <1 <1
<1 <1 <1 <1 <1 <1
<1 <1 <1 <1 <1 <1
<1 <1 <1 <1 <1 <1
<1 <1 <1 <1 <1 <1
<10 <10 <10 <10 <10 <10
<10 <10 <10 <10 <10 <10
<10 <10 <10 <10 <10 <10
<10 <10 <10 <10 <10 <10
<10 <10 <10 <10 <10 <10
<10 <10 <10 <10 <10 <10
<10 <10 <10 <10 <10 <10
<10 <10 <10 <10 <10 <10
0 0 0 0 0 0

Table I-1Redwood City Harbor Navigation Improvement Integrated Feasibility Study and EIS/EIR
Sediment Chemistry
14 of 53
Analyte
PCB056
PCB060
PCB066
PCB070
PCB074
PCB087
PCB095
PCB097
PCB099
PCB101
PCB105
PCB110
PCB118
PCB128
1 2 3 4 5 SF-11
Jun-05

Table I-1Redwood City Harbor Navigation Improvement Integrated Feasibility Study and EIS/EIR
Sediment Chemistry
15 of 53
Analyte
PCB132
PCB138/158
PCB141
PCB149
PCB151
PCB153
PCB156
PCB170
PCB174
PCB177
PCB180
PCB183
PCB187
PCB194
PCB195
PCB201
PCB203Total (∑ detected) PCB Co
PAHs (micrograms/kg 1-Methylnaphthalene
1-Methylphenanthrene
2,3,5-Trimethylnaphthalene
2,6-Dimethylnaphthalene
2-Methylnaphthalene
Acenapthene
Acenaphthylene
Anthracene
Benzo(a)anthracene
Benzo(a)pyrene
Benzo(b)fluoranthene
Benzo(e)pyrene
Benzo(g,h,i)perylene
Benzo(k)fluoranthene
Biphenyl
Chrysene
Dibenzo(a,h)anthracene
Dibenzothiophene
Fluoranthene
Fluorene
Indeno(1,2,3-cd)pyrene
1 2 3 4 5 SF-11
Jun-05
3.7 1.7 1.7 4.6 2.4 <1
7.9 5.7 2.8 4.4 4.8 <1
22.2 12.7 6.1 13.9 15.5 <1
84.3 52.3 84.7 57.4 70.4 <1
124 79.8 50.4 60.5 109 <1
89.4 57.1 39.8 57.7 104 <1
100 74.7 49.7 65 116 <1
100 47.6 27.8 47.1 102 <1
98.6 54.5 40 88.5 142 <1
<1 <1 <1 <1 <1 <1
205 105 81.1 132 145 5.1
5 4 2 5.6 4.5 <1
101 63 42.6 50.4 96.6 <1

Table I-1Redwood City Harbor Navigation Improvement Integrated Feasibility Study and EIS/EIR
Sediment Chemistry
16 of 53
Analyte
Naphthalene
Perylene
Phenanthrene
Pyrene
Total LPAHs
Total HPAHs
Total (Σ detected )PAHs
Dioxins/Furans (ng/k 2,3,7,8-Tetra CDD
1,2,3,7,8-Penta CDD
1,2,3,4,7,8-Hexa CDD
1,2,3,6,7,8-Hexa CDD
1,2,3,7,8,9-Hexa CDD
1,2,3,4,6,7,8-Hepta CDD
Total Octa CDD
Total Tetra CDD
Total Penta CDD
Total Hexa CDD
Total Hepta CDD
2,3,7,8-Tetra CDF
1,2,3,7,8-Penta CDF
2,3,4,7,8-Penta CDF
1,2,3,4,7,8-Hexa CDF
1,2,3,6,7,8-Hexa CDF
2,3,4,6,7,8-Hexa CDF
1,2,3,7,8,9-Hexa CDF
1,2,3,4,6,7,8-Hepta CDF
1,2,3,4,7,8,9-Hepta CDF
Octa CDF
Total Tetra CDF
Total Penta CDF
Total Hexa CDF
Total Hepta CDF
Total TEQ
Effects Range-Median
1 2 3 4 5 SF-11
Jun-05
14.3 9.6 7.7 12.4 16.4 3.1
63.9 40.9 24.2 48.1 41.2 4.9
273 146 110 165 218 8.3
1297 755 521 813 1188 21

Table I-1Redwood City Harbor Navigation Improvement Integrated Feasibility Study and EIS/EIR
Sediment Chemistry
17 of 53
Analyte
Grain Size (%, dry wt)
Sand/Gravel (>0.063 mm)
Silt (0.004 mm - 0.063 mm
Clay (<0.004 mm)
Conventionals
% Solids (%)
TOC (%)
Metals (mg/kg, ppm, d
Antimony
Arsenic
Barium
Beryllium
Cadmium
Chromium
Cobalt
Copper
Lead
Mercury
Nickel
Selenium
Silver
Thallium
Vanadium
Zinc
Butyltins (microgram/k
Monobutylin
Dibutylin
Tributylin
Tetrabutylin
Total (Σ detected) Butyltins
Pesticides (microgram Aldrin
alpha-BHC
beta-BHC
delta-BHC
Gamma-BHC (Lindane)
Total BHCs
alpha-Chlordane
gamma-Chlordane
1 2 3 SF-10 SF-11
3.56 2.13 1.6 41.16 99.24
40.3 39.5 33 25 0.53
56.2 59.1 65.4 33.8 0.23
44.13 44.01 40.5 39.78 83.7
1.33 1.39 1.49 0.9 0.09
8.0 8.91 9.8 10.2 5.01
0.2555 0.469 0.621 0.256 <0.118
97.6 94.9 122 81.3 24.8
38.1 38.5 52.1 36.8 2.51
29.8 30.1 41.7 22 11
0.28 0.23 0.33 0.16 0.02
77.2 77.9 97.5 71.1 21.9
0.114 0 0.168 0.145 0.004
0.54 0.46 0.97 <0.21 <0.12
117 146 172 117 28
<1.18 <1.28 <1.44 <1.16 <0.65
<2.47 <2.67 <3.00 <2.42 <1.36
<2.13 <2.30 <2.58 <2.08 <1.17
<1.91 <2.06 <2.32 <1.87 <1.05
<1.12 <1.21 <1.36 <1.10 <0.62
<2.15 <2.32 <2.61 <2.10 <1.18
<1.31 <1.42 <1.59 <1.28 <0.72
<1.31 <1.42 <1.59 <1.28 <0.72<1.35 <1.46 <1.64 <1.32 <0.75
Feb-08
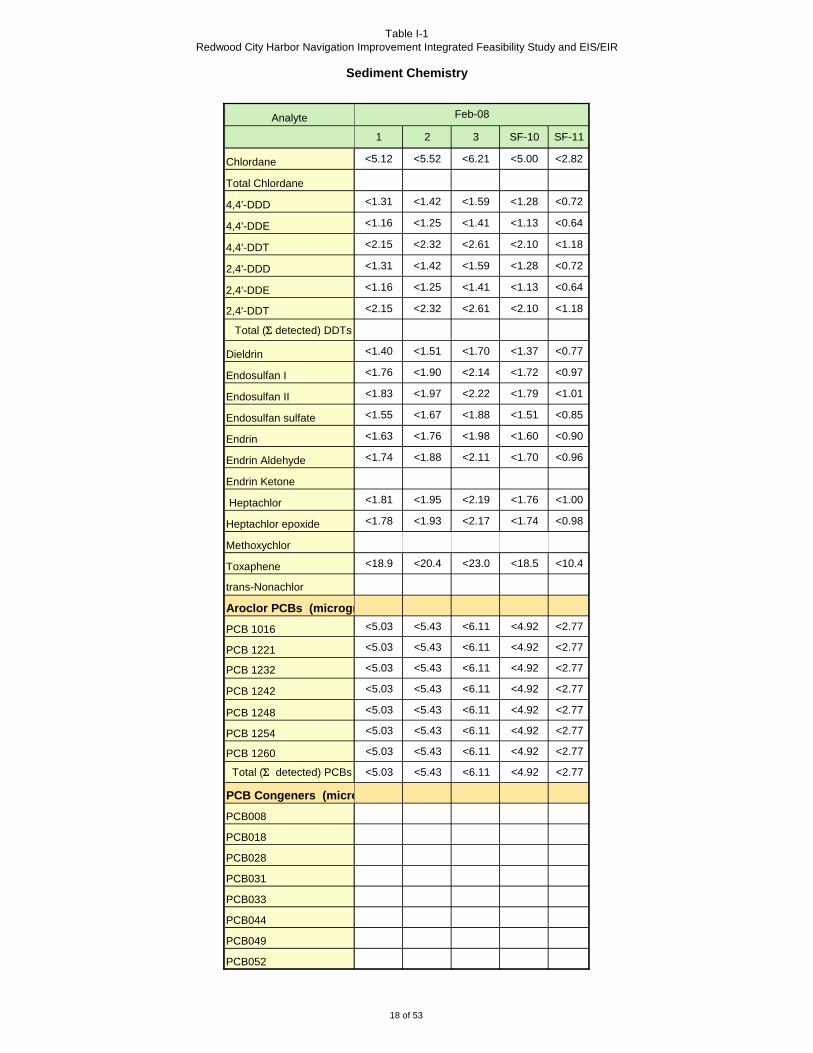
Table I-1Redwood City Harbor Navigation Improvement Integrated Feasibility Study and EIS/EIR
Sediment Chemistry
18 of 53
Analyte
Chlordane
Total Chlordane
4,4'-DDD
4,4'-DDE
4,4'-DDT
2,4'-DDD
2,4'-DDE
2,4'-DDT
Total (Σ detected) DDTs
Dieldrin
Endosulfan I
Endosulfan II
Endosulfan sulfate
Endrin
Endrin Aldehyde
Endrin Ketone
Heptachlor
Heptachlor epoxide
Methoxychlor
Toxaphene
trans-Nonachlor
Aroclor PCBs (microgr PCB 1016
PCB 1221
PCB 1232
PCB 1242
PCB 1248
PCB 1254
PCB 1260
Total (Σ detected) PCBs
PCB Congeners (micro PCB008
PCB018
PCB028
PCB031
PCB033
PCB044
PCB049
PCB052
1 2 3 SF-10 SF-11
Feb-08
<5.12 <5.52 <6.21 <5.00 <2.82
<1.31 <1.42 <1.59 <1.28 <0.72
<1.16 <1.25 <1.41 <1.13 <0.64
<2.15 <2.32 <2.61 <2.10 <1.18
<1.31 <1.42 <1.59 <1.28 <0.72
<1.16 <1.25 <1.41 <1.13 <0.64
<2.15 <2.32 <2.61 <2.10 <1.18
<1.40 <1.51 <1.70 <1.37 <0.77
<1.76 <1.90 <2.14 <1.72 <0.97
<1.83 <1.97 <2.22 <1.79 <1.01
<1.55 <1.67 <1.88 <1.51 <0.85
<1.63 <1.76 <1.98 <1.60 <0.90
<1.74 <1.88 <2.11 <1.70 <0.96
<1.81 <1.95 <2.19 <1.76 <1.00
<1.78 <1.93 <2.17 <1.74 <0.98
<18.9 <20.4 <23.0 <18.5 <10.4
<5.03 <5.43 <6.11 <4.92 <2.77
<5.03 <5.43 <6.11 <4.92 <2.77
<5.03 <5.43 <6.11 <4.92 <2.77
<5.03 <5.43 <6.11 <4.92 <2.77
<5.03 <5.43 <6.11 <4.92 <2.77
<5.03 <5.43 <6.11 <4.92 <2.77
<5.03 <5.43 <6.11 <4.92 <2.77
<5.03 <5.43 <6.11 <4.92 <2.77

Table I-1Redwood City Harbor Navigation Improvement Integrated Feasibility Study and EIS/EIR
Sediment Chemistry
19 of 53
Analyte
PCB056
PCB060
PCB066
PCB070
PCB074
PCB087
PCB095
PCB097
PCB099
PCB101
PCB105
PCB110
PCB118
PCB128
1 2 3 SF-10 SF-11
Feb-08

Table I-1Redwood City Harbor Navigation Improvement Integrated Feasibility Study and EIS/EIR
Sediment Chemistry
20 of 53
Analyte
PCB132
PCB138/158
PCB141
PCB149
PCB151
PCB153
PCB156
PCB170
PCB174
PCB177
PCB180
PCB183
PCB187
PCB194
PCB195
PCB201
PCB203Total (∑ detected) PCB Co
PAHs (micrograms/kg 1-Methylnaphthalene
1-Methylphenanthrene
2,3,5-Trimethylnaphthalene
2,6-Dimethylnaphthalene
2-Methylnaphthalene
Acenapthene
Acenaphthylene
Anthracene
Benzo(a)anthracene
Benzo(a)pyrene
Benzo(b)fluoranthene
Benzo(e)pyrene
Benzo(g,h,i)perylene
Benzo(k)fluoranthene
Biphenyl
Chrysene
Dibenzo(a,h)anthracene
Dibenzothiophene
Fluoranthene
Fluorene
Indeno(1,2,3-cd)pyrene
1 2 3 SF-10 SF-11
Feb-08
<7.74 <8.35 <9.40 <7.56 <4.27
<10.1 <10.9 <12.2 <9.83 <5.55
<13.5 <14.6 <16.4 <13.2 <7.46
17.4 24.9 <17.4 <14.0 <7.90
22.1 35.8 <19.3 <15.5 <8.74
21.7 34.1 <23.2 <18.7 <10.5
<20.9 28.2 <25.4 <20.4 <11.5
<14.7 <15.9 <17.9 <14.4 <8.10
9.53 16.2 <10.3 <8.32 <4.69
<19.7 <21.3 <24.0 <19.3 <10.9
24.6 42.9 21.6 <12.1 <6.82
<10.1 <10.9 <12.2 <9.83 <5.55
<21.5 26.9 <26.1 <21.0 <11.8

Table I-1Redwood City Harbor Navigation Improvement Integrated Feasibility Study and EIS/EIR
Sediment Chemistry
21 of 53
Analyte
Naphthalene
Perylene
Phenanthrene
Pyrene
Total LPAHs
Total HPAHs
Total (Σ detected )PAHs
Dioxins/Furans (ng/kg 2,3,7,8-Tetra CDD
1,2,3,7,8-Penta CDD
1,2,3,4,7,8-Hexa CDD
1,2,3,6,7,8-Hexa CDD
1,2,3,7,8,9-Hexa CDD
1,2,3,4,6,7,8-Hepta CDD
Total Octa CDD
Total Tetra CDD
Total Penta CDD
Total Hexa CDD
Total Hepta CDD
2,3,7,8-Tetra CDF
1,2,3,7,8-Penta CDF
2,3,4,7,8-Penta CDF
1,2,3,4,7,8-Hexa CDF
1,2,3,6,7,8-Hexa CDF
2,3,4,6,7,8-Hexa CDF
1,2,3,7,8,9-Hexa CDF
1,2,3,4,6,7,8-Hepta CDF
1,2,3,4,7,8,9-Hepta CDF
Octa CDF
Total Tetra CDF
Total Penta CDF
Total Hexa CDF
Total Hepta CDF
Total TEQ
Effects Range-Median
1 2 3 SF-10 SF-11
Feb-08
<4.11 <4.43 <4.99 <4.01 <2.26
11 21.1 <10.9 <8.80 <4.96
34.8 59.4 33.6 <12.8 9.8
263 376 285 210 121

Table I-1Redwood City Harbor Navigation Improvement Integrated Feasibility Study and EIS/EIR
Sediment Chemistry
22 of 53
Analyte
Grain Size (%, dry wt)
Sand/Gravel (>0.063 mm)
Silt (0.004 mm - 0.063 mm
Clay (<0.004 mm)
Conventionals
% Solids (%)
TOC (%)
Metals (mg/kg, ppm, d
Antimony
Arsenic
Barium
Beryllium
Cadmium
Chromium
Cobalt
Copper
Lead
Mercury
Nickel
Selenium
Silver
Thallium
Vanadium
Zinc
Butyltins (microgram/k
Monobutylin
Dibutylin
Tributylin
Tetrabutylin
Total (Σ detected) Butyltins
Pesticides (microgram Aldrin
alpha-BHC
beta-BHC
delta-BHC
Gamma-BHC (Lindane)
Total BHCs
alpha-Chlordane
gamma-Chlordane
1 2 3 4 5 6 7 SF-10
0 0 0 0 0 0 0 0.81
42.1 40.2 37.2 33.4 29.2 39.2 40.4 26.1
55.7 59.1 62.1 65.9 69.9 59.9 58.8 28.4
44.9 42.5 42.2 39.9 38.7 47.2 48.6 53.1
1.4 1.4 1.4 1.5 1.6 1.4 1.3 1.1
7.95 7.88 7.38 8.22 8.2 7.8 8.0 7.6
0.458 0.460 0.463 0.501 0.6 0.5 0.5 0.4
75.70 81.80 81.80 88.70 94.2 81.2 81.1 65.1
39.100 39.400 40.700 46.600 57.5 40.5 43.5 38.7
28.2 26.9 27.1 31.7 37.8 29.0 29.9 19.5
0.304 0.288 0.321 0.347 0.4 0.3 0.329 0.156
77.4 78.0 80.0 87.8 94.8 79.4 81.8 73.3
0.374 0.389 0.425 0.488 0.5 0.4 0.39 <0.067
0.499 0.447 0.442 0.554 0.763 0.5 0.496 0.249
108 109 112 124 141 115 112 99.5
<2.2 35 <2.3 <2.4 <2.5 <2.1 <2.0 <1.8
<1.3 64 <1.4 <1.5 <1.5 <1.3 <1.2 <1.1
<0.74 <0.79 <0.79 <0.84 <0.86 <0.71 <.69 <0.63
<0.80 <0.84 <0.85 <0.90 >0.92 <0.76 <0.74 <0.67
<0.69 <0.73 <0.73 <0.77 <0.80 <0.65 <0.64 <0.58
<0.66 <0.69 <0.70 <0.74 <0.76 <0.62 <0.61 <0.55
<0.57 <0.60 <0.60 <0.64 <0.66 <0.54 <0.52 <0.48
<0.71 <0.75 <0.75 <0.80 <0.82 0.67 <0.65 <0.60
<0.51 <0.54 <0.54 <0.57 <0.59 <0.48 <0.47 <0.43
Feb-11

Table I-1Redwood City Harbor Navigation Improvement Integrated Feasibility Study and EIS/EIR
Sediment Chemistry
23 of 53
Analyte
Chlordane
Total Chlordane
4,4'-DDD
4,4'-DDE
4,4'-DDT
2,4'-DDD
2,4'-DDE
2,4'-DDT
Total (Σ detected) DDTs
Dieldrin
Endosulfan I
Endosulfan II
Endosulfan sulfate
Endrin
Endrin Aldehyde
Endrin Ketone
Heptachlor
Heptachlor epoxide
Methoxychlor
Toxaphene
trans-Nonachlor
Aroclor PCBs (microgr PCB 1016
PCB 1221
PCB 1232
PCB 1242
PCB 1248
PCB 1254
PCB 1260
Total (Σ detected) PCBs
PCB Congeners (micro PCB008
PCB018
PCB028
PCB031
PCB033
PCB044
PCB049
PCB052
1 2 3 4 5 6 7 SF-10
Feb-11
<8.9 <9.4 <9.5 <10.0 <10.0 <8.5 <8.2 <7.5
<0.57 <0.61 <0.61 <0.65 <0.67 <0.55 <0.53 <0.49
<1.1 <0.71 1.5 1.1 2.2 1.3 1.3 1.4
<0.73 <0.77 <0.78 <0.82 <0.85 <0.69 <0.67 <0.62
<0.45 <0.47 <0.48 <0.50 <0.52 <0.43 <0.41 <0.38
<0.40 <0.42 <0.42 <0.45 <0.46 <0.38 <0.37 <0.33
<0.31 <0.33 <0.33 <0.35 <0.36 <0.30 <0.29 <0.26
1.1 <0.77 1.5 1.1 2.2 1.3 1.3 1.4
<0.51 <0.53 <0.54 <0.57 <0.59 <0.48 <4.7 0.43
<0.79 <0.84 <0.84 <0.89 <0.92 <0.75 <0.73 <0.67
<0.39 <0.41 <0.42 <0.44 <0.45 <0.37 <0.36 <0.33
<0.59 <0.62 <0.62 <0.66 <0.68 <0.56 <0.54 <0.50
<0.45 <0.47 <0.48 <0.51 <0.52 <0.43 <0.41 <0.38
<0.44 <0.46 <0.46 <0.49 <0.50 <0.41 <0.40 <0.37
<0.50 <0.52 <0.53 <0.56 <0.58 <0.47 <0.46 <0.42
<0.41 <0.43 <0.44 <0.46 <0.47 <0.39 <0.38 <0.35
<19.0 <20.0 <20.0 <21.0 <22.0 <18.0 <17.0 <16
<4.5 <4.7 <4.8 <5.1 <5.2 <4.3 <4.1 <3.8
<4.5 <4.7 <4.7 <5.0 <5.2 <4.2 <4.1 <3.8
<4.5 <4.7 <4.7 <5.0 <5.2 <4.2 <4.1 <3.8
<4.5 200,000 <4.7 <5.0 <5.2 <4.2 <4.1 <3.8
<4.5 <4.7 <4.7 <5.0 <5.2 <4.2 <4.1 <3.8
<4.5 <4.7 <4.7 <5.0 <5.2 <4.2 <4.1 <3.8
17.00 <5.2 16.00 16.00 19.00 16.0 14 <4.2
17.00 200,000 16.00 16.00 19.00 16.0 14 <4.2

Table I-1Redwood City Harbor Navigation Improvement Integrated Feasibility Study and EIS/EIR
Sediment Chemistry
24 of 53
Analyte
PCB056
PCB060
PCB066
PCB070
PCB074
PCB087
PCB095
PCB097
PCB099
PCB101
PCB105
PCB110
PCB118
PCB128
1 2 3 4 5 6 7 SF-10
Feb-11

Table I-1Redwood City Harbor Navigation Improvement Integrated Feasibility Study and EIS/EIR
Sediment Chemistry
25 of 53
Analyte
PCB132
PCB138/158
PCB141
PCB149
PCB151
PCB153
PCB156
PCB170
PCB174
PCB177
PCB180
PCB183
PCB187
PCB194
PCB195
PCB201
PCB203Total (∑ detected) PCB Co
PAHs (micrograms/kg 1-Methylnaphthalene
1-Methylphenanthrene
2,3,5-Trimethylnaphthalene
2,6-Dimethylnaphthalene
2-Methylnaphthalene
Acenapthene
Acenaphthylene
Anthracene
Benzo(a)anthracene
Benzo(a)pyrene
Benzo(b)fluoranthene
Benzo(e)pyrene
Benzo(g,h,i)perylene
Benzo(k)fluoranthene
Biphenyl
Chrysene
Dibenzo(a,h)anthracene
Dibenzothiophene
Fluoranthene
Fluorene
Indeno(1,2,3-cd)pyrene
1 2 3 4 5 6 7 SF-10
Feb-11
14.0 49 8.2 13.0 6.6 6.0 6.7 3.5
24.0 39 20.0 19.0 17.0 12.0 13.0 <31.7
32.0 180 37.0 33.0 34.0 22.0 27.0 <3.4
110 980 130 95.0 110 74 88 5.8
250 1000 310 230 290 190 200 12
160 1100 220 170 230 130 140 4.8
240 510 300 230 280 180 180 9.3
170 1100 180 150 180 120 140 6.7
130 1200 160 120 140 94 110 7.3
15 97 22 16 20 12 14 <3.7
210 1600 240 190 190 160 170 14.0
18.0 <41 13.0 16.0 12.0 8.8 10 <3.3
210 520 260 200 250 160 160 7.5

Table I-1Redwood City Harbor Navigation Improvement Integrated Feasibility Study and EIS/EIR
Sediment Chemistry
26 of 53
Analyte
Naphthalene
Perylene
Phenanthrene
Pyrene
Total LPAHs
Total HPAHs
Total (Σ detected )PAHs
Dioxins/Furans (ng/k 2,3,7,8-Tetra CDD
1,2,3,7,8-Penta CDD
1,2,3,4,7,8-Hexa CDD
1,2,3,6,7,8-Hexa CDD
1,2,3,7,8,9-Hexa CDD
1,2,3,4,6,7,8-Hepta CDD
Total Octa CDD
Total Tetra CDD
Total Penta CDD
Total Hexa CDD
Total Hepta CDD
2,3,7,8-Tetra CDF
1,2,3,7,8-Penta CDF
2,3,4,7,8-Penta CDF
1,2,3,4,7,8-Hexa CDF
1,2,3,6,7,8-Hexa CDF
2,3,4,6,7,8-Hexa CDF
1,2,3,7,8,9-Hexa CDF
1,2,3,4,6,7,8-Hepta CDF
1,2,3,4,7,8,9-Hepta CDF
Octa CDF
Total Tetra CDF
Total Penta CDF
Total Hexa CDF
Total Hepta CDF
Total TEQ
Effects Range-Median
1 2 3 4 5 6 7 SF-10
Feb-11
37.0 200 40.0 35.0 40.0 27.0 28.0 4.7
120 680 120 84.0 89.0 71.0 88.0 6.2
330 1600 380 290 360 240 270 21
2,070 10290 2,377 1,827 2,193 1,468 1,601 99

Table I-1Redwood City Harbor Navigation Improvement Integrated Feasibility Study and EIS/EIR
Sediment Chemistry
27 of 53
Analyte
Grain Size (%, dry wt)
Sand/Gravel (>0.063 mm)
Silt (0.004 mm - 0.063 mm
Clay (<0.004 mm)
Conventionals
% Solids (%)
TOC (%)
Metals (mg/kg, ppm, d
Antimony
Arsenic
Barium
Beryllium
Cadmium
Chromium
Cobalt
Copper
Lead
Mercury
Nickel
Selenium
Silver
Thallium
Vanadium
Zinc
Butyltins (microgram/k
Monobutylin
Dibutylin
Tributylin
Tetrabutylin
Total (Σ detected) Butyltins
Pesticides (microgram Aldrin
alpha-BHC
beta-BHC
delta-BHC
Gamma-BHC (Lindane)
Total BHCs
alpha-Chlordane
gamma-Chlordane
1 2 3 4 5 6 7 SF-10 1Z 7Z
7.9 0 0 0 0 0 0 51
56 65 63 59 61 47 47 35
36 35 37 41 39 53 53 14
44.6 43.3 43.2 42.5 42.6 39 39.4 55.6 45.7
1.7 1.6 1.6 1.7 1.6 1.8 1.9 1
<0.087 <0.090 <0.090 <0.091 <0.091 <0.099 <0.098 <0.070
8.22 8.07 8.14 8.23 8.48 8.11 7.57 7.09
63 62 59 58 60.4 63.7 69.3 45.7
0.72J 0.753J 0.62J 0.691J 0.838J 0.813J 0.895J 0.475J
0.513 0.451 0.486 0.485 0.472 0.476 0.695 0.427
92.8 94.9 91.3 93.4 97.8 98.9 103.0 70.4
17.2 17.0 16.5 16.4 17.3 17.1 16.8 15.7
46.5 45.9 44.0 44.5 47.2 52.3 61.3 36.0
29.1 27.3 26.0 26.2 28.1 29.8 36.6 19.4
0.296 0.281 0.248 0.247 0.265 0.268 0.34 0.159
92.1 92.5 88.8 88.9 94.9 98.5 103 75.6
0.517 0.261 0.233 0.354 0.427 0.245J 0.372 0.22
0.525 0.415 0.403 0.400 0.419 0.489 0.757 0.194
0.162J 0.176J 0.15J 0.15J 0.163J 0.166J 0.17J 0.106J
71.6 74.3 71.7 72.1 76.3 76.2 77 66.2
136 135 131 132 141 153 163 111
2.6J <1.5 <1.5 <1.5 2.5J <1.7 5.4J <1.2
3.3J 3.1J 2.7J 3.5J 1.6J 4.1J 11 2.9J
3J 2.2J 1.5J 3.7J 1.7J 1.6J 3.4J 1.6J
<1.7 <1.8 <1.8 <1.8 <1.8 <2 <1.9 <1.4
8.9 5.3 4.2 7.2 5.8 5.7 19.8 4.5
<0.7 <0.73 <0.72 <0.74 <0.75 <0.81 <0.79 <0.56
<0.73 <0.75 <0.74 <0.76 <0.77 <0.83 <0.81 <0.58
<0.59 <0.61 <0.61 <0.62 <0.63 <0.68 <0.66 <0.47
<7.3 <7.6 <7.5 <.7.7 <7.7 <8.4 <8.2 <5.9
<0.66 <0.68 <0.67 <0.69 <0.7 <0.76 <0.74 <0.53
<0.57 <0.59 <0.59 <0.6 <0.61 <0.66 <0.64 <0.46
<0.74 <0.76 <0.76 <0.77 <0.78 <0.85 <0.83 <0.59
<0.72 <0.75 <0.74 <0.75 <0.76 <0.83 <0.81 <0.58
Mar-14

Table I-1Redwood City Harbor Navigation Improvement Integrated Feasibility Study and EIS/EIR
Sediment Chemistry
28 of 53
Analyte
Chlordane
Total Chlordane
4,4'-DDD
4,4'-DDE
4,4'-DDT
2,4'-DDD
2,4'-DDE
2,4'-DDT
Total (Σ detected) DDTs
Dieldrin
Endosulfan I
Endosulfan II
Endosulfan sulfate
Endrin
Endrin Aldehyde
Endrin Ketone
Heptachlor
Heptachlor epoxide
Methoxychlor
Toxaphene
trans-Nonachlor
Aroclor PCBs (microgr PCB 1016
PCB 1221
PCB 1232
PCB 1242
PCB 1248
PCB 1254
PCB 1260
Total (Σ detected) PCBs
PCB Congeners (micro PCB008
PCB018
PCB028
PCB031
PCB033
PCB044
PCB049
PCB052
1 2 3 4 5 6 7 SF-10 1Z 7Z
Mar-14
<0.59 <0.61 <0.6 <0.61 <0.62 <0.67 <0.66 <0.47
ND ND ND ND ND ND ND ND
<0.71 <0.73 <0.73 <0.74 <0.75 <0.81 <0.79 <0.57
<0.67 <0.69 <0.69 <0.7 <0.71 <0.77 <0.75 <0.54
<0.75 <0.78 <0.77 <0.78 <0.79 <0.86 <0.84 <0.6
<0.76 <0.79 <0.78 <0.79 <0.8 <0.87 <0.85 <0.61
<0.68 <0.71 <0.7 <0.72 <0.72 <0.79 <0.77 <0.55
<0.67 <0.7 <0.69 <0.7 <0.71 <0.77 <0.76 <0.54
ND ND ND ND ND ND ND ND
<0.72 <0.74 <0.74 <0.75 <0.76 <0.83 <0.81 <0.57
<0.76 <0.78 <0.78 <0.79 <0.8 <0.87 <0.85 <0.61
<0.8 <0.83 <0.82 <0.84 <0.85 <0.92 <0.9 <0.64
<0.55 <0.57 <0.56 <0.57 <0.58 <0.63 <0.61 <0.44
<0.78 <0.81 <0.8 <0.81 <0.82 <0.89 <0.87 <0.62
<0.71 <0.74 <0.73 <0.74 <0.75 <0.82 <0.8 <0.57
<0.77 <0.8 <0.8 <0.81 <.82 <0.89 <0.87 <0.62
<0.8 <0.82 <0.82 <0.83 <0.84 <0.92 <0.89 <0.64
<0.73 <0.75 <0.75 <0.76 <0.77 <0.84 <0.82 <0.58
<0.63 <0.65 <0.65 <0.66 <0.67 <0.72 <.71 <0.5
<14 <15 <15 <15 <15 <16 <16 <11
<0.64 <0.67 <0.66 <0.67 <0.68 <0.74 <0.72 <0.52
<0.19 <0.19 <0.2 <0.2 <0.2 <0.22 0.36J <0.15 <0.19
<0.35 <0.36 <0.36 <0.37 <0.37 <0.4 <0.4 <0.28 <0.34
0.43J <0.23 0.26J 0.33J <0.23 0.35J 0.73J <0.18 <0.22
0.53J <0.27 <0.27 0.54J <0.27 <0.3 0.83J <0.21 <0.25
<0.24 <0.25 <0.25 0.31J <0.25 <0.28 0.37J <0.19 <0.24
0.78J <0.3 <0.3 0.47J <0.31 <0.34 <0.33 <0.24 0.97J
0.54J <0.27 <0.27 0.35J <0.28 <0.3 0.75J <0.21 0.86J
0.99J <0.22 <0.22 0.7J <0.23 <0.25 1.1J <0.17 2

Table I-1Redwood City Harbor Navigation Improvement Integrated Feasibility Study and EIS/EIR
Sediment Chemistry
29 of 53
Analyte
PCB056
PCB060
PCB066
PCB070
PCB074
PCB087
PCB095
PCB097
PCB099
PCB101
PCB105
PCB110
PCB118
PCB128
1 2 3 4 5 6 7 SF-10 1Z 7Z
Mar-14
<0.31 <.32 <.32 <0.32 <0.32 <0.35 <0.35 <0.25 <0.3
<0.24 <0.24 <.24 <.25 <.25 <.27 <0.27 <0.19 <0.23
1J 0.49J 0.38J 0.52J <0.21 <0.23 0.98J <0.16 1.70
0.83J 0.45J 0.26J 0.48J <0.19 <0.21 0.93J <0.15 1.1J
0.52J 0.23J <0.22 0.27J <0.22 <0.24 0.5J <0.17 0.31J
0.32J <0.23 <0.23 <0.24 <0.24 <0.26 0.63J <0.18 <0.22
0.93J <0.38 0.46J 0.4J 0.5J 0.59J 1.7 0.53J 2.70
0.59J <0.31 0.36J 0.4J <0.32 <0.35 0.79J <0.25 <0.3
0.86J 0.43J 0.46J 0.45J 0.38J 0.46J 1.3 0.29J 1.60
1.4 0.59J 0.8J 0.76J 0.69J 0.87J 2.4 0.58J 3.90
0.6J <0.24 <0.24 0.39J <0.25 <0.27 0.95J <0.19 <0.23
1J 0.48J 0.55J 0.62J <0.24 0.64J 1.9 0.55J 3.00
1.1J 0.65J 0.63J 0.71J 0.69J 0.74J 2 0.49J 4.10
<0.23 0.24 <0.24 <0.24 <0.24 <0.26 <0.26 <0.18 <0.22

Table I-1Redwood City Harbor Navigation Improvement Integrated Feasibility Study and EIS/EIR
Sediment Chemistry
30 of 53
Analyte
PCB132
PCB138/158
PCB141
PCB149
PCB151
PCB153
PCB156
PCB170
PCB174
PCB177
PCB180
PCB183
PCB187
PCB194
PCB195
PCB201
PCB203Total (∑ detected) PCB Co
PAHs (micrograms/kg 1-Methylnaphthalene
1-Methylphenanthrene
2,3,5-Trimethylnaphthalene
2,6-Dimethylnaphthalene
2-Methylnaphthalene
Acenapthene
Acenaphthylene
Anthracene
Benzo(a)anthracene
Benzo(a)pyrene
Benzo(b)fluoranthene
Benzo(e)pyrene
Benzo(g,h,i)perylene
Benzo(k)fluoranthene
Biphenyl
Chrysene
Dibenzo(a,h)anthracene
Dibenzothiophene
Fluoranthene
Fluorene
Indeno(1,2,3-cd)pyrene
1 2 3 4 5 6 7 SF-10 1Z 7Z
Mar-14
<0.37 <0.38 <0.38 <0.39 <0.39 <0.42 <0.42 <0.3 <0.36
1.6J 1J 0.99J 1.1J 0.99J 1.3J 3.4 0.7J 5.60
<0.25 <0.25 <0.26 <0.26 <0.26 <0.28 <0.28 <0.2 <0.24
1.2 0.57J 0.84J 0.66J 0.66J 0.84J 2.2 0.49J 3.60
0.31J <0.24 <0.24 <0.24 <0.24 0.33J 0.91J 0.28J 1.20
2 1.1J 1.2 1.2 1.3 1.4 3.9 0.77J 5.50
<0.22 <0.23 <0.23 <0.23 <0.23 <0.25 <0.25 <0.18 <0.21
0.67J 0.42J 0.46J <0.22 0.43J 0.67J 1.2J 0.41J 1.50
<0.24 <0.25 0.33J <0.25 <0.25 <0.27 0.89J <0.19 1.60
<0.27 <0.28 <0.28 <0.29 <0.29 <0.32 0.53J <0.22 0.76J
0.84J 0.46J 0.56J 0.63J 0.56J 0.86J 1.9 0.48J 2.90
0.28J <0.26 <0.26 <0.26 <0.26 <0.29 0.58J <0.2 0.98J
0.77J 0.42J 0.56J 0.59J 0.59J 0.72J 1.7 0.4J 2.00
0.4J <0.22 <0.22 0.29J <0.22 0.43J 0.93J <0.17 0.96J
<0.12 <0.12 <0.12 <0.12 <0.12 <0.14 <0.13 <0.095 <0.12
<0.13 <0.13 <0.13 <0.13 <0.13 <0.15 <0.14 <0.1 <0.12
<0.24 <0.25 <0.25 <0.25 <0.25 <0.28 <0.27 <0.19 <0.24
20.5 7.29 9.1 12.2 6.79 10.2 36.4 5.97 48.9
<4.5 6.3J 5.6J 5.2J 11J 7J 7.1J 3.9J
<3.6 <3.7 <3.8 <3.8 <3.8 <4.2 <4.1 <2.9
<3.1 <3.2 <3.3 <3.3 <3.3 <3.6 <3.6 <2.5
<3.7 10J 9.7J 10J 21 10J 11J 6.9J
<4 12J 11J 11J 21J 12J 13J 7.3J
<4 7.9J 7.9J 6.3J 13J 7.2J 7.1J 5.3J
<3.4 16J 15J 13J 25 13J 14J 7.1J
6.3J 35 31 26 51 30 30 15J
<3.1 9.5J 9.2J 10J 17J 11J 10J 5.2J
20J 100 98 87 170 84 85 38
36 230 220 200 390 230 210 75
34 160 160 160 310 160 180 60
27 140 130 130 240 140 150 48
52 260 240 260 470 240 240 81
24 110 120 110 180 130 130 4121J 120 110 100 190 100 110 43
4.4J 26 24 24 48 24J 26 7.8J
<3 7J 6.7J 5.8J 11J 6J 5.6J 4.6J
<3.3 13J 13J 12J 22J 13J 13J 8.3J
42 210 190 180 310 170 170 8445 260 240 250 470 240 260 78

Table I-1Redwood City Harbor Navigation Improvement Integrated Feasibility Study and EIS/EIR
Sediment Chemistry
31 of 53
Analyte
Naphthalene
Perylene
Phenanthrene
Pyrene
Total LPAHs
Total HPAHs
Total (Σ detected )PAHs
Dioxins/Furans (ng/k 2,3,7,8-Tetra CDD
1,2,3,7,8-Penta CDD
1,2,3,4,7,8-Hexa CDD
1,2,3,6,7,8-Hexa CDD
1,2,3,7,8,9-Hexa CDD
1,2,3,4,6,7,8-Hepta CDD
Total Octa CDD
Total Tetra CDD
Total Penta CDD
Total Hexa CDD
Total Hepta CDD
2,3,7,8-Tetra CDF
1,2,3,7,8-Penta CDF
2,3,4,7,8-Penta CDF
1,2,3,4,7,8-Hexa CDF
1,2,3,6,7,8-Hexa CDF
2,3,4,6,7,8-Hexa CDF
1,2,3,7,8,9-Hexa CDF
1,2,3,4,6,7,8-Hepta CDF
1,2,3,4,7,8,9-Hepta CDF
Octa CDF
Total Tetra CDF
Total Penta CDF
Total Hexa CDF
Total Hepta CDF
Total TEQ
Effects Range-Median
1 2 3 4 5 6 7 SF-10 1Z 7Z
Mar-14
11J 32 27 28 54 31 35 15J
31 110 100 98 200 97 95 71
19J 98 97 81 150 71 68 48
56 300 280 260 460 250 280 120
36 247 233 208 396 211 214 127
392 2026 1912 1859 3438 1865 1936 747
429 2273 2145 2067 3834 2076 2150 873
<0.13 <0.16 <0.16 0.28J <0.14 <0.13 <0.33 <0.22
0.78J <0.53 0.7J 0.58J 0.76J 0.82J 1.21J 0.44J
0.7J 0.69J 0.59J 0.78J 0.831J 0.99J 1.77J 0.38J
2.62J 2.34J 2.19J 2.57J 2.6J 3.13J 5.70 2.46J
2.2J 2.14J 2.64J 2.7J <2.5 3.07J 5.71 2.47J
47.0 42.5 38.2 42.3J 44.2J 60.7 111.0 35.1
319 279 265 263 291 400 757 264
4.37 5.04 5.05 5.40 6.56 6.09 5.63 1.64J
5.24 3.04J 3.84J 1.74J 3.69J 2.74J 7.19 1.68J
32.0 26.9 27.7 30.3 29.7 37.7 60.9 21.7
117 104 94.9 103 109 185 311 80.8
3.23 2.87 2.61 3.27 3.30 2.97 3.92 1.66J
0.98J 0.84J 0.9J 0.79J <0.64 0.91J 1.26J <0.36
1.71J 1.42J 1.29J 1.61J 1.52J 1.66J 2.38J 0.68J
1.76J 1.5J 1.38J 1.75J 1.76J 1.8J 2.57J 0.97J
1.4J 0.97J 1.18J 0.95J 0.94J 0.96J 1.46J 0.505J
0.86J 0.72J 0.79J 1.07J 0.85J 0.86J 1.31J 0.38J
<0.14 <0.15 <0.12 <0.28 <0.26 <0.23 0.17J <0.12
10.8 9.29 9.33 10.5 <11 13.5 22.8 10.8
0.65J 0.53J 0.52J 0.89J <0.64 <0.75 1.42J <0.4
19.5 17.1 15.2 17.7J 20.1J 22.4J 39.6J 19.5
22.9 19.6 16.0 13.8 17.9 14.3 20.8 7.1
16.0 14.0 13.2 6.97 10.1 11.5 20.6 1.37J
16.8 14.5 13.2 11.5 12.7 14.9 25.2 8.35
25.5 20.9 20.9 26.9J 14.0J 31.2J 56.4 25.8
3.37 2.82 2.93 3.26 3.25 3.69 6.04 2.29
0.07 0.10 0.09 0.09 0.11 0.10 0.11 0.06

Table I-1Redwood City Harbor Navigation Improvement Integrated Feasibility Study and EIS/EIR
Sediment Chemistry
32 of 53
Analyte
Grain Size (%, dry wt)
Sand/Gravel (>0.063 mm)
Silt (0.004 mm - 0.063 mm
Clay (<0.004 mm)
Conventionals
% Solids (%)
TOC (%)
Metals (mg/kg, ppm, d
Antimony
Arsenic
Barium
Beryllium
Cadmium
Chromium
Cobalt
Copper
Lead
Mercury
Nickel
Selenium
Silver
Thallium
Vanadium
Zinc
Butyltins (microgram/k
Monobutylin
Dibutylin
Tributylin
Tetrabutylin
Total (Σ detected) Butyltins
Pesticides (microgram Aldrin
alpha-BHC
beta-BHC
delta-BHC
Gamma-BHC (Lindane)
Total BHCs
alpha-Chlordane
gamma-Chlordane
SF-11 SFDODS HWRP
66.3 0-17 16-60
-- 0-3 25-62
-- 0 -6 13 -24
1.32 - 2.60 2.34-5.74
0.07--0.19 0.63-1.45
15.3 13.2 5.3 15.3
0.33 0.4 0.6 0.7
112 121.0 283.0 112.0
68.1 12.4 86.3 68.1
43.2 14.4 26.0 43.2
0.43 0.156 0.2 0.43
112 40.7 238.0 112.0
0.64 0.41 2.6 0.64
0.58 <0.10 1.0 0.58
158 106.8 288 158
-- --
-- --
-- --
-- --
--
ND
ND
ND
ND
SFEI Ambient Sediment >40%
Fines
--
----
--
--
--
--
--

Table I-1Redwood City Harbor Navigation Improvement Integrated Feasibility Study and EIS/EIR
Sediment Chemistry
33 of 53
Analyte
Chlordane
Total Chlordane
4,4'-DDD
4,4'-DDE
4,4'-DDT
2,4'-DDD
2,4'-DDE
2,4'-DDT
Total (Σ detected) DDTs
Dieldrin
Endosulfan I
Endosulfan II
Endosulfan sulfate
Endrin
Endrin Aldehyde
Endrin Ketone
Heptachlor
Heptachlor epoxide
Methoxychlor
Toxaphene
trans-Nonachlor
Aroclor PCBs (microgr PCB 1016
PCB 1221
PCB 1232
PCB 1242
PCB 1248
PCB 1254
PCB 1260
Total (Σ detected) PCBs
PCB Congeners (micro PCB008
PCB018
PCB028
PCB031
PCB033
PCB044
PCB049
PCB052
SF-11 SFDODS HWRP
SFEI Ambient Sediment >40%
Fines
1.1 ND 1.1
-- -- --
--
--
--
--
--
7 7 2.1 7
0.44 0.44 NA 0.72
ND
ND
ND
ND
ND 6.4
ND 0.3
ND
-- --
26 45
--
--
--
----
-- --
--
----

Table I-1Redwood City Harbor Navigation Improvement Integrated Feasibility Study and EIS/EIR
Sediment Chemistry
34 of 53
Analyte
PCB056
PCB060
PCB066
PCB070
PCB074
PCB087
PCB095
PCB097
PCB099
PCB101
PCB105
PCB110
PCB118
PCB128
SF-11 SFDODS HWRP
SFEI Ambient Sediment >40%
Fines

Table I-1Redwood City Harbor Navigation Improvement Integrated Feasibility Study and EIS/EIR
Sediment Chemistry
35 of 53
Analyte
PCB132
PCB138/158
PCB141
PCB149
PCB151
PCB153
PCB156
PCB170
PCB174
PCB177
PCB180
PCB183
PCB187
PCB194
PCB195
PCB201
PCB203Total (∑ detected) PCB Co
PAHs (micrograms/kg 1-Methylnaphthalene
1-Methylphenanthrene
2,3,5-Trimethylnaphthalene
2,6-Dimethylnaphthalene
2-Methylnaphthalene
Acenapthene
Acenaphthylene
Anthracene
Benzo(a)anthracene
Benzo(a)pyrene
Benzo(b)fluoranthene
Benzo(e)pyrene
Benzo(g,h,i)perylene
Benzo(k)fluoranthene
Biphenyl
Chrysene
Dibenzo(a,h)anthracene
Dibenzothiophene
Fluoranthene
Fluorene
Indeno(1,2,3-cd)pyrene
SF-11 SFDODS HWRP
SFEI Ambient Sediment >40%
Fines
14.8 (29.6)
12.1
31.7
9.8
12.1
19.4
26.6
31.7
88
244
412
371
294.0
310
258
12.9
289
32.7
514
25.3
382

Table I-1Redwood City Harbor Navigation Improvement Integrated Feasibility Study and EIS/EIR
Sediment Chemistry
36 of 53
Analyte
Naphthalene
Perylene
Phenanthrene
Pyrene
Total LPAHs
Total HPAHs
Total (Σ detected )PAHs
Dioxins/Furans (ng/k 2,3,7,8-Tetra CDD
1,2,3,7,8-Penta CDD
1,2,3,4,7,8-Hexa CDD
1,2,3,6,7,8-Hexa CDD
1,2,3,7,8,9-Hexa CDD
1,2,3,4,6,7,8-Hepta CDD
Total Octa CDD
Total Tetra CDD
Total Penta CDD
Total Hexa CDD
Total Hepta CDD
2,3,7,8-Tetra CDF
1,2,3,7,8-Penta CDF
2,3,4,7,8-Penta CDF
1,2,3,4,7,8-Hexa CDF
1,2,3,6,7,8-Hexa CDF
2,3,4,6,7,8-Hexa CDF
1,2,3,7,8,9-Hexa CDF
1,2,3,4,6,7,8-Hepta CDF
1,2,3,4,7,8,9-Hepta CDF
Octa CDF
Total Tetra CDF
Total Penta CDF
Total Hexa CDF
Total Hepta CDF
Total TEQ
Effects Range-Median
SF-11 SFDODS HWRP
SFEI Ambient Sediment >40%
Fines
55.8
145.0
237
665
434
3060
3,390

Table I-2Redwood City Harbor Navigation Improvement
Integrated Feasiblity Report and EIS/EIR
Historical Toxicity Results
37 of 53
1 2 3 4 5 6 7 Home SF-11 1 2 3 4 5 Home SF-11 1 2 3 SF-10 SF-11
Amphipod (Rhepoxynius abronius ) Survival (%) 100 100 96 96 92 100 100Amphipod (Ampelisca abdita ) Survival (%) 86 80 91 87 91 84 87 95 76 90 84 90 97 94 97 90 96 92 96 90 96Polychaete (Nephtys caecoides ) Survival (%) 66 91 72 82 98Polychaete (Neanthes arenaceodenta ) Survival (%) 88 100 88 88 88 88 92 96 88A. abdita Survivial (%)N. arenaceodentata Survivial (%)
1 2 3 4 5 6 7 SF-10 Control 1 2 3 4 5 6 7 SF-10
Amphipod (Rhepoxynius abronius ) Survival (%)
Amphipod (Ampelisca abdita ) Survival (%) 94 92 94 89 78 95 89 87 97 95 98 96 87 93 95 92 96
Polychaete (Nephtys caecoides ) Survival (%)
Polychaete (Neanthes arenaceodenta ) Survival (%) 100 98 100 100 100 100 94 100 100 100 100 98 100 100 100 100 100
1 2 3 4 5 6 7 1 2 3 4 5 6 7 SF-10Bivalve larvae (Mytilus edulis ) Survival & Development lowest LC50 or EC50 (%)Mussel larvae (Mytilus galloprovincialis ) Survival Lowest LC50 (%) >100 >100 >100 >100 >100 86.0 88.2 35.2 35.4 35.2 70.7 66.3 35.5 66.6 >100
Mysid (Americamysis bahia) Survival lowest LC50 (%) >100 >100 >100 >100 >100 >100 >100 >100 >100 >100 >100 >100 >100 >100 >100Menidia beryllina Survival lowest LC50 (%) >100 >100 >100 99.1 >100 96.0 89.6 80.6 69.5 >100 70.4 89.3 >100 >100 >100
Contro 1 2 3 4 5 6 1 2 3 4 5 6 7 SF-10
Macoma nasuta Survival (%) 100 93 100 97 100 100 97 92 91 93 91 99 95 98 97Nephtys caecoides Survival (%) 99 83 83 79 81 72 82Nereis Virens Survival (%) 78 68 74 80 70 78 78 90
Feb-11
939294
>100
14-Mar
SF-11 Ref. Database
STFATE modeling (with barge disposal at SF-11) shows that toxicity thresholds were not exceeded for any of the water column bioassays.
Feb-08
Water Column Toxicity Tests Performed May-01 Jun-05 Feb-08
March-14
Mar-14
9384
Feb-11
Benthic Toxicity Tests PerformedMay-01 Jun-05
Bioaccumulation Sediment Exposure Survival
Feb-117
22 >100

Table I-3Redwood City Harbor Navigation Improvement Integrated Feasibility Report and EIS/EIR
MET Data
38 of 53
Arsenic (total) 34.3 35 23.8 27.3 Arsenic (dissolved) 33.7 32.5 17.3 23.4 Cadmium (total) <.01 <0.01 <0.01 <0.01 Cadmium (dissolved) <0.01 <0.01 <0.01 <0.01 Chromium (total) 0.485 0.815 23.8 1.24 Chromium (dissolved) 0.395 0.415 0.325 0.375 Copper (total) 0.41 0.632 0.583 0.595 Copper (dissolved) 0.461 0.603 0.651 0.683 Lead (total) 0.315 0.401 0.369 0.479 Lead (dissolved) 0.012 0.021 0.068 0.015 Mercury (total) 0.00237 0.00377 0.00366 0.00483 Mercury (dissolved) 0.00231 0.00311 0.00294 0.00344 Nickel (total) 2.23 1.96 1.68 2.2 Nickel (dissolved) 1.98 1.97 1.33 2.17 Selenium (total) 0.252 0.059 0.198 <0.015 Selenium (dissolved) <0.015 <0.015 <0.015 0.038 Zinc (total) 3.08 3.59 3.04 4.09 Zinc (dissolved) 4.66 4.08 3.88 4.7
TSS (mg/L) 48.1 39.3 65.7 39.6 Arsenic (total) 4.75 6.75 9.05 2.86 Arsenic (dissolved) 4.85 6.77 8.13 2.6 Cadmium (total) 0.018 0.018 0.019 0.106 Cadmium (dissolved) 0.014 0.015 0.022 0.109 Chromium (total) 0.92 1.01 1.22 1.35 Chromium (dissolved) 0.08 0.09 0.16 0.18 Copper (total) 0.94 1.17 1.42 3.62 Copper (dissolved) 0.6 0.64 0.82 2.97 Lead (total) 0.588 0.588 0.873 2.79 Lead (dissolved) 0.122 0.064 0.193 0.157 Mercury (total) 0.00683 0.0077 0.00778 0.037 Mercury (dissolved) 0.0015 0.00159 0.00128 0.00109 Nickel (total) 2.22 2.74 3.28 2.79 Nickel (dissolved) 2.75 1.82 3.63 2.84 Selenium (total) 0.38 0.38 0.42 0.25 Selenium (dissolved) 0.33 0.36 0.38 0.19
Silver (total) 0.005 0.005 0.011 0.014Sivler (dissolved) 0.005 0.005 0.01 0.012
Zinc (total) 2.26 2.4 2.4 3.79 Zinc (dissolved) 0.53 0.74 0.61 1.54
TSS (mg/L) <0.95 26 5 229 72 77 155 Arsenic (total) 5.92 5.78 4.72 3.65 6.32 4.8 0.007 Arsenic (dissolved) 6.41 5.58 3.87 3.28 5.82 4.53 3.4 Cadmium (total) 0.013 0.017 0.014 0.01 0.02 0.014 <0.006 Cadmium (dissolved) 0.016 0.017 0.012 0.012 0.016 0.016 0.013 Chromium (total) 0.574 0.572 0.507 0.687 1.95 0.697 <0.040 Chromium (dissolved) 0.153 0.254 0.153 0.198 0.282 0.273 0.332 Copper (total) 0.848 1.05 1.05 0.78 2.22 2.04 0.066 Copper (dissolved) 0.624 1.05 0.867 0.864 1.69 1.13 1.4 Lead (total) 0.206 0.22 0.228 0.131 0.662 0.705 0.0135 Lead (dissolved) 0.068 0.101 0.066 0.072 0.01 0.102 0.091 Mercury (total) <0.035 <0.035 <0.035 <0.035 <0.035 <0.035 <0.035 Mercury (dissolved) <0.035 <0.035 <0.035 <0.035 <0.035 <0.035 <0.035 Nickel (total) 3.55 4.17 4.12 3.46 4.78 4.71 0.035 Nickel (dissolved) 3.47 4.03 3.61 3.55 3.0 4.29 4.57 Selenium (total) 0.246 0.218 0.252 0.221 0.329 0.261 <0.011 Selenium (dissolved) 0.202 0.169 0.187 0.179 0.307 0.279 0.279 Zinc (total) 3.92 3.71 3.44 4.61 6.42 4.92 0.335 Zinc (dissolved) 1.83 2.47 1.65 2.75 5.46 5.09 5.09
Jun-05
SF-11 reference
2.62.6
0.0820.0751.3
0.2952.26
<0.010.5150.3650.465
8.1
2.1
8.2
2.471.77
<0.0150.0614.084.17
Water Quality Objectives
NA
6
7.1
81
0.6420.095
0.001580.00168
2.470.0070.012
0.1672.514.1
Water Quality Objectives
50
6
1.8
58
NA
36
9.3
7
Feb-11
Feb-08
36
9.3
50
3.1
8.1
0.025
8.3
7.1
23
0.223
Metals (μg/l) 1 2 3 4 5
28.229.1
<0.01
0.13
0.003281.581.320.169
78.61.21
Metals (μg/l) 1 2 3 SF-11SF-10
5
0.4470.2970.018
0.00431
Metals (μg/l) 1 2 3 4
0.4
0.70.69
0.070.170.0050.0051.47
0.0960.00690.00079
1.813.09
1.3

Table I-3Redwood City Harbor Navigation Improvement Integrated Feasibility Report and EIS/EIR
MET Data
39 of 53
Criteria Max. Conc. Salt
Criteria Contin. Conc. Salt
TSS (mg/L) 4.8 3.8 3.3 8 6.5 5.7 6.9 4.9 24.0 NA NA NA Arsenic (dissolved) 1.98 2.74 4.44 10.2 2.44 8.21 11.8 2.71 1.94 69 36 69 Cadmium (dissolved) 0.0459 0.0521 0.0495 0.0389 0.0588 0.0504 0.0535 0.0547 0.159J 42 9.3 3.9 Chromium (dissolved) <0.164 <0.164 <0.164 <0.164 <0.164 <0.164 0.228J <0.164 0.242J 1100 50 16 Copper (dissolved) 1.22 0.985 0.791 0.748 1.52 0.842 0.797 0.893 3.18 10.8 6.9 9.4 Lead (dissolved) 0.0192J 0.0194J 0.0205J <0.0135 0.0199J 0.0201J 0.0328 0.0358 0.0349 210 8.1 65 Mercury (total) 0.00358 0.00404 0.00333 0.00432 0.00449 0.0054 0.00554 0.0039 0.01 2.1 0.025 2.1 Nickel (dissolved) 4.39 3.67 3.15 2.49 4.4 2.42 2.16 3.18 4.14 62.4 11.9 74 Selenium (total) 0.12 0.184 0.143 0.132 0.184 0.179 0.205 0.131 0.221J 20 5.0 20
Sivler (dissolved) <0.0082 <0.0082 <0.0082 <0.0082 <0.0082 <0.0082 <0.0082 <0.0082 <0.0082 1.9 NA 1.9 Zinc (dissolved) 2.42 2.9 3.05 1.85 2.95 3.84 5.53 3.94 3.08 90 81 90
Metals (μg/l) 2 3 4 5 6
Mar-14MWRP Effluent
Daily Max Limit
1 7 SF-10 Background Water
SF Basin Plan/CTR

Table I-4Redwood City Harbor Navigation Improvement Integrated Feasibility Report and EIS/EIR
DI-WET Data
40 of 53
Criteria Maximum
Concentration
Criteria Continuous
ConcentrationHardness (mg/L) 110 110 140 140 140 150 130 NA NAArsenic 28 29 36 36 35 24 25 69 36Cadmium 0.0147J 0.016J 0.0129J 0.0127J 0.0128J 0.00865J 0.0147J 42 9.3Chromium 0.849 0.924 0.593 0.591 0.632 0.555 0.689 1100 50Copper 1.68J 1.97J 1.81J 1.6J 1.37J 1.23J 1.49J 10.8 6.9Lead 0.319 0.314 0.234 0.2 0.217 0.163 0.317 210 8.1Mercury 0.00476 0.00439 0.00482 0.00489 0.00487 0.00353 0.00538 2.1 0.025Nickel 1.6 2.33 2.09 1.81 1.8 1.3 1.47 62.4 11.9Selenium 0.138 0.138 0.164 0.156 0.135 0.122 0.112 20 5.0Silver <0.00822 <0.00822 <0.00822 <0.00822 <0.00822 <0.00822 <0.00822 1.9 NA Zinc 7.57J 11.8J 11.8J 3.79J 4.35J 4.9J 14.3J 90 81
SF Basin Plan/CTRMar-14
Metals (μg/l) 1 2 3 4 5 6 7

Table I-5Redwood City Harbor Navigation Improvement Integrated Feasibility Report and EIS/EIR
Historic Results of Chemical and Physical Analyses of Redwood City Channel Sediment for Reuse at Hamilton
41 of 53
Arsenic 8.00 8.91 9.8 10.2 5.01 15.3Barium 70.4 75 86.9 61.1 12.8 190Berylluim 0.695 0.658 0.889 0.559 0.132 1.03Boron 29.9 28.9 33.8 15.9 6.93 36.9Cadmium 0.255 0.469 0.621 0.256 0.118 0.7Chromium 97.6 94.9 122 81.3 24.8 112Cobalt 15.7 15.9 18.6 17.1 7.01 27.6Copper 38.1 38.5 52.1 36.8 2.51 68.1Lead 29.8 30.1 41.7 22.0 11.0 43.2Manganese 670 749 762 503 369 943Mercury 2.28 0.23 0.33 0.16 0.02 0.43Nickel 77.2 77.9 97.5 71.1 21.9 112Selenium 0.114 0.131 0.168 0.145 0.004 0.64Silver 0.54 0.46 0.97 <0.21 <0.12 0.58Vandaium 74.0 75.2 90.3 73.6 18.1 118Zinc 117 146 172 117 28 158
Total PAH 263 376 285 210 121 3,390 Pentachlorophenol <12.9 <14.0 <15.7 <12.6 <7.13 17Phenol <18.9 <20.4 <23.0 <18.5 <10.4 130TPH diesel/ motor oil <8.6 <9.3 <10.4 <8.4 <4.7 144,000TPH gasoline/JP-4 <8.6 <9.3 <10.4 <8.4 <4.7 12,000Total BHC <1.12 <1.21 <1.36 <1.10 <0.62 0.99Total DDT <1.16 <1.25 <1.41 <1.13 <0.64 7Total Chlordane <5.12 <5.52 <6.21 <5.00 <2.82 1.1Dichlor prop NT NT NT NT NT 140Dieldrin <1.40 <1.51 <1.70 <1.37 <0.77 0.72Endrin aldehyde <1.74 <1.88 <2.11 <1.70 <0.96 6.4 Heptachlor <1.81 <1.95 <2.19 <1.76 <1.00 0.3Heptachlor epoxide <1.78 <1.93 <2.17 <1.74 <0.98 0.3MCPA NT NT NT NT NT 7,900MCPP NT NT NT NT NT 3,000Methoxychlor <3.20 <3.46 <3.89 <3.13 <1.77 90Total PCB <5.03 <5.43 <6.11 <4.92 <2.77 22.72,3,7,8-TCDD <0.00000085 <0.00000075 <0.00000072 <0.00000072 <0.00000071 0.02
Pentachlorophenol* <3.35 <3.54 <3.57 <3.77 <3.89 <3.19 <3.10 17Phenol* <4.91 <5.18 <5.22 <5.52 <5.69 64.8 86.4 130TPH diesel / motor oil <11.0 <11.0 <11.0 <12.0 <12.0 <10.0 <9.9 144,000TPH gasoline / JP-4 <11.0 <11.0 <11.0 <12.0 <12.0 <10.0 <9.9 12,000Methoxychlor <0.37 <0.39 <0.40 <0.42 <0.43 <0.35 <0.34 90Dioxins (Total TEQ) 0.0037 0.0031 0.0037 0.0042 0.0061 0.0039 0.004 0.02Barium 42.8 45.3 44.9 48.4 53.7 46.4 48.4 190Beryllium 0.594 0.689 0.647 0.791 0.798 0.639 0.638 1.03Boron 1.96 2.91 3.51 2.59 1.9 <1.33 <1.29 36.9Cobalt 14.7 14.4 14.5 15.6 15.7 14.7 15.2 27.6Manganese 720 842 751 728 498 761 835 943Vanadium 55.2 59.4 59.1 63.9 63.7 57.6 59.8 118
Organics (μg/kg) 1 2 3 4 4 6 7
Hamilton Acceptance
Criteria
Jun-11
Jun-08
Organics (μg/kg) 1 2 3 SF-10 SF-11 Screening Criteria
Jun-08
Metals (mg/kg) 1 2 3 SF-10 SF-11 Screening Criteria

Table I-6Redwood City Harbor Navigation Improvement Integrated Feasibility Report and
EIS/EIR
High Resolution Sampling - Inner Turning Basin
42 of 53
Analyte7-1 7-2 7-3 7-4 7-1
Conventionals % Solids 35.1 41 37.7 35.5 38.6PCB Congeners (microgram/kg, ppb dry wt) PCB008 <0.24 <0.21 <0.22 <0.24 <0.12 PCB018 <0.45 <0.39 <0.41 <0.44 <0.10 PCB028 <0.28 <0.24 <0.26 <0.28 <0.14 PCB031 <0.33 <0.28 <0.31 <0.32 <0.076 PCB033 <0.31 <0.27 <0.29 <0.3 <0.089 PCB044 <0.37 <0.32 <0.35 <0.37 <0.24 PCB049 <0.33 <0.29 <0.31 <0.33 <0.22 PCB052 <0.27 <0.24 <0.26 <0.27 <0.13 PCB056 <0.39 <0.34 <0.36 <0.39 <0.12 PCB060 <0.3 <0.26 <0.28 <0.3 <0.16 PCB066 <0.26 <0.22 <0.24 <0.26 0.32J PCB070 <0.23 <0.2 <0.22 <0.23 0.38J PCB074 <0.27 <0.23 <0.25 <0.26 0.19J PCB087 <0.29 <0.25 <0.27 <0.28 <0.11 PCB095 <0.47 <.41 <0.44 <0.47 <0.13 PCB097 <0.39 <0.33 <0.36 <0.38 <0.11 PCB099 <0.24 0.94J 0.7J 1.3J 0.41J PCB101 <0.23 1.5 1J 2.4 1.1 PCB105 <0.3 <0.26 <0.28 <0.29 0.50J PCB110 1.3J 1.4 1J 1.7 0.77 PCB118 1.5 1.4 1.3 1.9 0.99 PCB128 <0.29 <0.25 <0.27 <0.29 <0.10 PCB132 <0.47 <0.41 <0.44 <0.46 2.1 PCB138/158 2.5J 2.3J 2J 2.8J 1.4 PCB141 <0.31 <0.27 <0.29 <0.31 <0.25 PCB149 1.7 1.5 1.6 2.2 1.0 PCB151 0.51J 0.51J 0.46J 0.67J 0.40J
Mar-14 (Composite Area 7 Individual Sample Analysis)

Table I-6Redwood City Harbor Navigation Improvement Integrated Feasibility Report and
EIS/EIR
High Resolution Sampling - Inner Turning Basin
43 of 53
Analyte7-1 7-2 7-3 7-4 7-1Mar-14 (Composite Area 7 Individual Sample Analysis)
PCB153 2.6 2.6 2.3 3.3 -- PCB156 <0.28 <0.24 <0.26 <0.27 <0.17 PCB170 1.2J 1.4 0.77J 1.2J 0.53 PCB174 0.96J 0.65J 0.76J 0.92J 0.32J PCB177 0.56J 0.45J <0.33 0.46J 0.34J PCB180 1.9 1.6 1.8 1.7 0.93 PCB183 0.63J 0.47J 0.4J 0.5J 0.37J PCB187 1.3J 1.2J 1.2J 1.3J 0.72 PCB194 <0.27 <0.23 <0.25 <0.27 <0.11 PCB195 <0.15 <0.13 <0.14 <0.15 <0.083 PCB201 <0.16 <0.14 <0.15 <0.16 0.13J PCB203 <0.3 <0.26 <0.28 <0.3 <0.090Total (∑ detected) PCB Congeners 16.7 17.9 15.3 22.4 12.9
Notes
SFEI Ambient Sediment >40% Fines 14.82014 TMDL Limit 29.6Montezuma Reuse Limits (Cover/Non-Cover) 22.7/180
Comparison Levels
Overlying sampes collected from the mudline to -32 feet within labeled 7-(1-12).Z-Layer samples collected from -32 to -32.5 feet within Compo 12)Z.

Table I-6Redwood City Harbor Navigation Improvement Integrated Feasibility Report and
EIS/EIR
High Resolution Sampling - Inner Turning Basin
44 of 53
Analyte
Conventionals % SolidsPCB Congeners PCB008 PCB018 PCB028 PCB031 PCB033 PCB044 PCB049 PCB052 PCB056 PCB060 PCB066 PCB070 PCB074 PCB087 PCB095 PCB097 PCB099 PCB101 PCB105 PCB110 PCB118 PCB128 PCB132 PCB138/158 PCB141 PCB149 PCB151
7-1Z 7-2 7-2Z 7-3 7-3Z
40.8 38.2 42.6 42.8 40.8
<.12 0.29J <0.12 0.95 0.84J<0.096 <0.10 <0.091 <0.10 <0.096<0.14 0.47J 1.3 1.3 2.1
<0.072 0.38J 1.1 0.98 2.5<0.085 0.38J 1.3 1.4 3
0.89 <0.24 1.5 1.6 3.20.83 0.38J 1.2 1.4 3.40.89 0.78 1.8 2.6 5.6
<0.12 <0.12 <0.11 0.52 3.2<0.15 <0.16 <0.15 0.38J 0.6
1.2 0.56 1.8 2.1 4.40.93 0.55 1.2 2.0 4.80.44J 0.22J 0.69 1.1 1.8<0.1 <0.11 <0.096 1.6 4.41.6 0.73 2.1 3.7 9.42.6 1.6 3.4 2.9 7.51.5 0.80 2.80 3.2 6.62.5 1.2 3.3 6.3 151.2 <0.11 1.3 2.0 5.92 1.2 3 5.1 14
2.3 1.5 3.4 5.7 130.69 <0.10 0.78 1.9 3.36.1 3.6 7.1 9.6 224.3 2.4 4.5 7.9 18
0.73 <0.26 0.8 1.1 2.43.1 1.6 3.5 5.2 11
0.91 0.62 1.1 1.2 2.7

Table I-6Redwood City Harbor Navigation Improvement Integrated Feasibility Report and
EIS/EIR
High Resolution Sampling - Inner Turning Basin
45 of 53
Analyte
PCB153 PCB156 PCB170 PCB174 PCB177 PCB180 PCB183 PCB187 PCB194 PCB195 PCB201 PCB203Total (∑ detected) PCB Congeners
7-1Z 7-2 7-2Z 7-3 7-3Z
-- -- -- -- --0.45J <0.17 <0.16 0.73 21.4 0.82 1.4 2.0 3.31.3 0.69 1.2 1.3 2.8
0.92 0.42J 0.81 1.1 2.13 1.7 2.7 3.7 7
0.8 0.48J 0.76 0.94 22.1 1.2 2.3 2.7 4.81 <0.11 1.1 1.1 2.3
<0.079 <0.084 <0.075 <0.075 1.20.22J <0.12 0.25J 0.24J 0.37J0.92 <0.092 0.69 1.3 2.4
46.8 24.6 61.0 88.2 201
Composite Area 7 are osite Area 7 are labeled 7-(1-

Table I-6Redwood City Harbor Navigation Improvement Integrated Feasibility Report and
EIS/EIR
High Resolution Sampling - Inner Turning Basin
46 of 53
Analyte
Conventionals % SolidsPCB Congeners PCB008 PCB018 PCB028 PCB031 PCB033 PCB044 PCB049 PCB052 PCB056 PCB060 PCB066 PCB070 PCB074 PCB087 PCB095 PCB097 PCB099 PCB101 PCB105 PCB110 PCB118 PCB128 PCB132 PCB138/158 PCB141 PCB149 PCB151
7-4 7-4Z 7-5 7-5Z 7-6
37.7 41.5 39.4 39.7 38.7
<0.12 1.3 <0.12 <0.11 0.30J<0.10 <0.095 <0.099 <0.098 <0.100.73 0.89 <0.14 2 0.610.55 1.3 <0.074 1.7 <0.076
<0.092 0.86 <0.087 2.5 <0.0890.36J 2 0.89 2.1 <0.240.52J 1.4 0.72 2.3 0.51J0.91 2.5 1.7 2.7 0.61
<0.13 <0.12 <0.12 <0.12 <0.12<0.17 <0.15 <0.16 <0.16 <0.160.81 2 1.3 3.5 0.760.89 0.18 1.1 2.4 0.600.42J 0.99 0.56 1.3 <0.12<0.11 <0.099 <0.10 <0.1 <0.110.98 3.4 2.0 4.9 1.1
<0.11 6.4 2.2 4.1 <0.111.0 3.8 2.0 5 1.11.9 5.4 3.1 7.4 1.71.0 1.8 1.8 2.8 <0.111.9 4.8 3.0 5.8 1.42.2 4.1 3.0 6.3 1.7
0.067 <0.095 1.1 1.4 <0.104.5 9.8 5.7 16 4.43.3 6.3 3.8 9.1 3.1
0.68 1.6 0.62 1.7 <0.252.2 5.3 2.5 8.3 2.0
0.86 1.7 0.82 2 0.65
Oct-14 (Composi

Table I-6Redwood City Harbor Navigation Improvement Integrated Feasibility Report and
EIS/EIR
High Resolution Sampling - Inner Turning Basin
47 of 53
Analyte
PCB153 PCB156 PCB170 PCB174 PCB177 PCB180 PCB183 PCB187 PCB194 PCB195 PCB201 PCB203Total (∑ detected) PCB Congeners
7-4 7-4Z 7-5 7-5Z 7-6Oct-14 (Composi
-- -- -- -- --<0.18 0.74 <0.17 0.88 <0.17
1.1 2.2 1.3 3.5 1.20.87 1.5 0.95 2.4 0.890.78 1.1 0.70 2.00 0.682.1 3.3 2.2 6.1 2.3
0.61 1.1 0.70 1.80 0.611.5 3.1 1.7 5.1 1.5
<0.11 1.2 <0.10 2.1 0.76<0.085 <0.078 <0.081 <0.08 <0.082<0.12 0.37J <0.11 0.58 <0.11
<0.092 1.4 <0.088 2.8 <0.089
33.3 84.1 45.5 124 28.5

Table I-6Redwood City Harbor Navigation Improvement Integrated Feasibility Report and
EIS/EIR
High Resolution Sampling - Inner Turning Basin
48 of 53
Analyte
Conventionals % SolidsPCB Congeners PCB008 PCB018 PCB028 PCB031 PCB033 PCB044 PCB049 PCB052 PCB056 PCB060 PCB066 PCB070 PCB074 PCB087 PCB095 PCB097 PCB099 PCB101 PCB105 PCB110 PCB118 PCB128 PCB132 PCB138/158 PCB141 PCB149 PCB151
7-6Z 7-7 7-7Z 7-8 7-8Z
41.6 38.8 42.8 38.9 44
1.1 0.24J 1.6 0.64J <0.11<0.094 <0.10 <0.091 <0.10 <0.089
2.1 0.50J <0.13 1.1 2.31.6 0.34J <0.068 0.67 2.13.4 0.30J <0.08 0.72 2.82.8 0.63 1.3 1.2 3.32.5 0.32J 1.7 0.92 3.24.9 0.79 2.8 1.7 5.7
<0.12 <0.12 <0.11 <0.12 <0.11<0.15 <0.16 <0.15 <0.16 <0.14
3.6 0.48J 2.3 1.7 4.12.40 0.62 2 1.5 3.91.9 <0.12 <0.11 0.67 2.1
<0.099 <0.11 <0.095 <0.10 <0.0947.4 0.75 4 2.6 7.94.9 1.3 5.6 <0.11 6.25.7 0.81 3.8 2.5 7.111 1.2 5.9 5.1 143.9 <0.11 1.9 2.3 58.4 1.2 5.4 4.0 11.09.2 1.3 5.2 4.1 122.6 <0.10 1.6 1.2 2.827 3.1 10 9.9 2317 2.2 7.2 7.1 173.3 0.37J 1.1 1.3 2.5
14.0 1.6 5.4 5.2 <0.114.7 0.54 1.6 1.6 3.5
te Area 7 High Resolution Samples)
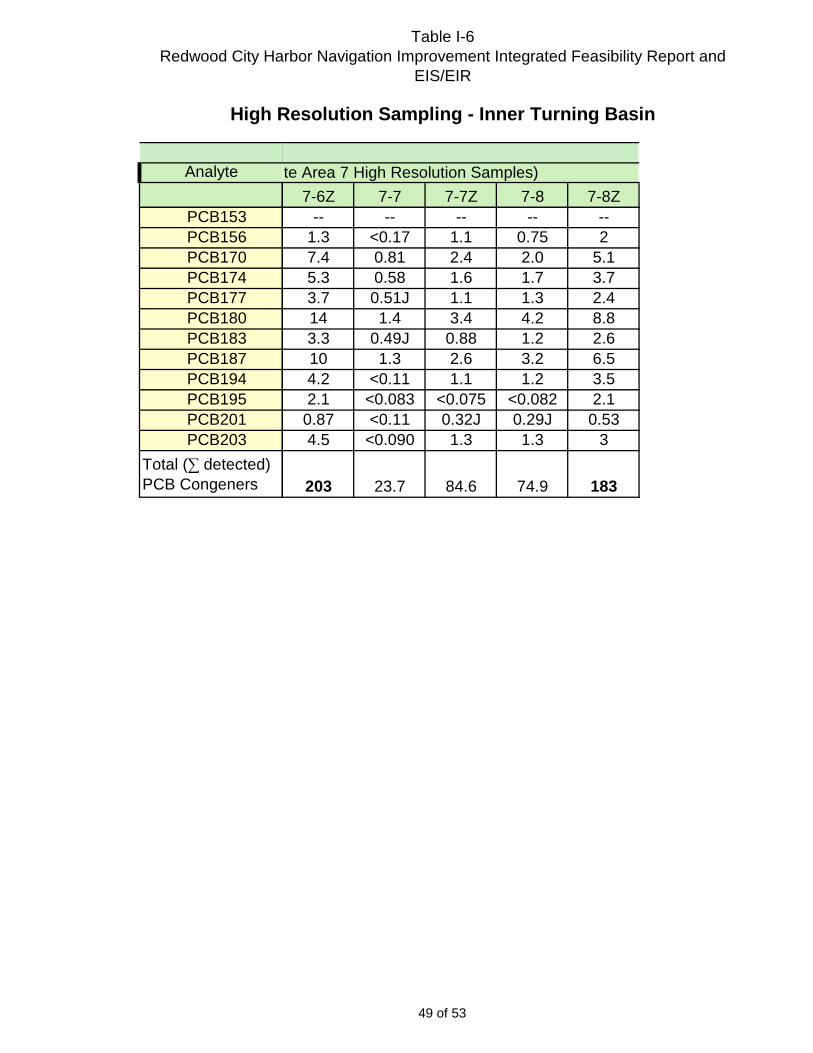
Table I-6Redwood City Harbor Navigation Improvement Integrated Feasibility Report and
EIS/EIR
High Resolution Sampling - Inner Turning Basin
49 of 53
Analyte
PCB153 PCB156 PCB170 PCB174 PCB177 PCB180 PCB183 PCB187 PCB194 PCB195 PCB201 PCB203Total (∑ detected) PCB Congeners
7-6Z 7-7 7-7Z 7-8 7-8Z te Area 7 High Resolution Samples)
-- -- -- -- --1.3 <0.17 1.1 0.75 27.4 0.81 2.4 2.0 5.15.3 0.58 1.6 1.7 3.73.7 0.51J 1.1 1.3 2.414 1.4 3.4 4.2 8.83.3 0.49J 0.88 1.2 2.610 1.3 2.6 3.2 6.54.2 <0.11 1.1 1.2 3.52.1 <0.083 <0.075 <0.082 2.1
0.87 <0.11 0.32J 0.29J 0.534.5 <0.090 1.3 1.3 3
203 23.7 84.6 74.9 183

Table I-6Redwood City Harbor Navigation Improvement Integrated Feasibility Report and
EIS/EIR
High Resolution Sampling - Inner Turning Basin
50 of 53
Analyte
Conventionals % SolidsPCB Congeners PCB008 PCB018 PCB028 PCB031 PCB033 PCB044 PCB049 PCB052 PCB056 PCB060 PCB066 PCB070 PCB074 PCB087 PCB095 PCB097 PCB099 PCB101 PCB105 PCB110 PCB118 PCB128 PCB132 PCB138/158 PCB141 PCB149 PCB151
7-9 7-9Z 7-10 7-10Z 7-11
40.6 39.9 37.4 43.9 38.1
0.53J 1.7 0.43J 2.1 <0.12<0.097 <0.098 <0.10 <0.09 <0.10
0.95 3.5 0.72 0.86 0.650.63 3.4 0.48J 0.85 0.551.0 4.6 <0.092 1.2 <0.0911.3 5.1 0.77 1.4 0.561.1 5.7 0.57 1.4 0.43J1.5 9.5 0.86 1.8 0.89
<0.12 <0.12 <0.13 <0.11 <0.13<0.16 <0.16 <0.17 <0.14 <0.16
1.6 7.3 0.83 2.1 0.861.2 6.9 0.81 1.3 0.74
0.88 2.8 0.47J 0.6 0.40J<0.10 <0.1 <0.11 <0.094 <0.11
2.2 14 1.5 2.8 0.922.1 13 <0.11 3.4 <0.112.2 12 1.4 3.1 1.13.7 23 2 4.5 1.6
<0.10 8.2 <0.11 1.3 <0.113.0 18.0 2.0 4.0 1.43.3 17 2.0 4.1 1.9
0.86 5.6 0.74 0.93 0.50J7.4 44 4.8 7.8 3.95.2 31 3.5 5 2.70.8 5.7 0.47J 0.71 <0.264.1 24 2.3 4.4 1.91.1 6.6 0.72 1.1 0.56

Table I-6Redwood City Harbor Navigation Improvement Integrated Feasibility Report and
EIS/EIR
High Resolution Sampling - Inner Turning Basin
51 of 53
Analyte
PCB153 PCB156 PCB170 PCB174 PCB177 PCB180 PCB183 PCB187 PCB194 PCB195 PCB201 PCB203Total (∑ detected) PCB Congeners
7-9 7-9Z 7-10 7-10Z 7-11
-- -- -- -- --0.66 3.3 0.42J <0.15 <0.171.9 9.9 1.3 1.9 1.11.4 7.9 0.74 1.2 0.63
0.96 4.8 0.67 0.96 0.52J3.3 19 2.1 2.9 1.8
0.90 5.20 0.58 0.8 0.482.5 15 1.5 2.5 1.31.2 7.7 <0.11 1.1 <0.11
<0.079 2.6 <0.085 <0.073 <0.0840.29J 1.4 <0.12 <0.1 0.26J1.1 6.3 <0.093 1.5 <0.091
60.9 356 34.7 68.4 27.7

Table I-6Redwood City Harbor Navigation Improvement Integrated Feasibility Report and
EIS/EIR
High Resolution Sampling - Inner Turning Basin
52 of 53
Analyte
Conventionals % SolidsPCB Congeners PCB008 PCB018 PCB028 PCB031 PCB033 PCB044 PCB049 PCB052 PCB056 PCB060 PCB066 PCB070 PCB074 PCB087 PCB095 PCB097 PCB099 PCB101 PCB105 PCB110 PCB118 PCB128 PCB132 PCB138/158 PCB141 PCB149 PCB151
7-11Z 7-12 7-12Z
41 38.1 74.8
0.57J <0.12 0.56J<0.095 <0.10 <0.052
1.2 0.68 0.580.9 <0.078 0.46
0.83 <0.091 0.791.5 1.2 0.831.3 0.86 0.641.9 1.7 1.6
<0.12 <0.13 <0.064<0.15 <0.17 <0.083
1.8 1.3 0.751.7 1.6 0.861 0.77 0.35
<0.099 <0.11 0.852.6 2.6 22.9 <0.11 2.13 2.3 1.3
4.3 4.3 3.21.8 1.8 1.43.6 3.8 2.74 3.6 2.4
0.84 1.2 0.858.7 7.5 4.65.2 5.5 3.5
0.97 1.0 0.644.2 3.8 2.41.5 1.2 0.71

Table I-6Redwood City Harbor Navigation Improvement Integrated Feasibility Report and
EIS/EIR
High Resolution Sampling - Inner Turning Basin
53 of 53
Analyte
PCB153 PCB156 PCB170 PCB174 PCB177 PCB180 PCB183 PCB187 PCB194 PCB195 PCB201 PCB203Total (∑ detected) PCB Congeners
7-11Z 7-12 7-12Z
-- -- --<0.16 0.70 0.38
1.7 1.6 0.831.2 1.3 0.7
0.93 0.89 0.523.6 3.2 1.5
0.81 0.94 0.552.5 2.2 1.2
<0.1 1.0 0.69<0.078 <0.085 <0.043<0.11 <0.12 0.2J
1.3 <0.092 0.63
68.3 58.543.0