thallium-201 myocardial imaging to evaluate right ... · thallium-201 toevaluatervoverload/ohsuzu...
TRANSCRIPT
Thallium-201 Myocardial Imagingto Evaluate Right Ventricular Overloading
FUMITAKA OHSUZU, M.D., SHUNNOSUKE HANDA, M.D., MAKOTO KONDO, M.D.,HAJIME YAMAZAKI, M.D., TAKESHI TSUGU, M.D., ATSUSHI KUBO, M.D.,
YAEKO TAKAGI, M.D., AND YOSHIRo NAKAMURA, M.D.
SUMMARY The usefulness of thallium-201 myocardial imaging in assessing right ventricular (RV)overloading was evaluated and compared with the electrocardiographic and hemodynamic measurements.Multiple unprocessed photoscans were obtained using a gamma camera in 47 patients who had chronic RVoverload, including 28 subjects with pressure overload, 14 with volume overload and five with pressure andvolume overload.
With pressure overload the degree of RV visualization (RVV) was correlated with elevation of RV systolicpressure. With volume overload the RV free wall was visualized in all patients, and RVV was correlated withthe increment in pulmonary-to-systemic flow ratio. Pressure and volume overload could be differentiated fromthe morphologic characteristics of myocardial image. With pressure overload the interventricular septumappeared straight. With volume overload the RV cavity appeared to be dilated and the interventricular septumconvex to the right ventricle.
Myocardial images were compared with ECG findings of RV hypertrophy in cases with pressure overload.RVV intensity correlated with the number of criteria (Sokolow and Lyon) satisfied in each tracing. The sen-sitivity of myocardial imaging for diagnosis of RV pressure overload was 93.3%, higher than that of ECG cri-teria for RV hypertrophy. We conclude that thallium-201 myocardial imaging is sensitive and reliable inassessing RV overload.
THALLIUM-201 myocardial imaging is known to beuseful for evaluating right ventricular (RV)overload.'-' The distribution of thallium-201 in themyocardium is proportional to the coronary bloodflow, and enhanced coronary flow to the right ventricleresults in intensified perfusion of thallium-201 in theRV myocardium. Thus, the RV free wall is visible inthe myocardial image, which is rarely visualized innormal subjects at rest.3 8 In this study we evaluatedthe usefulness of thallium-201 myocardial imaging inthe noninvasive detection of RV pressure or volumeoverloading.
Materials and MethodsComparative studies of myocardial imaging, stan-
dard 12-lead ECG recording and hemodynamic datawere performed in 47 patients with chronic RVoverload, including 28 with pressure overload, 14 withvolume overload and five with both pressure andvolume overload. Five patients with normalhemodynamics were selected as the control subjects(table 1). The cardiac catheterization for the evalua-tion of RV overload was performed within 24 hoursafter the myocardial imaging and ECG recording.One patient with a heart rate greater than 100beats/min was excluded.
From the Departments of Medicine and Radiology, School ofMedicine, Keio University, Tokyo, Japan.
Dr. Ohsuzu's present address: Nuclear Medicine Division,Massachusetts General Hospital, Fruit Street, Boston,Massachusetts 02114.Address for correspondence: Shunnosuke Handa, M.D., Depart-
ment of Medicine, School of Medicine, Keio University, 35Shinanomachi, Shinjuku-ku, Tokyo 160 Japan.
Received March 5, 1979; revision accepted August 17, 1979.Circulation 61, No. 3, 1980.
For the myocardial imaging a Toshiba GCA-202gamma camera with a low-energy, high-resolution,parallel-hole collimator was used. Images were taken10 minutes after 2 mCi of thallium-201 was injectedintravenously. Scintigrams were taken from theanterior view, the left anterior oblique (LAO) view at300, 450 and 60°, and the left lateral view. The energyand window width was set at 500,000 counts. Analogimages were obtained with Polaroid films and aToshiba microdot imager without additional enhance-ment or computer processing.Unprocessed photoscans were read by two of the
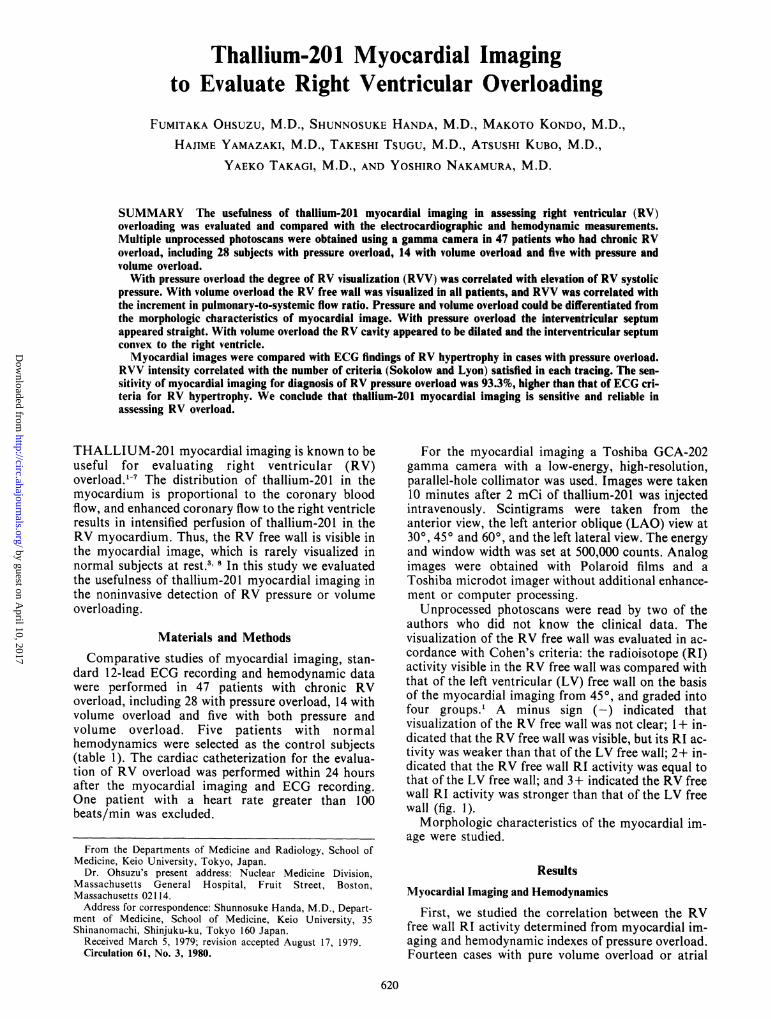
authors who did not know the clinical data. Thevisualization of the RV free wall was evaluated in ac-cordance with Cohen's criteria: the radioisotope (RI)activity visible in the RV free wall was compared withthat of the left ventricular (LV) free wall on the basisof the myocardial imaging from 450, and graded intofour groups.' A minus sign (-) indicated thatvisualization of the RV free wall was not clear; 1 + in-dicated that the RV free wall was visible, but its RI ac-tivity was weaker than that of the LV free wall; 2+ in-dicated that the RV free wall RI activity was equal tothat of the LV free wall; and 3 + indicated the RV freewall RI activity was stronger than that of the LV freewall (fig. 1).
Morphologic characteristics of the myocardial im-age were studied.
ResultsMyocardial Imaging and Hemodynamics
First, we studied the correlation between the RVfree wall RI activity determined from myocardial im-aging and hemodynamic indexes of pressure overload.Fourteen cases with pure volume overload or atrial
620
by guest on April 10, 2017
http://circ.ahajournals.org/D
ownloaded from
THALLIUM-201 TO EVALUATE RV OVERLOAD/Ohsuzu et al.
TABLE 1. Material
Control 5
RV pressure overload 28MS 19PS 3Eisenmenger's complex* 2PPH 2
CCP 2
RV volume overload 14ASD 14
RV pressure and volume overload 5T/F 3ASD with PS 1
MSR with TR 1
Total 52
*Due to ventricular septal defect.Abbreviations: RV = right ventricular; MSrmitral stenosis; PS = pulmonic stenosis;
PPH primary pulmonary hypertension;CCP = chronic cor pulmonale; ASD = atrialseptal defect; T/F = tetralogy of Fallot;MSR = mitral stenosis with regurgitation;TR = tricuspid regurgitation.
septal defect (ASD) were not included in this part ofthe study.
There was no significant difference in heart rateamong groups (table 2). RV systolic pressure was nor-mal (< 30 mm Hg) in all but one among those in thegroup in which the RV free wall was not clear. The
LV RV LV
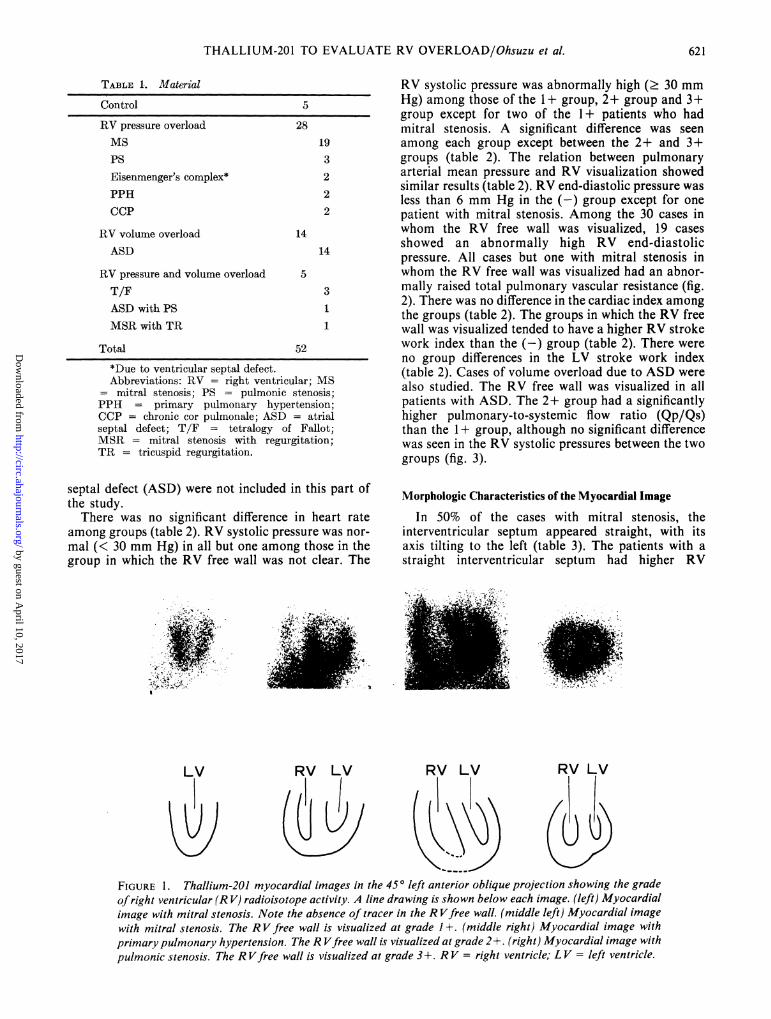
RV systolic pressure was abnormally high (. 30 mmHg) among those of the 1 + group, 2+ group and 3+group except for two of the 1+ patients who hadmitral stenosis. A significant difference was seenamong each group except between the 2+ and 3+groups (table 2). The relation between pulmonaryarterial mean pressure and RV visualization showedsimilar results (table 2). RV end-diastolic pressure wasless than 6 mm Hg in the (-) group except for onepatient with mitral stenosis. Among the 30 cases inwhom the RV free wall was visualized, 19 casesshowed an abnormally high RV end-diastolicpressure. All cases but one with mitral stenosis inwhom the RV free wall was visualized had an abnor-mally raised total pulmonary vascular resistance (fig.2). There was no difference in the cardiac index amongthe groups (table 2). The groups in which the RV freewall was visualized tended to have a higher RV strokework index than the (-) group (table 2). There wereno group differences in the LV stroke work index(table 2). Cases of volume overload due to ASD werealso studied. The RV free wall was visualized in allpatients with ASD. The 2+ group had a significantlyhigher pulmonary-to-systemic flow ratio (Qp/Qs)than the 1 + group, although no significant differencewas seen in the RV systolic pressures between the twogroups (fig. 3).
Morphologic Characteristics of the Myocardial Image
In 50% of the cases with mitral stenosis, theinterventricular septum appeared straight, with itsaxis tilting to the left (table 3). The patients with astraight interventricular septum had higher RV
RV LV
VsARV LV
FIGURE 1. Thallium-201 myocardial images in the 450 left anterior oblique projection showing the gradeofright ventricular (R V) radioisotope activity. A line drawing is shown below each image. (left) Myocardialimage with mitral stenosis. Note the absence of tracer in the R Vfree wall. (middle left) Myocardial imagewith mitral stenosis. The RV free wall is visualized at grade 1+. (middle right) Myocardial image withprimary pulmonary hypertension. The R Vfree wall is visualized at grade 2+. (right) Myocardial image withpulmonic stenosis. The R Vfree wall is visualized at grade 3+. RV = right ventricle; LV = left ventricle.
621
by guest on April 10, 2017
http://circ.ahajournals.org/D
ownloaded from
CIRCULATION VOL 61, No 3, MARCH 1980
TABLE 2. Comparison of the Degree of Right Ventricular Visualization with Findings of Cardiac Catheterization
Right LeftRight Right Pulmonary Total ventricular ventricular
Degree ventricular ventricular arterial pulmonary stroke strokeof right systolic end-diastolic mean vascular Cardiac work work
ventricular Heart rate pressure pressure pressure resistance index index indexGroup visualization (beats/min) (mm Hg) (mm Hg) (mm Hg) (dyn.seccm-5) (l/min/M2) (g-m/m2) (g-m/m2)
A - 69.5 26.0 4.3 14.7 253.8 3.05 14.0 68.0=17.5 - 7.8 -2.4 -5.9 - 99.2 =0.56 -6.8 =17.2(8) (8) (8) (7) (5) (6) (6) (6)
B 1+ 70.1 42.2 5.7 25.4 504.6 2.79 19.8 62.7'14.5 '12.9 - 2.1 - 6.3 -119.3 -0. 54 -6.1 '=15.0(18) (18) (18) (16) (15) (15) (15) (14)
C 2+ 78.9 87.3 7.3 46.0 1158.0 2.73 28.0 45.7-6.1 -28.5 -4-2.8 - 6.0 319.2 =0.93 =9.9 -30.7(7) (7) (7) (3) (3) (4) (4) (3)
D 3+ 74.0 123.0 12.4 70.0 2117.0 2.60 50.0 69.5=15.6 -29.9 -=6.9 -- 4.6 -332.4 = 1.05 =39.2 -4=37.5(5) (5) (5) (3) (3) (4) (4) (2)
p A: B NS 0.005 NS O.OOa 0.02 NS NS NSA: C NS 0.005 0.05 NS 0.05A: D NS 0.005 NS NS NSB: C NS 0.01 NS NS NSB:D NS 0.005 NS - NS NSC:D NS NS NS - NS NS
Values are mean SD. Numbers in parentheses indicated the number of cases in each group.The groups with fewer than five cases are not used for the t test.A:B, A:D, B:C, and C:D = comparison of mean values (p values) between groups; NS = not significant.
P 0.02
N 5 N 15M 253. 8 M 504.6SD 99.2 SD 199.3
dynes seco cm`2500
2000-a
c
n
a) o cont0 MS
1500- VSC3 PPI
un x CCFm o MSF
>>
C 1i000-c0
E
0
500-
N 3 N 3M 1158.0 M 2117.0SD 319.2 SD 332.4
a
0
itrol
D (EisenmengerH
LpiR with TR
0
00O
a
S
0
* X
0=4..Si
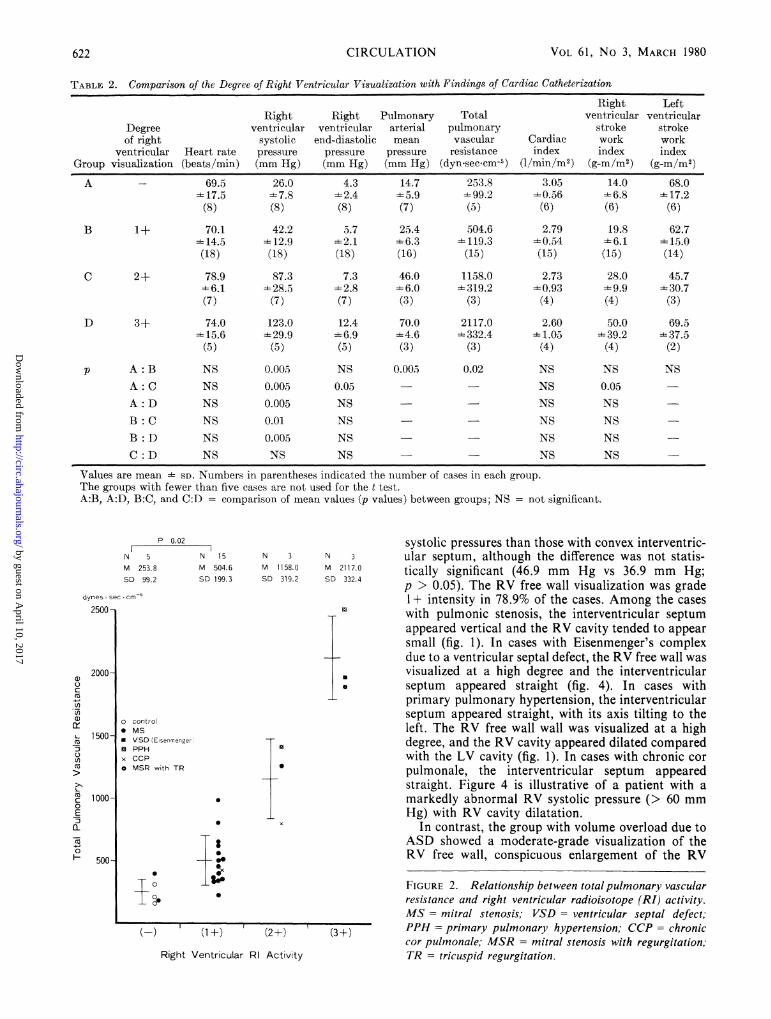
systolic pressures than those with convex interventric-ular septum, although the difference was not statis-tically significant (46.9 mm Hg vs 36.9 mm Hg;p > 0.05). The RV free wall visualization was grade1+ intensity in 78.9% of the cases. Among the caseswith pulmonic stenosis, the interventricular septumappeared vertical and the RV cavity tended to appearsmall (fig. 1). In cases with Eisenmenger's complexdue to a ventricular septal defect, the RV free wall wasvisualized at a high degree and the interventricularseptum appeared straight (fig. 4). In cases withprimary pulmonary hypertension, the interventricularseptum appeared straight, with its axis tilting to theleft. The RV free wall wall was visualized at a highdegree, and the RV cavity appeared dilated comparedwith the LV cavity (fig. 1). In cases with chronic corpulmonale, the interventricular septum appearedstraight. Figure 4 is illustrative of a patient with amarkedly abnormal RV systolic pressure (> 60 mmHg) with RV cavity dilatation.
In contrast, the group with volume overload due toASD showed a moderate-grade visualization of theRV free wall, conspicuous enlargement of the RV
FIGURE 2. Relationship between totalpulmonary vascularresistance and right ventricular radioisotope (RI) activity.MS= mitral stenosis; VSD = ventricular septal defect;PPH= primary pulmonary hypertension; CCP = chroniccor pulmonale; MSR = mitral stenosis with regurgitation;TR = tricuspid regurgitation.
622
(-) (1+) (2+) (3+)
Right Ventricular RI Activity
by guest on April 10, 2017
http://circ.ahajournals.org/D
ownloaded from

THALLIUM-201 TO EVALUATE RV OVERLOAD/Ohsuzu et al.
mmHg60
73.01 @
:30.62 11toa)L 50-
00 0-
.5
00 30 -,*0 L0 .)
C 30W0a:
1(1 +) '(2+)
N S.
N 6 N 8M 32.2 M 36.0SD 7.2 SD 11.8
0
0
0
0
0
0
-0
00
000
0
(1 +) (2+)
RV RI Activity RV RI ActivityFIGURE 3. Degree of right ventricular (R V) visualizationand cardiac catheterization data in patients with atrial septaldefect. (left) Relationship between pulmonary-to-systemicflow ratio (Qp/Qs) and RV radioisotope (RI) activity.(right) Relationship between R V systolic pressure and RVRI activity.
TABLE 3. Morphologic Characteristics of Myocardial ImageTI-201 myocardial imaging
resultsInterventricular septum
No. Convex toDiagnosis pts Straight RV cavityMS 19 9 (47.4%) 10 (52.6%)PS 3 2 (66.7%) 1 (33.3%)VSD (Eisenmenger) 2 2 (100%) 0 (0%)PPH 2 2 (100%) 0 (0%)
CCP 2 2 (100%) 0 (0%)
28 17 (60.7%) 11 (39.3%)
ASD 14 0 (0%) 14 (100%)
T/F 3 3 (100%) 0 (0%)ASD with PS 1 1 (100%76) 0 (0%)MSR with TR 1 0 (0%) 1 (100%)
5 4 (80%) 1 (20%)
Abbreviations: see table 1.
pressure and volume overload. The RV free wall bestshown in the left lateral projection revealed anenlarged RV cavity and a straight-looking interven-tricular septum (fig. 4).
cavity compared with a small LV cavity, and the in'-terventricular septum convex to the right ventricle (fig.4). Good visualization of the RV free wall wasachieved in all cases with tetralogy of Fallot with both
RV LV RV LV
)1, J
Sensitivity of Myocardial Imaging and ECGin Detecting RV Pressure Overload
Visualization of the RV free wall was comparedwith the ECG findings for RV hypertrophy9-12 in caseswith pressure overload. Chronic pressure loading of
RV LV RV LV
FIGURE 4. Thallium-201 myocardial images showing characteristic configurations. A line drawing isshown below each image. (left) Scintigram ofpatient with Eisenmenger's complex due to a ventricular septaldefect in the 60' left anterior oblique (LAO) projection. (middle left) scintigram ofpatient with chronic corpulmonale in the 600 LAO projection. (middle right) Scintigram ofpatient with atrial septal defect in the600 LAO projection. (right) Scintigram of patient with tetralogy of Fallot in the left lateral projection.
P 0.051~ 1
N 5 NM 2.12 M
SD 0.33 SD
3.5-
QS 3.0-QS
2.5-
2.0-
1.5-
0-0
0-
00
623
by guest on April 10, 2017
http://circ.ahajournals.org/D
ownloaded from
VOL 61, No 3, MARCH 1980
P< 0.005
N.S. P<0.001
N 6 N 14 N 3 N 5M 0 M 3.1 M 6.7 M 9.SD 0
Number
12-
SD 3.0 SD 2.1 SD 1.5
o control* MS
_Cl PS* VSD (Eisenmenger)
_ PPH_x CCPA T/FMSR with TR
_5ooo
(-)
U-[39
00
0
*-00
000
(1+)
A
(2+)
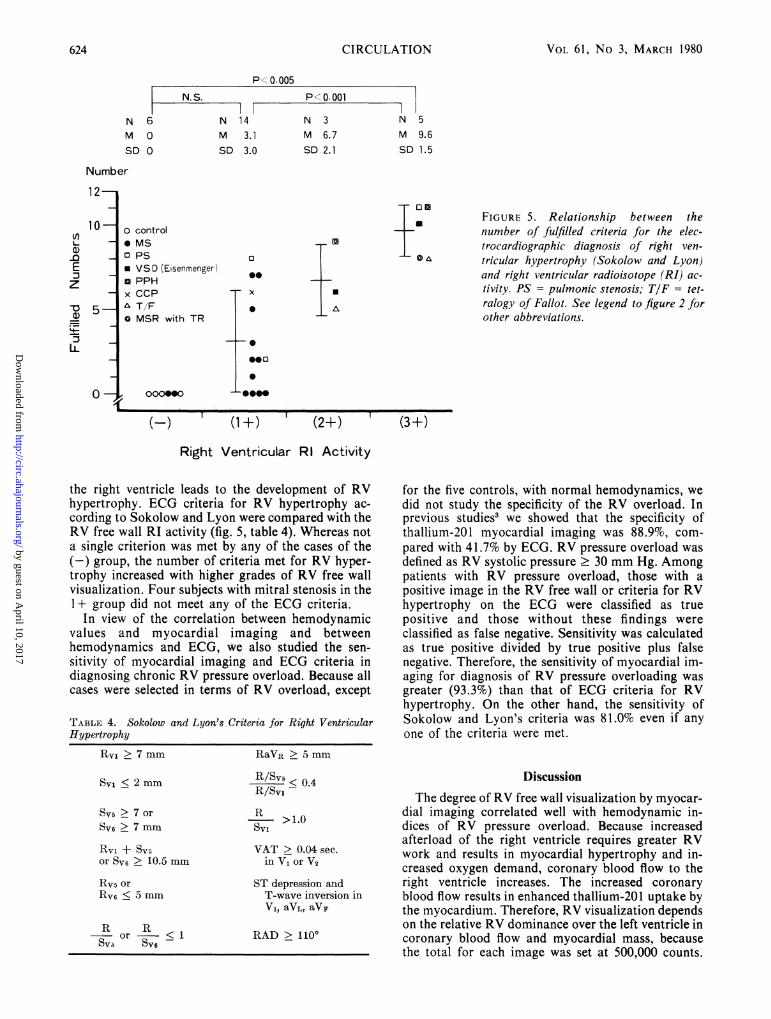
FIGURE 5. Relationship between thenumber of fulfilled criteria for the elec-trocardiographic diagnosis of right ven-tricular hypertrophy (Sokolow and Lyon)and right ventricular radioisotope (RI) ac-tivity. PS = pulmonic stenosis; TIF = tet-ralogy of Fallot. See legend to figure 2 forother abbreviations.
(3+)
Right Ventricular RI Activity
the right ventricle leads to the development of RVhypertrophy. ECG criteria for RV hypertrophy ac-cording to Sokolow and Lyon were compared with theRV free wall RI activity (fig. 5, table 4). Whereas nota single criterion was met by any of the cases of the(-) group, the numnber of criteria met for RV hyper-trophy increased with higher grades of RV free wallvisualization. Four subjects with mitral stenosis in the1+ group did not meet any of the ECG criteria.
In view of the correlation between hemodynamicvalues and myocardial imaging and betweenhemodynamics and ECG, we also studied the sen-sitivity of myocardial imaging and ECG criteria indiagnosing chronic RV pressure overload. Because allcases were selected in terms of RV overload, except
TABLE 4. Sokolow and Lyon's Criteria for Right VentricularHypertrophy
for the five controls, with normal hemodynamics, wedid not study the specificity of the RV overload. Inprevious studies3 we showed that the specificity ofthallium-201 myocardial imaging was 88.9%, com-
pared with 41.7% by ECG. RV pressure overload wasdefined as RV systolic pressure 30 mm Hg. Amongpatients with RV pressure overload, those with apositive image in the RV free wall or criteria for RVhypertrophy on the ECG were classified as truepositive and those without these findings wereclassified as false negative. Sensitivity was calculatedas true positive divided by true positive plus falsenegative. Therefore, the sensitivity of myocardial im-aging for diagnosis of RV pressure overloading wasgreater (93.3%) than that of ECG criteria for RVhypertrophy. On the other hand, the sensitivity ofSokolow and Lyon's criteria was 81.0% even if anyone of the criteria were met.
RV1 > 7 mm
SYi < 2 mm
Sv5 > 7 or
Sv6 > 7 mm
Rvi + SV5or Sv6 > 10.5 mm
Rv5 or
RV6 < 5 mm
R R- or - < 1SYl SV6
RaVR > 5 mm
R/SV5 0.4
R/SvI
R >1.0
VAT > 0.04 sec.in V, or V2
ST depression andT-wave inversion in
V1, aVL, aVF
RAD > 1100
DiscussionThe degree of RV free wall visualization by myocar-
dial imaging correlated well with hemodynamic in-dices of RV pressure overload. Because increasedafterload of the right ventricle requires greater RVwork and results in myocardial hypertrophy and in-creased oxygen demand, coronary blood flow to theright ventricle increases. The increased coronaryblood flow results in enhanced thallium-201 uptake bythe myocardium. Therefore, RV visualization dependson the relative RV dominance over the left ventricle incoronary blood flow and myocardial mass, becausethe total for each image was set at 500,000 counts.
.6
U)
E
z
-o
IL
10 -
5-
0-1 1 1
624 CIRCULATION
by guest on April 10, 2017
http://circ.ahajournals.org/D
ownloaded from
THALLIUM-201 TO EVALUATE RV OVERLOAD/Ohsuzu et al.
Predominant LV disease may mask the coexistence ofRV overload. In cases with RV visualization, theelevated RV end-diastolic pressure might reflect achange in either RV compliance or filling volume.
Several investigators have studied the effect of in-creased heart rate for RV free wall visualization." 3 13Our preliminary study showed that an increase inheart rate of > 120 beats/min by temporary pace-maker made the RV free wall visible in two of eightcases. Therefore, cases with increased heart ratewere excluded. Among patients with ASD, the degreeof the RI activity in the RV free wall was related onlyto the extent of the volume overload of the right ven-tricle. The RV free wall remained visible after surgicalcorrection of ASD.4 This finding might be related toresistance of increased myocardial mass, because theelimination of volume overload should have decreasedcoronary blood flow and ventricular work.
Pressure and volume overload could be differen-tiated from the morphologic characteristics of themyocardial image (table 3). With pressure overloadthe interventricular septum appeared straight. The im-age was assumed to show the decreased curvature ofinterventricular septum. In postmortem studies,'4 theinterventricular septa in RV hypertrophy showed cur-vature variations; in some cases the direction of cur-vature in one or the other plane was reversed so thatthe septum formed a component of the right ventricle.Using a canine heart model, Bemis et al.15 suggestedthat an increase in RV pressure stiffened or buttressedthe interventricular septum. In our patients with RVpressure overload, the interventricular septumappeared straight. Such straight images were not seenin half the cases with mitral stenosis, presumablybecause pressure load was slight. RV pressureoverload in mitral stenosis was mild compared withother diseases with RV pressure overload. In patientswith volume overload the RV cavity appeared to bedilated and the interventricular septum convex to theright ventricle, as in normal cases. In cases with bothpressure and volume overload, a straight-looking in-terventricular septum was observed.The sensitivity of myocardial imaging for diagnosis
of RV pressure overload was better than that of theECG. Differences in sensitivity were attributed to thefact that myocardial imaging reflects the changes inboth the coronary blood flow and myocardial mass, incontrast to ECG criteria, which were determined onthe basis of pathologic findings alone. The ECGcriteria for RV hypertrophy were neither sensitive norspecific, especially in patients with mild-to-moderatepressure overload, as occurs in mitral stenosis. In thisseries the sensitivity of Sokolow and Lyon's criteriawas as high as 81%; however, these criteria yielded
several false-positive diagnoses. Nevertheless, thedegree of RV free wall visualization by myocardialimaging was correlated with the number of ECGcriteria for RV hypertrophy that were fulfilled.
References1. Cohen HA, Baird MG, Rouleau JR, Fuhrmann CF, Bailey IK,
Summer WR, Strauss HW, Pitt B: Thallium-201 myocardialimaging in patients with pulmonary hypertension. Circulation54: 790, 1976
2. Kondoh M, Yamazaki H, Ohsuzu F, Handa S, Kubo A,Masaki E, Akizuki S, Ayabe T, Nakamura Y: Thallium-201myocardial imaging in patients with right ventricular overload-ing - especially correlation with hemodynamics. Heart 9: 471,1977 (Japanese)
3. Ohsuzu F, Handa S, Yamazaki H, Tsugu T, Nakamura Y,Kondoh M, Takagi Y, Kubo A: Thallium-201 myocardial im-aging for evaluation of right ventricular overloading. Correla-tion with hemodynamics and electrocardiography. J Car-diography 8: 483, 1978
4. Kondo M, Kubo A, Yamazaki H, Ohsuzu F, Handa S, TsuguT, Masaki H, Kinoshita F, Hashimoto S: Thallium-201myocardial imaging for evaluation of right-ventricularoverloading. J Nucl Med 19: 1197, 1978
5. Ohsuzu F, Handa S, Tsugu T, Nakamura Y, Kondoh M,Masaki E, Kosuda S, Andoh Y, Hashimoto S: Usefulness ofthallium-201 myocardial imaging in patients with right ven-tricular overloading. Kyoto, Japan, 13th World Congress onDiseases of the Chest, 1978
6. Handa S, Ohsuzu F, Tsugu T, Nakamura Y, Kondo M: Thal-lium-201 myocardial imaging for evaluation of right ventric-ular overloading. Tokyo, Japan, 8th World Congress of Car-diology, 1978, Scientific Exhibition
7. Silber S, Jennerwein G, Goppel L, Locher D, Klein U, RudolphW: Visualization of right ventricular free wall in the thallium-201 scintigram in patients with right ventricular volumeoverload. In Non-invasive Cardiovascular Diagnosis, edited byDiethrich EB. Baltimore, University Park Press, 1977, p 475
8. Strauss HW, Harrison K, Langan JK, Lebowitz E, Pitt B:Thallium-201 for myocardial imaging. Relation of thallium-201to regional myocardial perfusion. Circulation 51: 641, 1975
9. Sokolow M, Lyon TP: The ventricular complex in right ven-tricular hypertrophy as obtained by unipolar precordial andlimb leads. Am Heart J 38: 273, 1949
10. Roman GT Jr, Walsh TJ, Massie E: Right ventricular hyper-trophy. Correlation of electrocardiographic and anatomic find-ings. Am J Cardiol 7: 481, 1961
11. Milnor WR: Electrocardiogram and vectorcardiogram in rightventricular hypertrophy and right bundle branch block. Cir-culation 16: 348, 1957
12. Myers GB, Klein HA, Stofer BE: The electrocardiographicdiagnosis of right ventricular hypertrophy. Am Heart J 35: 1,1948
13. Cook DJ, Bailey I, Strauss HW, Rouleau J, Wagner HN Jr,Pitt B: Thallium-201 for myocardial imaging. Appearance ofthe normal heart. J Nucl Med 17: 583, 1976
14. Hutchins GM, Bulkley BH, Moore GW, Piasio MA, Lohr FT:Shape of the human cardiac ventricles. Am J Cardiol 41: 646,1978
15. Bemis CE, Serur JR, Borkenhagen D, Sonnenblick EH,Urschel CW: Influence of right ventricular filling pressure onleft ventricular pressure and dimension. Circulation 34: 498,1974
625
by guest on April 10, 2017
http://circ.ahajournals.org/D
ownloaded from
F Ohsuzu, S Handa, M Kondo, H Yamazaki, T Tsugu, A Kubo, Y Takagi and Y NakamuraThallium-201 myocardial imaging to evaluate right ventricular overloading.
Print ISSN: 0009-7322. Online ISSN: 1524-4539 Copyright © 1980 American Heart Association, Inc. All rights reserved.
is published by the American Heart Association, 7272 Greenville Avenue, Dallas, TX 75231Circulation doi: 10.1161/01.CIR.61.3.620
1980;61:620-625Circulation.
http://circ.ahajournals.org/content/61/3/620.citationthe World Wide Web at:
The online version of this article, along with updated information and services, is located on
http://circ.ahajournals.org//subscriptions/
is online at: Circulation Information about subscribing to Subscriptions:
http://www.lww.com/reprints Information about reprints can be found online at: Reprints:
document. Permissions and Rights Question and Answer information about this process is available in the
located, click Request Permissions in the middle column of the Web page under Services. FurtherEditorial Office. Once the online version of the published article for which permission is being requested is
can be obtained via RightsLink, a service of the Copyright Clearance Center, not theCirculationpublished in Requests for permissions to reproduce figures, tables, or portions of articles originallyPermissions:
by guest on April 10, 2017
http://circ.ahajournals.org/D
ownloaded from