appendix g geotechnical data - california
TRANSCRIPT

T H E R E S I D E N C E S A T N O H L R A N C H D R A F T E I R C I T Y O F A N A H E I M
Appendices
July 2019
Appendix G Geotechnical Data

T H E R E S I D E N C E S A T N O H L R A N C H D R A F T E I R C I T Y O F A N A H E I M
Appendices
PlaceWorks
This page intentionally left blank.

August 10, 2018
Project No. 11737.002
6509 Serrano L.P. 4040 MacArthur Boulevard, Suite 300 Newport Beach, California 92660
Attention: Mr. John Saunders
Subject: Response to Review Comments Regarding Leighton’s Geotechnical Exploration Report for the Proposed Residential Development 6501-6513 East Serrano Avenue Anaheim, California
Reference: Leighton and Associates, Inc., 2017, Geotechnical Exploration Report, Proposed Residential Development, 6501-6513 East Serrano Avenue, Anaheim, California, Project No. 11737.001, dated October 9, 2017.
INTRODUCTION
In accordance with your request and authorization, Leighton and Associates, Inc. (Leighton) is pleased to present our response to the Preliminary Soils Report Review Comments by the City of Anaheim Department of Public Works dated May 25, 2018, regarding our referenced geotechnical exploration report (Leighton, 2017) for the subject project.
RESPONSES TO REVIEW COMMENTS
A copy of the review comments prepared by the City of Anaheim and dated May 25, 2018 is included in Appendix A. For convenience, the two (2) review comments are presented below in italics before Leighton’s responses.
G-1

11737.002
2
Comment 3.1:
As summarized within earlier correspondences prepared by the City of Anaheim, the preliminary soils report must be reviewed by the Santiago Geological Hazard Abatement District (GHAD) prior to approval by the City. Contact information for SGHAD is presented below:
Karen Holthe, CMCA, AMS Senior Account Manager
[email protected] Cardinal Property Management, AAMC
825 N. Park Center Dr., #101 Santa Ana, CA 92705
P (714) 779-1300 / F (714) 779-3400
Please provide a copy of the review comments and/or consent from the Santiago GHAD.
Response to Comment 3.1:
Our referenced report (Leighton, 2017) was submitted to the Santiago GHAD for review, and a copy of the Residential Grading Plan Review letter dated June 29, 2018, prepared by ENGEO (acting as the Santiago GHAD Manager) is included in Appendix B. The review letter indicates that construction of the planned residences and associated improvements, including biofiltration improvements, if constructed, does not appear that it would affect the Santiago landslide, or the ongoing mitigation efforts by the Santiago GHAD.
Comment 3.2:
Percolation testing was conducted at two locations within the site (LP-1 & LP-2). Both test locations encountered artificial fill to the total depth of the boring. Measured infiltration rates within the test borings were calculated between 0.05 and 0.06 inches per hour. Since the infiltration rates did not meet the County of Orange minimum infiltration rate (0.3 inches per hour), the consultant has concluded that infiltration beneath the site is impractical and not recommended for the proposed development. The County of Orange, Technical Guidance Document states that infiltration testing should not be conducted in engineered or undocumented fill. While the areas tested
G-2

11737.002
3
were underlain by significant fill, other areas of the site are not and are reported to have sandstone bedrock located near the surface. As such, the consultant should determine if infiltration is practical within the sandstone unit encountered in various exploratory borings where present near the surface. Keep in mind that while the sandstone unit may exhibit a relatively low permeability, a dry well in the sandstone unit may result in an infiltration rate that is deemed feasible in the TGD (where infiltration rate= well flow rate/wetted area).
Response to Comment 3.2:
Sandstone and siltstone bedrock was encountered at relatively shallow depths in the borings performed at the site, primarily in the eastern and western portions of the site. The bedrock as encountered in these areas is hard and generally comprised of fine to medium grained sandstone with interbedded grey brown moderately fractured fissile siltstone. Regional geologic mapping of the site vicinity (Morton and Miller, 2006) indicates that the geologic structure of the sedimentary bedrock generally dips down to the north and northeast at inclinations on the order of approximately 15 to 30 degrees from horizontal. Due to the subsurface conditions at the site and in its vicinity (shallow bedrock in the eastern and western portions of the site and deep canyon fill in the central portion of the site), it is our opinion that stormwater infiltration within the sandstone bedrock at the site would increase the risk of geotechnical hazards at the site and/or down gradient of the site. The risks would include the potential for adverse effects on properties down gradient caused by migration of water infiltrated into the subsurface at the site. The joints and factures in the bedrock and the interlayered and inclined (north and northeast dipping) sandstone and siltstone layers under the site provide a pathway to downslope properties where adverse effects could be caused by migrating water. The locations and lateral extents of potential water migration paths within the bedrock are very difficult and nearly impossible to estimate. Therefore, we do not recommend stormwater infiltration for the site. Consequently, additional testing to determine if infiltration is practical within the sandstone is not necessary.
Comment 3.3:
The Preliminary Soils Report shall be approved prior to filing for Planning Commission public hearing.
G-3

11737.002
4
Response to Comment 3.3:
Acknowledged.
CLOSING
We appreciate the opportunity to be of continued service on this project. If you have any questions or if we can be of further service, please contact us at (866) LEIGHTON; specifically at the phone extensions or e-mail as listed below.
Respectfully submitted, LEIGHTON AND ASSOCIATES, INC. Jeffrey M. Pflueger, PG, CEG 2499 Associate Geologist Extension 4257, [email protected] Vincent P. Ip, PE, GE 2522 Senior Principal Engineer Extension: 1682, [email protected]
JMP/VPI/gv Attachments: Appendix A – City of Anaheim Letter dated May 25, 2018 Appendix B – Santiago GHAD Residential Grading Plan Review Letter
dated June 29, 2018 Distribution: (1) Addressee
G-4

APPENDIX A
City of Anaheim Review Letter dated May 25, 2018
G-5

G-6

G-7

G-8

G-9
APPENDIX B
Santiago GHAD Residential Grading Plan Review Letter
dated June 29, 2018
G-10

2010 Crow Canyon Place, Suite 250 San Ramon, CA 94583 (925) 866-9000 Fax (888) 279-2698www.engeo.com
Project No. 14174.000.000
June 29, 2018
Ms. Karen HoltheSantiago Geologic Hazard Abatement DistrictCardinal Property Management825 N. Park Center Drive, Suite 101Santa Ana, CA 92705
Subject: 6501-6513 East Serrano AvenueAnaheim, California
RESIDENTIAL GRADING PLAN REVIEW
References: 1. Leighton and Associates, Inc., Geotechnical Exploration Report, 6501- 6513 East Serrano Avenue, Anaheim, CA 92807; October 9, 2017, Project No. 11737.001.
2. City of Anaheim, Department of Public Works; Review of GeotechnicalExploration Report for Proposed Residential Development, 6501-6513 EastSerrano Avenue, Anaheim, CA 92807; OTH2018-01060, First Review,May 25, 2018.
3. Eberhart and Stone, Plan of Control, Prepared for Proposed SantiagoGeologic Hazard Abatement District, Anaheim Hills, Anaheim, California,February 22, 1999.
4. Eberhart and Stone, Santiago Landslide Area Anaheim Hills, GeologicHazard Abatement District Benefit Area, Anaheim, California.
Dear Ms. Holthe:
ENGEO, acting as the Santiago Geologic Hazard Abatement District (GHAD) Manager, reviewed the Leighton Geotechnical Exploration Report and City of Anaheim, Department of Public Works Review of Geotechnical Exploration Report for Proposed Residential Development (References 1 and 2) for 6501-6513 East Serrano Avenue in Anaheim, California (Subject Property). The purpose of our review was to address the City of Anaheim’s request that the applicant obtain written consent from the GHAD indicating that the proposed project will not significantly impact stability of the existing Santiago landslide.
As described in Reference 1, the planned residences will replace the existing commercial buildings and improvements. The residences will be two- to three-story attached multi-family residential buildings, with private drive aisles and guest parking. Onsite biofiltration is being considered for stormwater treatment and surface drainage will be directed away from the structures.
As described in the Leighton Geotechnical Exploration Report, artificial fill thickness varied beneath the Subject Property from 1 foot to greater than 76½ feet. Puente Formation bedrock was encountered in six of the eight exploratory borings underlying the artificial fill. Groundwater was not observed in the exploratory borings at the time of the Leighton exploration. Percolation testing was conducted at two of the exploratory boring locations to support design of the planned biofiltration improvements.
G-11

Santiago Geologic Hazard Abatement District 14174.000.0006501-6513 East Serrano Avenue, Anaheim June 29, 2018RESIDENTIAL GRADING PLAN REVIEW Page 2
The Subject Property is located northwest of the Santiago GHAD as shown on the Benefit Area Site Plan (Reference 4). The planned addition is not located within the Santiago GHAD or the mapped “Limit of Surface Damage” area. As stated in the Plan of Control (Reference 3), the formation on the Santiago landslide was caused by four primary factors:
1. North-facing hillside topography.2. Geologic structure as north-dipping strata and south-ancient faults.3. Geologically weak materials along critical sedimentary beds and faults.4. Rising groundwater.
Based on our review, it does not appear that construction of the planned residences and associated improvements, including biofiltration improvements, if constructed, would affect the Santiago landslide or the ongoing mitigation efforts by the Santiago GHAD. We make no representations as to the accuracy of dimensions, measurements, calculations or any portion of the design.
If you have any questions regarding the contents of this letter, please contact us.
Very truly yours,
ENGEO INCORPORATED
Haley Trindle Eric Harrell, CEGht/eh/jf
G-12

GEOTECHNICAL EXPLORATION REPORT PROPOSED RESIDENTIAL DEVELOPMENT
6501-6513 EAST SERRANO AVENUE ANAHEIM, CALIFORNIA
Prepared for:
6509 Serrano L.P. 4040 MacArthur Boulevard, Suite 300
Newport Beach, California 92660
Project No. 11737.001
October 9, 2017
G-13

October 9, 2017
Project No. 11737.001
6509 Serrano L.P. 4040 MacArthur Boulevard, Suite 300 Newport Beach, California 92660 Attention: Mr. John Saunders Subject: Geotechnical Exploration Report Proposed Residential Development 6501-6513 East Serrano Avenue Anaheim, California In accordance with our proposal dated July 12, 2017, authorized by you on July 25, 2017, Leighton and Associates, Inc. (Leighton) is pleased to present this geotechnical exploration report for the proposed residential development project located at 6501-6513 East Serrano Avenue in Anaheim California. The purpose of our study was to evaluate the geotechnical conditions at the site and to provide geotechnical recommendations for the design and construction of the project as currently proposed. The results of our exploration and recommendations are presented in this report.
G-14

11737.001
2
We appreciate this opportunity to be of service. If you have any questions regarding this report or if we can be of further service, please call us at your convenience at (866) LEIGHTON, directly at the phone extensions or e-mail addresses listed below.
Respectfully submitted, LEIGHTON AND ASSOCIATES, INC. Jeffrey M. Pflueger, PG, CEG 2499 Associate Geologist Ext 4257; [email protected] Vincent P. Ip, PE, GE 2522 Senior Principal Engineer Ext 1682; [email protected]
JMP/VPI/JAR/lr Distribution: (1) Addressee
G-15

11737.001
i
TABLE OF CONTENTS Section Page 1.0 INTRODUCTION .................................................................................................. 1
1.1 Site Description and Proposed Improvements ........................................... 1 1.2 Purpose and Scope ................................................................................... 2
2.0 GEOTECHNICAL FINDINGS ............................................................................... 5
2.1 Geologic Setting ........................................................................................ 5 2.2 Subsurface Soil Conditions ........................................................................ 5 2.3 Groundwater Conditions ............................................................................ 6 2.4 Infiltration Capacity .................................................................................... 7
3.0 GEOLOGIC AND SEISMIC HAZARDS ............................................................... 9
3.1 Surface Fault Rupture ................................................................................ 9 3.2 Strong Ground Shaking ........................................................................... 10 3.3 Liquefaction ............................................................................................. 11 3.4 Earthquake-Induced Settlement .............................................................. 11 3.5 Earthquake-Induced Lateral Spreading ................................................... 11 3.6 Earthquake-Induced Landslides .............................................................. 11 3.7 Earthquake-Induced Flooding .................................................................. 12 3.8 Seiches and Tsunamis............................................................................. 12 3.9 Flooding Hazard ...................................................................................... 13
4.0 DESIGN RECOMMENDATIONS ....................................................................... 14
4.1 Earthwork ................................................................................................. 14
4.1.1 Site Preparation ............................................................................ 14 4.1.2 Site Grading .................................................................................. 14
4.2 Trench Backfill ......................................................................................... 16 4.3 Foundation Recommendations ................................................................ 17 4.4 Surface Drainage ..................................................................................... 21 4.5 Corrosion Protection Measures ............................................................... 21 4.6 Retaining Walls ........................................................................................ 22 4.7 Concrete Flatwork .................................................................................... 23 4.8 Additional Geotechnical Services ............................................................ 23
5.0 LIMITATIONS ..................................................................................................... 25
6.0 REFERENCES ................................................................................................... 26
G-16

11737.001
- ii -
Tables Table 1 – Measured Infiltration Rate ............................................................................... 7 Table 2 – 2016 CBC Based Ground Motion Parameters (Mapped Values) .................. 10 Table 3 – Recommendations for Conventional Shallow Foundations ........................... 18 Table 4 – Recommendations for Conventional Slabs-on-Grade ................................... 19 Table 5 – Corrosivity Test Results ................................................................................ 21
LIST OF ATTACHMENTS Important Information About Your Geotechnical Engineering Report Rear of Text Figures
Figure 1 – Site Location Map Rear of Text Figure 2 – Boring Location Map Rear of Text Figure 3 – Regional Geology Map Rear of Text Figure 4 – Regional Fault Map Rear of Text Figure 5 – Historic Seismicity Map Rear of Text Figure 6 – Seismic Hazard Map Rear of Text Figure 7 – Flood Hazard Zone Map Rear of Text Figure 8 – Dam Inundation Map Rear of Text Figure 9 – Retaining Wall Backfill and Subdrain Detail Rear of Text Appendices
Appendix A – Field Exploration Logs Appendix B – Laboratory Test Results Appendix C – Percolation Test Results Appendix D – Seismicity Data Appendix E – General Earthwork and Grading Recommendations
G-17

11737.001
1
1.0 INTRODUCTION
1.1 Site Description and Proposed Improvements
The project site is roughly 3 acres in size and is located at the northeast corner of Serrano Avenue and Nohl Ranch Road (6501, 6503, 6505, 6507, 6509, 6511 and 6513 East Serrano Avenue) in the city of Anaheim, California. The site is bordered by Serrano Avenue to the south, Nohl Ranch Road to the west, and single-family residential properties to the north and east. The site is relatively flat and is currently occupied by a commercial/retail development consisting of seven (7) one-story buildings situated in the central portion of the site surrounded by asphalt concrete (AC) paved surface parking and access drive aisles. Based on our observations, the existing improvements (i.e. pavement and buildings) generally appear to be in good condition with no obvious signs of distress. The northeast corner of the site is currently occupied by a playground area associated with a children’s day care facility. The site location (latitude 33.8317°. longitude 117.7600°) and surrounding area are shown on Figure 1, Site Location Map. Review of the City of Anaheim Base Map 286 (December, 2016) indicates a 5-foot wide electrical easement within the southern and western parking areas.
Based on preliminary review of historical aerial photographs and topography maps, the project site was mass graded as a part of a larger development between approximately 1966 and 1972, and the seven (7) existing structures were constructed to its current configuration by approximately 1980 (NETR, 2017). Historic topographic contours that existed within the project site boundary prior to mass grading suggest that cut and fill grading of the previously existing natural topography was required to achieve the current grade. Maximum depth of artificial fill materials below this site is greater than 75 feet in thickness in the central region of the site. We understand the proposed residential development includes complete demolition of the existing commercial buildings and improvements at the site to allow grading and construction for a residential development consisting of several two- to three-story attached multi-family residential buildings, private drive aisles and guest parking. No subterranean level is currently planned for the buildings. It is our understanding that onsite biofiltration is being considered for best management practice for storm water treatment. Although loading information for the proposed new structures has not been provided at this time, we expect
G-18

11737.001
2
the loading will be similar to typical two- to three-story attached residential structures.
1.2 Purpose and Scope
The purpose of our geotechnical exploration was to evaluate the soil and groundwater conditions at the site through review of available data, exploratory borings and onsite percolation testing, in order to provide geotechnical recommendations for design and construction of the proposed improvements. The scope of this geotechnical exploration included the following tasks: • Background Review – A background review was performed of readily
available, relevant geotechnical and geological literature pertinent to the site. References used in preparation of this report are listed in Section 6.0. In addition, we submitted a request for public records with the City of Anaheim with the intent to obtain a copy of the as-graded geotechnical report documenting the mass/rough grading of the site. City of Anaheim approved grading plans for the surrounding tract (Tract 8375) to the north and east of the project site were available; however, the as-graded geotechnical report documenting the mass/rough grading of the site was not available for our review.
• Pre-Field Exploration Activities – A site visit was performed by a member of our technical staff to mark the boring locations. Underground Service Alert (USA) was notified to locate and mark existing underground utilities prior to our subsurface exploration.
• Field Exploration – Our field exploration was performed on August 16, 2017, and consisted of six, 8-inch diameter hollow-stem auger borings (LB-1 through LB-6) each drilled to depths ranging between approximately 9.8 and 76.5 feet below existing ground surface (bgs). The approximate locations of the borings are shown on Figure 2, Boring Location Map.
During drilling of the hollow-stem auger borings (LB-1 through LB-6), both bulk and drive samples were obtained from the borings for geotechnical laboratory testing. Drive samples were collected from the borings using a Modified California Ring sampler in accordance with ASTM Test Method D 3550. Standard Penetration Tests (SPT) were also performed within the
G-19

11737.001
3
hollow-stem auger borings in accordance with ASTM Test Method D 1586 to help in evaluating the density and consistency of the site soils. The SPT and California Ring samplers were driven for a total penetration of 18 inches, unless practical refusal was encountered, using a 140-pound automatic hammer falling freely for 30 inches. The number of blows per 6 inches of penetration was recorded on the boring logs.
The borings were logged in the field by a certified engineering geologist. Each soil sample collected was reviewed and described in accordance with the Unified Soil Classification System (USCS). The samples were sealed and packaged for transportation to our laboratory. After completion of drilling, the borings (LB-1 through LB-6) were backfilled to the ground surface with excess soils generated during the exploration and patched with cold-mix asphalt concrete. The boring logs are presented in Appendix A, Field Exploration Logs.
• Laboratory Tests – Laboratory tests were performed on selected soil samples obtained during our field investigation. The laboratory testing program was designed to evaluate the physical and engineering characteristics of the onsite soil. Tests performed during this investigation include:
˗ In- situ Moisture Content and Dry Density (ASTM D2216 and ASTM D2937);
˗ Atterberg Limits (ASTM D 4318);
˗ Gradation (ASTM D 6913);
˗ Percent Passing No. 200 Sieve (ASTM D 1140);
˗ Direct Shear (ASTM D 3080)
˗ Consolidation (ASTM D 2435);
˗ Maximum Dry Density (ASTM D 1557);
˗ R-Value (California Test Method 301); and
˗ Corrosivity Suite – pH, Sulfate, Chloride, and Resistivity (California Test Methods 417, 422, and 532/643).
Results of the in-situ moisture content and dry density testing are presented on the boring logs in Appendix A. Other laboratory test results are presented in Appendix B, Laboratory Test Results.
G-20

11737.001
4
• Percolation Testing – During our field exploration performed on August 16, 2017, two additional 8-inch diameter hollow-stem auger borings (LP-1 and LP-2) located in the southern portion of the site in the vicinity of the proposed stormwater infiltration areas were each drilled to an approximate depth of 9 feet bgs and converted to a temporary percolation test well for subsequent percolation testing. Refer to the discussion of infiltration rate presented in Section 2.4 and the field percolation test data provided in Appendix C, Percolation Test Results.
• Engineering Analysis - The data obtained from our background review, field exploration, and laboratory testing program were evaluated and analyzed to develop geotechnical recommendations for the project as currently planned.
• Report Preparation - The results of the exploration are summarized in this report presenting our findings, conclusions and recommendations.
G-21

11737.001
5
2.0 GEOTECHNICAL FINDINGS
2.1 Geologic Setting
The project site is located within the Peninsular Ranges geomorphic province of California along the eastern margins of the Los Angeles Basin. The Los Angeles Basin is bounded to the north by the east-west trending Transverse Ranges and to the east and southeast by the northwest trending Peninsular Ranges. The Los Angeles Basin is a large structural depression formed as the San Andreas fault shifted eastward to its present location. The basin has since been filled with sediments eroded from the surrounding highlands interpreted to have a maximum thickness of over 30,000 feet (Yerkes, 1965). The project site is located in the Santa Ana Mountains in the eastern portion of the Peralta Hills. These low-lying hills extend westward from the Santa Ana Mountains toward the Los Angeles Basin and are primarily underlain by Tertiary age (between about 2.6 to 65 million years old) mostly marine sediments deposited in the Los Angeles Basin spanning the Miocene to Pliocene Epoch (about 2.6 to 23.3 million years ago). The project site is located in an area mapped to be underlain by Miocene age Puente Formation bedrock (Soquel and La Vida Members) primarily consisting of sandstone and siltstone (Morton and Miller, 2006). The mapped geologic units in the vicinity of the project site is presented as Figure 3, Regional Geology Map.
2.2 Subsurface Soil Conditions
As interpreted from our subsurface explorations (hollow-stem auger borings), the site is underlain by previously placed artificial fill overlying Tertiary age sandstone and siltstone bedrock materials. The stratigraphy of the subsurface soil and bedrock materials encountered in each soil boring is presented on the boring logs (Appendix A), a general description of the earth materials as encountered are described below:
Artificial Fill
The previously placed artificial fill soil as encountered in our exploratory borings is on the order of less than a foot to over 76.5 feet thick across the site, consisting primarily of orange brown to gray brown, moist to very moist, medium dense to dense silty sand and clayey sand interlayered with medium stiff to very
G-22

11737.001
6
stiff clay, silty clay and sandy clay. Based on review of the documents provided by the City of Anaheim, the artificial fill materials encountered at the site are associated with the previous mass/rough grading of the area. No report documenting the grading activities associated with the current site development was available for review; however, based on our understanding of the City’s policy, it is reasonable to assume that previous grading activities associated with the site and its vicinity were permitted and performed under the observation and testing of geotechnical consultants.
Puente Formation Bedrock
Encountered below the artificial fill in borings LB-1, LB-3, LB-4 and LB-5 at various depths was upper Miocene age marine sedimentary rocks of the Puente Formation.
The La Vida Member (Map Symbol: Tplv) is the basal stratigraphic unit of the Puente Formation encountered in boring LB-3 (Figure 2). The La Vida Member consists of orange brown to light grey brown, laminated, brittle shaley siltstone with lesser amounts of slightly well cemented sandstone. The sandstone content increases as the La Vida Member grades into the Soquel Member (Map Symbol: Tpsq) which is present below a majority of the site as encountered in borings LB-1, LB-4 and LB-5 (Figure 2). The Soquel Member consists of orange brown, massive, fine to medium grained pebbly sandstone with interbedded grey brown moderately fractured fissile siltstone. Based on blow counts and visual classification, the bedrock materials encountered were generally characterized as dense, hard and moderately oxidized.
2.3 Groundwater Conditions
Groundwater was not encountered in our borings excavated at the site to a maximum depth of approximately 76.5 feet bgs during drilling. Based on the currently proposed development scheme, groundwater is not expected to pose a constraint during and after construction.
Although groundwater is not considered a constraint for the project, seasonal fluctuations in groundwater level, localized zones of perched water including water due to nearby landscaping, and an increase in soil moisture should be anticipated during and following locally intense rainfall or stormwater runoff.
G-23

11737.001
7
2.4 Infiltration Capacity
In-situ percolation testing was performed to evaluate the infiltration capacity of the site soils in general accordance with the Orange County Technical Guidance Document (TGD) for the Preparation of Conceptual/Preliminary and/or Project Water Quality Management Programs (WQMPs) (OCPW, 2013).
Borings LP-1 and LP-2 located in the general vicinity of the planned biofiltration treatment areas were both converted to temporary percolation test wells upon completion of drilling and sampling (Figure 2, Exploration Location Map). The temporary wells consisted of a 2-inch-diameter, PVC pipe with perforations from 4 to 9 feet bgs placed within each borehole. The annulus was filled with clean sand (#3 Monterey Sand) to approximately 1 foot above the perforated pipe. In general accordance with the Orange County TGD (OCPW, 2013), each percolation test well was pre-soaked prior to the testing. After the conclusion of the percolation test, the PVC pipe was removed and the test holes were backfilled with excess soil cuttings and patched with cold-mix asphalt concrete.
The test was performed using the falling-head method which records the drop of water level inside the well over each testing period. The measured infiltration rate for the percolation tests was calculated by dividing the rate of discharge (i.e., volume of water discharged from the well during the test) by the infiltration surface area, or flow area. Detailed results of the field testing data and measured infiltration rate for the test wells are presented in Appendix C, Percolation Test Results. Presented in the table below is a summary of the measured infiltration rate results.
Table 1 – Measured Infiltration Rate
Boring-Percolation Test Well Designation
Approximate Depth of Test Zone Below Existing Ground
Surface (feet)
Measured Infiltration Rate
(inches per hour)
LP-1 5 to 9 0.06
LP-2 5 to 9 0.05 The percolation tests performed at test well locations LP-1 and LP-2 (Figure 2) yielded very low measured infiltration rates of approximately 0.06 and 0.05 inch per hour within the test zone between 5 to 9 feet bgs. These rates do not meet
G-24

11737.001
8
the minimum requirement for stormwater infiltration feasibility (0.3 inch per hour) per the Orange County (OCPW, 2013) guidelines. Based on our current subsurface exploration, the artificial fill soils beneath the site within the zones tested generally do not provide adequate infiltration potential as indicated by the very low infiltration rates. Direct infiltration to the site soils is not recommended.
G-25

11737.001
9
3.0 GEOLOGIC AND SEISMIC HAZARDS
Geologic and seismic hazards include surface fault rupture, seismic shaking, liquefaction, seismically-induced settlement, lateral spreading, seismically-induced landslides, flooding, seismically-induced flooding, seiches and tsunamis. The following sections discuss these hazards and their potential impact at the project site.
3.1 Surface Fault Rupture
Our review of available in-house literature indicates that no known active faults have been mapped across the site, and the site is not located within a designated Alquist-Priolo Earthquake Fault Zone (Bryant and Hart, 2007). Therefore, a surface fault rupture hazard evaluation is not mandated for this site.
The location of the closest active faults to the site was evaluated using the United States Geological Survey (USGS) Earthquake Hazards Program National Seismic Hazard Maps (USGS, 2008c). The closest active faults to the site are the Elsinore Fault Zone (Whittier fault), Puente Hills fault, Chino fault and the San Joaquin Hills fault, located approximately 3.6 miles, 7.7 miles, 8.2 miles and 10.5 miles from the site, respectively. The Puente Hills and San Joaquin Hills faults are both blind thrust faults that are concealed at depth, without the potential for surface fault rupture. The San Andreas fault, which is the largest active fault in California, is approximately 35 miles northeast of the site. Major regional faults with surface expression in proximity to the site are shown on Figure 4, Regional Fault Map).
The project site is located near the eastern mapped terminus of the Peralta Hills Fault, see Figure 4, Regional Fault Map. The Peralta Hills Fault has long been recognized to have thrust bedrock of the La Vida Member over stream terrace deposits of probable Pleistocene age (1.8 million to 11,700 years ago). Investigations by others have suggest there is scant evidence for Holocene activity (11,700 years to present) along the Peralta Hills fault (Converse Ward Dixon, 1979). Fault investigation by Leighton and Associates Inc. (1986) did not encounter evidence for Holocene offsets along the Peralta Hills or secondary faults associated with the system. The California Geological Survey (CGS) based on the current zoning criteria (Bryant and Hart, 2007) has not zoned the Peralta Hills Fault.
G-26

11737.001
10
3.2 Strong Ground Shaking
The site is located within a seismically active region, as is Southern California in general. The intensity of ground shaking at a given location depends primarily upon the earthquake magnitude, the distance from the source, and the site response characteristics. Peak Horizontal Ground Accelerations (PHGA) are generally used to evaluate the intensity of ground motion. The code-based Maximum Considered Earthquake (MCE) corresponds to an earthquake with a probability of exceedance of 2 percent in 50 years (i.e., 2475-year return period). Using United States Geological Survey (USGS) web-based Seismic Design Maps application (USGS, 2008a), the corresponding PHGA was calculated at 0.599g. The ground motion parameters for the MCE in terms of spectra accelerations at 5 percent damping are presented in the following table:
Table 2 – 2016 CBC Based Ground Motion Parameters (Mapped Values)
Categorization/Coefficient (1)
Site Latitude 33.831715°
Site Longitude -117.760025°
Site Class D
Mapped Spectral Response Acceleration at Short Period (0.2 sec), SS 1.569g
Mapped Spectral Response Acceleration at Long Period (1 sec), S1 0.604g
Short Period (0.2 sec)Site Coefficient, Fa 1.0
Long Period (1 sec) Site Coefficient, Fv 1.5
Adjusted Spectral Response Acceleration at Short Period (0.2 sec), SMS 1.569g
Adjusted Spectral Response Acceleration at Long Period (1 sec), SM1 0.906g
Design Spectral Response Acceleration at Short Period (0.2 sec), SDS 1.046g
Design Spectral Response Acceleration at Long Period (1 sec), SD1 0.604g
(1) Source: Ground motion values were calculated using United States Geological Survey (USGS) web-based Seismic Design Maps application (USGS, 2008a)
Accordingly, the site-adjusted geometric mean Peak Ground Acceleration (PGAm) was calculated at 0.599g (i.e., FPGA=1.0). By deaggregating the PGAm, the corresponding earthquake is an Mw 6.9 event with a distance of approximately 5.6 miles from the site (USGS, 2008b).
G-27

11737.001
11
The seismicity data are included in Appendix D, Seismicity Data. For a general view of recorded historical seismic activity see Figure 5, Historic Seismicity Map.
3.3 Liquefaction
As shown on the State of California Seismic Hazard Zones Map for the Orange Quadrangle (CGS, 1998), the project site is not located within an area that has been identified by the State of California as being potentially susceptible to liquefaction (Figure 6, Seismic Hazard Map). In addition, based on our subsurface exploration, groundwater was not encountered at the project site to the maximum depth explored of 76.5 feet bgs. Based on these considerations, the potential for liquefaction occurring at the site is low.
3.4 Earthquake-Induced Settlement
Strong ground motion during earthquakes tends to rearrange looser soils particles into a more compact arrangement, especially in granular soil deposits. The cumulative effects of soil particles rearrangement during earthquake ground shaking will result in settlement of the soil column. In general, a poorly graded granular deposit is more susceptible to settlement than a fine-grained or well-graded soil. Due to the dense nature of the existing fill at the site, the potential for seismically-induced settlement is considered negligible at the site.
3.5 Earthquake-Induced Lateral Spreading
Based on the consideration that the site is not located in an area with potential for liquefaction, lateral spreading induced by soil liquefaction is not likely to occur at the site.
3.6 Earthquake-Induced Landslides
Based on the State of California Seismic Hazard Zones Map for the Orange Quadrangle (CGS, 1998), the site is not located within an area that has been identified by the State of California as being potentially susceptible to seismically induced landslides (Figure 6, Seismic Hazard Map). Based on these considerations, the potential for seismically-induced landsliding is considered low. Proposed slopes, if any, should be engineered and constructed at a gradient of 2:1 (horizontal:vertical) or flatter.
G-28

11737.001
12
It should be noted that the project site is located within the general vicinity, approximately 0.4 mile to the west of the Santiago Landslide that occurred in Anaheim Hills in 1993 as mapped by Cotton, Shires & Associates (2005). Topographic features expressive of landsliding were observed in the foothills to the south and east of the project site (Leighton, 1987). These landslides have occurred primarily within the Vaqueros Sespe Formation Sandstone and the La Vida Member of the Puente Formation. The landslides in the Vaqueros Sespe Formation likely involve highly fractured and sheared siltstone beds. Landslides in the La Vida Member are primarily located on north facing slopes and are probably bedding plain failures where local stream incision has undercut weak bedding planes. Other landslides mapped in the hills to the south and east may be failures along faults or fault derived fractures.
Based on the location of the Santiago Landslide and consideration of the geologic and topographic conditions of the project site and immediate vicinity, the potential for landsliding associated with the 1993 Santiago Landslide to occur at the site is considered low.
3.7 Earthquake-Induced Flooding
Earthquake-induced flooding can be caused by failure of dams or other water-retaining structures as a result of earthquakes. The project site is not located within a flood impact zone as indicated on Figure 7, Dam Inundation Map. With the site located above all major water bodies in the area, the potential for seismically induced flooding to affect the site due to dam failure is negligible.
3.8 Seiches and Tsunamis
Seiches are large waves generated in enclosed bodies of water in response to ground shaking. Since no enclosed body of water is located in the vicinity of the site, the potential hazard for seiches is negligible. Tsunamis are waves generated in large bodies of water by fault displacement or major ground movement. Based on the inland location of the site and the lack of large enclosed water bodies nearby, seiche and tsunami risks are not considered hazards for the project site.
G-29

11737.001
13
3.9 Flooding Hazard
According to a Federal Emergency Management Agency (FEMA) flood insurance rate map (FEMA, 2008), the site is not located within a flood hazard zone (Figure 8, Flood Hazard Map). Flooding in the vicinity of the project site is generally isolated to the main drainage channels downstream of Villa Park Dam and Walnut Canyon Reservoir. The site is located within “Zone X”, or is an area determined to be outside of the 0.2 percent annual chance floodplain (FEMA, 2008).
G-30

11737.001
14
4.0 DESIGN RECOMMENDATIONS
Geotechnical recommendations for the proposed development are presented in the following sections and are intended to provide sufficient geotechnical information to develop the project in general accordance with 2016 CBC requirements. The following recommendations are considered minimal from a geotechnical viewpoint as there may be more restrictive requirements of the architect, structural engineer, governing agencies and the City of Anaheim.
The geotechnical consultant should review the grading plan, foundation plan and specifications as they become available to verify that the recommendations presented in this report have been incorporated into the plans prepared for the project.
4.1 Earthwork
We recommend all earthwork for the project be performed in accordance with the following recommendations, future grading plan review report(s), the City of Anaheim grading requirements. The General Earthwork and Grading Specifications provided in Appendix E may be used as guidelines to develop grading specifications. In case of conflict the following recommendations shall supersede those provided in Appendix E.
4.1.1 Site Preparation
After demolition, the project site should be cleared of any vegetation, trash and debris, which should be properly disposed of offsite. Efforts should be made to remove or reroute any existing utility lines that interfere the proposed construction. Any resulting cavities should be properly backfilled and compacted.
4.1.2 Site Grading
The project area is generally underlain by previously placed artificial fill overlying Tertiary age sedimentary bedrock. To provide a uniform support and reduce the potential for differential settlement, the existing artificial fill and bedrock materials should be removed and replaced with engineered fill to provide supports for the proposed building and other structural improvements. The removals should extend to a depth of at least 2 feet below the foundation bottom or 5 feet below pad grade, whichever is
G-31

11737.001
15
deeper. It should be noted that very hard sandstone bedrock materials are likely to be encountered in the eastern portion of the site and may be encountered in the western portion of the site within the zone recommended for removal and recompaction. Where feasible, overexcavation and recompaction should extend a minimum horizontal distance of 2 feet from the edges of the foundations (i.e., approximate 1:1 projection from the bottom edges of the foundations). Leighton should verify the vertical and lateral removal and overexcavation limits during grading as local conditions may require additional removals (i.e., encountering soft or unsuitable existing fill or other deleterious materials). Subgrade Preparation
After completion of the overexcavations and prior to fill placement, the exposed soils should be scarified to a minimum depth of 4 inches, moisture conditioned to at least 2 to 4 percentage points above optimum moisture content and compacted to at least 90 percent relative compaction based on ASTM Test Method D 1557. Any soft or unsuitable earth materials encountered at the bottom of the excavations should be removed and replaced with compacted fill.
Fill Placement
The onsite soils, less any deleterious material (construction debris) or organic matter, can be reused as fills. Oversized material greater than 6 inches in maximum dimension should not be placed in the fill. It should be noted that excavation in the sandstone bedrock is likely to produce oversized materials. Any soil to be placed as fill, whether onsite soils or imported material, should be reviewed and possibly tested by Leighton.
All fill soils should be placed in loose lifts not exceeding 8 inches, moisture-conditioned to at least 2 to 4 percentage points above optimum moisture content, and compacted to a minimum of 90 percent of the maximum dry density as determined by ASTM Test Method D 1557. The optimum lift thickness to produce a uniformly compacted fill will depend on the type and size of compaction equipment used.
G-32
11737.001
16
Any required import material should consist of non-corrosive and predominantly granular soils with an Expansion Index (EI) of 20 or less. The imported materials should contain sufficient fines (binder material) so as to result in a stable subgrade when compacted. All proposed import materials should be approved by the geotechnical engineer of record prior to being transported to the site. Shrinkage and Subsidence
The change in volume of excavated and recompacted soil varies according to soil type and location. This volume change is represented as a percentage increase (bulking) or decrease (shrinkage) in volume of fill after removal and recompaction. Field and laboratory data used in our calculations included laboratory-measured maximum dry density for the general soil type encountered at the subject site, the measured in-place densities of near surface soils encountered and our experience. We preliminarily estimate the onsite artificial fill materials requiring removal and recompaction will have a shrinkage factor of approximately 5 percent (±3 percent) during grading and bedrock materials requiring removal and recompaction will have a bulking factor of approximately 5 percent (±3 percent) during grading. The level of fill compaction, variations in the dry density of the existing soil and bedrock and other factors influence the amount of volume change. Some adjustments to earthwork volume should be anticipated during grading of the site.
4.2 Trench Backfill
Utility trenches should be backfilled with compacted fill in accordance with Sections 306-1.2 and 306-1.3 of the Standard Specifications for Public Works Construction, (“Greenbook”), 2015 Edition. Utility trenches can be backfilled with onsite material free of rubble, debris, organic and oversized material up to 3 inches in largest dimension. Prior to backfilling trenches, pipes should be bedded in and covered with either:
(1) Sand: A uniform, sand material that has a Sand Equivalent (SE) greater-than-or-equal-to 30, passing the No. 4 U.S. Standard Sieve (or as specified by the pipe manufacturer), or
G-33

11737.001
17
(2) CLSM: Controlled Low Strength Material (CLSM) conforming to Section 201-6 of the Standard Specifications for Public Works Construction, (“Greenbook”), 2015 Edition.
Pipe bedding should extend at least 4 inches below the pipeline invert and at least 12 inches over the top of the pipeline. Native and clean fill soils can be used as backfill over the pipe bedding zone, and should be placed in thin lifts, moisture conditioned above optimum, and mechanically compacted to at least 90 percent relative compaction, relative to the ASTM D 1557 laboratory maximum density.
4.3 Foundation Recommendations
Conventional shallow foundations with slab-on-grade established on engineered fill may be used to support the proposed structures. Overexcavation and recompaction of the footing subgrade soil should be performed as detailed in Section 4.1 Based on the blow counts recorded during drilling and results of the laboratory testing results, the existing fill materials below the depth of recommended overexcavation and recompaction are considered suitable to support new structures. The laboratory tests indicate that the existing fill soils exhibit a low potential for hydro-consolidation.
Conventional Shallow Foundations
The design recommendations for working stress design are as follows:
G-34
11737.001
18
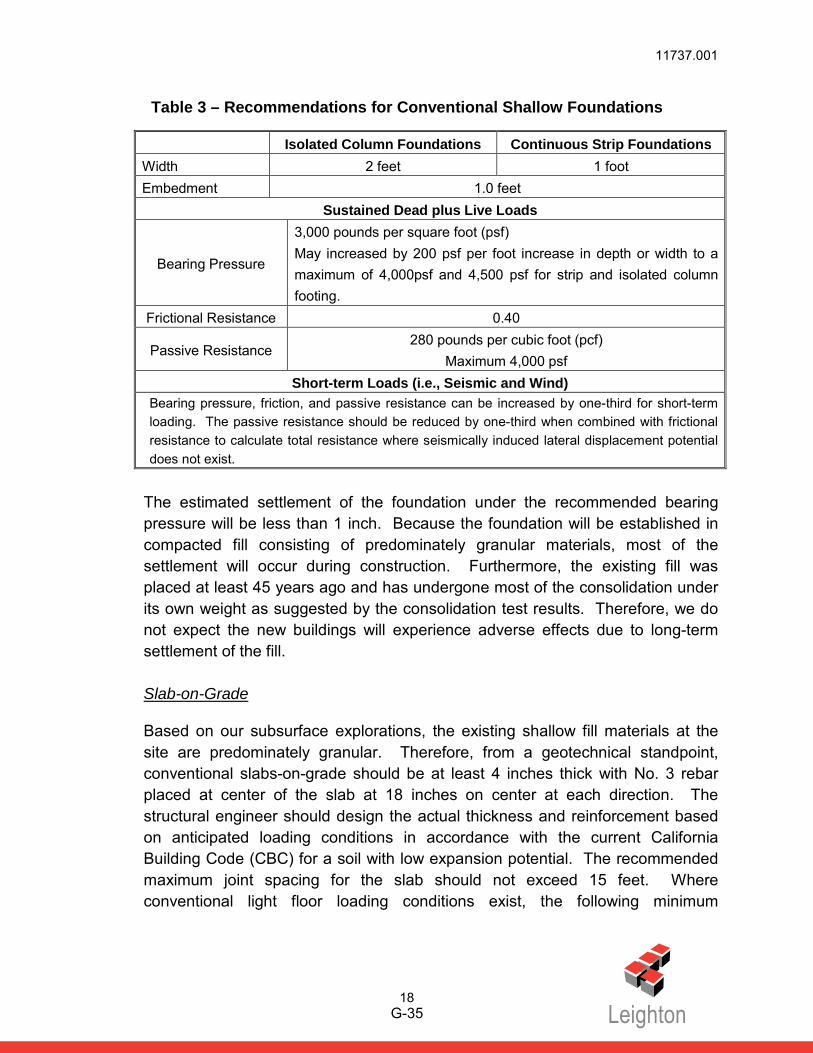
Table 3 – Recommendations for Conventional Shallow Foundations
Isolated Column Foundations Continuous Strip Foundations Width 2 feet 1 foot Embedment 1.0 feet
Sustained Dead plus Live Loads
Bearing Pressure
3,000 pounds per square foot (psf) May increased by 200 psf per foot increase in depth or width to a maximum of 4,000psf and 4,500 psf for strip and isolated column footing.
Frictional Resistance 0.40
Passive Resistance 280 pounds per cubic foot (pcf)
Maximum 4,000 psf Short-term Loads (i.e., Seismic and Wind)
Bearing pressure, friction, and passive resistance can be increased by one-third for short-term loading. The passive resistance should be reduced by one-third when combined with frictional resistance to calculate total resistance where seismically induced lateral displacement potential does not exist.
The estimated settlement of the foundation under the recommended bearing pressure will be less than 1 inch. Because the foundation will be established in compacted fill consisting of predominately granular materials, most of the settlement will occur during construction. Furthermore, the existing fill was placed at least 45 years ago and has undergone most of the consolidation under its own weight as suggested by the consolidation test results. Therefore, we do not expect the new buildings will experience adverse effects due to long-term settlement of the fill.
Slab-on-Grade
Based on our subsurface explorations, the existing shallow fill materials at the site are predominately granular. Therefore, from a geotechnical standpoint, conventional slabs-on-grade should be at least 4 inches thick with No. 3 rebar placed at center of the slab at 18 inches on center at each direction. The structural engineer should design the actual thickness and reinforcement based on anticipated loading conditions in accordance with the current California Building Code (CBC) for a soil with low expansion potential. The recommended maximum joint spacing for the slab should not exceed 15 feet. Where conventional light floor loading conditions exist, the following minimum
G-35

11737.001
19
recommendations should be used. More stringent requirements may be required by local agencies, the structural engineer, the architect, or the CBC. Laboratory testing should be conducted at finish grade to evaluate the Expansion Index (EI) of near-surface subgrade soils upon completion of grading.
The following parameters may be used to design the slab-on-grade:
Table 4 – Recommendations for Conventional Slabs-on-Grade
Parameters Recommended Values
Expansion Potential Low
Slab Thickness 4 inches (minimum)
Subgrade Reaction 200 pounds per cubic inch (pci)
Bearing Capacity 1,500 psf
Maximum joint spacing should not exceed 15 feet.
The moisture of the subgrade soils should be at 120% optimum moisture to a depth of 16 inches below the slab. The subgrade soils should be evaluated by the geotechnical engineer to verify adequate moisture conditioning has been maintained prior to pouring concrete. prior to pouring concrete.
Minor cracking of the concrete as it cures, due to drying and shrinkage is normal and should be expected. However, cracking is often aggravated by a high water/cement ratio, high concrete temperature at the time of placement, small nominal aggregate size, and rapid moisture loss due to hot, dry, and/or windy weather conditions during placement and curing. Cracking due to temperature and moisture fluctuations can also be expected. Low slump concrete can reduce the potential for shrinkage cracking. The structural engineer may consider using additional reinforcement in slabs and foundations to reduce the potential for concrete cracking.
Interior slabs-on-grade are recommended to be underlain by a synthetic sheeting to serve as a retarder to moisture vapor transmission in areas where moisture-sensitive floor covering (such as vinyl, tile, or carpet) or equipment is planned. The sheeting is recommended to be a minimum 15-mil thick Stego® Wrap installed per manufacturer’s specifications. Prior to installing the synthetic sheeting, the
G-36

11737.001
20
exposed subgrade surface should be clear of all extruding rock and gravel that could damage the sheeting. The sheeting should be evaluated for the presence of punctures or tears by the installer prior to pouring concrete. Installation of the sheeting should include proper overlap and taping of seams. Leighton does not practice in the field of moisture vapor transmission evaluation, since this is not specifically a geotechnical issue. Therefore, we recommend that a qualified person, such as the flooring subcontractor and/or structural engineer, be consulted with to evaluate the general and specific moisture vapor transmission paths and any impact on the proposed construction. That person should provide recommendations for mitigation of potential adverse impact of moisture vapor transmission on various components of the structures as deemed appropriate. These recommended design parameters are based on responsibly maintained improvements. Such improvements include properly designed planters, if adjacent to structures. In utilizing these parameters, the structural engineer should design the foundation system to the acceptable deflection criteria determined by the architect. We recommend that soil moisture around the immediate perimeter of the slab be maintained near optimum-moisture content (or above) during construction and up to occupancy of the structures. Our recommendations assume a reasonable degree of owner responsibility. Property owners should be informed and educated regarding the importance of maintaining a constant level of soil moisture. Owners should be made aware of the potential negative consequences of both excessive watering, as well as allowing expansive soils to become too dry (i.e., the soil will undergo shrinkage as it dries up, followed by swelling during the rainy season or when irrigation is resumed, resulting in potential distress to improvements and structures). Planters should not be located adjacent to foundations unless they are properly designed with drainage. Trees should also not be planted adjacent to foundations. Lawn and other landscaped areas should have proper drainage, and should not allow water to pond adjacent to structures. If the owners do not adequately maintain correct irrigation and drainage, some degree of foundation movement may occur.
G-37

11737.001
21
4.4 Surface Drainage
Positive drainage of surface water away from structures is very important. Water should not be allowed to pond adjacent to buildings. Positive drainage may be accomplished by providing drainage away from buildings a minimum of 2 percent for earthen surfaces for a lateral distance of at least five feet and further maintained by a swale or drainage path at a gradient of at least 1 percent. Where necessary, drainage paths may be shortened by the use of area drains and collector pipes. Eave gutters are recommended and should reduce water infiltration into the subgrade materials. Downspouts should be connected to appropriate outlet devices.
Irrigation of landscaping should be controlled to maintain, as much as possible, consistent moisture content sufficient to provide healthy plant growth without over watering.
4.5 Corrosion Protection Measures
For screening purposes, a representative near-surface bulk soil sample was tested for corrosivity to preliminarily evaluate corrosion potential to buried concrete (e.g., footings, retaining walls) and buries ferrous pipes. The chemical analysis test results are included in Appendix B of this report and are summarized in the table below:
Table 5 – Corrosivity Test Results
Test Parameter Test Results General Classification of Hazard
Water-Soluble Sulfate in Soil (ppm) 91 Negligible sulfate exposure to
buried concrete Water-Soluble Chloride in
Soil (ppm) 11 Non-corrosive to buried concrete
pH 7.74 Mildly alkaline Minimum Resistivity (saturated, ohm-cm) 2400 Corrosive to buried ferrous pipes
(per Caltrans)
Based on the measured water-soluble sulfate content from the tested soil sample, concrete in contact with the soil is expected to have negligible exposure to sulfate attack per ACI 318-11. The sample tested for water-soluble chloride
G-38

11737.001
22
content indicate a low potential for corrosion of steel in concrete due to the chloride content of the soil. Therefore, common Type II cement may be used for concrete construction onsite and the concrete should be designed in accordance with CBC 2016 requirements. Type V cement should be used for concrete exposed to recycled water.
The results of the resistivity test indicate that the underlying soil is corrosive to buried ferrous metals per ASTM STP 1013. A registered corrosion engineer may be consulted to provide specific mitigation measures for protection of buried metals in direct contact with onsite soils.
4.6 Retaining Walls
We recommend that retaining walls be backfilled with very low expansive soil and constructed with a backdrain in accordance with the recommendations provided on Figure 9, Retaining Wall Backfill and Subdrain Detail. Using expansive soil as retaining wall backfill will result in higher lateral earth pressures exerted on the wall. Based on these recommendations, the following parameters may be used for the design of conventional retaining walls: Active Pressure Coefficient, ka : 0.307
At-rest Pressure Coefficient, k0 : 0.441
Seismic Pressure Coefficient, kE : 0.41 (for walls taller than 12 feet)
The passive pressure coefficient for a level ground surface is as follows:
Passive Pressure Coefficient, kp : 3.537
The equivalent fluid pressure (EFP) can be calculated using a moist unit weight of 120 pounds per cubic foot (pcf) for the onsite granular soils. The seismic pressure should be applied as an invert triangle with the resultant at 0.6 times the height of the wall.
Recommendations for strip foundation presented in Section 4.3 may be used for designing the foundations for free-standing retaining walls.
G-39

11737.001
23
In addition to the above lateral forces due to retained earth, surcharge due to improvements, such as an adjacent structure or traffic loading, should be considered in the design of the retaining wall. Loads applied within a 1:1 projection from the surcharging structure on the stem of the wall should be considered in the design.
4.7 Concrete Flatwork
Exterior concrete slabs-on-grade should have a minimum thickness of 4 inches. Common Type II cement should be adequate for concrete flatwork not exposed to recycled water. Type V cement should be used for concrete exposed to recycled water. Concrete flatwork should be placed on previously compacted fill. If this material has been disturbed, the subgrade soil to a depth of 12 inches should be moisture conditioned to slightly above optimum moisture content and recompacted to minimum 90 percent relative compaction. Exterior concrete driveways, ramps, curbs, gutters, sidewalks, patio slabs, and swimming pool decks, often crack. Inclusion of joints at frequent intervals and reinforcement will help control the locations of the cracks, and thus reduce the unsightly appearance. Construction or weakened plane joints should be spaced at intervals of 8 feet or less for driveways, ramps, sidewalks, patio slabs, pool decks, curbs and gutters. If cracking occurs, repairs may be needed to mitigate the trip hazard and/or improve the appearance. Cracking of concrete is often not due to settlement or heave of soils, but often due to other factors such as the use of too high a water/cement ratio and/or inadequate steps being taken to prevent moisture loss during curing. These causes of concrete distress can be reduced by proper design of the concrete mix, and by proper placement and curing of the concrete.
4.8 Additional Geotechnical Services
The geotechnical recommendations presented in this report are based on subsurface conditions as interpreted from limited subsurface explorations, limited laboratory testing and information available at the time the report is prepared. Additional geotechnical investigation and analysis may be required based on final improvement plans. Leighton should review the site and grading plans when available and comment further on the geotechnical aspects of the project.
G-40

11737.001
24
Geotechnical observation and testing should be conducted during excavation and all phases of grading operations. Our conclusions and recommendations should be reviewed and verified by Leighton during construction and revised accordingly if geotechnical conditions encountered vary from our preliminary findings and interpretations.
Geotechnical observation and testing should be provided during the following activities:
Grading and excavation of the site;
During overexcavation and removal of unsuitable soil;
Subgrade preparation;
Compaction of all fill materials;
Utility trench backfilling and compaction;
Footing excavation and slab-on-grade preparation;
Pavement subgrade and base preparation;
Placement of asphalt concrete and/or concrete; and
When any unusual conditions are encountered.
G-41

11737.001
25
5.0 LIMITATIONS
This report was based solely on data obtained from a limited number of geotechnical exploration, and soil samples and tests. Such information is, by necessity, incomplete. The nature of many sites is such that differing soil or geologic conditions can be present within small distances and under varying climatic conditions. Changes in subsurface conditions can and do occur over time. Therefore, the findings, conclusions, and recommendations presented in this report are only valid if Leighton has the opportunity to observe subsurface conditions during grading and construction, to confirm that our preliminary data are representative for the site. Leighton should also review the construction plans and project specifications, when available, to comment on the geotechnical aspects.
This report was prepared using the degree of care and skill ordinarily exercised, under similar circumstances, by reputable geotechnical consultants practicing in this or similar localities. The findings, conclusion, and recommendations included in this report are considered preliminary and are subject to verification. We do not make any warranty, either expressed or implied.
G-42

11737.001
26
6.0 REFERENCES
American Concrete Institute, 2011, Building Code Requirements for Structural Concrete (ACI 318-11) and Commentary, 2011.
American Society of Civil Engineers (ASCE), 2013, Minimum Design Loads for Buildings and Other Structures, ASCE/SEI 7-10, Third Printing, Errata Incorporated through March 15.
Bedrossian, T.L., and Roffers, P.D., 2010, Geologic Compilation of Quaternary Surficial Deposits in Southern California, Orange County, California Geological Survey (CGS) Special Report 217, Plate 12, map scale 1:100,000.
Blake, T.F, 2015, EQSEARCH, A computer program for the estimate of Peak Horizontal Acceleration from California Historical Earthquake Catalogs, with Earthquake Catalog Data through January 29, 2015.
Bryant, W.A., and Hart, E.W., 2007, Fault Rupture Hazard Zones in California, Alquist-Priolo Earthquake Fault Zoning Act with Index to Earthquake Zones Maps, Department of Conservation, California Geological Survey, Special Publication 42, 2007 Interim Revision.
California Building Standards Commission, 2016, 2016 California Building Code (CBC), California Code of Regulations, Title 24, Part 2, Volume 2 of 2, Based on 2015 International Building Code, Effective January 1, 2017.
California Geological Survey (CGS; formerly California Division of Mines and Geology, CDMG), 1997, Seismic Hazard Zone Report for the Orange Quadrangle, Orange County, California.
, 1998, State of California Seismic Hazard Zones Map, Orange Quadrangle, Official Map, Released April 15, 1998.
, 2008, Special Publication 117a, Guidelines for Evaluating and Mitigating Seismic Hazards in California.
Cotton, Shires & Associates, 2005, The Santiago Landslide and Associated Ridge-top Graben (Sackungen): Implications for Paleoseismic Landslide Studies, Geological Society of America, Volume XI, No. 1, pp. 5-15, February, 2005.
G-43

11737.001
27
Converse Ward Dixon, 1979, Geotechnical Fault Investigation, Orange Reservoir Site 1-A, City of Orange, California, May 18, 1979,
____, 1982, the Peralta Hills Fault, A Transverse Ranges Structure in the Northern Peninsular Ranges, Southern California.
Federal Emergency Management Agency (FEMA), 2008, Map Number 06059C0159J, Effective Date September 26, 2008, Scale 1” = 1000’ web site: https://hazards.fema.gov/femaportal/wps/portal/.
Leighton and Associates, Inc., 1986, Geotechnical Investigation, Tract 12358, City of Orange, California, Volumes I and II, Project No. 6841433-04, dated August 6, 1986.
, 1987, Geotechnical Investigation for Feasibility of Development and EIR Purposes Southern California Edison Company Excess Substation Lands, Peralta Hills, City of Orange, California, dated July 9, 1987, Project No. 1861410.001
Morton D.M., and Miller, F.K., 2006, Geologic Map of the San Bernardino and Santa Ana, 30’ x 60’ Quadrangles, California, USGS Open File Report 2006-1217.
Nationwide Environmental Title Research, LLC (NETR), 2017, Historic Aerials by NETR Online, website: https://www.historicaerials.com/viewer, accessed July 2017.
Orange County Public Works (OCPW), 2013, Technical Guidance Document (TGD) for the Preparation of Conceptual/Preliminary and/or Project Water Quality Management Plans (WQMPs), dated December 20, 2013.
Public Works Standards, Inc., 2015, The “Greenbook”, Standard Specifications for Public Works Construction, 2015 Edition, published by BNI Building News.
United States Geological Survey (USGS), 1964, Orange Quadrangle, California, Orange County, 7.5 Minute Series (Topographic Series), map scale 1:24,000.
, 1964, Photorevised 1981, Orange Quadrangle, California, Orange County, 7.5 Minute Series (Topographic Series), map scale 1:24,000.
, 2008a, U.S. Seismic Design Maps, http://earthquake.usgs.gov/designmaps/us/application.php
G-44

11737.001
28
_____, 2008b, Unified Hazard Tool for Deaggregations, https://earthquake.usgs.gov/hazards/interactive/
_____, 2008c, National Seismic Hazard Maps – Fault Parameters, https://earthquake.usgs.gov/cfusion/hazfaults_2008_search/query_main.cfm
, 2015a, Interactive Fault Map, http://earthquake.usgs.gov/hazards/qfaults/map/
, 2015b, Interactive Geologic Map, http://ngmdb.usgs.gov/maps/MapView/
Yerkes, R.F., et al., 1965, Geology of the Los Angeles Basin, California An Introduction: US Geological Survey Professional Paper 420-A.57p.
G-45

Geotechnical-Engineering ReportImportant Information about This
Subsurface problems are a principal cause of construction delays, cost overruns, claims, and disputes.
While you cannot eliminate all such risks, you can manage them. The following information is provided to help.
The Geoprofessional Business Association (GBA) has prepared this advisory to help you – assumedly a client representative – interpret and apply this geotechnical-engineering report as effectively as possible. In that way, clients can benefit from a lowered exposure to the subsurface problems that, for decades, have been a principal cause of construction delays, cost overruns, claims, and disputes. If you have questions or want more information about any of the issues discussed below, contact your GBA-member geotechnical engineer. Active involvement in the Geoprofessional Business Association exposes geotechnical engineers to a wide array of risk-confrontation techniques that can be of genuine benefit for everyone involved with a construction project.
Geotechnical-Engineering Services Are Performed for Specific Purposes, Persons, and ProjectsGeotechnical engineers structure their services to meet the specific needs of their clients. A geotechnical-engineering study conducted for a given civil engineer will not likely meet the needs of a civil-works constructor or even a different civil engineer. Because each geotechnical-engineering study is unique, each geotechnical-engineering report is unique, prepared solely for the client. Those who rely on a geotechnical-engineering report prepared for a different client can be seriously misled. No one except authorized client representatives should rely on this geotechnical-engineering report without first conferring with the geotechnical engineer who prepared it. And no one – not even you – should apply this report for any purpose or project except the one originally contemplated.
Read this Report in FullCostly problems have occurred because those relying on a geotechnical-engineering report did not read it in its entirety. Do not rely on an executive summary. Do not read selected elements only. Read this report in full.
You Need to Inform Your Geotechnical Engineer about ChangeYour geotechnical engineer considered unique, project-specific factors when designing the study behind this report and developing the confirmation-dependent recommendations the report conveys. A few typical factors include: • the client’s goals, objectives, budget, schedule, and risk-management preferences; • the general nature of the structure involved, its size, configuration, and performance criteria; • the structure’s location and orientation on the site; and • other planned or existing site improvements, such as retaining walls, access roads, parking lots, and underground utilities.
Typical changes that could erode the reliability of this report include those that affect:• the site’s size or shape;• the function of the proposed structure, as when it’s changed from a parking garage to an office building, or from a light-industrial plant to a refrigerated warehouse;• the elevation, configuration, location, orientation, or weight of the proposed structure;• the composition of the design team; or• project ownership.
As a general rule, always inform your geotechnical engineer of project changes – even minor ones – and request an assessment of their impact. The geotechnical engineer who prepared this report cannot accept responsibility or liability for problems that arise because the geotechnical engineer was not informed about developments the engineer otherwise would have considered.
This Report May Not Be ReliableDo not rely on this report if your geotechnical engineer prepared it:• for a different client;• for a different project;• for a different site (that may or may not include all or a portion of the original site); or • before important events occurred at the site or adjacent to it; e.g., man-made events like construction or environmental remediation, or natural events like floods, droughts, earthquakes, or groundwater fluctuations.
Note, too, that it could be unwise to rely on a geotechnical-engineering report whose reliability may have been affected by the passage of time, because of factors like changed subsurface conditions; new or modified codes, standards, or regulations; or new techniques or tools. If your geotechnical engineer has not indicated an “apply-by” date on the report, ask what it should be, and, in general, if you are the least bit uncertain about the continued reliability of this report, contact your geotechnical engineer before applying it. A minor amount of additional testing or analysis – if any is required at all – could prevent major problems.
Most of the “Findings” Related in This Report Are Professional OpinionsBefore construction begins, geotechnical engineers explore a site’s subsurface through various sampling and testing procedures. Geotechnical engineers can observe actual subsurface conditions only at those specific locations where sampling and testing were performed. The data derived from that sampling and testing were reviewed by your geotechnical engineer, who then applied professional judgment to form opinions about subsurface conditions throughout the site. Actual sitewide-subsurface conditions may differ – maybe significantly – from those indicated in this report. Confront that risk by retaining your geotechnical engineer to serve on the design team from project start to project finish, so the individual can provide informed guidance quickly, whenever needed.
G-46

This Report’s Recommendations Are Confirmation-DependentThe recommendations included in this report – including any options or alternatives – are confirmation-dependent. In other words, they are not final, because the geotechnical engineer who developed them relied heavily on judgment and opinion to do so. Your geotechnical engineer can finalize the recommendations only after observing actual subsurface conditions revealed during construction. If through observation your geotechnical engineer confirms that the conditions assumed to exist actually do exist, the recommendations can be relied upon, assuming no other changes have occurred. The geotechnical engineer who prepared this report cannot assume responsibility or liability for confirmation-dependent recommendations if you fail to retain that engineer to perform construction observation.
This Report Could Be MisinterpretedOther design professionals’ misinterpretation of geotechnical-engineering reports has resulted in costly problems. Confront that risk by having your geotechnical engineer serve as a full-time member of the design team, to: • confer with other design-team members, • help develop specifications, • review pertinent elements of other design professionals’ plans and specifications, and • be on hand quickly whenever geotechnical-engineering guidance is needed. You should also confront the risk of constructors misinterpreting this report. Do so by retaining your geotechnical engineer to participate in prebid and preconstruction conferences and to perform construction observation.
Give Constructors a Complete Report and GuidanceSome owners and design professionals mistakenly believe they can shift unanticipated-subsurface-conditions liability to constructors by limiting the information they provide for bid preparation. To help prevent the costly, contentious problems this practice has caused, include the complete geotechnical-engineering report, along with any attachments or appendices, with your contract documents, but be certain to note conspicuously that you’ve included the material for informational purposes only. To avoid misunderstanding, you may also want to note that “informational purposes” means constructors have no right to rely on the interpretations, opinions, conclusions, or recommendations in the report, but they may rely on the factual data relative to the specific times, locations, and depths/elevations referenced. Be certain that constructors know they may learn about specific project requirements, including options selected from the report, only from the design drawings and specifications. Remind constructors that they may
perform their own studies if they want to, and be sure to allow enough time to permit them to do so. Only then might you be in a position to give constructors the information available to you, while requiring them to at least share some of the financial responsibilities stemming from unanticipated conditions. Conducting prebid and preconstruction conferences can also be valuable in this respect.
Read Responsibility Provisions CloselySome client representatives, design professionals, and constructors do not realize that geotechnical engineering is far less exact than other engineering disciplines. That lack of understanding has nurtured unrealistic expectations that have resulted in disappointments, delays, cost overruns, claims, and disputes. To confront that risk, geotechnical engineers commonly include explanatory provisions in their reports. Sometimes labeled “limitations,” many of these provisions indicate where geotechnical engineers’ responsibilities begin and end, to help others recognize their own responsibilities and risks. Read these provisions closely. Ask questions. Your geotechnical engineer should respond fully and frankly.
Geoenvironmental Concerns Are Not CoveredThe personnel, equipment, and techniques used to perform an environmental study – e.g., a “phase-one” or “phase-two” environmental site assessment – differ significantly from those used to perform a geotechnical-engineering study. For that reason, a geotechnical-engineering report does not usually relate any environmental findings, conclusions, or recommendations; e.g., about the likelihood of encountering underground storage tanks or regulated contaminants. Unanticipated subsurface environmental problems have led to project failures. If you have not yet obtained your own environmental information, ask your geotechnical consultant for risk-management guidance. As a general rule, do not rely on an environmental report prepared for a different client, site, or project, or that is more than six months old.
Obtain Professional Assistance to Deal with Moisture Infiltration and MoldWhile your geotechnical engineer may have addressed groundwater, water infiltration, or similar issues in this report, none of the engineer’s services were designed, conducted, or intended to prevent uncontrolled migration of moisture – including water vapor – from the soil through building slabs and walls and into the building interior, where it can cause mold growth and material-performance deficiencies. Accordingly, proper implementation of the geotechnical engineer’s recommendations will not of itself be sufficient to prevent moisture infiltration. Confront the risk of moisture infiltration by including building-envelope or mold specialists on the design team. Geotechnical engineers are not building-envelope or mold specialists.
Copyright 2016 by Geoprofessional Business Association (GBA). Duplication, reproduction, or copying of this document, in whole or in part, by any means whatsoever, is strictly prohibited, except with GBA’s specific written permission. Excerpting, quoting, or otherwise extracting wording from this document is permitted only with the express written permission of GBA, and only for purposes of scholarly research or book review. Only members of GBA may use this document or its wording as a complement to or as an element of a report of any
kind. Any other firm, individual, or other entity that so uses this document without being a GBA member could be committing negligent
Telephone: 301/565-2733e-mail: [email protected] www.geoprofessional.org
G-47

³0 2,000 4,000
Feet
Figure 1
Scale:
Leighton
Base Map: ESRI ArcGIS Online 2017Thematic Information: Leighton
1 " = 2,000 '
Project: 11737.001 Eng/Geol: VPI/JMP
Map Saved as V:\Drafting\11737\001\Maps\11737-001_F01_SLM_2017-10-05.mxd on 9/25/2017 2:04:27 PM
Author: Leighton Geomatics (btran)
Date: October 2017SITE LOCATION MAP
Proposed Residential Development6501-6513 E. Serrano Avenue
Anaheim, California
ApproximateSite Boundary
G-48

SCALE FEET V:\DRAFTING\11737\001\CAD\2017-09-22\11737-0001_F02_BLM_2017-10-05.DWG (10-05-17 3:58:57PM) Plotted by: btran
Proj: 11737.001
BORING LOCATION MAPProposed Residential Development
6501-6513 E. Serrano AvenueAnaheim, California
Eng/Geol: VPI/JMP
Scale: 1"=60' Date: October 2017Drafted By: BQT Checked By: BQT
Figure 2
Leighton
0 60 120
LB-6
T.D.76.5'
Af 0-76.5'
No G.W.
LB-5
T.D.15.4'
Af 0-12'
Tpsq 12-15.4'
No G.W.
LB-4
T.D.9.8'
Af 0-6.5'
Tpsq 6.5-9.8'
No G.W.
LB-3
T.D.20.5'
Af 0-16'
Tplv 16-20.5'
No G.W.
LP-2
T.D.9'
Af 0-9'
No G.W.
Perc Test
@5-9'
LB-2
T.D.76.5'
Af 0-76.5'
No G.W.
LP-1
T.D.9'
Af 0-9'
No G.W.
Perc Test
@5-9'
LB-1
T.D.10.3'
Af 0-1'
Tpsq 1-10.3'
No G.W.
APPROXIMATE LOCATION OF HOLLOW-STEM AUGER BORINGSHOWING TOTAL DEPTH (T.D.) AND DEPTH OF GEOLOGIC UNITS IN FEET BELOW GROUND SUFACE
APPROXIMATE LOCATION OF HOLLOW-STEM AUGER BORINGCONVERTED TO TEMPORARY PERCOLATION TEST WELLSHOWING TOTAL DEPTH (T.D.), DEPTH OF GEOLOGIC UNITS ANDDEPTH OF PERCOLATION TEST IN FEET BELOW GROUND SUFACE
ARTIFICIAL FILL
TERTIARY AGE PUENTE FORMATION BEDROCK - SOQUEL MEMBER
TERTIARY AGE PUENTE FORMATION BEDROCK - LA VIDA MEMBER
GROUNDWATER (G.W.) NOT ENCOUNTERED DURING DRILLING
LB-6
T.D.76.5'
Af 0-76.5'
No G.W.
AfTpsq
LEGEND
Tplv
LP-2
T.D.9'
Af 0-9'
No G.W.
Perc Test
@4-9'
APPROXIMATE
SITE BOUNDARY
G-49

Tsh
Tsh
Qya
Tss
Qvof
af
water
Qyf
Qls
Qw
Qof
Tv
Kss
Copyright:© 2013 National Geographic Society, i-cubed, Esri, HERE,DeLorme, MapmyIndia, © OpenStreetMap contributors
³0 2,000 4,000
Feet
Figure 3
Scale:
Leighton
Base Map: ESRI ArcGIS Online 2017Thematic Information: Leighton, USGS
1 " = 2,000 '
Project: 11737.001 Eng/Geol: VPI/JMP
Map Saved as V:\Drafting\11737\001\Maps\11737-001_F03_RGM_2017-10-05.mxd on 10/6/2017 9:56:57 AM
Author: Leighton Geomatics (btran)
Date: October 2017REGIONAL GEOLOGY MAP
Proposed Residential Development6501-6513 E. Serrano Avenue
Anaheim, California
ApproximateSite Location
Legendaf, ArtificialQw, Alluvial Wash DepositsQls, Landslide Deposits; may include debrisflows and older landslides
!!
!!
!Qya, Young Alluvial Valley DepositsQyf, Young Alluvial Fan DepositsQof, Old Alluvial Fan DepositsQvof, Very Old Alluvial Fan DepositsTsh, Fine-grained Tertiary age formations ofsedimentary originTss, Coarse-grained Tertiary age formations ofsedimentary originTv, Tertiary age formations of volcanic originKss, Coarse-grained Cretaceous age formationsof sedimentary origin
G-50

Elsinore Fault
Whittier - Elsinore Fault
PelicanHill fault
Peral taHil ls faultEl Modeno fault
San Jose fault
Walnut Creek fault
Central Avenue fault
Esri, HERE, DeLorme, MapmyIndia, © OpenStreetMap contributors,Source: Esri, DigitalGlobe, GeoEye, Earthstar Geographics, CNES/AirbusDS, USDA, USGS, AeroGRID, IGN, and the GIS User Community
³0 4 8
Miles
Figure 4
Scale:
Leighton
Base Map: ESRI ArcGIS Online 2017Thematic Information: Leighton, Bryant, W. A. (compiler), 2005, Digital Database of Quaternary and Younger Faultsfrom the Fault Activity Map of California, version 2.0: CGS
1 " = 4 miles
Project: 11737.001 Eng/Geol: VPI/JMP
Map Saved as V:\Drafting\11737\001\Maps\11737-001_F04_RFM_2017-10-05.mxd on 9/25/2017 2:14:58 PM
Author: Leighton Geomatics (btran)
Date: October 2017REGIONAL FAULT MAP
Proposed Residential Development6501-6513 E. Serrano Avenue
Anaheim, California
ApproximateSite Location
LegendHistoric (<200 years)Holocene (<10K years)Quaternary (<1.6M years)Pre-Quaternary (>1.6M years)
G-51

Esri, HERE, DeLorme, MapmyIndia, © OpenStreetMap contributors,Source: Esri, DigitalGlobe, GeoEye, Earthstar Geographics, CNES/AirbusDS, USDA, USGS, AeroGRID, IGN, and the GIS User Community
³0 20 40
Miles
Figure 5
Scale:
Leighton
Base Map: ESRI ArcGIS Online 2017Thematic Information: Leighton, USGS, SCEC
1 " = 20 miles
Project: 11737.001 Eng/Geol: VPI/JMP
Map Saved as V:\Drafting\11737\001\Maps\11737-001_F05_RSM_2017-10-05.mxd on 9/25/2017 2:19:18 PM
Author: Leighton Geomatics (btran)
Date: October 2017HISTORIC SEISMICITY MAP
Proposed Residential Development6501-6513 E. Serrano Avenue
Anaheim, California
ApproximateSite Location
LegendEarthquakes 1769-2014Moment Magnitude Range
!
4 - 5
!
5 - 6
!6
- 7!
7 - 8
G-52

Copyright:© 2013 National Geographic Society, i-cubed, Esri, HERE,DeLorme, MapmyIndia, © OpenStreetMap contributors
³0 2,000 4,000
Feet
Figure 6
Scale:
Leighton
Base Map: ESRI ArcGIS Online 2017Thematic Information: Leighton, CGS
1 " = 2,000 '
Project: 11737.001 Eng/Geol: VPI/JMP
Map Saved as V:\Drafting\11737\001\Maps\11737-001_F06_SHM_2017-10-05.mxd on 9/26/2017 3:48:01 PM
Author: Leighton Geomatics (btran)
Date: October 2017SEISMIC HAZARD MAP
Proposed Residential Development6501-6513 E. Serrano Avenue
Anaheim, California
ApproximateSite Location
LegendLandslide Hazard ZoneLiquefaction Susceptibility Zone
G-53
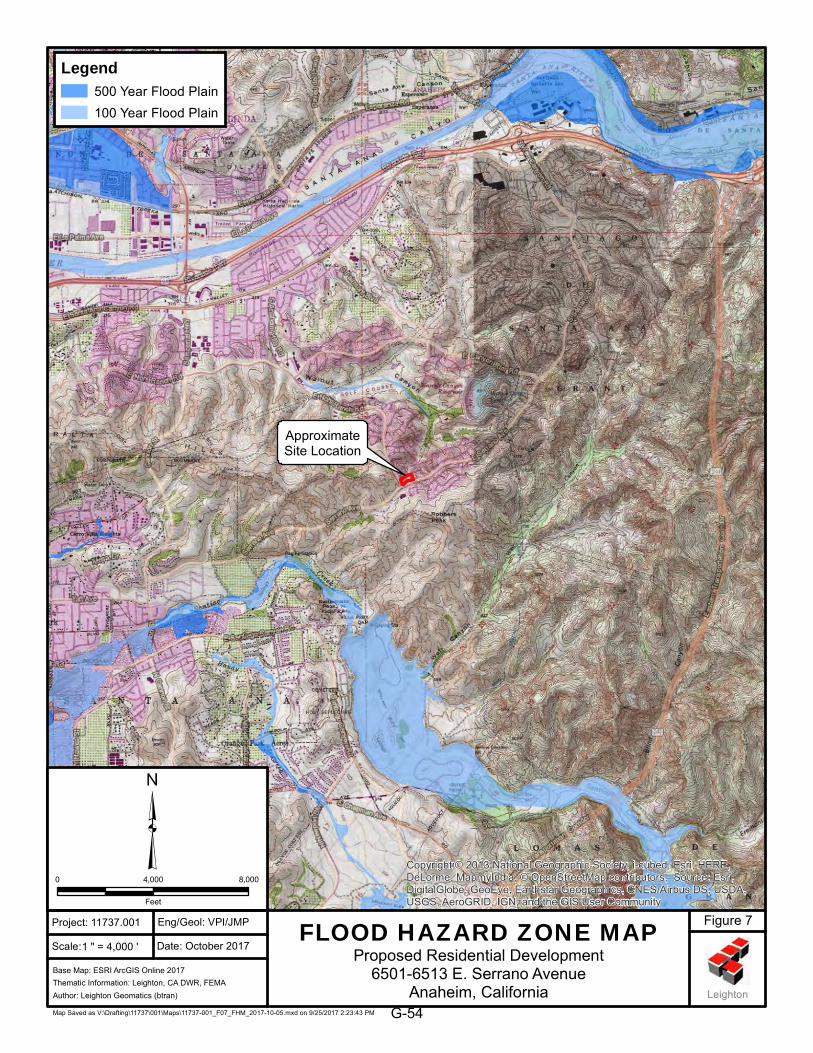
Copyright:© 2013 National Geographic Society, i-cubed, Esri, HERE,DeLorme, MapmyIndia, © OpenStreetMap contributors, Source: Esri,DigitalGlobe, GeoEye, Earthstar Geographics, CNES/Airbus DS, USDA,USGS, AeroGRID, IGN, and the GIS User Community
³0 4,000 8,000
Feet
Figure 7
Scale:
Leighton
Base Map: ESRI ArcGIS Online 2017Thematic Information: Leighton, CA DWR, FEMA
1 " = 4,000 '
Project: 11737.001 Eng/Geol: VPI/JMP
Map Saved as V:\Drafting\11737\001\Maps\11737-001_F07_FHM_2017-10-05.mxd on 9/25/2017 2:23:43 PM
Author: Leighton Geomatics (btran)
Date: October 2017FLOOD HAZARD ZONE MAP
Proposed Residential Development6501-6513 E. Serrano Avenue
Anaheim, California
ApproximateSite Location
Legend500 Year Flood Plain100 Year Flood Plain
G-54
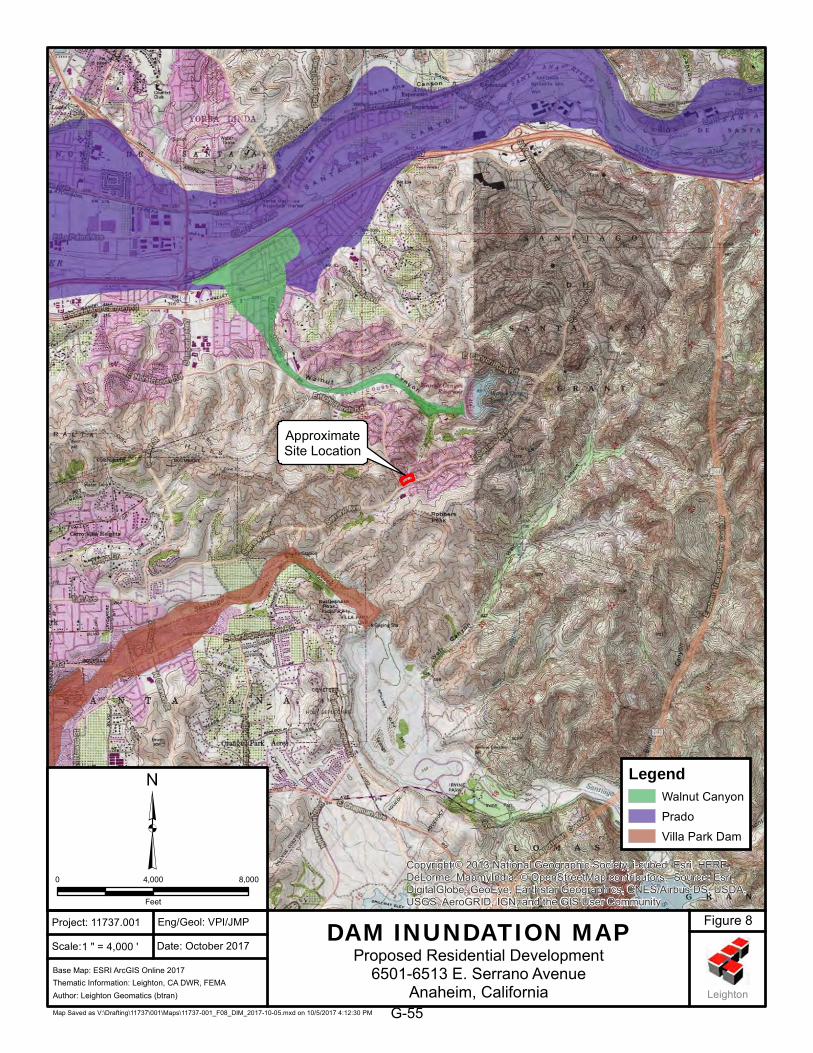
Copyright:© 2013 National Geographic Society, i-cubed, Esri, HERE,DeLorme, MapmyIndia, © OpenStreetMap contributors, Source: Esri,DigitalGlobe, GeoEye, Earthstar Geographics, CNES/Airbus DS, USDA,USGS, AeroGRID, IGN, and the GIS User Community
³0 4,000 8,000
Feet
Figure 8
Scale:
Leighton
Base Map: ESRI ArcGIS Online 2017Thematic Information: Leighton, CA DWR, FEMA
1 " = 4,000 '
Project: 11737.001 Eng/Geol: VPI/JMP
Map Saved as V:\Drafting\11737\001\Maps\11737-001_F08_DIM_2017-10-05.mxd on 10/5/2017 4:12:30 PM
Author: Leighton Geomatics (btran)
Date: October 2017DAM INUNDATION MAP
Proposed Residential Development6501-6513 E. Serrano Avenue
Anaheim, California
ApproximateSite Location
LegendWalnut CanyonPrado Villa Park Dam
G-55

G-56

APPENDIX A
FIELD EXPLORATION LOGS
G-57

DS,CR,MD,RV,
SA
3350/4"
50/4"
@surface: 5-inches asphalt concrete over 5-inches aggregatebase
Bedrock: Puente Formation - Soquel Member (Tpsq):@0.8': SANDSTONE, gray brown to orange brown, moist,
dense, fine to medium sand
@5': very dense
@10': limited recovery in sampler shoe only
Total Depth of Boring: 10.3 feet bgsNo groundwater encountered during drillingBoring backfilled with soil cuttings and patched with cold-mix
asphalt
BB-1
R1
R2
858'
BULK SAMPLECORE SAMPLEGRAB SAMPLERING SAMPLESPLIT SPOON SAMPLETUBE SAMPLE
BCGRST
JMP
Hollow Stem Auger - 140lb - Autohammer - 30" Drop
0
5
10
15
20
25
30
So
il C
lass
.
8-16-17
SOIL DESCRIPTION
Sampled By
Drilling Co.Drilling Co.Project
Project No.
Ground Elevation
Dep
th
Blo
ws
Ele
vati
on
Per
6 In
ches
Page 1 of 1
Att
itu
des
SAMPLE TYPES:
Martini Drilling Corp.
Co
nte
nt,
%
GEOTECHNICAL BORING LOG LB-1
Logged By
Date Drilled
855
850
845
840
835
830
* * * This log is a part of a report by Leighton and should not be used as a stand-alone document. * * *
JMP
Fee
t
S
(U.S
.C.S
.)
Lo
g
Typ
e o
f T
ests
Gra
ph
ic
pcf
Location 6501-6513 Serrano Avenue, Anaheim, CA
Serrano - Nohl Ranch Condos11737.001
Drilling Method8"
Fee
t
Hole Diameter
Mo
istu
re
Dry
Den
sity
N
This Soil Description applies only to a location of the exploration at thetime of sampling. Subsurface conditions may differ at other locationsand may change with time. The description is a simplification of theactual conditions encountered. Transitions between soil types may begradual.
TYPE OF TESTS:-200ALCNCOCRCU
% FINES PASSINGATTERBERG LIMITSCONSOLIDATIONCOLLAPSECORROSIONUNDRAINED TRIAXIAL
DSEIHMDPPRV
DIRECT SHEAREXPANSION INDEXHYDROMETERMAXIMUM DENSITYPOCKET PENETROMETERR VALUE
SASESGUC
SIEVE ANALYSISSAND EQUIVALENTSPECIFIC GRAVITYUNCONFINED COMPRESSIVE STRENGTH
Sam
ple
No
.
G-58

SM
CL-SC
SM
SM-ML
SA
-200
-200
101112
10710
111431
1628
50/5"
102443
101828
@surface: 5.5-inches asphalt concrete over 3-inches aggregatebase
Artificial Fill (Af):@0.7': Silty SAND, orange brown, moist, tight, fine to medium
sand, material derived from local bedrock
@5': Sandy CLAY to Clayey SAND, orange brown, moist,stiff/medium dense, some siltstone clasts
@7.5': Silty SAND with clay, orange brown, slightly moist tomoist, medium dense, fine to medium sand
@10': Silty SAND with clay, orange brown, moist, mediumdense, fine to medium sand, some siltstone/sandstone clasts
@15': Silty SAND, orange brown, moist, very dense, fine tomedium sand, some clasts of sandstone
@20': Silty SAND with clay, orange brown, moist, dense, fine tomedium sand, some siltstone clasts
@25': Silty SAND to Sandy SILT, orange brown to gray brown,medium dense/very stiff, fine to medium sand, somesandstone clasts
104
117
119
21
13
13
BB-1
R1
S1
R2
R3
R4
R5
859'
BULK SAMPLECORE SAMPLEGRAB SAMPLERING SAMPLESPLIT SPOON SAMPLETUBE SAMPLE
BCGRST
JMP
Hollow Stem Auger - 140lb - Autohammer - 30" Drop
0
5
10
15
20
25
30
So
il C
lass
.
8-16-17
SOIL DESCRIPTION
Sampled By
Drilling Co.Drilling Co.Project
Project No.
Ground Elevation
Dep
th
Blo
ws
Ele
vati
on
Per
6 In
ches
Page 1 of 3
Att
itu
des
SAMPLE TYPES:
Martini Drilling Corp.
Co
nte
nt,
%
GEOTECHNICAL BORING LOG LB-2
Logged By
Date Drilled
855
850
845
840
835
830
* * * This log is a part of a report by Leighton and should not be used as a stand-alone document. * * *
JMP
Fee
t
S
(U.S
.C.S
.)
Lo
g
Typ
e o
f T
ests
Gra
ph
ic
pcf
Location 6501-6513 Serrano Avenue, Anaheim, CA
Serrano - Nohl Ranch Condos11737.001
Drilling Method8"
Fee
t
Hole Diameter
Mo
istu
re
Dry
Den
sity
N
This Soil Description applies only to a location of the exploration at thetime of sampling. Subsurface conditions may differ at other locationsand may change with time. The description is a simplification of theactual conditions encountered. Transitions between soil types may begradual.
TYPE OF TESTS:-200ALCNCOCRCU
% FINES PASSINGATTERBERG LIMITSCONSOLIDATIONCOLLAPSECORROSIONUNDRAINED TRIAXIAL
DSEIHMDPPRV
DIRECT SHEAREXPANSION INDEXHYDROMETERMAXIMUM DENSITYPOCKET PENETROMETERR VALUE
SASESGUC
SIEVE ANALYSISSAND EQUIVALENTSPECIFIC GRAVITYUNCONFINED COMPRESSIVE STRENGTH
Sam
ple
No
.
G-59

SM
SM-SC
SC
CL
SC
-200
-200, CN
AL
237
101829
7711
154045
457
72030
@30': Silty SAND with clay, orange brown to gray brown, moist,stiff, some siltstone/sandstone clasts
@35': Silty SAND to Clayey SAND, orange brown, moist,medium dense, fine to medium sand, somesiltstone/sandstone clasts
@40': same as above
@45': Clayey SAND with gravel, orange brown, very moist,hard/very dense, fine to medium sand
@50': Sandy Lean CLAY with silt, orange brown to gray brown,moist to very moist, medium stiff, some siltstone/sandstoneclasts
@55': Clayey SAND to Sandy CLAY, orange brown to graybrown, moist to very moist, dense/very stiff, fine to mediumsand, some siltstone/sandstone clasts
109
99
16
24
S2
R6
S3
R7
S4
R8
859'
BULK SAMPLECORE SAMPLEGRAB SAMPLERING SAMPLESPLIT SPOON SAMPLETUBE SAMPLE
BCGRST
JMP
Hollow Stem Auger - 140lb - Autohammer - 30" Drop
30
35
40
45
50
55
60
So
il C
lass
.
8-16-17
SOIL DESCRIPTION
Sampled By
Drilling Co.Drilling Co.Project
Project No.
Ground Elevation
Dep
th
Blo
ws
Ele
vati
on
Per
6 In
ches
Page 2 of 3
Att
itu
des
SAMPLE TYPES:
Martini Drilling Corp.
Co
nte
nt,
%
GEOTECHNICAL BORING LOG LB-2
Logged By
Date Drilled
825
820
815
810
805
800
* * * This log is a part of a report by Leighton and should not be used as a stand-alone document. * * *
JMP
Fee
t
S
(U.S
.C.S
.)
Lo
g
Typ
e o
f T
ests
Gra
ph
ic
pcf
Location 6501-6513 Serrano Avenue, Anaheim, CA
Serrano - Nohl Ranch Condos11737.001
Drilling Method8"
Fee
t
Hole Diameter
Mo
istu
re
Dry
Den
sity
N
This Soil Description applies only to a location of the exploration at thetime of sampling. Subsurface conditions may differ at other locationsand may change with time. The description is a simplification of theactual conditions encountered. Transitions between soil types may begradual.
TYPE OF TESTS:-200ALCNCOCRCU
% FINES PASSINGATTERBERG LIMITSCONSOLIDATIONCOLLAPSECORROSIONUNDRAINED TRIAXIAL
DSEIHMDPPRV
DIRECT SHEAREXPANSION INDEXHYDROMETERMAXIMUM DENSITYPOCKET PENETROMETERR VALUE
SASESGUC
SIEVE ANALYSISSAND EQUIVALENTSPECIFIC GRAVITYUNCONFINED COMPRESSIVE STRENGTH
Sam
ple
No
.
G-60

SC
SM
CL
-200
-200
679
71637
4912
82434
@60': Clayey SAND, orange brown, moist to very moist,medium dense, some siltstone/sandstone clasts
@65': Silty SAND, gray to bluish green, moist to very moist, verydense, fine to medium sand, abundant siltstone/sandstoneclasts
@70': Sandy Lean CLAY, gray to orange brown, moist to verymoist, very stiff, with abundant siltstone/sandstone clasts
@75': Silty CLAY, gray brown to bluish green, moist to verymoist, hard, with siltstone clasts
Total Depth of Boring: 76.5 feet bgsNo groundwater encountered during drillingBoring backfilled with soil cuttings and patched with cold-mix
asphalt
96
97
28
27
S5
R9
S6
R10
859'
BULK SAMPLECORE SAMPLEGRAB SAMPLERING SAMPLESPLIT SPOON SAMPLETUBE SAMPLE
BCGRST
JMP
Hollow Stem Auger - 140lb - Autohammer - 30" Drop
60
65
70
75
80
85
90
So
il C
lass
.
8-16-17
SOIL DESCRIPTION
Sampled By
Drilling Co.Drilling Co.Project
Project No.
Ground Elevation
Dep
th
Blo
ws
Ele
vati
on
Per
6 In
ches
Page 3 of 3
Att
itu
des
SAMPLE TYPES:
Martini Drilling Corp.
Co
nte
nt,
%
GEOTECHNICAL BORING LOG LB-2
Logged By
Date Drilled
795
790
785
780
775
770
* * * This log is a part of a report by Leighton and should not be used as a stand-alone document. * * *
JMP
Fee
t
S
(U.S
.C.S
.)
Lo
g
Typ
e o
f T
ests
Gra
ph
ic
pcf
Location 6501-6513 Serrano Avenue, Anaheim, CA
Serrano - Nohl Ranch Condos11737.001
Drilling Method8"
Fee
t
Hole Diameter
Mo
istu
re
Dry
Den
sity
N
This Soil Description applies only to a location of the exploration at thetime of sampling. Subsurface conditions may differ at other locationsand may change with time. The description is a simplification of theactual conditions encountered. Transitions between soil types may begradual.
TYPE OF TESTS:-200ALCNCOCRCU
% FINES PASSINGATTERBERG LIMITSCONSOLIDATIONCOLLAPSECORROSIONUNDRAINED TRIAXIAL
DSEIHMDPPRV
DIRECT SHEAREXPANSION INDEXHYDROMETERMAXIMUM DENSITYPOCKET PENETROMETERR VALUE
SASESGUC
SIEVE ANALYSISSAND EQUIVALENTSPECIFIC GRAVITYUNCONFINED COMPRESSIVE STRENGTH
Sam
ple
No
.
G-61

SM
CL-SC
SM
CL
SA
52145
8910
162127
835
50/2"
50/5"
@surface: 3.5-inches asphalt concrete over 3-inches aggregatebase
Artificial Fill (Af):@0.6': Silty SAND with clay, orange brown to gray brown, moist,
tight, fine to medium sand
@5': Sandy CLAY to Clayey SAND, orange brown to brown,moist, hard/dense, fine to medium sand
@7.5': Silty SAND, orange brown to gray, moist, medium dense,fine to medium sand, some siltstone/sandstone clasts
@10': Silty SAND, orange brown to blue gray, moist, dense, fineto medium sand, some siltstone/sandstone clasts
@15': Sandy CLAY, orange brown, moist, stiff, fine sand, somesiltstone/sandstone clasts
Bedrock: Puente Formation - La Vida Member (Tplv):@16': SILTSTONE, gray to orange brown, slightly moist, hard
@20': SILTSTONE, orange brown to gray, slightly moist, hard,oxidized
Total Depth of Boring: 20.5 feet bgsNo groundwater encountered during drillingBoring backfilled with soil cuttings and patched with cold-mix
asphalt
BB1
R1
S1
R2
R3
R4
859'
BULK SAMPLECORE SAMPLEGRAB SAMPLERING SAMPLESPLIT SPOON SAMPLETUBE SAMPLE
BCGRST
JMP
Hollow Stem Auger - 140lb - Autohammer - 30" Drop
0
5
10
15
20
25
30
So
il C
lass
.
8-16-17
SOIL DESCRIPTION
Sampled By
Drilling Co.Drilling Co.Project
Project No.
Ground Elevation
Dep
th
Blo
ws
Ele
vati
on
Per
6 In
ches
Page 1 of 1
Att
itu
des
SAMPLE TYPES:
Martini Drilling Corp.
Co
nte
nt,
%
GEOTECHNICAL BORING LOG LB-3
Logged By
Date Drilled
855
850
845
840
835
830
* * * This log is a part of a report by Leighton and should not be used as a stand-alone document. * * *
JMP
Fee
t
S
(U.S
.C.S
.)
Lo
g
Typ
e o
f T
ests
Gra
ph
ic
pcf
Location 6501-6513 Serrano Avenue, Anaheim, CA
Serrano - Nohl Ranch Condos11737.001
Drilling Method8"
Fee
t
Hole Diameter
Mo
istu
re
Dry
Den
sity
N
This Soil Description applies only to a location of the exploration at thetime of sampling. Subsurface conditions may differ at other locationsand may change with time. The description is a simplification of theactual conditions encountered. Transitions between soil types may begradual.
TYPE OF TESTS:-200ALCNCOCRCU
% FINES PASSINGATTERBERG LIMITSCONSOLIDATIONCOLLAPSECORROSIONUNDRAINED TRIAXIAL
DSEIHMDPPRV
DIRECT SHEAREXPANSION INDEXHYDROMETERMAXIMUM DENSITYPOCKET PENETROMETERR VALUE
SASESGUC
SIEVE ANALYSISSAND EQUIVALENTSPECIFIC GRAVITYUNCONFINED COMPRESSIVE STRENGTH
Sam
ple
No
.
G-62

SM SA111520
50/5"
3750/4"
@surface: 3.5-inches asphalt concrete over 3-inches aggregatebase
Artificial Fill (Af):@0.6': Silty SAND, orange brown, slightly moist, tight, fine to
medium sand, few gravels
@5': Silty SAND, orange brown to gray brown, slightly moist,medium dense, fine to medium sand, some sandstone clasts
Bedrock: Puente Formation - Soquel Member (Tpsq):@6.5': harder drilling, approximate bedrock contact assumed
@8': no recovery, hard
@9': SANDSTONE, light yellow brown, slightly moist, hard, fineto medium sand
Total Depth of Boring: 9.8 feet bgsNo groundwater encountered during drillingBoring backfilled with soil cuttings and patched with cold-mix
asphalt
R1
R2
S1
860'
BULK SAMPLECORE SAMPLEGRAB SAMPLERING SAMPLESPLIT SPOON SAMPLETUBE SAMPLE
BCGRST
JMP
Hollow Stem Auger - 140lb - Autohammer - 30" Drop
0
5
10
15
20
25
30
So
il C
lass
.
8-16-17
SOIL DESCRIPTION
Sampled By
Drilling Co.Drilling Co.Project
Project No.
Ground Elevation
Dep
th
Blo
ws
Ele
vati
on
Per
6 In
ches
Page 1 of 1
Att
itu
des
SAMPLE TYPES:
Martini Drilling Corp.
Co
nte
nt,
%
GEOTECHNICAL BORING LOG LB-4
Logged By
Date Drilled
860
855
850
845
840
835
830
* * * This log is a part of a report by Leighton and should not be used as a stand-alone document. * * *
JMP
Fee
t
S
(U.S
.C.S
.)
Lo
g
Typ
e o
f T
ests
Gra
ph
ic
pcf
Location 6501-6513 Serrano Avenue, Anaheim, CA
Serrano - Nohl Ranch Condos11737.001
Drilling Method8"
Fee
t
Hole Diameter
Mo
istu
re
Dry
Den
sity
N
This Soil Description applies only to a location of the exploration at thetime of sampling. Subsurface conditions may differ at other locationsand may change with time. The description is a simplification of theactual conditions encountered. Transitions between soil types may begradual.
TYPE OF TESTS:-200ALCNCOCRCU
% FINES PASSINGATTERBERG LIMITSCONSOLIDATIONCOLLAPSECORROSIONUNDRAINED TRIAXIAL
DSEIHMDPPRV
DIRECT SHEAREXPANSION INDEXHYDROMETERMAXIMUM DENSITYPOCKET PENETROMETERR VALUE
SASESGUC
SIEVE ANALYSISSAND EQUIVALENTSPECIFIC GRAVITYUNCONFINED COMPRESSIVE STRENGTH
Sam
ple
No
.
G-63

SMSA
111317
174041
50/5"
@surface: 3.5-inches asphalt concrete over 3-inches aggregatebase
Artificial Fill (Af):@0.6': Silty SAND, medium brown to orange brown, moist, tight,
fine to medium sand, few gravels
@5': Silty SAND, medium brown to orange brown, moist,medium dense, fine to medium sand, some finesiltstone/sandstone clasts
@10': dense
Bedrock: Puente Formation - Soquel Member (Tpsq):@12': harder drilling, approximate bedrock contact assumed
@15': SANDSTONE, light gray with orange oxidation, moist,hard, fine to medium sand
Total Depth of Boring: 15.4 feet bgsNo groundwater encountered during drillingBoring backfilled with soil cuttings and patched with cold-mix
asphalt
BB1
R1
R2
R3
861'
BULK SAMPLECORE SAMPLEGRAB SAMPLERING SAMPLESPLIT SPOON SAMPLETUBE SAMPLE
BCGRST
JMP
Hollow Stem Auger - 140lb - Autohammer - 30" Drop
0
5
10
15
20
25
30
So
il C
lass
.
8-16-17
SOIL DESCRIPTION
Sampled By
Drilling Co.Drilling Co.Project
Project No.
Ground Elevation
Dep
th
Blo
ws
Ele
vati
on
Per
6 In
ches
Page 1 of 1
Att
itu
des
SAMPLE TYPES:
Martini Drilling Corp.
Co
nte
nt,
%
GEOTECHNICAL BORING LOG LB-5
Logged By
Date Drilled
860
855
850
845
840
835
* * * This log is a part of a report by Leighton and should not be used as a stand-alone document. * * *
JMP
Fee
t
S
(U.S
.C.S
.)
Lo
g
Typ
e o
f T
ests
Gra
ph
ic
pcf
Location 6501-6513 Serrano Avenue, Anaheim, CA
Serrano - Nohl Ranch Condos11737.001
Drilling Method8"
Fee
t
Hole Diameter
Mo
istu
re
Dry
Den
sity
N
This Soil Description applies only to a location of the exploration at thetime of sampling. Subsurface conditions may differ at other locationsand may change with time. The description is a simplification of theactual conditions encountered. Transitions between soil types may begradual.
TYPE OF TESTS:-200ALCNCOCRCU
% FINES PASSINGATTERBERG LIMITSCONSOLIDATIONCOLLAPSECORROSIONUNDRAINED TRIAXIAL
DSEIHMDPPRV
DIRECT SHEAREXPANSION INDEXHYDROMETERMAXIMUM DENSITYPOCKET PENETROMETERR VALUE
SASESGUC
SIEVE ANALYSISSAND EQUIVALENTSPECIFIC GRAVITYUNCONFINED COMPRESSIVE STRENGTH
Sam
ple
No
.
G-64

SM
SC-CL
SM
1427
50/5"
102148
91521
831
50/5"
2050/6"
@surface: 2.5-inches asphalt concrete over 3.5-inchesaggregate base
Artificial Fill (Af):@0.6': Silty SAND, medium orange brown, moist, tight, fine to
medium sand
@5': Silty SAND, orange brown, moist, very dense, fine tomedium sand, some sandstone clasts
@10': some large siltstone clasts
@15': Clayey SAND to Sandy CLAY, orange brown to gray,moist, medium dense/very stiff, some siltstone clasts
@20': Silty SAND, orange brown, moist, very dense, fine tomedium sand, some sandstone clasts
119
95
116
10
23
12
BB1
R1
R2
R3
R4
R5
860'
BULK SAMPLECORE SAMPLEGRAB SAMPLERING SAMPLESPLIT SPOON SAMPLETUBE SAMPLE
BCGRST
JMP
Hollow Stem Auger - 140lb - Autohammer - 30" Drop
0
5
10
15
20
25
30
So
il C
lass
.
8-16-17
SOIL DESCRIPTION
Sampled By
Drilling Co.Drilling Co.Project
Project No.
Ground Elevation
Dep
th
Blo
ws
Ele
vati
on
Per
6 In
ches
Page 1 of 3
Att
itu
des
SAMPLE TYPES:
Martini Drilling Corp.
Co
nte
nt,
%
GEOTECHNICAL BORING LOG LB-6
Logged By
Date Drilled
860
855
850
845
840
835
830
* * * This log is a part of a report by Leighton and should not be used as a stand-alone document. * * *
JMP
Fee
t
S
(U.S
.C.S
.)
Lo
g
Typ
e o
f T
ests
Gra
ph
ic
pcf
Location 6501-6513 Serrano Avenue, Anaheim, CA
Serrano - Nohl Ranch Condos11737.001
Drilling Method8"
Fee
t
Hole Diameter
Mo
istu
re
Dry
Den
sity
N
This Soil Description applies only to a location of the exploration at thetime of sampling. Subsurface conditions may differ at other locationsand may change with time. The description is a simplification of theactual conditions encountered. Transitions between soil types may begradual.
TYPE OF TESTS:-200ALCNCOCRCU
% FINES PASSINGATTERBERG LIMITSCONSOLIDATIONCOLLAPSECORROSIONUNDRAINED TRIAXIAL
DSEIHMDPPRV
DIRECT SHEAREXPANSION INDEXHYDROMETERMAXIMUM DENSITYPOCKET PENETROMETERR VALUE
SASESGUC
SIEVE ANALYSISSAND EQUIVALENTSPECIFIC GRAVITYUNCONFINED COMPRESSIVE STRENGTH
Sam
ple
No
.
G-65

SM-SC2242
50/5"
152849
383842
721
50/4"
50/4"
2550/6"
@30': Silty SAND to Clayey SAND, orange brown, moist, verydense, fine to medium sand, some fine siltstone/sandstoneclasts
@35': dense, abundant siltstone
@40': dense, abundant siltstone/sandstone clasts
@45': orange brown to blue gray, dense, abundantsiltstone/sandstone clasts
@50': no recovery, possible cobble at head of auger
@55': no recovery, possible cobble at head of auger
117
116
14
14
R6
R7
R8
R9
R10
R11
860'
BULK SAMPLECORE SAMPLEGRAB SAMPLERING SAMPLESPLIT SPOON SAMPLETUBE SAMPLE
BCGRST
JMP
Hollow Stem Auger - 140lb - Autohammer - 30" Drop
30
35
40
45
50
55
60
So
il C
lass
.
8-16-17
SOIL DESCRIPTION
Sampled By
Drilling Co.Drilling Co.Project
Project No.
Ground Elevation
Dep
th
Blo
ws
Ele
vati
on
Per
6 In
ches
Page 2 of 3
Att
itu
des
SAMPLE TYPES:
Martini Drilling Corp.
Co
nte
nt,
%
GEOTECHNICAL BORING LOG LB-6
Logged By
Date Drilled
830
825
820
815
810
805
800
* * * This log is a part of a report by Leighton and should not be used as a stand-alone document. * * *
JMP
Fee
t
S
(U.S
.C.S
.)
Lo
g
Typ
e o
f T
ests
Gra
ph
ic
pcf
Location 6501-6513 Serrano Avenue, Anaheim, CA
Serrano - Nohl Ranch Condos11737.001
Drilling Method8"
Fee
t
Hole Diameter
Mo
istu
re
Dry
Den
sity
N
This Soil Description applies only to a location of the exploration at thetime of sampling. Subsurface conditions may differ at other locationsand may change with time. The description is a simplification of theactual conditions encountered. Transitions between soil types may begradual.
TYPE OF TESTS:-200ALCNCOCRCU
% FINES PASSINGATTERBERG LIMITSCONSOLIDATIONCOLLAPSECORROSIONUNDRAINED TRIAXIAL
DSEIHMDPPRV
DIRECT SHEAREXPANSION INDEXHYDROMETERMAXIMUM DENSITYPOCKET PENETROMETERR VALUE
SASESGUC
SIEVE ANALYSISSAND EQUIVALENTSPECIFIC GRAVITYUNCONFINED COMPRESSIVE STRENGTH
Sam
ple
No
.
G-66

SM
CL
SM CN, AL
393842
6818
1228
50/4"
151920
@60': limited recovery in sampler shoe limited to mechanicallybroken cobble fragments
@65': Silty SAND, orange brown to gray brown, moist, mediumdense, fine to medium sand, some siltstone/sandstone clasts
@70': Silty CLAY, blue gray, moist, hard, large siltstone clasts
@75': Silty SAND, blue gray, very moist to wet, medium dense,fine to medium sand, some sandstone clasts
Total Depth of Boring: 76.5 feet bgsNo groundwater encountered during drillingBoring backfilled with soil cuttings and patched with cold-mix
asphalt
102 22
S1
S2
R12
R13
860'
BULK SAMPLECORE SAMPLEGRAB SAMPLERING SAMPLESPLIT SPOON SAMPLETUBE SAMPLE
BCGRST
JMP
Hollow Stem Auger - 140lb - Autohammer - 30" Drop
60
65
70
75
80
85
90
So
il C
lass
.
8-16-17
SOIL DESCRIPTION
Sampled By
Drilling Co.Drilling Co.Project
Project No.
Ground Elevation
Dep
th
Blo
ws
Ele
vati
on
Per
6 In
ches
Page 3 of 3
Att
itu
des
SAMPLE TYPES:
Martini Drilling Corp.
Co
nte
nt,
%
GEOTECHNICAL BORING LOG LB-6
Logged By
Date Drilled
800
795
790
785
780
775
770
* * * This log is a part of a report by Leighton and should not be used as a stand-alone document. * * *
JMP
Fee
t
S
(U.S
.C.S
.)
Lo
g
Typ
e o
f T
ests
Gra
ph
ic
pcf
Location 6501-6513 Serrano Avenue, Anaheim, CA
Serrano - Nohl Ranch Condos11737.001
Drilling Method8"
Fee
t
Hole Diameter
Mo
istu
re
Dry
Den
sity
N
This Soil Description applies only to a location of the exploration at thetime of sampling. Subsurface conditions may differ at other locationsand may change with time. The description is a simplification of theactual conditions encountered. Transitions between soil types may begradual.
TYPE OF TESTS:-200ALCNCOCRCU
% FINES PASSINGATTERBERG LIMITSCONSOLIDATIONCOLLAPSECORROSIONUNDRAINED TRIAXIAL
DSEIHMDPPRV
DIRECT SHEAREXPANSION INDEXHYDROMETERMAXIMUM DENSITYPOCKET PENETROMETERR VALUE
SASESGUC
SIEVE ANALYSISSAND EQUIVALENTSPECIFIC GRAVITYUNCONFINED COMPRESSIVE STRENGTH
Sam
ple
No
.
G-67

SM
CL-SC
SM
@surface: 5.5-inches asphalt concrete over 3-inches aggregatebase
Artificial Fill (Af):@0.7': Silty SAND, orange brown, moist, tight, fine to medium
sand, material derived from local bedrock
@5': Sandy CLAY to Clayey SAND, orange brown, moist, somesiltstone fragments
@7.5': Silty SAND with clay, orange brown, slightly moist tomoist, fine to medium sand
No sampling performed, lithology inferred from adjacent boringLB-2
Total Depth of Boring: 9 feet bgsNo groundwater encountered during drillingTemporary percolation well installed:2-inch solid PVC @ 0-4 feet bgs2-inch slotted PVC (0.020") @ 4-9 feet bgs#3 Monterey Sand @ 3-9 feet bgsWell casing removed upon completion of testing and boring
backfilled with soil cuttings and patched with cold-mix asphalt
859'
BULK SAMPLECORE SAMPLEGRAB SAMPLERING SAMPLESPLIT SPOON SAMPLETUBE SAMPLE
BCGRST
JMP
Hollow Stem Auger - 140lb - Autohammer - 30" Drop
0
5
10
15
20
25
30
So
il C
lass
.
8-16-17
SOIL DESCRIPTION
Sampled By
Drilling Co.Drilling Co.Project
Project No.
Ground Elevation
Dep
th
Blo
ws
Ele
vati
on
Per
6 In
ches
Page 1 of 1
Att
itu
des
SAMPLE TYPES:
Martini Drilling Corp.
Co
nte
nt,
%
GEOTECHNICAL BORING LOG LP-1
Logged By
Date Drilled
855
850
845
840
835
830
* * * This log is a part of a report by Leighton and should not be used as a stand-alone document. * * *
JMP
Fee
t
S
(U.S
.C.S
.)
Lo
g
Typ
e o
f T
ests
Gra
ph
ic
pcf
Location 6501-6513 Serrano Avenue, Anaheim, CA
Serrano - Nohl Ranch Condos11737.001
Drilling Method8"
Fee
t
Hole Diameter
Mo
istu
re
Dry
Den
sity
N
This Soil Description applies only to a location of the exploration at thetime of sampling. Subsurface conditions may differ at other locationsand may change with time. The description is a simplification of theactual conditions encountered. Transitions between soil types may begradual.
TYPE OF TESTS:-200ALCNCOCRCU
% FINES PASSINGATTERBERG LIMITSCONSOLIDATIONCOLLAPSECORROSIONUNDRAINED TRIAXIAL
DSEIHMDPPRV
DIRECT SHEAREXPANSION INDEXHYDROMETERMAXIMUM DENSITYPOCKET PENETROMETERR VALUE
SASESGUC
SIEVE ANALYSISSAND EQUIVALENTSPECIFIC GRAVITYUNCONFINED COMPRESSIVE STRENGTH
Sam
ple
No
.
G-68

SM
CL-SC
SM
@surface: 3.5-inches asphalt concrete over 3-inches aggregatebase
Artificial Fill (Af):@0.6': Silty SAND with clay, orange brown to gray brown, moist,
tight, fine to medium sand
@5': Sandy CLAY to Clayey SAND, orange brown to brown,moist, fine to medium sand
@7.5': Silty SAND, orange brown to gray, moist, fine to mediumsand, some siltstone/sandstone clasts
No sampling performed, lithology inferred from adjacent boringLB-3
Total Depth of Boring: 9 feet bgsNo groundwater encountered during drillingTemporary percolation well installed:2-inch solid PVC @ 0-4 feet bgs2-inch slotted PVC (0.020") @ 4-9 feet bgs#3 Monterey Sand @ 3-9 feet bgsWell casing removed upon completion of testing and boring
backfilled with soil cuttings and patched with cold-mix asphalt
859'
BULK SAMPLECORE SAMPLEGRAB SAMPLERING SAMPLESPLIT SPOON SAMPLETUBE SAMPLE
BCGRST
JMP
Hollow Stem Auger - 140lb - Autohammer - 30" Drop
0
5
10
15
20
25
30
So
il C
lass
.
8-16-17
SOIL DESCRIPTION
Sampled By
Drilling Co.Drilling Co.Project
Project No.
Ground Elevation
Dep
th
Blo
ws
Ele
vati
on
Per
6 In
ches
Page 1 of 1
Att
itu
des
SAMPLE TYPES:
Martini Drilling Corp.
Co
nte
nt,
%
GEOTECHNICAL BORING LOG LP-2
Logged By
Date Drilled
855
850
845
840
835
830
* * * This log is a part of a report by Leighton and should not be used as a stand-alone document. * * *
JMP
Fee
t
S
(U.S
.C.S
.)
Lo
g
Typ
e o
f T
ests
Gra
ph
ic
pcf
Location 6501-6513 Serrano Avenue, Anaheim, CA
Serrano - Nohl Ranch Condos11737.001
Drilling Method8"
Fee
t
Hole Diameter
Mo
istu
re
Dry
Den
sity
N
This Soil Description applies only to a location of the exploration at thetime of sampling. Subsurface conditions may differ at other locationsand may change with time. The description is a simplification of theactual conditions encountered. Transitions between soil types may begradual.
TYPE OF TESTS:-200ALCNCOCRCU
% FINES PASSINGATTERBERG LIMITSCONSOLIDATIONCOLLAPSECORROSIONUNDRAINED TRIAXIAL
DSEIHMDPPRV
DIRECT SHEAREXPANSION INDEXHYDROMETERMAXIMUM DENSITYPOCKET PENETROMETERR VALUE
SASESGUC
SIEVE ANALYSISSAND EQUIVALENTSPECIFIC GRAVITYUNCONFINED COMPRESSIVE STRENGTH
Sam
ple
No
.
G-69

APPENDIX B
LABORATORY TEST RESULTS
G-70

U.S. STANDARD SIEVE OPENING U.S. STANDARD SIEVE NUMBER
GRAVEL FINESFINE CLAY COARSE COARSE MEDIUM
11737.001
SANDSILT FINE
HYDROMETER 3.0" 1 1/2" 3/4" 3/8" #4 #8 #16 #30 #50 #100 #200
Serrano
Project No.:LB-1 Sample No.:
PARTICLE - SIZE DISTRIBUTION ASTM D 6913
Soil Identification: Olive brown silty, clayey sand (SC-SM)
SC
GR:SA:FI : (%)
Boring No.:
Depth (feet): 0-5 Soil Type :
Project Name:
1 : 74 : 25
BB1
Sep-17
0
10
20
30
40
50
60
70
80
90
100
0.0010.0100.1001.00010.000100.000
PER
CEN
T FI
NER
BY
WEI
GH
T
PARTICLE - SIZE (mm)
"
SA LB-1, BB1 @ 0-5
G-71

Project Name:
2 : 72 : 26
BB1
Sep-17
Boring No.:
Depth (feet): 0-5 Soil Type :
PARTICLE - SIZE DISTRIBUTION ASTM D 6913
Soil Identification: Yellowish brown silty sand (SM)
SM
GR:SA:FI : (%)
Serrano
Project No.:LB-2 Sample No.:
11737.001
SANDSILT FINE
HYDROMETER 3.0" 1 1/2" 3/4" 3/8" #4 #8 #16 #30 #50 #100 #200U.S. STANDARD SIEVE OPENING U.S. STANDARD SIEVE NUMBER
GRAVEL FINESFINE CLAY COARSE COARSE MEDIUM
0
10
20
30
40
50
60
70
80
90
100
0.0010.0100.1001.00010.000100.000
PER
CEN
T FI
NER
BY
WEI
GH
T
PARTICLE - SIZE (mm)
"
SA LB-2, BB1 @ 0-5
G-72

Project Name:
4 : 65 : 31
BB1
Sep-17
Boring No.:
Depth (feet): 0-5 Soil Type :
PARTICLE - SIZE DISTRIBUTION ASTM D 6913
Soil Identification: Yellowish brown silty sand (SM)
SM
GR:SA:FI : (%)
Serrano
Project No.:LB-3 Sample No.:
11737.001
SANDSILT FINE
HYDROMETER 3.0" 1 1/2" 3/4" 3/8" #4 #8 #16 #30 #50 #100 #200U.S. STANDARD SIEVE OPENING U.S. STANDARD SIEVE NUMBER
GRAVEL FINESFINE CLAY COARSE COARSE MEDIUM
0
10
20
30
40
50
60
70
80
90
100
0.0010.0100.1001.00010.000100.000
PER
CEN
T FI
NER
BY
WEI
GH
T
PARTICLE - SIZE (mm)
"
SA LB-3, BB1 @ 0-5
G-73

Project Name:
1 : 66 : 33
R1
Sep-17
Boring No.:
Depth (feet): 5.0 Soil Type :
PARTICLE - SIZE DISTRIBUTION ASTM D 6913
Soil Identification: Yellowish brown silty sand (SM)
SM
GR:SA:FI : (%)
Serrano
Project No.:LB-4 Sample No.:
11737.001
SANDSILT FINE
HYDROMETER 3.0" 1 1/2" 3/4" 3/8" #4 #8 #16 #30 #50 #100 #200U.S. STANDARD SIEVE OPENING U.S. STANDARD SIEVE NUMBER
GRAVEL FINESFINE CLAY COARSE COARSE MEDIUM
0
10
20
30
40
50
60
70
80
90
100
0.0010.0100.1001.00010.000100.000
PER
CEN
T FI
NER
BY
WEI
GH
T
PARTICLE - SIZE (mm)
"
SA LB-4, R1 @ 5
G-74

Project Name:
3 : 75 : 22
BB1
Sep-17
Boring No.:
Depth (feet): 0-5 Soil Type :
PARTICLE - SIZE DISTRIBUTION ASTM D 6913
Soil Identification: Yellowish brown silty sand (SM)
SM
GR:SA:FI : (%)
Serrano
Project No.:LB-5 Sample No.:
11737.001
SANDSILT FINE
HYDROMETER 3.0" 1 1/2" 3/4" 3/8" #4 #8 #16 #30 #50 #100 #200U.S. STANDARD SIEVE OPENING U.S. STANDARD SIEVE NUMBER
GRAVEL FINESFINE CLAY COARSE COARSE MEDIUM
0
10
20
30
40
50
60
70
80
90
100
0.0010.0100.1001.00010.000100.000
PER
CEN
T FI
NER
BY
WEI
GH
T
PARTICLE - SIZE (mm)
"
SA LB-5, BB1 @ 0-5
G-75

LB-2 LB-2 LB-2 LB-2 LB-2 LB-2
R2 R4 S2 R7 S5 S6
10.0 20.0 30.0 45.0 60.0 70.0
Ring Ring SPT Ring SPT SPT
0.0 0.0 0.0 0.0 0.0 0.0
0.0 0.0 0.0 0.0 0.0 0.0
1.0 1.0 1.0 1.0 1.0 1.0
0.0 0.0 0.0 0.0 0.0 0.0
863.4 811.6 1087.7 997.6 1014.2 955.6
108.5 107.8 201.4 96.0 215.1 206.4
754.9 703.8 886.3 901.6 799.1 749.2
929 57 XP IP-2 PHD D-7
A A A A A A
713.6 652.2 741.2 835.4 747.1 566.0
108.5 107.8 201.4 96.0 215.1 206.4
605.1 544.4 539.8 739.4 532.0 359.6
19.8 22.6 39.1 18.0 33.4 52.080.2 77.4 60.9 82.0 66.6 48.0
Project Name: Serrano
Project No.: 11737.001
Client Name: 6509 Serrano LP
Tested By: S. Felter Date: 08/24/17
Brown silty sand (SM)
Brown silty sand (SM)
Olive yellow clayey sand with gravel (SC)g (one 2.5" gravel,
227.8 g)
Boring No.
Sample No.
Depth (ft.)
Sample Type
PERCENT PASSING No. 200 SIEVE ASTM D 1140
Weight of Sample + Container (g)
Method (A or B)
Weight of Container (g)
Weight of Dry Sample (g)
% Passing No. 200 Sieve% Retained No. 200 Sieve
After Wash
Dry Weight of Sample (g)
Grayish brown clayey sand
(SC)
Grayish brown sandy lean clay s(CL)
Wet Weight of Soil + Container (g)
Sample Dry Weight Determination
Brown silty sand (SM)
Weight of Container (g)
Moisture Content (%)
Soil Identification
Dry Weight of Soil + Container (g)
Moisture Correction
Dry Weight of Sample + Cont. (g)
Weight of Container (g)
Container No.:
Passing #200 LB-2 & LB-6
G-76

LB-6 LB-6 LB-6 LB-6 LB-6 LB-6
R1 R3 R5 R7 R9 R12
5.0 15.0 25.0 35.0 45.0 70.0
Ring Ring Ring Ring Ring Ring
0.0 0.0 0.0 0.0 0.0 0.0
0.0 0.0 0.0 0.0 0.0 0.0
1.0 1.0 1.0 1.0 1.0 1.0
0.0 0.0 0.0 0.0 0.0 0.0
850.5 625.8 824.3 838.0 1011.9 757.6
106.7 108.4 107.5 109.0 300.3 108.0
743.8 517.4 716.8 729.0 711.6 649.6
912 934 A-15 927 IMC-1 R-2
A A A A A A
714.2 452.7 673.9 662.1 856.5 550.9
106.7 108.4 107.5 109.0 300.3 108.0
607.5 344.3 566.4 553.1 556.2 442.9
18.3 33.5 21.0 24.1 21.8 31.881.7 66.5 79.0 75.9 78.2 68.2
Project Name: Serrano
Project No.: 11737.001
Client Name: 6509 Serrano LP
Tested By: S. Felter Date: 08/24/17
Weight of Container (g)
Dry Weight of Sample (g)
% Passing No. 200 Sieve% Retained No. 200 Sieve
PERCENT PASSING No. 200 SIEVE ASTM D 1140
Weight of Dry Sample (g)
Container No.:
After Wash
Method (A or B)
Dry Weight of Sample + Cont. (g)
Dry Weight of Soil + Container (g)
Weight of Container (g)
Moisture Content (%)
Sample Dry Weight Determination
Weight of Sample + Container (g)
Weight of Container (g)
Grayish brown silty, clayey
sand (SC-SM)
Grayish brown silty, clayey
sand (SC-SM)
Moisture Correction
Wet Weight of Soil + Container (g)
Boring No.
Sample No.
Depth (ft.)
Sample Type
Soil IdentificationGrayish brown
silty sand (SM)
Grayish brown silty sand
(SM)
Grayish brown silty sand
(SM)
Grayish brown silty sand
(SM)
Passing #200 LB-2 & LB-6
G-77

Project Name: Tested By: R. Manning Date: 09/01/17
Project No. : Input By: G. Bathala Date: 09/13/17
Boring No.: Checked By: J. Ward
Sample No.: Depth (ft.)
Soil Identification:
1 2 1 2 3 4
35 27 22
20.33 20.49 24.85 23.17 22.42
19.15 19.27 21.61 20.33 19.72
13.64 13.55 13.61 13.63 13.60
21.42 21.33 40.50 42.39 44.12
432122CL
PI at "A" - Line = 0.73(LL-20) 16.79
One - Point Liquid Limit Calculation
LL =Wn(N/25)
PROCEDURES USED
Wet Preparation
Multipoint - Wet
X Dry Preparation
Multipoint - Dry
X Procedure A
Multipoint Test
Procedure B
One-point Test
ATTERBERG LIMITS ASTM D 4318
Serrano
11737.001
LB-2
S4 50.0
Dry Wt. of Soil + Cont. (g)
Wt. of Container (g)
Moisture Content (%) [Wn]
Yellowish brown sandy lean clay s(CL)
TEST
NO.
Liquid Limit
Plastic Limit
Plasticity Index
Classification
Number of Blows [N]
Wet Wt. of Soil + Cont. (g)
LIQUID LIMIT PLASTIC LIMIT
0
10
20
30
40
50
60
0 10 20 30 40 50 60 70 80 90 100
Plas
ticity
Inde
x (P
I)
Liquid Limit (LL)
0.121
CL or OL
ML or OLMH or OH
For classification of fine-grained soils and fine-grained fraction of coarse-grained soils
"A" Line
74
CH or OH
CL- ML
40
41
42
43
44
45
10 100
Moi
stur
e C
onte
nt (%
)
Number of Blows
20 25 30 40 50 60 70 80 90
G-78

Project Name: Tested By: R. Manning Date: 08/30/17
Project No. : Input By: G. Bathala Date: 09/13/17
Boring No.: Checked By: J. Ward
Sample No.: Depth (ft.)
Soil Identification:
1 2 1 2 3 4
13
Cannot be rolled: 26.29 Cannot get more than 13 blows:
NonPlastic 23.84 NonPlastic
13.67
24.09
NPNPNPNP
PI at "A" - Line = 0.73(LL-20) =
One - Point Liquid Limit Calculation
LL =Wn(N/25)
PROCEDURES USED
Wet Preparation
Multipoint - Wet
X Dry Preparation
Multipoint - Dry
X Procedure A
Multipoint Test
Procedure B
One-point Test
ATTERBERG LIMITS ASTM D 4318
Serrano
11737.001
LB-6
R13 75.0
Dry Wt. of Soil + Cont. (g)
Wt. of Container (g)
Moisture Content (%) [Wn]
Olive yellow silty sand (SM)
TEST
NO.
Liquid Limit
Plastic Limit
Plasticity Index
Classification
Number of Blows [N]
Wet Wt. of Soil + Cont. (g)
LIQUID LIMIT PLASTIC LIMIT
0
10
20
30
40
50
60
0 10 20 30 40 50 60 70 80 90 100
Plas
ticity
Inde
x (P
I)
Liquid Limit (LL)
0.121
CL or OL
ML or OLMH or OH
For classification of fine-grained soils and fine-grained fraction of coarse-grained soils
"A" Line
74
CH or OH
CL- ML
22
23
24
25
26
10 100
Moi
stur
e C
onte
nt (%
)
Number of Blows
20 25 30 40 50 60 70 80 90
G-79

Initial Final Initial Final Initial Final Initial Final
Time Readings @ 5.2 ksf
0.412 80 86116.4
Degree of Saturation (%)Dry Density (pcf)
0.448
Void Ratio
45.0 13.3
Soil Identification: Olive yellow clayey sand with gravel (SC)g
Project No.:
Serrano
09-17
11737.001
Boring No.
Sample No.
Depth (ft.)
Moisture Content (%)
ONE-DIMENSIONAL CONSOLIDATION PROPERTIES of SOILS
ASTM D 2435
12.7 120.3LB-2 R7
0.2330
0.2340
0.2350
0.2360
0.2370
0.2380
0.2390
0.2400
0.1 1.0 10.0 100.0 1000.0 10000.0
Def
orm
atio
n D
ial R
eadi
ng (i
n.)
Log of Time (min.)
0.00
0.50
1.00
1.50
2.00
2.50
3.00
3.500.10 1.00 10.00 100.00
Def
orm
atio
n (%
)
Pressure, p (ksf)
0.2330
0.2340
0.2350
0.2360
0.2370
0.2380
0.2390
0.2400
0.0 10.0 20.0 30.0 40.0 50.0
Square Root of Time (min.1/2)
Inundate with Tap water
G-80

Initial Final Initial Final Initial Final Initial Final
Time Readings @ 6.4 ksf
0.412 80 86116.4
Degree of Saturation (%)Dry Density (pcf)
0.448
Void Ratio
45.0 13.3
Soil Identification: Olive yellow clayey sand with gravel (SC)g
Project No.:
Serrano
09-17
11737.001
Boring No.
Sample No.
Depth (ft.)
Moisture Content (%)
ONE-DIMENSIONAL CONSOLIDATION PROPERTIES of SOILS
ASTM D 2435
12.7 120.3LB-2 R7
0.2310
0.2315
0.2320
0.2325
0.2330
0.2335
0.2340
0.2345
0.1 1.0 10.0 100.0 1000.0 10000.0
Def
orm
atio
n D
ial R
eadi
ng (i
n.)
Log of Time (min.)
0.00
0.50
1.00
1.50
2.00
2.50
3.00
3.500.10 1.00 10.00 100.00
Def
orm
atio
n (%
)
Pressure, p (ksf)
0.2310
0.2315
0.2320
0.2325
0.2330
0.2335
0.2340
0.2345
0.0 10.0 20.0 30.0 40.0
Square Root of Time (min.1/2)
Inundate with Tap water
G-81

Initial Final Initial Final Initial Final Initial Final
Boring No.
Sample No.
Depth (ft.)
Moisture Content (%)
ONE-DIMENSIONAL CONSOLIDATION PROPERTIES of SOILS
ASTM D 2435
18.2 109.5LB-6 R13 8.8
Soil Identification: Olive yellow silty sand (SM)
Project No.:
Serrano
09-17
11737.001
Time Readings @ 6.4 ksf
0.411 51 91114.9
Degree of Saturation (%)Dry Density (pcf)
0.468
Void Ratio
75.0
0.2360
0.2380
0.2400
0.2420
0.2440
0.2460
0.2480
0.2500
0.2520
0.2540
0.1 1.0 10.0 100.0 1000.0 10000.0
Def
orm
atio
n D
ial R
eadi
ng (i
n.)
Log of Time (min.)
0.00
0.50
1.00
1.50
2.00
2.50
3.00
3.50
4.00
4.500.10 1.00 10.00 100.00
Def
orm
atio
n (%
)
Pressure, p (ksf)
0.2360
0.2380
0.2400
0.2420
0.2440
0.2460
0.2480
0.2500
0.2520
0.2540
0.0 10.0 20.0 30.0 40.0
Square Root of Time (min.1/2)
Inundate with Tap water
G-82

Initial Final Initial Final Initial Final Initial Final
Boring No.
Sample No.
Depth (ft.)
Moisture Content (%)
ONE-DIMENSIONAL CONSOLIDATION PROPERTIES of SOILS
ASTM D 2435
18.2 109.5LB-6 R13 8.8
Soil Identification: Olive yellow silty sand (SM)
Project No.:
Serrano
09-17
11737.001
Time Readings @ 9.6 ksf
0.411 51 91114.9
Degree of Saturation (%)Dry Density (pcf)
0.468
Void Ratio
75.0
0.2240
0.2260
0.2280
0.2300
0.2320
0.2340
0.2360
0.2380
0.1 1.0 10.0 100.0 1000.0 10000.0
Def
orm
atio
n D
ial R
eadi
ng (i
n.)
Log of Time (min.)
0.00
0.50
1.00
1.50
2.00
2.50
3.00
3.50
4.00
4.500.10 1.00 10.00 100.00
Def
orm
atio
n (%
)
Pressure, p (ksf)
0.2240
0.2260
0.2280
0.2300
0.2320
0.2340
0.2360
0.2380
0.0 10.0 20.0 30.0 40.0
Square Root of Time (min.1/2)
Inundate with Tap water
G-83

Project Name: Tested By: G. Bathala Date: 08/28/17Project No.: Checked By: J. Ward Date: 09/21/17Boring No.: LB-1 Sample Type:Sample No.: R1 Depth (ft.) 5.0Sample Description: Olive gray silty, clayey sand (SC-SM)
Initial Dry Density (pcf): 120.8 Final Dry Density (pcf): 121.7Initial Moisture (%): 11.10 Final Moisture (%) : 12.3Initial Length (in.): 1.0000 Initial Void ratio: 0.3958Initial Dial Reading: 0.2950 Specific Gravity(assumed): 2.70Diameter(in): 2.370 Initial Saturation (%) 75.7
0.10 0.9998 0.00 -0.02 -0.02
0.20 0.9991 0.07 -0.09 -0.02
0.40 0.9967 0.21 -0.33 -0.12
0.80 0.9947 0.28 -0.53 -0.25
1.60 0.9909 0.41 -0.91 -0.50
H2O 0.9909 0.41 -0.91 -0.50
3.20 0.9867 0.53 -1.33 -0.80
Percent Swell (+) / Settlement (-) After Inundation = 0.01
Pressure (p) (ksf)
0.3955
0.3889
Final Reading (in) Void Ratio
Swell (+) Settlement (-) % of Sample
Thickness
Corrected Deformation
(%)
11737.001
0.2947
0.2859
0.2896 0.3923
Load Compliance
(%)
Apparent Thickness
(in)
ONE-DIMENSIONAL SWELL OR SETTLEMENTPOTENTIAL OF COHESIVE SOILS
ASTM D 4546
0.2817 0.3847
Serrano
Ring
0.2858 0.3888
0.2941 0.3956
0.2917 0.3942
0.3840
0.3860
0.3880
0.3900
0.3920
0.3940
0.3960
0.3980
0.100 1.000 10.000
Void
Rat
io
Log Pressure (ksf)
Void Ratio - Log Pressure Curve
Inundate withTap water
Swell-Settlement LB-1, R1 @ 5G-84

Normal Stress (kip/ft²)Peak Shear Stress (kip/ft²)Shear Stress @ End of Test (ksf)
Sample Type: 90% Remold Deformation Rate (in./min.)
Initial Sample Height (in.)Diameter (in.)Initial Moisture Content (%)
Strength Parameters Dry Density (pcf)C (psf) (o) Saturation (%)
Peak 626 35 Soil Height Before Shearing (in.)Ultimate 86 36 Final Moisture Content (%)
08-17
Project No.: 11737.001
54.60.9935
1.000
14.1
SerranoDIRECT SHEAR TEST RESULTS
Consolidated Undrained
1.0001.2920.8830.0500
8.70117.9
2.415Soil Identification:
0.9820
8.70
13.4
1.0002.415
0.991613.7
117.8
1.0002.415
54.6
8.70117.9
0.0500
4.0003.3923.0310.0500
54.6
2.0002.0591.437
Olive brown silty, clayey sand (SC-SM)
Boring No.Sample No.Depth (ft)
LB-1BB10-5
0.00
1.00
2.00
3.00
4.00
0 0.1 0.2 0.3
Shea
r Stre
ss (k
sf)
Horizontal Deformation (in.)
0.00
1.00
2.00
3.00
4.00
0.00 1.00 2.00 3.00 4.00 5.00 6.00 7.00 8.00
Shea
r Stre
ss (k
sf)
Normal Stress (ksf)
DS LB-1, BB1 @ 0-5
G-85

Tested By: O. Figueroa Date: 08/25/17
Input By: J. Ward Date: 08/28/17LB-1 Depth (ft.): 0-5
X Moist Mechanical Ram
Dry Manual Ram
Mold Volume (ft³) 0.03330 Ram Weight = 10 lb.; Drop = 18 in.
1 2 3 4 5 6
3901 4002 3958
1857 1857 1857
2044 2145 2101
340.2 416.4 445.1
323.0 386.8 404.6
39.2 39.6 39.5
6.06 8.53 11.09
135.3 142.0 139.1
127.6 130.9 125.2
131.0 8.5
PROCEDURE USED
X Procedure ASoil Passing No. 4 (4.75 mm) SieveMold : 4 in. (101.6 mm) diameterLayers : 5 (Five)Blows per layer : 25 (twenty-five)May be used if +#4 is 20% or less
Procedure BSoil Passing 3/8 in. (9.5 mm) SieveMold : 4 in. (101.6 mm) diameterLayers : 5 (Five)Blows per layer : 25 (twenty-five)Use if +#4 is >20% and +3/8 in. is 20% or less
Procedure CSoil Passing 3/4 in. (19.0 mm) SieveMold : 6 in. (152.4 mm) diameterLayers : 5 (Five)Blows per layer : 56 (fifty-six)Use if +3/8 in. is >20% and +¾ in. is <30%
Particle-Size Distribution:1:74:25GR:SA:FI
Atterberg Limits:
LL,PL,PI
Optimum Moisture Content (%) Maximum Dry Density (pcf)
Net Weight of Soil (g)
Wet Density (pcf)
Dry Density (pcf)
Moisture Content (%)
Wet Weight of Soil + Cont. (g)
Dry Weight of Soil + Cont. (g)
Weight of Container (g)
Weight of Mold (g)
Serrano
Preparation Method:
Wt. Compacted Soil + Mold (g)
BB1
11737.001
TEST NO.
Soil Identification:
Project Name:
Sample No.:Olive brown silty, clayey sand (SC-SM)
MODIFIED PROCTOR COMPACTION TEST ASTM D 1557
Project No.:Boring No.:
115.0
120.0
125.0
130.0
135.0
0.0 5.0 10.0 15.0 20.
Dry
Den
sity
(pcf
)
Moisture Content (%)
SP. GR. = 2.65SP. GR. = 2.70SP. GR. = 2.75
XX
MX LB-1, BB1 @ 0-5
G-86
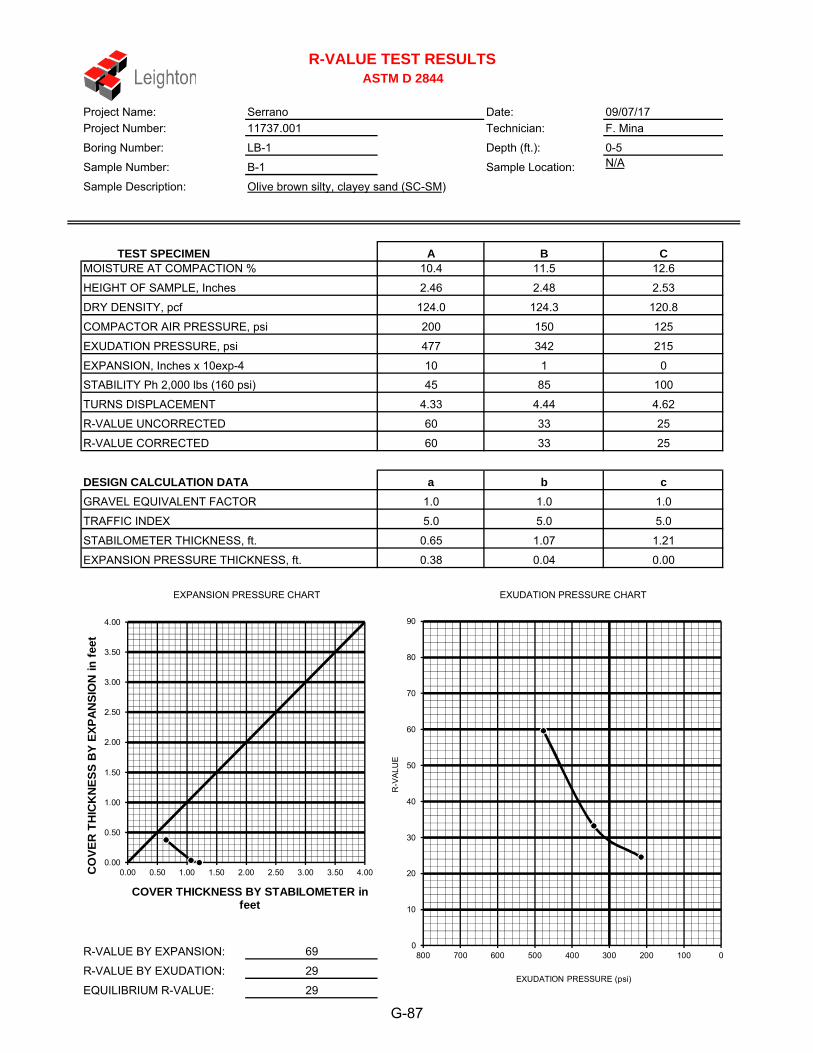
Project Name: Date: 09/07/17Project Number: 11737.001 Technician: F. MinaBoring Number: LB-1 Depth (ft.): 0-5Sample Number: B-1 Sample Location:Sample Description: Olive brown silty, clayey sand (SC-SM)
TEST SPECIMEN A B CMOISTURE AT COMPACTION % 10.4 11.5 12.6HEIGHT OF SAMPLE, Inches 2.46 2.48 2.53DRY DENSITY, pcf 124.0 124.3 120.8COMPACTOR AIR PRESSURE, psi 200 150 125EXUDATION PRESSURE, psi 477 342 215EXPANSION, Inches x 10exp-4 10 1 0STABILITY Ph 2,000 lbs (160 psi) 45 85 100TURNS DISPLACEMENT 4.33 4.44 4.62R-VALUE UNCORRECTED 60 33 25R-VALUE CORRECTED 60 33 25
DESIGN CALCULATION DATA a b cGRAVEL EQUIVALENT FACTOR 1.0 1.0 1.0TRAFFIC INDEX 5.0 5.0 5.0STABILOMETER THICKNESS, ft. 0.65 1.07 1.21EXPANSION PRESSURE THICKNESS, ft. 0.38 0.04 0.00
EXPANSION PRESSURE CHART EXUDATION PRESSURE CHART
R-VALUE BY EXPANSION: 69R-VALUE BY EXUDATION: 29EQUILIBRIUM R-VALUE: 29
R-VALUE TEST RESULTSASTM D 2844
Serrano
N/A
0.00
0.50
1.00
1.50
2.00
2.50
3.00
3.50
4.00
0.00 0.50 1.00 1.50 2.00 2.50 3.00 3.50 4.00CO
VER
TH
ICK
NES
S B
Y EX
PAN
SIO
N in
feet
COVER THICKNESS BY STABILOMETER in feet
0
10
20
30
40
50
60
70
80
90
0100200300400500600700800
R-V
ALU
E
EXUDATION PRESSURE (psi)
G-87

Project Name: Serrano Tested By : G. Berdy Date: 08/24/17
Project No. : 11737.001 Data Input By: G. Bathala Date: 09/15/17
Boring No. LB-1
Sample No. BB1
Sample Depth (ft) 0-5
208.31
195.72
58.70
9.19
100.54
92
26
860
9:00/9:45
45
20.9369
20.9349
0.0020
82.30
91
ml of Extract For Titration (B) 30
ml of AgNO3 Soln. Used in Titration (C) 0.3
PPM of Chloride (C -0.2) * 100 * 30 / B 10
PPM of Chloride, Dry Wt. Basis 11
7.74
20.5
PPM of Sulfate (A) x 41150
CHLORIDE CONTENT, DOT California Test 422
Wet Weight of Soil + Container (g)
Wt. of Residue (g) (A)
Beaker No.
Crucible No.
Furnace Temperature (°C)
Time In / Time Out
Weight of Soaked Soil (g)
PPM of Sulfate, Dry Weight Basis
Wt. of Crucible (g)
Olive brown (SC-SM)
Wt. of Crucible + Residue (g)
Dry Weight of Soil + Container (g)
Weight of Container (g)
Duration of Combustion (min)
Temperature °C
pH Value
pH TEST, DOT California Test 643
TESTS for SULFATE CONTENTCHLORIDE CONTENT and pH of SOILS
SULFATE CONTENT, DOT California Test 417, Part II
Soil Identification:
Moisture Content (%)
G-88

Project Name: Tested By : G. Berdy Date:
Project No. : Data Input By: G. Bathala Date:
Boring No.: Depth (ft.) :
Sample No. : BB1
Container No.
Initial Soil Wt. (g) (Wt)
Box Constant
Olive brown (SC-SM)
Resistance Reading (ohm)
16.14
Soil Resistivity (ohm-cm)
Serrano 08/28/17
09/15/17
0-5
11737.001
LB-1
SOIL RESISTIVITY TESTDOT CA TEST 643
Temp. (°C)pH
Soil pH
2700
3000
90.47
64.68
MC =(((1+Mci/100)x(Wa/Wt+1))-1)x100
2400 18.4 91 11 7.74 20.5
4
20
30 130.033 300023.88
2700
Min. Resistivity
DOT CA Test 643DOT CA Test 417 Part II DOT CA Test 422
(%) (ppm) (ppm)
DOT CA Test 643
1.000
Chloride Content(ohm-cm)
Moisture Content Sulfate Content
5
1
2
Water Added (ml)
(Wa)
10
Adjusted Moisture Content
(MC) Dry Wt. of Soil + Cont. (g)
7200
Soil Identification:**California Test 643 requires soil specimens to consist only of portions of samples passing through the No. 8 US Standard Sieve before resistivity testing. Therefore, this test method may not be representative for coarser materials.
Wt. of Container (g)8.40 7200
0.66
90.64
Moisture Content (%) (MCi)
Wet Wt. of Soil + Cont. (g)Specimen
No.
1000
2000
3000
4000
5000
6000
7000
8000
5.0 10.0 15.0 20.0 25.0
Soil
Res
istiv
ity (o
hm-c
m)
Moisture Content (%)
G-89

APPENDIX C
PERCOLATION TEST RESULTS
G-90

Project Number: 11737.001 Test Hole Number: LP-1Project Name: Serrano Date Excavated:Earth Description: Artificial Fill Date Tested:Liquid Description: Tap water Depth of boring (ft): 9Tested By: JMP Diameter of boring (in): 8Time Interval Standard Diameter of casing (in): 2Start Time for Pre-Soak: 8/16/2017 9:00AM Length of slotted of casing (ft): 5Start Time for Standard: 8/17/2017 7:47AM Depth to Initial Water Depth (ft): 4
Porosity of Annulus Material, n : 0.3530 Bentonite Plug at Bottom: No
Reading TimeTime Interval,
Δt (min.)
Initial/Final Depth to
Water (ft.)
Initial/Final Water Height,
H0/Hf
(in.)
Total Water Drop, Δd (in.)
Percolation Rate (min./in.)
Infiltration Rate (in./hr.)
7:47 4.40 55.28:17 4.68 51.88:17 4.68 51.88:47 4.88 49.48:47 4.88 49.49:17 5.05 47.49:17 4.95 48.69:47 5.11 46.79:47 4.95 48.6
10:17 5.16 46.110:17 4.96 48.510:47 5.16 46.110:47 4.97 48.411:17 5.15 46.211:17 4.95 48.611:47 5.14 46.311:47 4.97 48.412:17 5.14 46.312:17 4.96 48.512:47 5.13 46.412:47 4.97 48.413:17 5.13 46.413:17 4.96 48.513:47 5.12 46.6
Infiltration Rate, I (Last Reading) = 0.06 in./hr.
2.4 12.50 0.07
0.09
Percolation Data
1 30 3.4 8.93
Boring Percolation Test Data Sheet
8/16/20178/17/2017
Standard Time Interval Between Readings, mins:
3 30 2.0 14.71 0.06
4 30 1.9 15.63 0.06
2 30
5 30 2.5 11.90 0.08
6 30 2.4 12.50 0.08
7 30 2.2 13.89 0.07
8 30 2.3 13.16 0.07
9 30 2.0 14.71 0.06
10 30 2.0 14.71 0.06
Infiltration Rate (I) = Flow Volume/Flow Area/Δt
15.63 0.0612 30 1.9
11 30 1.9 15.63 0.06
G-91

Project Number: 11737.001 Test Hole Number: LP-2Project Name: Serrano Date Excavated:Earth Description: Artificial Fill Date Tested:Liquid Description: Tap water Depth of boring (ft): 9Tested By: JMP Diameter of boring (in): 8Time Interval Standard Diameter of casing (in): 2Start Time for Pre-Soak: 8/16/2017 9:00AM Length of slotted of casing (ft): 5Start Time for Standard: 8/17/2017 8:01AM Depth to Initial Water Depth (ft): 4
Porosity of Annulus Material, n : 0.3530 Bentonite Plug at Bottom: No
Reading TimeTime Interval,
Δt (min.)
Initial/Final Depth to
Water (ft.)
Initial/Final Water Height,
H0/Hf
(in.)
Total Water Drop, Δd (in.)
Percolation Rate (min./in.)
Infiltration Rate (in./hr.)
8:01 4.25 57.08:31 4.37 55.68:31 4.37 55.69:01 4.48 54.29:01 4.48 54.29:31 4.58 53.09:31 4.58 53.0
10:01 4.68 51.810:01 4.68 51.810:31 4.77 50.810:31 4.77 50.811:01 4.87 49.611:01 4.87 49.611:31 4.96 48.511:31 4.96 48.512:01 5.06 47.312:01 4.99 48.112:31 4.11 58.712:31 4.97 48.413:01 5.10 46.813:01 4.96 48.513:31 5.09 46.913:31 4.98 48.214:01 5.10 46.8
Infiltration Rate, I (Last Reading) = 0.05 in./hr.
12 30
Infiltration Rate (I) = Flow Volume/Flow Area/Δt
20.831.4
30 1.6 19.23 0.05
11 30 1.6 19.23 0.05
-0.30
0.05
25.00 0.04
5
10
7 30 1.1 27.78 0.03
8 30 1.2
9 30 -10.6 -2.84
6 30 1.2 25.00 0.04
25.00 0.03
30 1.1 27.78 0.03
22.73 0.04
3 30 1.2 25.00 0.03
4
2 30 1.3
30 1.2
Boring Percolation Test Data Sheet
8/16/20178/17/2017
0.04
Standard Time Interval Between Readings, mins:
Percolation Data
1 30 1.4 20.83
G-92

APPENDIX D
SEISMICITY DATA
G-93

9/24/2017 Design Maps Detailed Report
https://earthquake.usgs.gov/cn2/designmaps/us/report.php?template=minimal&latitude=33.831715&longitude=-117.760025&siteclass=3&riskcategory… 1/6
From Figure 22-1 [1]
From Figure 22-2 [2]
Design Maps Detailed ReportASCE 7-10 Standard (33.83172°N, 117.76003°W)
Site Class D – “Stiff Soil”, Risk Category I/II/III
Section 11.4.1 — Mapped Acceleration Parameters
Note: Ground motion values provided below are for the direction of maximum horizontalspectral response acceleration. They have been converted from corresponding geometricmean ground motions computed by the USGS by applying factors of 1.1 (to obtain SS) and1.3 (to obtain S1). Maps in the 2010 ASCE-7 Standard are provided for Site Class B.Adjustments for other Site Classes are made, as needed, in Section 11.4.3.
SS = 1.569 g
S1 = 0.604 g
Section 11.4.2 — Site Class
The authority having jurisdiction (not the USGS), site-specific geotechnical data, and/orthe default has classified the site as Site Class D, based on the site soil properties inaccordance with Chapter 20.
Table 20.3–1 Site Classification
Site Class vS N or N ch su
A. Hard Rock >5,000 ft/s N/A N/A
B. Rock 2,500 to 5,000 ft/s N/A N/A
C. Very dense soil and soft rock 1,200 to 2,500 ft/s >50 >2,000 psf
D. Stiff Soil 600 to 1,200 ft/s 15 to 50 1,000 to 2,000 psf
E. Soft clay soil <600 ft/s <15 <1,000 psf
Any profile with more than 10 ft of soil having thecharacteristics:
Plasticity index PI > 20,Moisture content w ≥ 40%, andUndrained shear strength su < 500 psf
F. Soils requiring site responseanalysis in accordance with Section21.1
See Section 20.3.1
For SI: 1ft/s = 0.3048 m/s 1lb/ft² = 0.0479 kN/m²
G-94

9/24/2017 Design Maps Detailed Report
https://earthquake.usgs.gov/cn2/designmaps/us/report.php?template=minimal&latitude=33.831715&longitude=-117.760025&siteclass=3&riskcategory… 2/6
Section 11.4.3 — Site Coefficients and Risk–Targeted Maximum Considered Earthquake (MCER)Spectral Response Acceleration Parameters
Table 11.4–1: Site Coefficient Fa
Site Class Mapped MCE R Spectral Response Acceleration Parameter at Short Period
SS ≤ 0.25 SS = 0.50 SS = 0.75 SS = 1.00 SS ≥ 1.25
A 0.8 0.8 0.8 0.8 0.8
B 1.0 1.0 1.0 1.0 1.0
C 1.2 1.2 1.1 1.0 1.0
D 1.6 1.4 1.2 1.1 1.0
E 2.5 1.7 1.2 0.9 0.9
F See Section 11.4.7 of ASCE 7
Note: Use straight–line interpolation for intermediate values of SS
For Site Class = D and SS = 1.569 g, Fa = 1.000
Table 11.4–2: Site Coefficient Fv
Site Class Mapped MCE R Spectral Response Acceleration Parameter at 1–s Period
S1 ≤ 0.10 S1 = 0.20 S1 = 0.30 S1 = 0.40 S1 ≥ 0.50
A 0.8 0.8 0.8 0.8 0.8
B 1.0 1.0 1.0 1.0 1.0
C 1.7 1.6 1.5 1.4 1.3
D 2.4 2.0 1.8 1.6 1.5
E 3.5 3.2 2.8 2.4 2.4
F See Section 11.4.7 of ASCE 7
Note: Use straight–line interpolation for intermediate values of S1
For Site Class = D and S1 = 0.604 g, Fv = 1.500
G-95

9/24/2017 Design Maps Detailed Report
https://earthquake.usgs.gov/cn2/designmaps/us/report.php?template=minimal&latitude=33.831715&longitude=-117.760025&siteclass=3&riskcategory… 3/6
Equation (11.4–1):
Equation (11.4–2):
Equation (11.4–3):
Equation (11.4–4):
From Figure 22-12 [3]
SMS = FaSS = 1.000 x 1.569 = 1.569 g
SM1 = FvS1 = 1.500 x 0.604 = 0.906 g
Section 11.4.4 — Design Spectral Acceleration Parameters
SDS = ⅔ SMS = ⅔ x 1.569 = 1.046 g
SD1 = ⅔ SM1 = ⅔ x 0.906 = 0.604 g
Section 11.4.5 — Design Response Spectrum
TL = 8 seconds
Figure 11.4–1: Design Response Spectrum
G-96

9/24/2017 Design Maps Detailed Report
https://earthquake.usgs.gov/cn2/designmaps/us/report.php?template=minimal&latitude=33.831715&longitude=-117.760025&siteclass=3&riskcategory… 4/6
Section 11.4.6 — Risk-Targeted Maximum Considered Earthquake (MCER) Response Spectrum
The MCER Response Spectrum is determined by multiplying the design response spectrum above by1.5.
G-97

9/24/2017 Design Maps Detailed Report
https://earthquake.usgs.gov/cn2/designmaps/us/report.php?template=minimal&latitude=33.831715&longitude=-117.760025&siteclass=3&riskcategory… 5/6
From Figure 22-7 [4]
Equation (11.8–1):
From Figure 22-17 [5]
From Figure 22-18 [6]
Section 11.8.3 — Additional Geotechnical Investigation Report Requirements for Seismic DesignCategories D through F
PGA = 0.599
PGAM = FPGAPGA = 1.000 x 0.599 = 0.599 g
Table 11.8–1: Site Coefficient FPGA
SiteClass
Mapped MCE Geometric Mean Peak Ground Acceleration, PGA
PGA ≤0.10
PGA =0.20
PGA =0.30
PGA =0.40
PGA ≥0.50
A 0.8 0.8 0.8 0.8 0.8
B 1.0 1.0 1.0 1.0 1.0
C 1.2 1.2 1.1 1.0 1.0
D 1.6 1.4 1.2 1.1 1.0
E 2.5 1.7 1.2 0.9 0.9
F See Section 11.4.7 of ASCE 7
Note: Use straight–line interpolation for intermediate values of PGA
For Site Class = D and PGA = 0.599 g, FPGA = 1.000
Section 21.2.1.1 — Method 1 (from Chapter 21 – Site-Specific Ground Motion Procedures forSeismic Design)
CRS = 1.003
CR1 = 1.020
G-98

9/24/2017 Design Maps Detailed Report
https://earthquake.usgs.gov/cn2/designmaps/us/report.php?template=minimal&latitude=33.831715&longitude=-117.760025&siteclass=3&riskcategory… 6/6
Section 11.6 — Seismic Design Category
Table 11.6-1 Seismic Design Category Based on Short Period Response Acceleration Parameter
VALUE OF SDS
RISK CATEGORY
I or II III IV
SDS < 0.167g A A A
0.167g ≤ SDS < 0.33g B B C
0.33g ≤ SDS < 0.50g C C D
0.50g ≤ SDS D D D
For Risk Category = I and SDS = 1.046 g, Seismic Design Category = D
Table 11.6-2 Seismic Design Category Based on 1-S Period Response Acceleration Parameter
VALUE OF SD1
RISK CATEGORY
I or II III IV
SD1 < 0.067g A A A
0.067g ≤ SD1 < 0.133g B B C
0.133g ≤ SD1 < 0.20g C C D
0.20g ≤ SD1 D D D
For Risk Category = I and SD1 = 0.604 g, Seismic Design Category = D
Note: When S1 is greater than or equal to 0.75g, the Seismic Design Category is E forbuildings in Risk Categories I, II, and III, and F for those in Risk Category IV, irrespectiveof the above.
Seismic Design Category ≡ “the more severe design category in accordance withTable 11.6-1 or 11.6-2” = D
Note: See Section 11.6 for alternative approaches to calculating Seismic Design Category.
References
1. Figure 22-1: https://earthquake.usgs.gov/hazards/designmaps/downloads/pdfs/2010_ASCE-7_Figure_22-1.pdf2. Figure 22-2: https://earthquake.usgs.gov/hazards/designmaps/downloads/pdfs/2010_ASCE-7_Figure_22-2.pdf3. Figure 22-12: https://earthquake.usgs.gov/hazards/designmaps/downloads/pdfs/2010_ASCE-7_Figure_22-12.pdf4. Figure 22-7: https://earthquake.usgs.gov/hazards/designmaps/downloads/pdfs/2010_ASCE-7_Figure_22-7.pdf5. Figure 22-17: https://earthquake.usgs.gov/hazards/designmaps/downloads/pdfs/2010_ASCE-7_Figure_22-17.pdf6. Figure 22-18: https://earthquake.usgs.gov/hazards/designmaps/downloads/pdfs/2010_ASCE-7_Figure_22-18.pdf
G-99

APPENDIX E
GENERAL EARTHWORK AND
GRADING RECOMMENDATIONS
G-100

i
APPENDIX E LEIGHTON AND ASSOCIATES, INC. GENERAL EARTHWORK AND GRADING SPECIFICATIONS FOR ROUGH GRADING TABLE OF CONTENTS Section Appendix E Page 1.0 GENERAL ............................................................................................................ 1
1.1 Intent .......................................................................................................... 1 1.2 The Geotechnical Consultant of Record .................................................... 1 1.3 The Earthwork Contractor .......................................................................... 2
2.0 PREPARATION OF AREAS TO BE FILLED ........................................................ 2
2.1 Clearing and Grubbing ............................................................................... 2 2.2 Processing ................................................................................................. 3 2.3 Overexcavation .......................................................................................... 3 2.4 Benching .................................................................................................... 3 2.5 Evaluation/Acceptance of Fill Areas .......................................................... 4
3.0 FILL MATERIAL ................................................................................................... 4
3.1 General ...................................................................................................... 4 3.2 Oversize ..................................................................................................... 4 3.3 Import ......................................................................................................... 4
4.0 FILL PLACEMENT AND COMPACTION .............................................................. 5
4.1 Fill Layers .................................................................................................. 5 4.2 Fill Moisture Conditioning ........................................................................... 5 4.3 Compaction of Fill ...................................................................................... 5 4.4 Compaction of Fill Slopes .......................................................................... 5 4.5 Compaction Testing ................................................................................... 5 4.6 Frequency of Compaction Testing ............................................................. 6 4.7 Compaction Test Locations ....................................................................... 6
5.0 SUBDRAIN INSTALLATION................................................................................. 6
6.0 EXCAVATION ...................................................................................................... 6
7.0 TRENCH BACKFILLS .......................................................................................... 7
7.1 Safety......................................................................................................... 7 7.2 Bedding and Backfill .................................................................................. 7 7.3 Lift Thickness ............................................................................................. 7 7.4 Observation and Testing ............................................................................ 7
G-101

ii
LEIGHTON AND ASSOCIATES, INC. GENERAL EARTHWORK AND GRADING SPECIFICATIONS FOR ROUGH GRADING TABLE OF CONTENTS (CONT'D) Standard Details A - Keying and Benching Rear of Text B - Oversize Rock Disposal Rear of Text C - Canyon Subdrains Rear of Text D - Buttress or Replacement Fill Subdrains Rear of Text E - Transition Lot Fills and Side Hill Fills Rear of Text
G-102

LEIGHTON AND ASSOCIATES, INC. General Earthwork and Grading Specifications
1
1.0 GENERAL
1.1 Intent
These General Earthwork and Grading Specifications are for the grading and earthwork shown on the approved grading plan(s) and/or indicated in the geotechnical report(s). These Specifications are a part of the recommendations contained in the geotechnical report(s). In case of conflict, the specific recommendations in the geotechnical report shall supersede these more general Specifications. Observations of the earthwork by the project Geotechnical Consultant during the course of grading may result in new or revised recommendations that could supersede these specifications or the recommendations in the geotechnical report(s).
1.2 The Geotechnical Consultant of Record
Prior to commencement of work, the owner shall employ the Geotechnical Consultant of Record (Geotechnical Consultant). The Geotechnical Consultants shall be responsible for reviewing the approved geotechnical report(s) and accepting the adequacy of the preliminary geotechnical findings, conclusions, and recommendations prior to the commencement of the grading.
Prior to commencement of grading, the Geotechnical Consultant shall
review the "work plan" prepared by the Earthwork Contractor (Contractor) and schedule sufficient personnel to perform the appropriate level of observation, mapping, and compaction testing.
During the grading and earthwork operations, the Geotechnical Consultant
shall observe, map, and document the subsurface exposures to verify the geotechnical design assumptions. If the observed conditions are found to be significantly different than the interpreted assumptions during the design phase, the Geotechnical Consultant shall inform the owner, recommend appropriate changes in design to accommodate the observed conditions, and notify the review agency where required. Subsurface areas to be geotechnically observed, mapped, elevations recorded, and/or tested include natural ground after it has been cleared for receiving fill but before fill is placed, bottoms of all "remedial removal" areas, all key bottoms, and benches made on sloping ground to receive fill.
The Geotechnical Consultant shall observe the moisture-conditioning and
processing of the subgrade and fill materials and perform relative compaction testing of fill to determine the attained level of compaction.
G-103

LEIGHTON AND ASSOCIATES, INC. General Earthwork and Grading Specifications
2
The Geotechnical Consultant shall provide the test results to the owner and the Contractor on a routine and frequent basis.
1.3 The Earthwork Contractor
The Earthwork Contractor (Contractor) shall be qualified, experienced, and knowledgeable in earthwork logistics, preparation and processing of ground to receive fill, moisture-conditioning and processing of fill, and compacting fill. The Contractor shall review and accept the plans, geotechnical report(s), and these Specifications prior to commencement of grading. The Contractor shall be solely responsible for performing the grading in accordance with the plans and specifications.
The Contractor shall prepare and submit to the owner and the
Geotechnical Consultant a work plan that indicates the sequence of earthwork grading, the number of "spreads" of work and the estimated quantities of daily earthwork contemplated for the site prior to commencement of grading. The Contractor shall inform the owner and the Geotechnical Consultant of changes in work schedules and updates to the work plan at least 24 hours in advance of such changes so that appropriate observations and tests can be planned and accomplished. The Contractor shall not assume that the Geotechnical Consultant is aware of all grading operations.
The Contractor shall have the sole responsibility to provide adequate
equipment and methods to accomplish the earthwork in accordance with the applicable grading codes and agency ordinances, these Specifications, and the recommendations in the approved geotechnical report(s) and grading plan(s). If, in the opinion of the Geotechnical Consultant, unsatisfactory conditions, such as unsuitable soil, improper moisture condition, inadequate compaction, insufficient buttress key size, adverse weather, etc., are resulting in a quality of work less than required in these specifications, the Geotechnical Consultant shall reject the work and may recommend to the owner that construction be stopped until the conditions are rectified.
2.0 PREPARATION OF AREAS TO BE FILLED
2.1 Clearing and Grubbing
Vegetation, such as brush, grass, roots, and other deleterious material shall be sufficiently removed and properly disposed of in a method acceptable to the owner, governing agencies, and the Geotechnical Consultant.
G-104

LEIGHTON AND ASSOCIATES, INC. General Earthwork and Grading Specifications
3
The Geotechnical Consultant shall evaluate the extent of these removals depending on specific site conditions. Earth fill material shall not contain more than 1 percent of organic materials (by volume). No fill lift shall contain more than 5 percent of organic matter. Nesting of the organic materials shall not be allowed.
If potentially hazardous materials are encountered, the Contractor shall
stop work in the affected area, and a hazardous material specialist shall be informed immediately for proper evaluation and handling of these materials prior to continuing to work in that area.
As presently defined by the State of California, most refined petroleum
products (gasoline, diesel fuel, motor oil, grease, coolant, etc.) have chemical constituents that are considered to be hazardous waste. As such, the indiscriminate dumping or spillage of these fluids onto the ground may constitute a misdemeanor, punishable by fines and/or imprisonment, and shall not be allowed.
2.2 Processing
Existing ground that has been declared satisfactory for support of fill by the Geotechnical Consultant shall be scarified to a minimum depth of 6 inches. Existing ground that is not satisfactory shall be overexcavated as specified in the following section. Scarification shall continue until soils are broken down and free of large clay lumps or clods and the working surface is reasonably uniform, flat, and free of uneven features that would inhibit uniform compaction.
2.3 Overexcavation
In addition to removals and overexcavations recommended in the approved geotechnical report(s) and the grading plan, soft, loose, dry, saturated, spongy, organic-rich, highly fractured or otherwise unsuitable ground shall be overexcavated to competent ground as evaluated by the Geotechnical Consultant during grading.
2.4 Benching
Where fills are to be placed on ground with slopes steeper than 5:1 (horizontal to vertical units), the ground shall be stepped or benched. Please see the Standard Details for a graphic illustration. The lowest bench or key shall be a minimum of 15 feet wide and at least 2 feet deep, into competent material as evaluated by the Geotechnical Consultant. Other benches shall be excavated a minimum height of 4 feet into competent material or as otherwise recommended by the Geotechnical
G-105

LEIGHTON AND ASSOCIATES, INC. General Earthwork and Grading Specifications
4
Consultant. Fill placed on ground sloping flatter than 5:1 shall also be benched or otherwise overexcavated to provide a flat subgrade for the fill.
2.5 Evaluation/Acceptance of Fill Areas
All areas to receive fill, including removal and processed areas, key bottoms, and benches, shall be observed, mapped, elevations recorded, and/or tested prior to being accepted by the Geotechnical Consultant as suitable to receive fill. The Contractor shall obtain a written acceptance from the Geotechnical Consultant prior to fill placement. A licensed surveyor shall provide the survey control for determining elevations of processed areas, keys, and benches.
3.0 FILL MATERIAL
3.1 General
Material to be used as fill shall be essentially free of organic matter and other deleterious substances evaluated and accepted by the Geotechnical Consultant prior to placement. Soils of poor quality, such as those with unacceptable gradation, high expansion potential, or low strength shall be placed in areas acceptable to the Geotechnical Consultant or mixed with other soils to achieve satisfactory fill material.
3.2 Oversize
Oversize material defined as rock, or other irreducible material with a maximum dimension greater than 8 inches, shall not be buried or placed in fill unless location, materials, and placement methods are specifically accepted by the Geotechnical Consultant. Placement operations shall be such that nesting of oversized material does not occur and such that oversize material is completely surrounded by compacted or densified fill. Oversize material shall not be placed within 10 vertical feet of finish grade or within 2 feet of future utilities or underground construction.
3.3 Import
If importing of fill material is required for grading, proposed import material shall meet the requirements of Section 3.1. The potential import source shall be given to the Geotechnical Consultant at least 48 hours (2 working days) before importing begins so that its suitability can be determined and appropriate tests performed.
G-106

LEIGHTON AND ASSOCIATES, INC. General Earthwork and Grading Specifications
5
4.0 FILL PLACEMENT AND COMPACTION
4.1 Fill Layers
Approved fill material shall be placed in areas prepared to receive fill (per Section 3.0) in near-horizontal layers not exceeding 8 inches in loose thickness. The Geotechnical Consultant may accept thicker layers if testing indicates the grading procedures can adequately compact the thicker layers. Each layer shall be spread evenly and mixed thoroughly to attain relative uniformity of material and moisture throughout.
4.2 Fill Moisture Conditioning
Fill soils shall be watered, dried back, blended, and/or mixed, as necessary to attain a relatively uniform moisture content at or slightly over optimum. Maximum density and optimum soil moisture content tests shall be performed in accordance with the American Society of Testing and Materials (ASTM Test Method D1557).
4.3 Compaction of Fill
After each layer has been moisture-conditioned, mixed, and evenly spread, it shall be uniformly compacted to not less than 90 percent of maximum dry density (ASTM Test Method D1557). Compaction equipment shall be adequately sized and be either specifically designed for soil compaction or of proven reliability to efficiently achieve the specified level of compaction with uniformity.
4.4 Compaction of Fill Slopes
In addition to normal compaction procedures specified above, compaction of slopes shall be accomplished by backrolling of slopes with sheepsfoot rollers at increments of 3 to 4 feet in fill elevation, or by other methods producing satisfactory results acceptable to the Geotechnical Consultant. Upon completion of grading, relative compaction of the fill, out to the slope face, shall be at least 90 percent of maximum density per ASTM Test Method D1557.
4.5 Compaction Testing
Field-tests for moisture content and relative compaction of the fill soils shall be performed by the Geotechnical Consultant. Location and frequency of tests shall be at the Consultant's discretion based on field conditions encountered. Compaction test locations will not necessarily be selected on a random basis. Test locations shall be selected to verify
G-107

LEIGHTON AND ASSOCIATES, INC. General Earthwork and Grading Specifications
6
adequacy of compaction levels in areas that are judged to be prone to inadequate compaction (such as close to slope faces and at the fill/bedrock benches).
4.6 Frequency of Compaction Testing
Tests shall be taken at intervals not exceeding 2 feet in vertical rise and/or 1,000 cubic yards of compacted fill soils embankment. In addition, as a guideline, at least one test shall be taken on slope faces for each 5,000 square feet of slope face and/or each 10 feet of vertical height of slope. The Contractor shall assure that fill construction is such that the testing schedule can be accomplished by the Geotechnical Consultant. The Contractor shall stop or slow down the earthwork construction if these minimum standards are not met.
4.7 Compaction Test Locations
The Geotechnical Consultant shall document the approximate elevation and horizontal coordinates of each test location. The Contractor shall coordinate with the project surveyor to assure that sufficient grade stakes are established so that the Geotechnical Consultant can determine the test locations with sufficient accuracy. At a minimum, two grade stakes within a horizontal distance of 100 feet and vertically less than 5 feet apart from potential test locations shall be provided.
5.0 SUBDRAIN INSTALLATION
Subdrain systems shall be installed in accordance with the approved geotechnical report(s), the grading plan, and the Standard Details. The Geotechnical Consultant may recommend additional subdrains and/or changes in subdrain extent, location, grade, or material depending on conditions encountered during grading. All subdrains shall be surveyed by a land surveyor/civil engineer for line and grade after installation and prior to burial. Sufficient time should be allowed by the Contractor for these surveys.
6.0 EXCAVATION
Excavations, as well as over-excavation for remedial purposes, shall be evaluated by the Geotechnical Consultant during grading. Remedial removal depths shown on geotechnical plans are estimates only. The actual extent of removal shall be determined by the Geotechnical Consultant based on the field evaluation of exposed conditions during grading. Where fill-over-cut slopes are to be graded, the cut portion of the slope shall be made, evaluated, and accepted by the Geotechnical Consultant prior to placement of materials for construction of
G-108

LEIGHTON AND ASSOCIATES, INC. General Earthwork and Grading Specifications
7
the fill portion of the slope, unless otherwise recommended by the Geotechnical Consultant.
7.0 TRENCH BACKFILLS
7.1 Safety
The Contractor shall follow all OSHA and Cal/OSHA requirements for safety of trench excavations.
7.2 Bedding and Backfill
All bedding and backfill of utility trenches shall be performed in accordance with the applicable provisions of Standard Specifications of Public Works Construction. Bedding material shall have a Sand Equivalent greater than 30 (SE>30). The bedding shall be placed to 1 foot over the top of the conduit and densified by jetting. Backfill shall be placed and densified to a minimum of 90 percent of relative compaction from 1 foot above the top of the conduit to the surface.
The Geotechnical Consultant shall test the trench backfill for relative
compaction. At least one test should be made for every 300 feet of trench and 2 feet of fill.
7.3 Lift Thickness
Lift thickness of trench backfill shall not exceed those allowed in the Standard Specifications of Public Works Construction unless the Contractor can demonstrate to the Geotechnical Consultant that the fill lift can be compacted to the minimum relative compaction by his alternative equipment and method.
7.4 Observation and Testing
The jetting of the bedding around the conduits shall be observed by the Geotechnical Consultant.
G-109
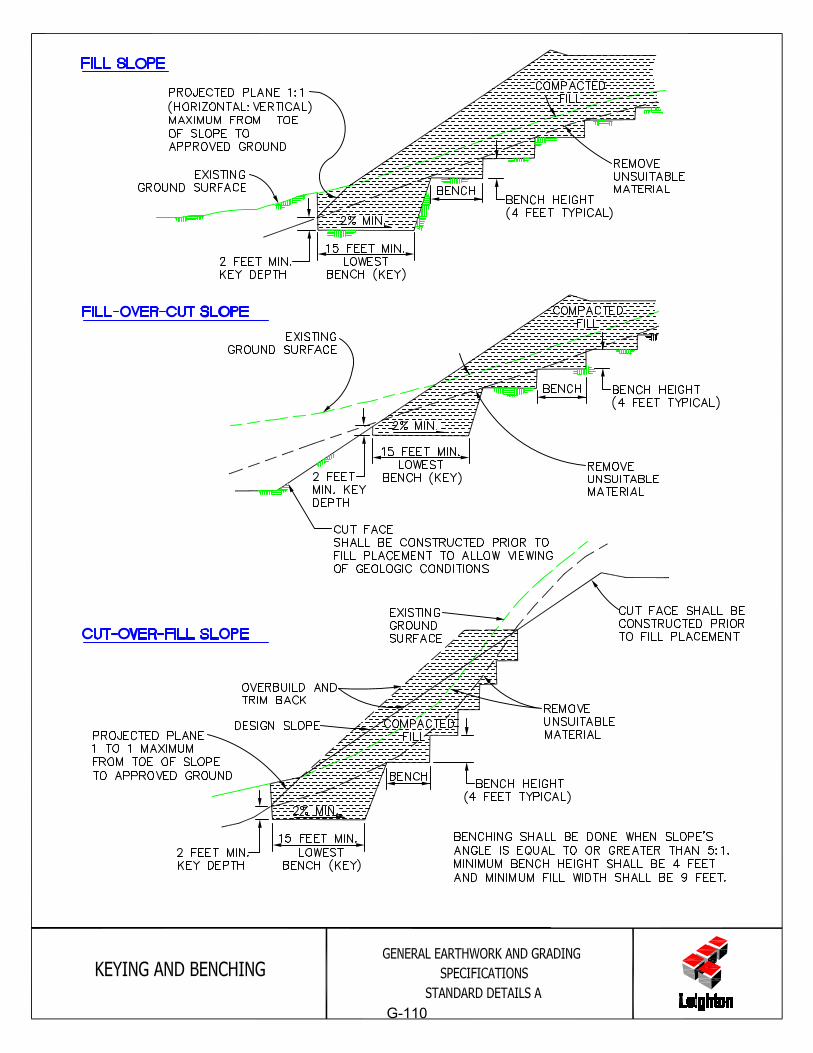
G-110

G-111

G-112

G-113

G-114

November 8, 2018
Project No. 11737.002
6509 Serrano L.P. 4040 MacArthur Boulevard, Suite 300 Newport Beach, California 92660 Attention: Mr. John Saunders Subject: Addendum No. 1 to Geotechnical Exploration Report
Proposed Residential Development 6501-6513 East Serrano Avenue Anaheim, California
References: Leighton and Associates, Inc., 2017, Geotechnical Exploration Report, Proposed Residential Development, 6501-6513 East Serrano Avenue, Anaheim, California, Project No. 11737.001, dated October 9, 2017.
Leighton and Associates, Inc., 2018, Response to Review Comments
Regarding Leighton’s Geotechnical Exploration Report for the Proposed Residential Development, 6501-6513 East Serrano Avenue, Anaheim, California, Project No. 11737.002, dated August 10, 2018.
In accordance with your request and authorization, Leighton and Associates, Inc. (Leighton) is pleased to present this addendum to our referenced geotechnical exploration report (Leighton, 2017) for the subject project. Based on review of the revised Site Plan for the project prepared by Hunsaker & Associates Irvine, Inc. and plot dated October 1, 2018, the proposed development plan changed slightly from what previously proposed at the time of our report (Leighton, 2017). The changes include reducing the number of dwellings from 60 to 58 dwellings, with slight changes to the configurations of the proposed buildings in the northeastern portion of the site. Based on review of the currently proposed site plan, the recommendations presented in our referenced report (Leighton, 2017) remain applicable.
G-115

11737.002
2
We appreciate the opportunity to be of continued service on this project. If you have any questions or if we can be of further service, please contact us at (866) LEIGHTON; specifically at the phone extensions or e-mail as listed below.
Respectfully submitted,
LEIGHTON AND ASSOCIATES, INC.
Jeffrey M. Pflueger, PG, CEG 2499 Associate Geologist Extension 4257, [email protected]
Vincent P. Ip, PE, GE 2522 Senior Principal Engineer Extension: 1682, [email protected]
JMP/VPI/lr
Distribution: (1) Addressee
G-116

2010 Crow Canyon Place, Suite 250 San Ramon, CA 94583 (925) 866-9000 Fax (888) 279-2698www.engeo.com
Project No. 14174.000.000
June 29, 2018
Ms. Karen HoltheSantiago Geologic Hazard Abatement DistrictCardinal Property Management825 N. Park Center Drive, Suite 101Santa Ana, CA 92705
Subject: 6501-6513 East Serrano AvenueAnaheim, California
RESIDENTIAL GRADING PLAN REVIEW
References: 1. Leighton and Associates, Inc., Geotechnical Exploration Report, 6501- 6513 East Serrano Avenue, Anaheim, CA 92807; October 9, 2017, Project No. 11737.001.
2. City of Anaheim, Department of Public Works; Review of Geotechnical Exploration Report for Proposed Residential Development, 6501-6513 East Serrano Avenue, Anaheim, CA 92807; OTH2018-01060, First Review,May 25, 2018.
3. Eberhart and Stone, Plan of Control, Prepared for Proposed Santiago Geologic Hazard Abatement District, Anaheim Hills, Anaheim, California, February 22, 1999.
4. Eberhart and Stone, Santiago Landslide Area Anaheim Hills, Geologic Hazard Abatement District Benefit Area, Anaheim, California.
Dear Ms. Holthe:
ENGEO, acting as the Santiago Geologic Hazard Abatement District (GHAD) Manager, reviewed the Leighton Geotechnical Exploration Report and City of Anaheim, Department of Public Works Review of Geotechnical Exploration Report for Proposed Residential Development (References 1 and 2) for 6501-6513 East Serrano Avenue in Anaheim, California (Subject Property). The purpose of our review was to address the City of Anaheim’s request that the applicant obtain written consent from the GHAD indicating that the proposed project will not significantly impact stability of the existing Santiago landslide.
As described in Reference 1, the planned residences will replace the existing commercial buildings and improvements. The residences will be two- to three-story attached multi-family residential buildings, with private drive aisles and guest parking. Onsite biofiltration is being considered for stormwater treatment and surface drainage will be directed away from the structures.
As described in the Leighton Geotechnical Exploration Report, artificial fill thickness varied beneath the Subject Property from 1 foot to greater than 76½ feet. Puente Formation bedrock was encountered in six of the eight exploratory borings underlying the artificial fill. Groundwater was not observed in the exploratory borings at the time of the Leighton exploration. Percolation testing was conducted at two of the exploratory boring locations to support design of the planned biofiltration improvements.
G-117

Santiago Geologic Hazard Abatement District 14174.000.0006501-6513 East Serrano Avenue, Anaheim June 29, 2018RESIDENTIAL GRADING PLAN REVIEW Page 2
The Subject Property is located northwest of the Santiago GHAD as shown on the Benefit Area Site Plan (Reference 4). The planned addition is not located within the Santiago GHAD or the mapped “Limit of Surface Damage” area. As stated in the Plan of Control (Reference 3), the formation on the Santiago landslide was caused by four primary factors:
1. North-facing hillside topography.2. Geologic structure as north-dipping strata and south-ancient faults.3. Geologically weak materials along critical sedimentary beds and faults.4. Rising groundwater.
Based on our review, it does not appear that construction of the planned residences and associated improvements, including biofiltration improvements, if constructed, would affect the Santiago landslide or the ongoing mitigation efforts by the Santiago GHAD. We make no representations as to the accuracy of dimensions, measurements, calculations or any portion of the design.
If you have any questions regarding the contents of this letter, please contact us.
Very truly yours,
ENGEO INCORPORATED
Haley Trindle Eric Harrell, CEGht/eh/jf
G-118