final eir appendix e geotechnical investigation e geotech... · geotechnical investigation los...
TRANSCRIPT
FINAL EIR APPENDIX E GEOTECHNICAL INVESTIGATION

GEOTECHNICAL INVESTIGATION LOS ANGELES STATE HISTORIC PARK
LOS ANGELES, CALIFORNIA
Prepared for
State of California DEPARTMENT OF PARKS AND RECREATION
Southern Service Center 8885 Rio San Diego Drive
San Diego, CA 92108
Prepared by
GROUP DELTA CONSULTANTS, INC. 32 Mauchly, Suite B
Irvine, California 92618 Tel. (949) 450-2100 Fax (949) 450-2108
GDC Project No. L-938 March 28, 2011


March 28, 2011 State of California Department Of Parks and Recreation Southern Service Center 8885 Rio San Diego Drive San Diego, CA 92108 Attention: Mr. Jeff Brown, RLA Project Manager Subject: Geotechnical Investigation
Los Angeles State Historic Park Los Angeles, California
Group Delta Project No. L-938 Master Services Agreement No. C08E0061 Dear Jeff: Group Delta Consultants, Inc. (GDC) is pleased to submit this report providing geotechnical recommendations for the subject project. Our work was performed in general accordance with our proposal dated October 19, 2010, our Master Services Agreement C08E0061, your work order 61-014678-08 dated December 13, 2010. We appreciate the opportunity to provide our services for this important project. If you have any questions or require additional information, please give us a call at (310) 320-5100 or (949) 450-2100. Sincerely, GROUP DELTA CONSULTANTS, INC. Thomas D. Swantko, GE Curt Scheyhing, GE Principal Geotechnical Engineer Senior Geotechnical Engineer Distribution: Addressee (1 PDF file via email and 3 signed originals)

N:\Projects\_LA\L900\L-938 LA State Historic Park\Report\L-938 LA State Historic Park Geotech rpt rev1.doc
TABLE OF CONTENTS Section Page 1.0 INTRODUCTION 1
1.1 Project Site Description and Background 1 1.2 Project Description 1 1.3 Purpose 1 1.4 Scope of Work 2
2.0 FIELD AND LABORATORY INVESTIGATION 3
2.1 Field Investigation 3 2.2 Laboratory Testing 3 2.3 Exploration Notes 3
3.0 SITE AND SUBSURFACE CONDITIONS 4
3.1 Site Conditions 4 3.2 Subsurface Conditions 4
3.2.1 Geology 4 3.2.2 Soil Conditions 4 3.2.3 Groundwater 5
4.0 ANALYSES AND RECOMMENDATIONS 7
4.1 Geologic and Seismic Hazards 7 4.1.1 Ground Surface Rupture 7 4.1.2 Deterministic and Probabilistic Seismic Hazard Analysis 7 4.1.3 2010 CBC Seismic Design Parameters 8 4.1.4 Liquefaction 8 4.1.5 Expansive Soils 9 4.1.6 Other Geologic and Seismic Hazards 10
4.2 Foundation Recommendations 10 4.2.1 Foundation Type 10 4.2.2 Expansive Soil Considerations for Footings, Slabs, & Hardscape 11
4.2.2.1 Low to Very Low Expansion Potential 11 4.2.2.2 Medium Expansion Potential 12
4.2.3 Slab-on-Grade Moisture Barrier 13 4.2.4 Methane Mitigation System 14 4.2.5 Spread Footings 14
4.2.5.1 Bearing Capacity 14 4.2.5.2 Lateral Resistance 15 4.2.5.3 Settlement 15 4.2.5.4 Footing Observation 15
4.2.6 Retaining Walls 15 4.3 Site Preparation and Grading 16
Geotechnical Investigation March 28, 2011 Los Angeles State Historic Park, Los Angeles, California Page ii State of California Department of Parks and Recreation Group Delta Project No. L-938
N:\Projects\_LA\L900\L-938 LA State Historic Park\Report\L-938 LA State Historic Park Geotech rpt rev1.doc
4.3.1 Clearing and Grubbing 16 4.3.2 Excavation 16 4.3.3 Subgrade Preparation 17 4.3.4 Fills 18 4.3.5 Earthwork Grading Factors 18 4.3.6 Permanent Slopes 19
4.4 Temporary Excavation and Shoring 19 4.5 Utility Trenches 19
4.5.1 Bedding 19 4.5.2 Backfill 20
4.6 Soil Corrosivity 20 4.7 Pavement Design 21
5.0 LIMITATIONS 23
6.0 REFERENCES 24
LIST OF TABLES Table 1 CBC 2010 / ASCE 7-05 Acceleration Response Spectra LIST OF FIGURES Figure 1A Vicinity Map Figure 1B Aerial Photograph Figures 2 (A-D) Exploration Location Plan Figure 3 Regional Geologic Map Figure 4 Geotechnical Cross-Section Figure 5a Highest Historical Groundwater Map Figure 5b Groundwater Contour Map Figure 6 Fault Map Figure 7 Liquefaction Zone Map Figure 8 Liquefaction and Seismic Settlement Analysis LIST OF APPENDICES Appendix A Field Investigation Appendix B Laboratory Testing Appendix C Site Photographs Appendix D Environmental Review Letter Appendix E LADBS Certificate of Compliance for Methane Test Data
N:\Projects\_LA\L900\L-938 LA State Historic Park\Report\L-938 LA State Historic Park Geotech rpt rev1.doc
GEOTECHNICAL INVESTIGATION LOS ANGELES STATE HISTORIC PARK
LOS ANGELES, CALIFORNIA
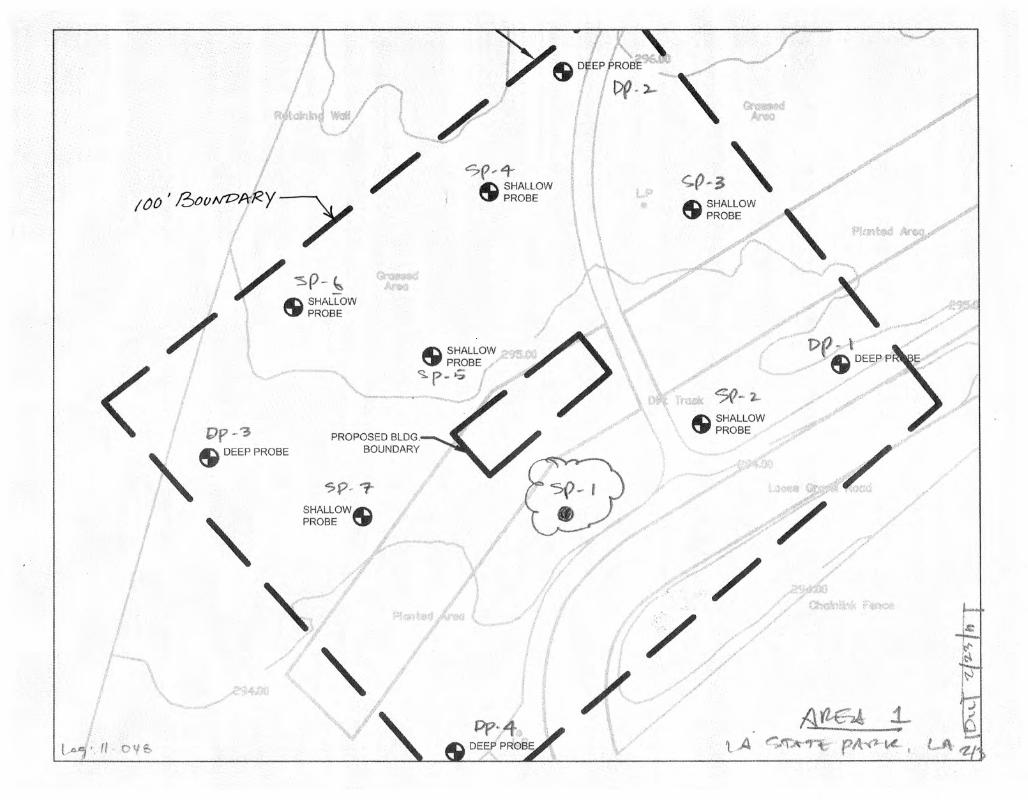
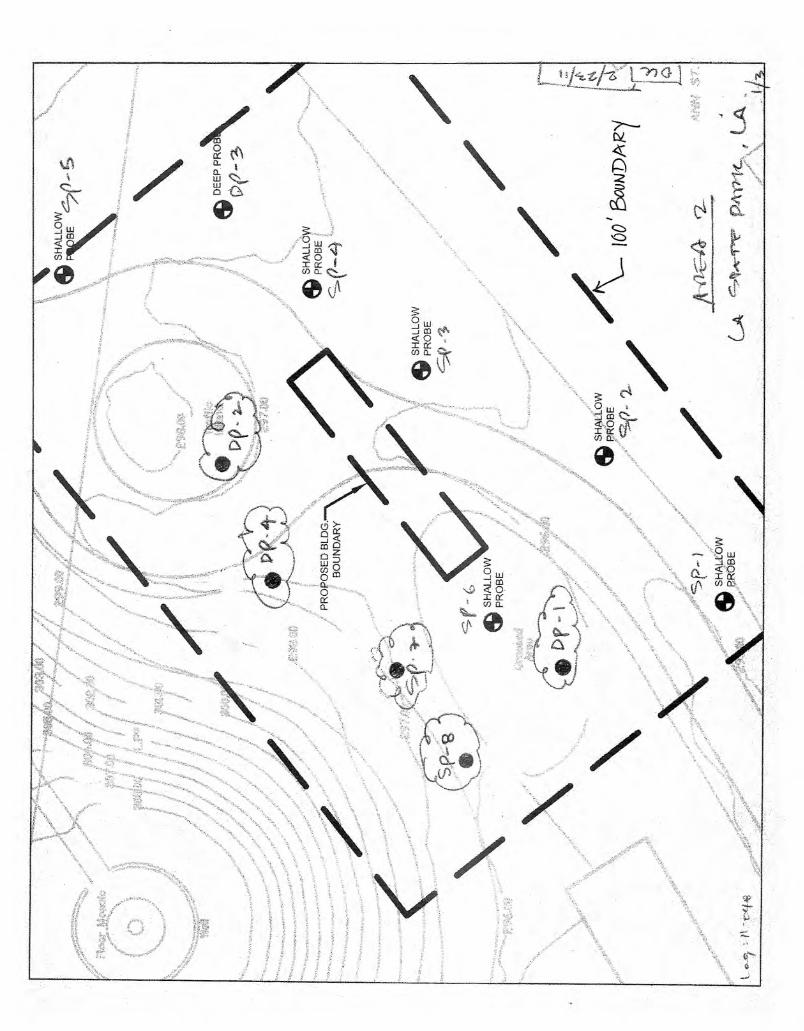
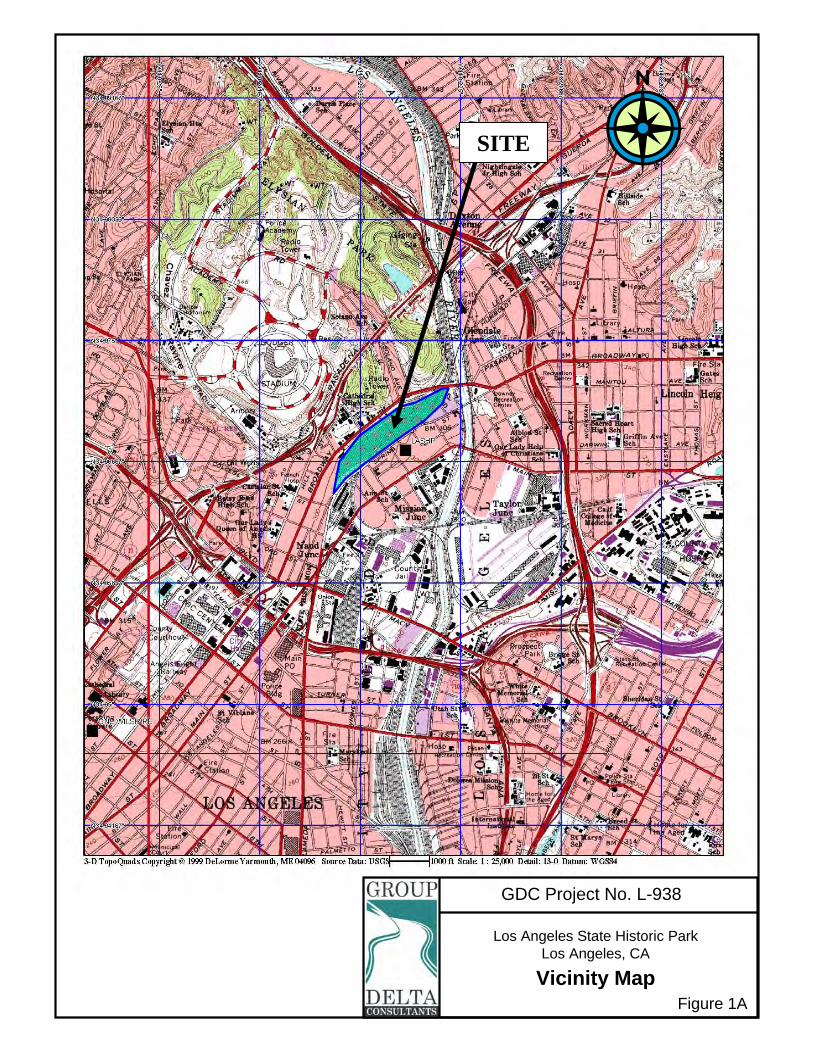
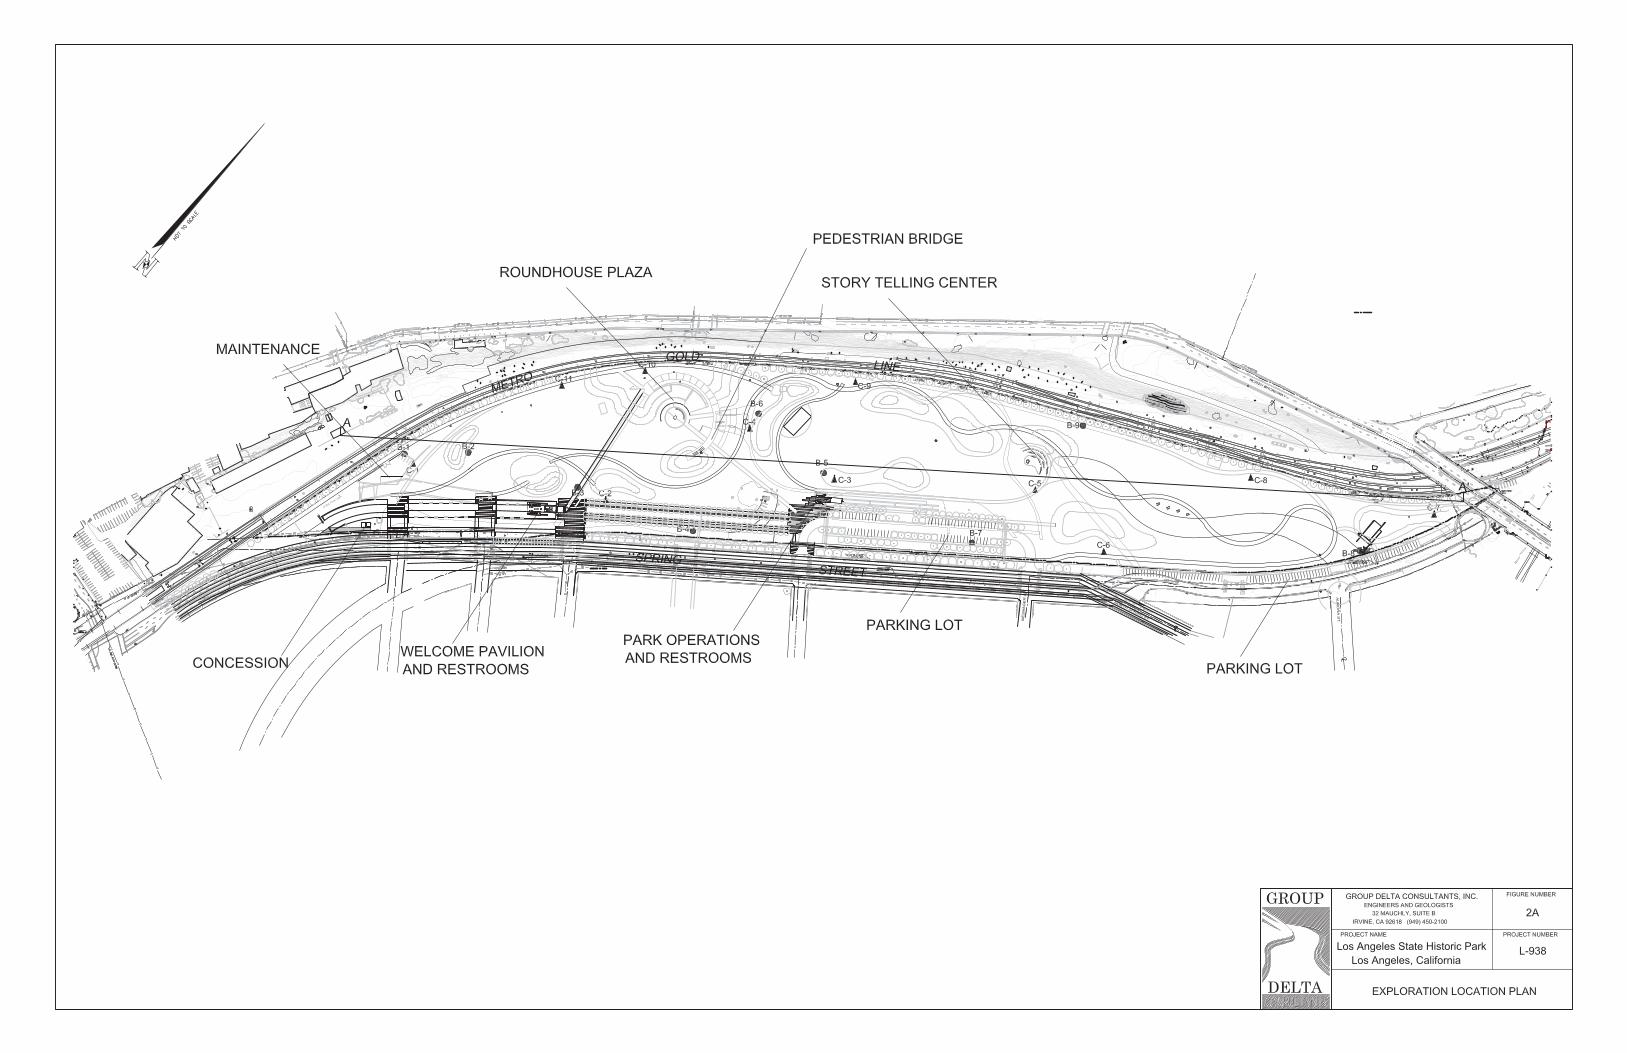
1.0 INTRODUCTION 1.1 Project Site Description and Background The Los Angeles State Historic Park site consists of approximately 32 acres located within a half mile from El Pueblo de Los Angeles Historical Monument and Los Angeles City Hall in the heart of downtown Los Angeles. The park is on a historical site known as “The Cornfield,” a site of remarkable social, historical, and cultural significance and the last vast open space in downtown Los Angeles. The northern end of the site is located approximately 150 feet from the Los Angeles River and the southern end is located approximately 150 feet from the Chinatown Gold Line commuter train station. The northern site boundary is the Metro Gold Line rail tracks, and the southern site boundary is North Spring Street. The site location and aerial photograph are shown in Figures 1A and 1B, and more detailed site topographic plans are shown in Figures 2A through 2D. 1.2 Project Description California Department of Parks and Recreation (DPR) is proposing to develop the full 32 acres of the park in phases. The major structural components of the park will consist of a Welcome Pavilion and Restroom Building, a Park Operations and Restroom Building, Roundhouse Plaza, Turntable Stage and Pedestrian Bridge. The Roundhouse Bridge will be the terminus of an anticipated future span over the existing railroad tracks and connect to a development planned along North Broadway at the intersection of Bishop Road. Future plans may connect the park to the adjacent Los Angeles River. Other improvements include a maintenance building, concession stand, parking lots, story telling center, pathways, hardscape, earthen mounds, grass and other landscaping. 1.3 Purpose The purpose of our study was to conduct a geotechnical engineering investigation of the site and subsurface conditions to provide geotechnical information and recommendations for design and construction of the proposed improvements. In addition, a preliminary review was made of available environmental data for the site, and a methane soil gas investigation was performed. The results of our environmental review and methane studies are provided separately as Appendix D and Appendix E of this report.

Geotechnical Investigation March 28, 2011 Los Angeles State Historic Park, Los Angeles, California Page 2 State of California Department of Parks and Recreation Group Delta Project No. L-938
N:\Projects\_LA\L900\L-938 LA State Historic Park\Report\L-938 LA State Historic Park Geotech rpt rev1.doc
1.4 Scope of Work Our scope of work included the following: Review of available geologic and seismic information;
Site reconnaissance;
Marking and clearing utilities through State Park personnel and DigAlert;
Coordination with State Parks archaeological and maintenance staff;
Performing subsurface investigation including nine hollow-stem auger borings and 11 Cone Penetration Tests;
Performing laboratory testing on samples recovered from the borings;
Performing engineering analyses and developing geotechnical recommendations for project design;
Perform a preliminary environmental review and methane soil gas investigation;
Preparing a letter report summarizing the findings and conclusions of the environmental review (see Appendix D);
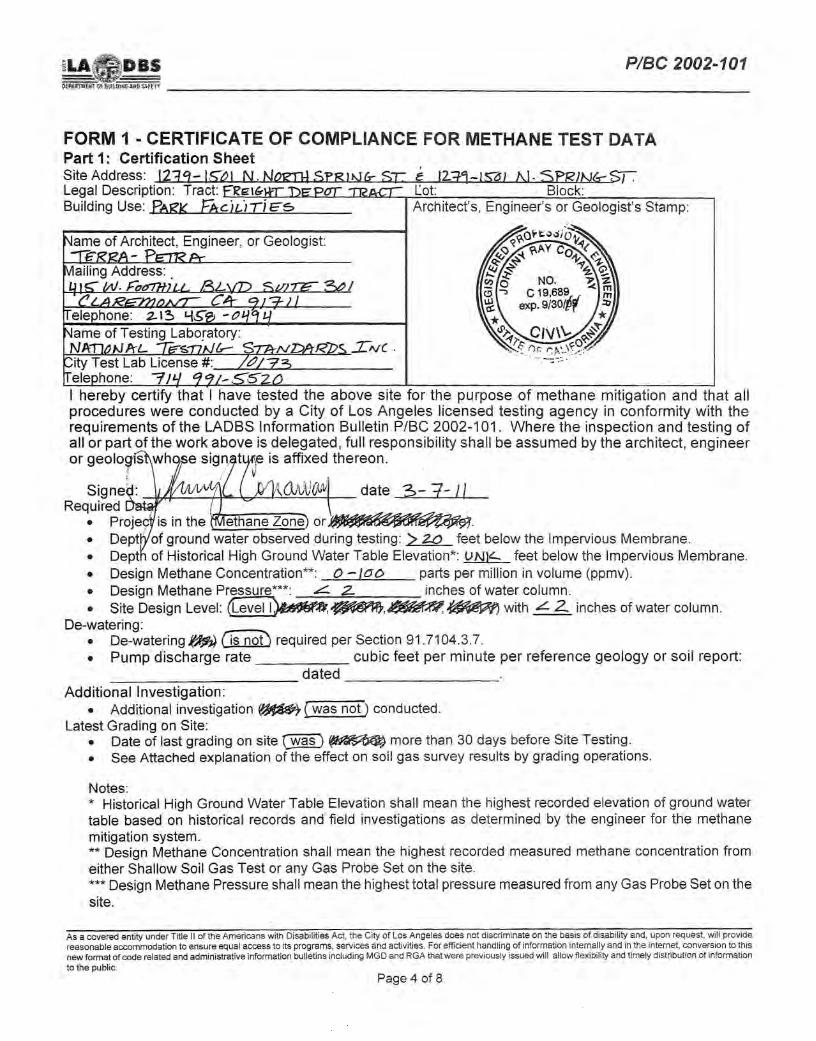
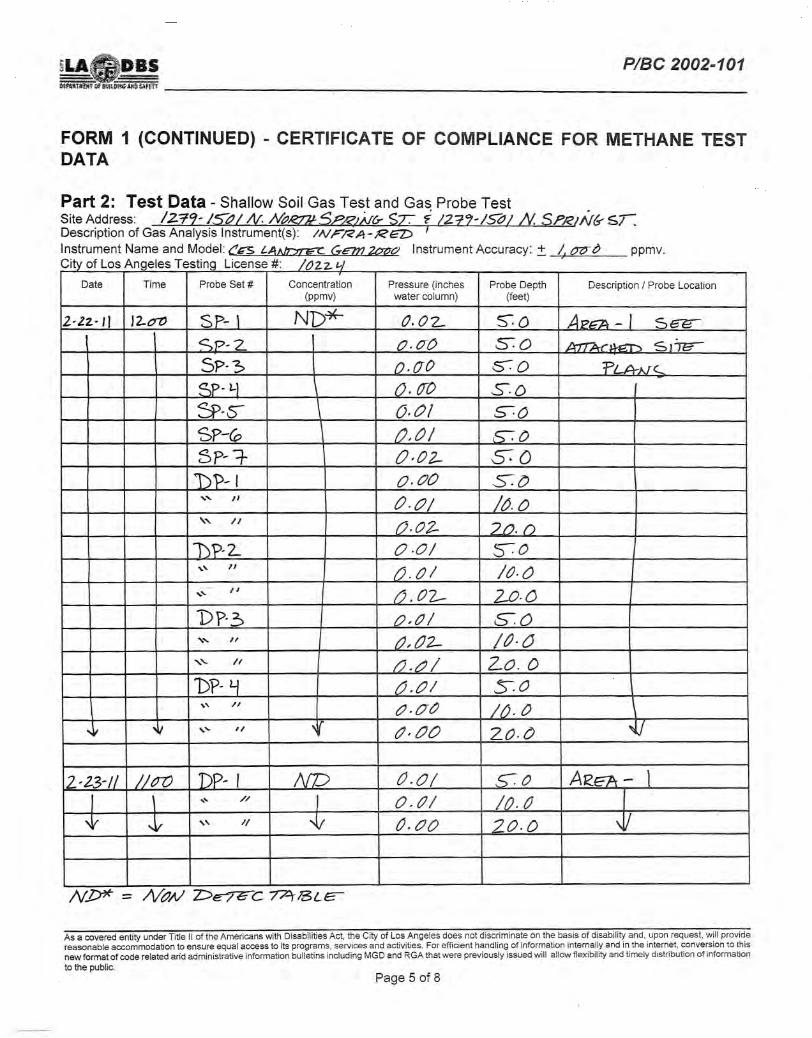
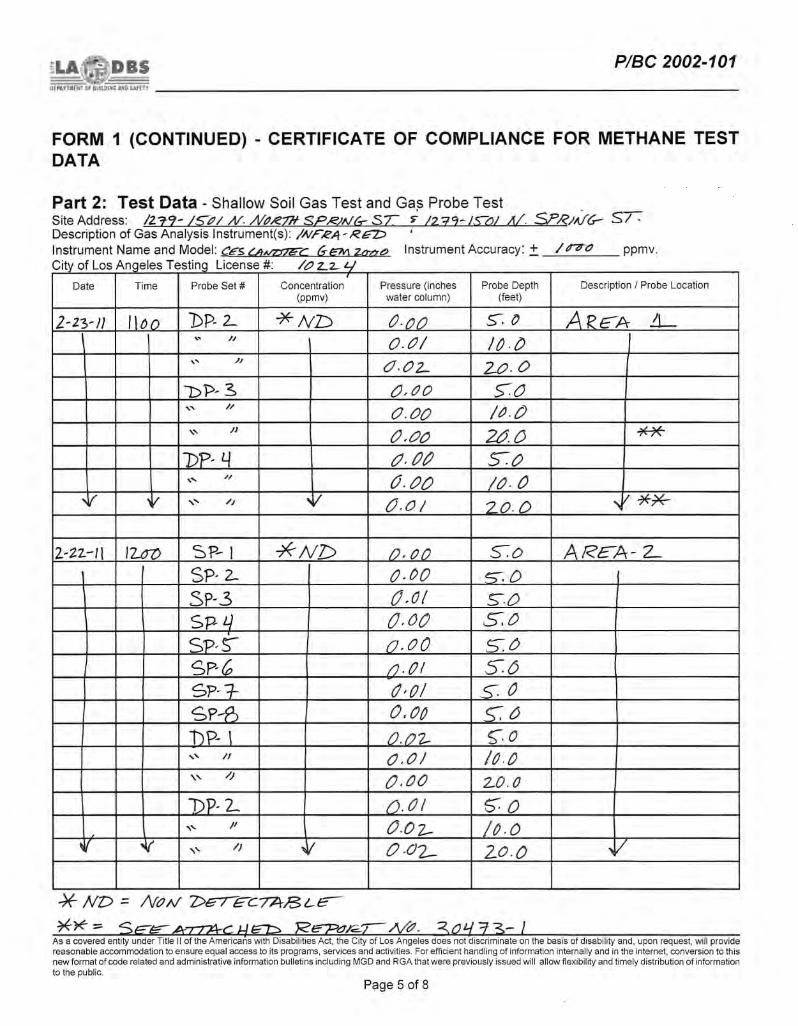
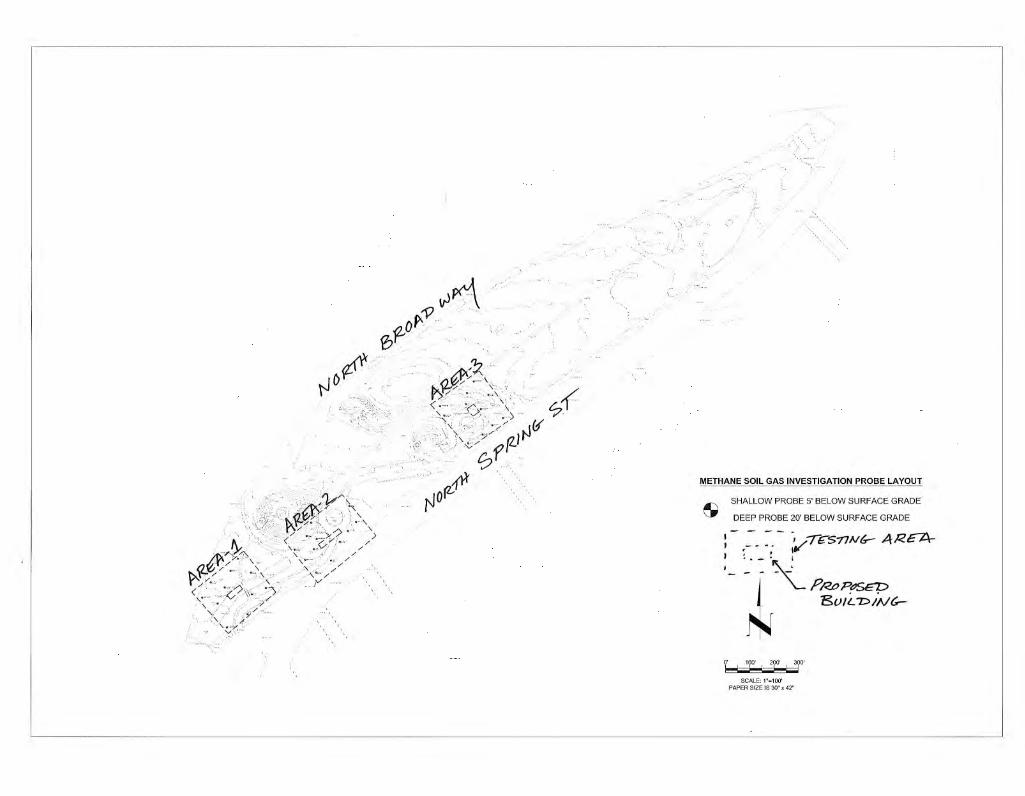
Preparing an LADBS Certificate of Compliance for Methane Test Data, Form 1, and a report to summarize the methane gas investigation and mitigation requirements for the proposed new construction (see Appendix E);
Presenting the data, conclusions, and recommendations of our geotechnical investigation in this report.
Our scope of work did not include environmental site investigation.
Geotechnical Investigation March 28, 2011 Los Angeles State Historic Park, Los Angeles, California Page 3 State of California Department of Parks and Recreation Group Delta Project No. L-938
N:\Projects\_LA\L900\L-938 LA State Historic Park\Report\L-938 LA State Historic Park Geotech rpt rev1.doc
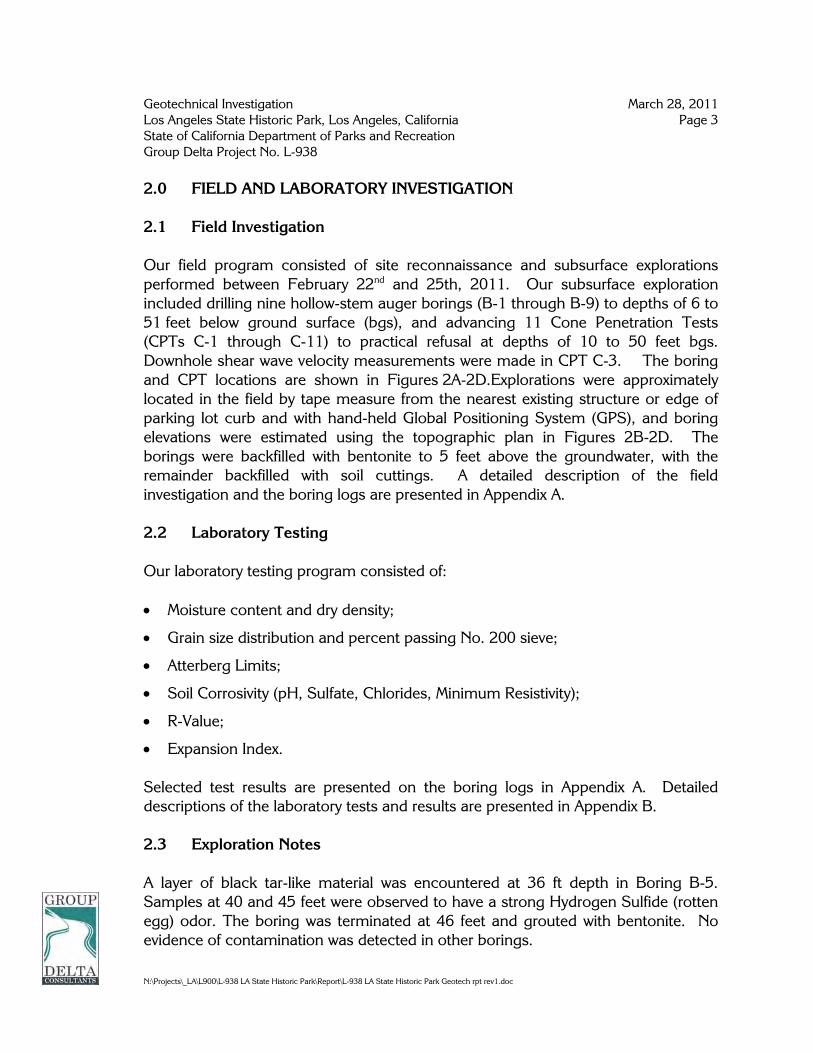
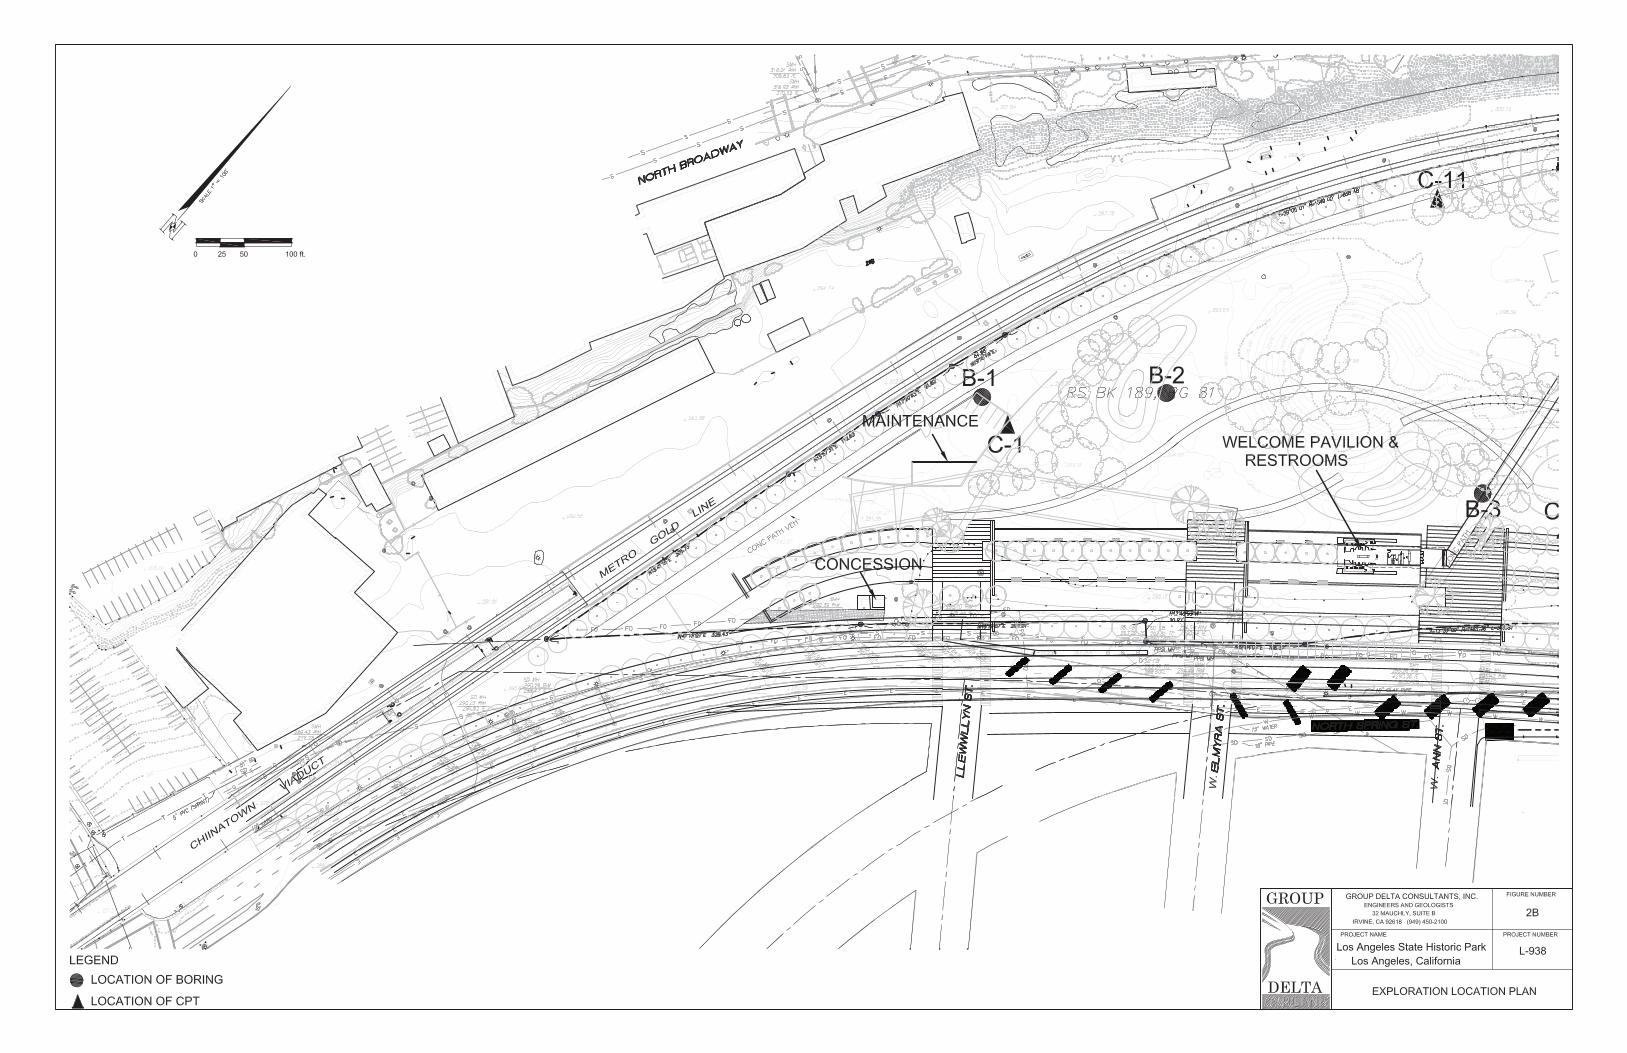
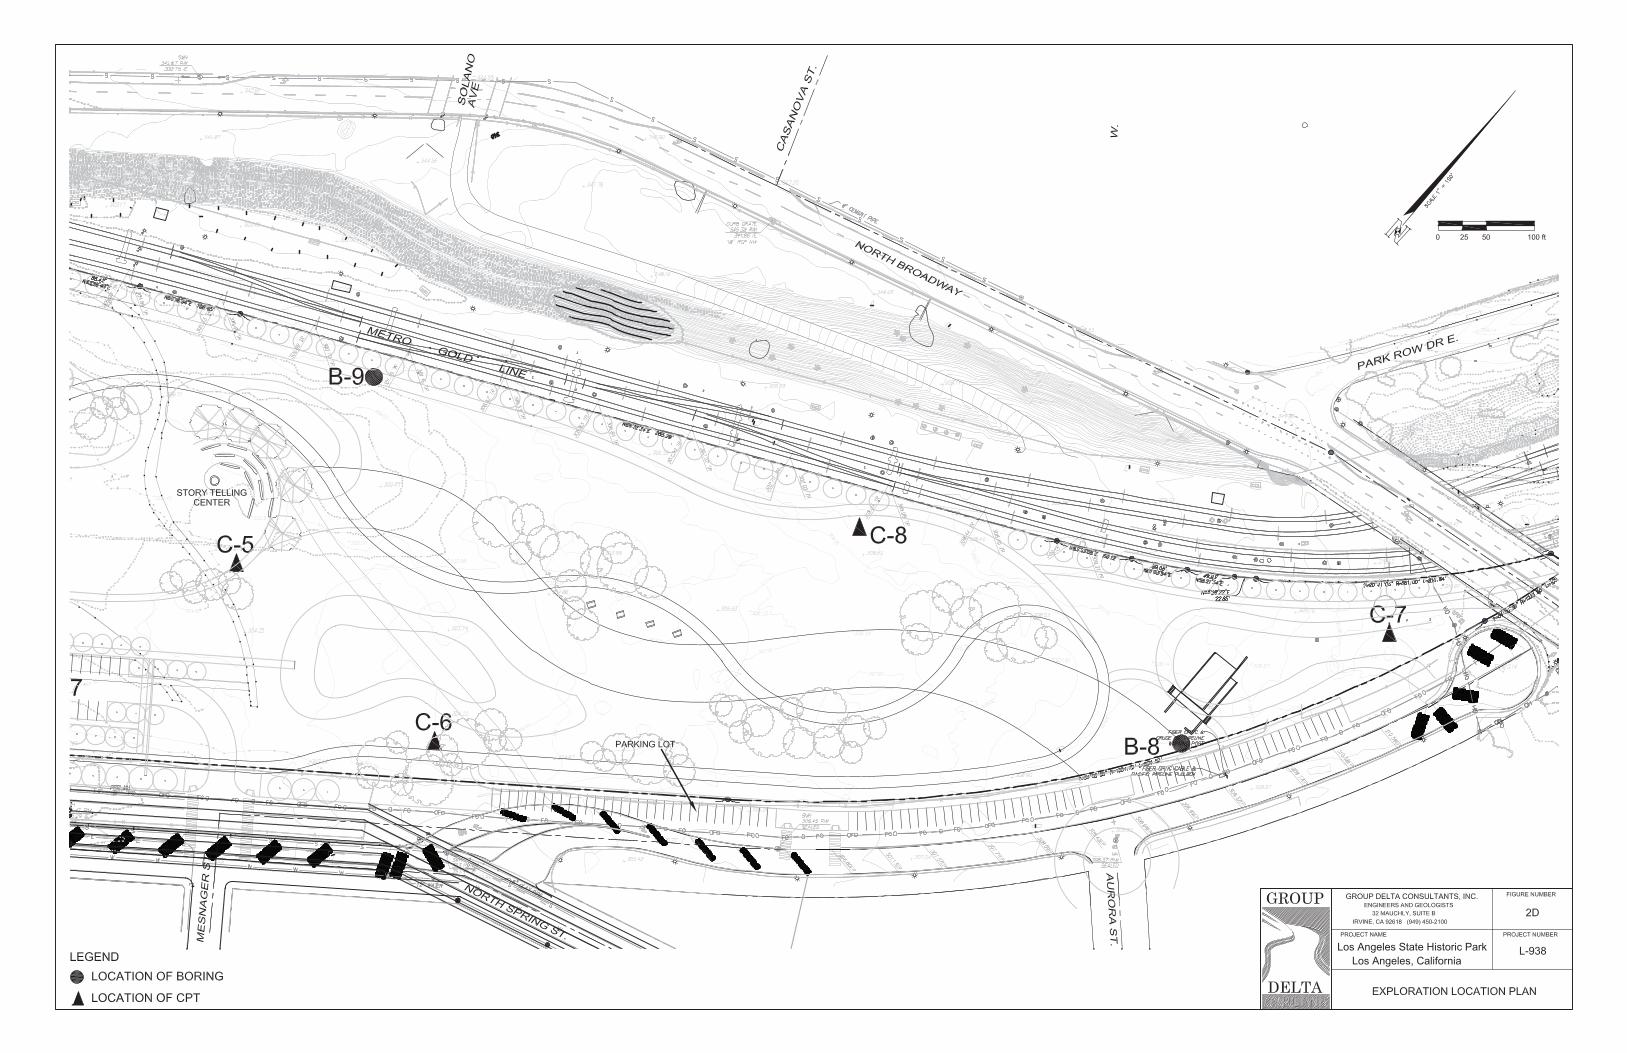
2.0 FIELD AND LABORATORY INVESTIGATION 2.1 Field Investigation Our field program consisted of site reconnaissance and subsurface explorations performed between February 22nd and 25th, 2011. Our subsurface exploration included drilling nine hollow-stem auger borings (B-1 through B-9) to depths of 6 to 51 feet below ground surface (bgs), and advancing 11 Cone Penetration Tests (CPTs C-1 through C-11) to practical refusal at depths of 10 to 50 feet bgs. Downhole shear wave velocity measurements were made in CPT C-3. The boring and CPT locations are shown in Figures 2A-2D.Explorations were approximately located in the field by tape measure from the nearest existing structure or edge of parking lot curb and with hand-held Global Positioning System (GPS), and boring elevations were estimated using the topographic plan in Figures 2B-2D. The borings were backfilled with bentonite to 5 feet above the groundwater, with the remainder backfilled with soil cuttings. A detailed description of the field investigation and the boring logs are presented in Appendix A. 2.2 Laboratory Testing Our laboratory testing program consisted of: Moisture content and dry density;
Grain size distribution and percent passing No. 200 sieve;
Atterberg Limits;
Soil Corrosivity (pH, Sulfate, Chlorides, Minimum Resistivity);
R-Value;
Expansion Index. Selected test results are presented on the boring logs in Appendix A. Detailed descriptions of the laboratory tests and results are presented in Appendix B. 2.3 Exploration Notes A layer of black tar-like material was encountered at 36 ft depth in Boring B-5. Samples at 40 and 45 feet were observed to have a strong Hydrogen Sulfide (rotten egg) odor. The boring was terminated at 46 feet and grouted with bentonite. No evidence of contamination was detected in other borings.
Geotechnical Investigation March 28, 2011 Los Angeles State Historic Park, Los Angeles, California Page 4 State of California Department of Parks and Recreation Group Delta Project No. L-938
N:\Projects\_LA\L900\L-938 LA State Historic Park\Report\L-938 LA State Historic Park Geotech rpt rev1.doc
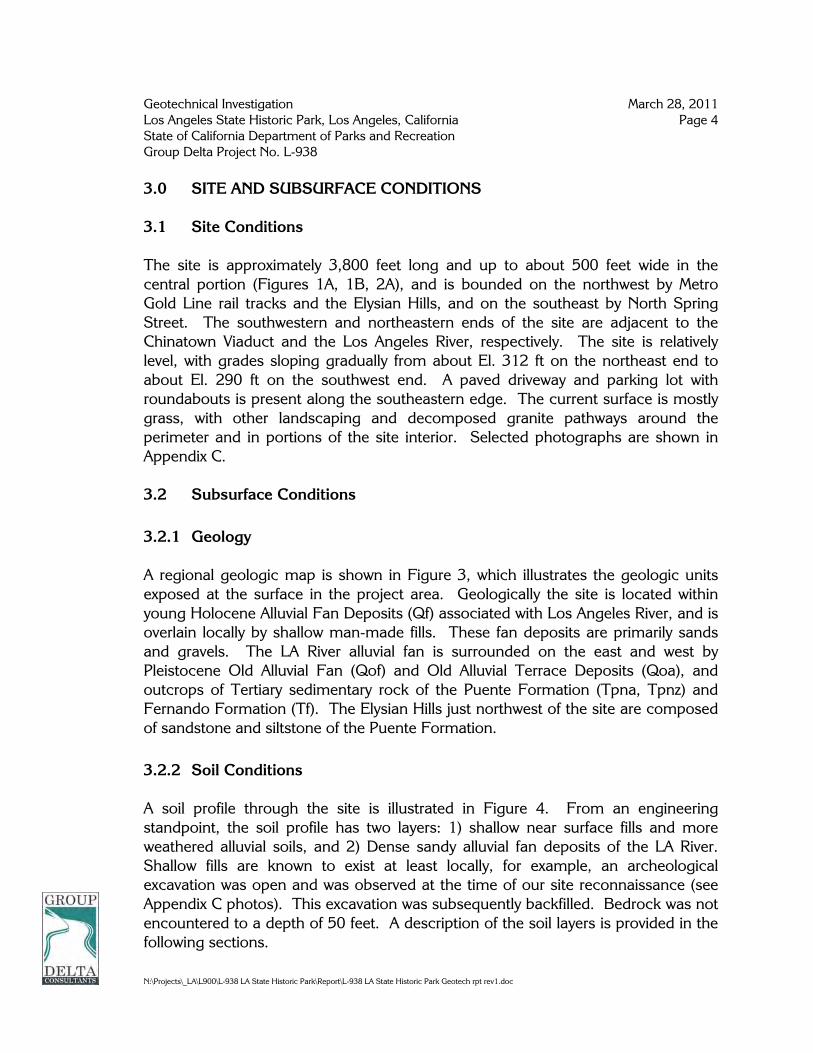
3.0 SITE AND SUBSURFACE CONDITIONS 3.1 Site Conditions The site is approximately 3,800 feet long and up to about 500 feet wide in the central portion (Figures 1A, 1B, 2A), and is bounded on the northwest by Metro Gold Line rail tracks and the Elysian Hills, and on the southeast by North Spring Street. The southwestern and northeastern ends of the site are adjacent to the Chinatown Viaduct and the Los Angeles River, respectively. The site is relatively level, with grades sloping gradually from about El. 312 ft on the northeast end to about El. 290 ft on the southwest end. A paved driveway and parking lot with roundabouts is present along the southeastern edge. The current surface is mostly grass, with other landscaping and decomposed granite pathways around the perimeter and in portions of the site interior. Selected photographs are shown in Appendix C. 3.2 Subsurface Conditions 3.2.1 Geology A regional geologic map is shown in Figure 3, which illustrates the geologic units exposed at the surface in the project area. Geologically the site is located within young Holocene Alluvial Fan Deposits (Qf) associated with Los Angeles River, and is overlain locally by shallow man-made fills. These fan deposits are primarily sands and gravels. The LA River alluvial fan is surrounded on the east and west by Pleistocene Old Alluvial Fan (Qof) and Old Alluvial Terrace Deposits (Qoa), and outcrops of Tertiary sedimentary rock of the Puente Formation (Tpna, Tpnz) and Fernando Formation (Tf). The Elysian Hills just northwest of the site are composed of sandstone and siltstone of the Puente Formation. 3.2.2 Soil Conditions A soil profile through the site is illustrated in Figure 4. From an engineering standpoint, the soil profile has two layers: 1) shallow near surface fills and more weathered alluvial soils, and 2) Dense sandy alluvial fan deposits of the LA River. Shallow fills are known to exist at least locally, for example, an archeological excavation was open and was observed at the time of our site reconnaissance (see Appendix C photos). This excavation was subsequently backfilled. Bedrock was not encountered to a depth of 50 feet. A description of the soil layers is provided in the following sections.

Geotechnical Investigation March 28, 2011 Los Angeles State Historic Park, Los Angeles, California Page 5 State of California Department of Parks and Recreation Group Delta Project No. L-938
N:\Projects\_LA\L900\L-938 LA State Historic Park\Report\L-938 LA State Historic Park Geotech rpt rev1.doc
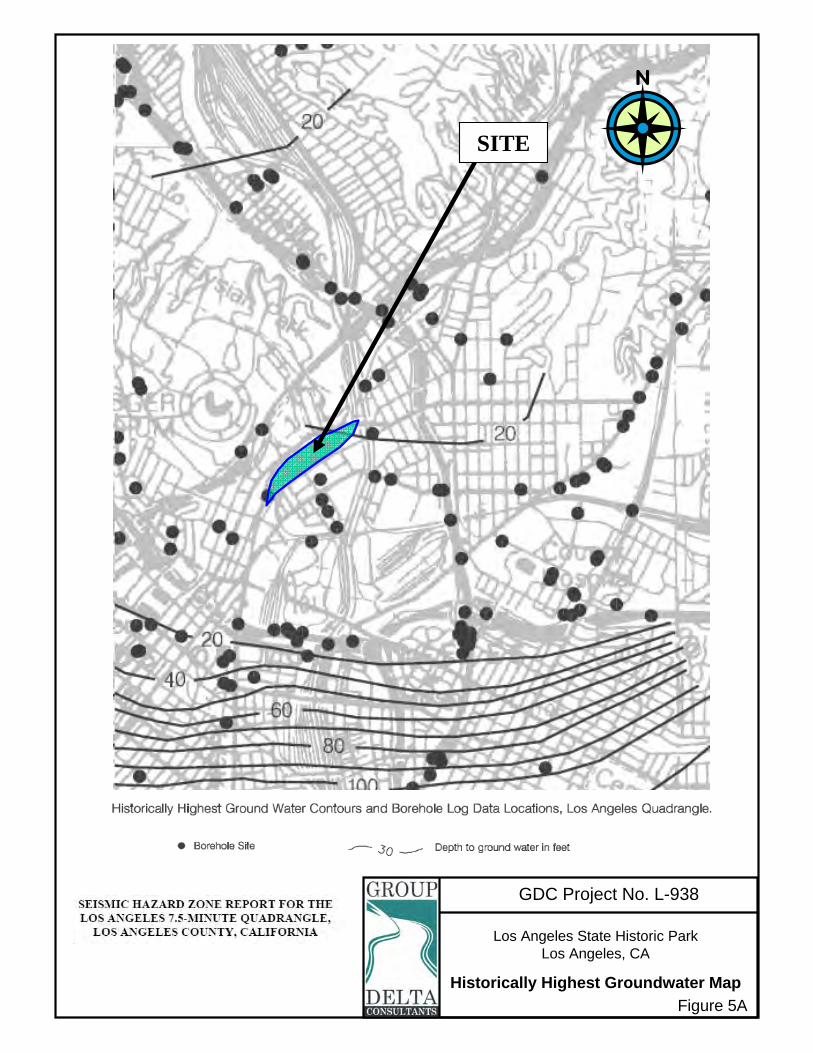
Layer 1: Fill and Upper Alluvium The upper soil horizon at the site is less consolidated and locally contains clayey topsoil and shallow undocumented fills. This layer is typically on the order of 5 feet thick. Clayey topsoil was encountered in some borings to a depth of up to 2 feet. The Layer 1 soils consist of interbedded stiff to hard lean clays and silts (Cl, ML), and medium dense to dense sands (SP, SP-SM, SW-SM), silty sands (SM), and clayey sands (SC). Localized zones of cobbles were observed, particularly in the roundhouse area (see archeological excavation photos in Appendix C). Since the shallow fill and upper alluvial soils are difficult to differentiate, for simplicity we have labeled this layer as Fill on the boring logs. Standard Penetration Test (SPT) penetration resistance or blowcount (N60) from borings and CPT correlations in sandy layers ranges from 16 to more than 50 blows per foot (average 35). Undrained shear strength from CPT interpretation ranges from 1.2 to more than 4 ksf (average more than 3 ksf). Percent passing No. 200 sieve ranges from 3 to 66% (average 24%). Mixtures of clay and silt collected from blended auger cuttings in the upper 5 ft had tested Expansion Index (EI) of 7 to 10 (very low expansion potential). A sample of Sandy Lean Clay (CL) topsoil in the upper 2 feet was collected and tested and had 66% passing No. 200 sieve, EI of 57 (medium expansion potential), Liquid Limit of 44, and Plasticity Index of 25. A sample of near surface soil had R-Value of 81. Layer 2: Alluvium Alluvial soils below Layer 1 generally consist of dense to very dense mixtures of sand, gravel, and silt (SP, SP-SM, SW-SM, SM) with occasional lenses of hard silts (ML) and hard lean clays with sand (CL). SPT N60 in granular layers generally ranges from 30 to more than 100 blows per foot (average >50). Cohesive layers generally have undrained shear strength of 2 to greater than 4 ksf (average >4). Tested percent passing No. 200 sieve in the sands ranges from 3 to 40% (average 15%). A layer of Lean Clay (CL) was tested and had 74% passing No. 200 sieve, Liquid Limit of 33, and Plasticity Index of 12. 3.2.3 Groundwater Highest historical groundwater levels at the site as reported by California Geological Survey Seismic Hazard Zone Report for the Los Angeles 7.5-minute Quadrangle is

Geotechnical Investigation March 28, 2011 Los Angeles State Historic Park, Los Angeles, California Page 6 State of California Department of Parks and Recreation Group Delta Project No. L-938
N:\Projects\_LA\L900\L-938 LA State Historic Park\Report\L-938 LA State Historic Park Geotech rpt rev1.doc
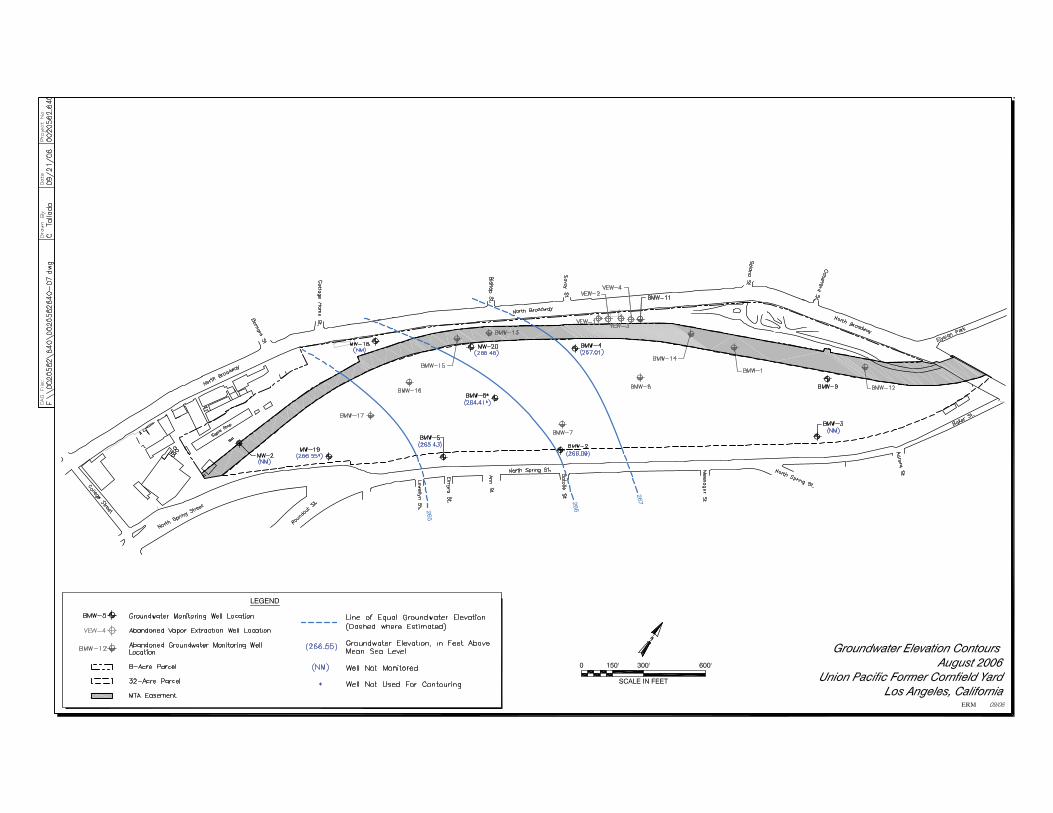
at a depth of about 20 feet, as shown in Figure 5A. More recent data from our investigation (Figure 4) indicated groundwater depths of 33.5 to 34 feet in Borings B-1 and B-2. Prior to our investigation, monitoring wells were installed at the site by others (ERM West, October 2006, Figure 5B) as part of an environmental investigation, and groundwater levels were monitored for a six year period between 2000 and 2006. The well data generally show the highest permanent groundwater levels during this period ranged from a depth of about 25 to 35 feet below the site grades, with a flow gradient following the natural topography towards the southwest. Groundwater levels may fluctuate with water levels in the adjacent river, but would not be expected to rise above a depth of 20 feet. Locally shallower perched groundwater could be present due to seepage from upslope or man-made sources such as leaking utilities.
Geotechnical Investigation March 28, 2011 Los Angeles State Historic Park, Los Angeles, California Page 7 State of California Department of Parks and Recreation Group Delta Project No. L-938
N:\Projects\_LA\L900\L-938 LA State Historic Park\Report\L-938 LA State Historic Park Geotech rpt rev1.doc
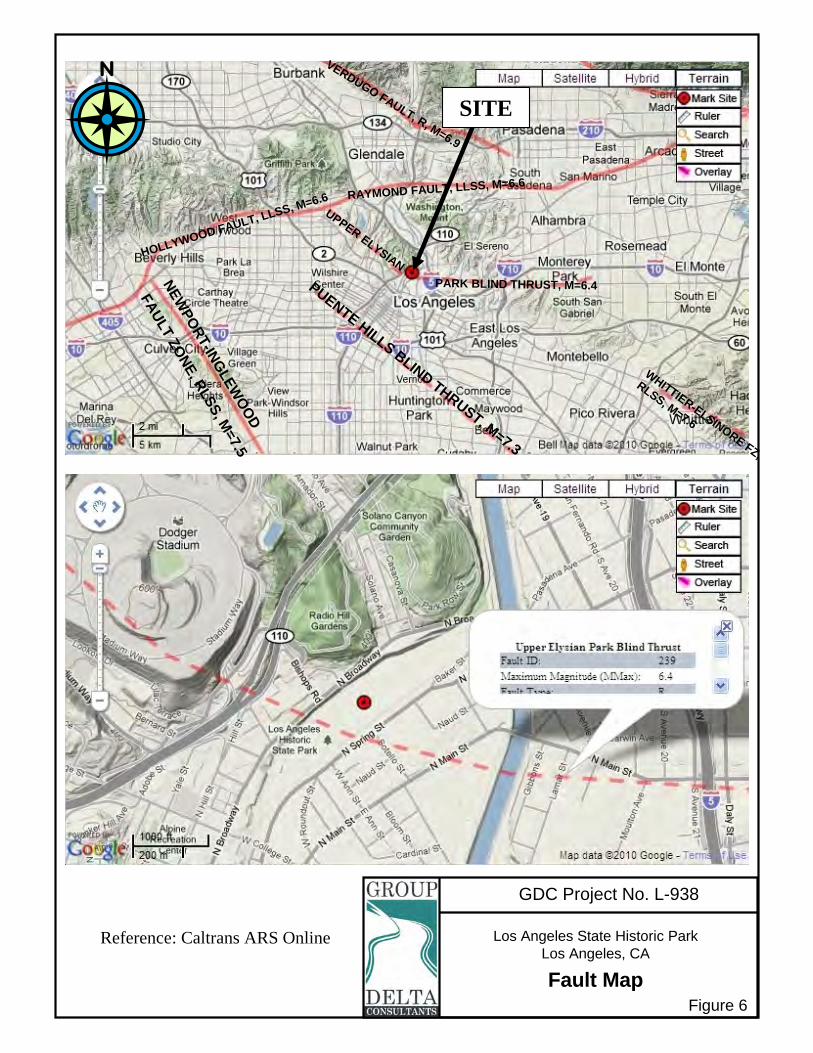
4.0 ANALYSES AND RECOMMENDATIONS 4.1 Geologic and Seismic Hazards Potential geologic and seismic hazards for any site include ground rupture, seismic shaking, liquefaction, seismic compaction and settlement, expansive soils, collapsible soils, slope instability, lateral spreading, ground lurching, subsidence, and tsunamis / flooding. The site is located in a seismically active area. Ground shaking due to nearby and distant earthquakes should be anticipated during the life of the project. The seismic hazards are discussed in the following paragraphs. 4.1.1 Ground Surface Rupture The site is located in close proximity to a number of active earthquake faults including the Upper Elysian Park Blind Thrust (Moment Magnitude Mw=6.5 reverse (R) fault), Puente Hills Blind Thrust (Mw=7.3, R), Hollywood and Raymond Faults (Mw=6.6, left lateral strike slip (LLSS) faults), Newport-Inglewood Fault Zone (Mw=7.5, right lateral strike slip (RLSS) fault), and Whittier-Elsinore Fault Zone (Mw=7.6, RLSS) as shown in Figure 6. The site is not located within a mapped Alquist Priolo Earthquake Fault Zone, and no active or potentially active faults capable of fault rupture are known to cross the site. The Upper Elysian Park and Puente Hills Blind Thrust Faults are located directly below the site, but the depth to rupture surface is at least 3 km. Therefore, potential for fault rupture is considered remote. 4.1.2 Deterministic and Probabilistic Seismic Hazard Analysis The site is located at the following approximate coordinates: Latitude: 34.0685 degrees North Longitude: -118.2323 degrees West Shear wave velocity was measured downhole in Cone Penetration Test C-3 to a depth of 20 feet where the CPT reached refusal. These measurements indicated shear wave velocity in the upper 20 feet ranging from 1340 to 1520 feet per second. To determine shear wave velocity in the upper 100 feet or 30 meters (Vs30), we used published correlations and data from CPT C-1 extrapolated to 100 ft depth. The estimated Vs30 value is 1365 feet per second (416 meters per second), and therefore
Geotechnical Investigation March 28, 2011 Los Angeles State Historic Park, Los Angeles, California Page 8 State of California Department of Parks and Recreation Group Delta Project No. L-938
N:\Projects\_LA\L900\L-938 LA State Historic Park\Report\L-938 LA State Historic Park Geotech rpt rev1.doc
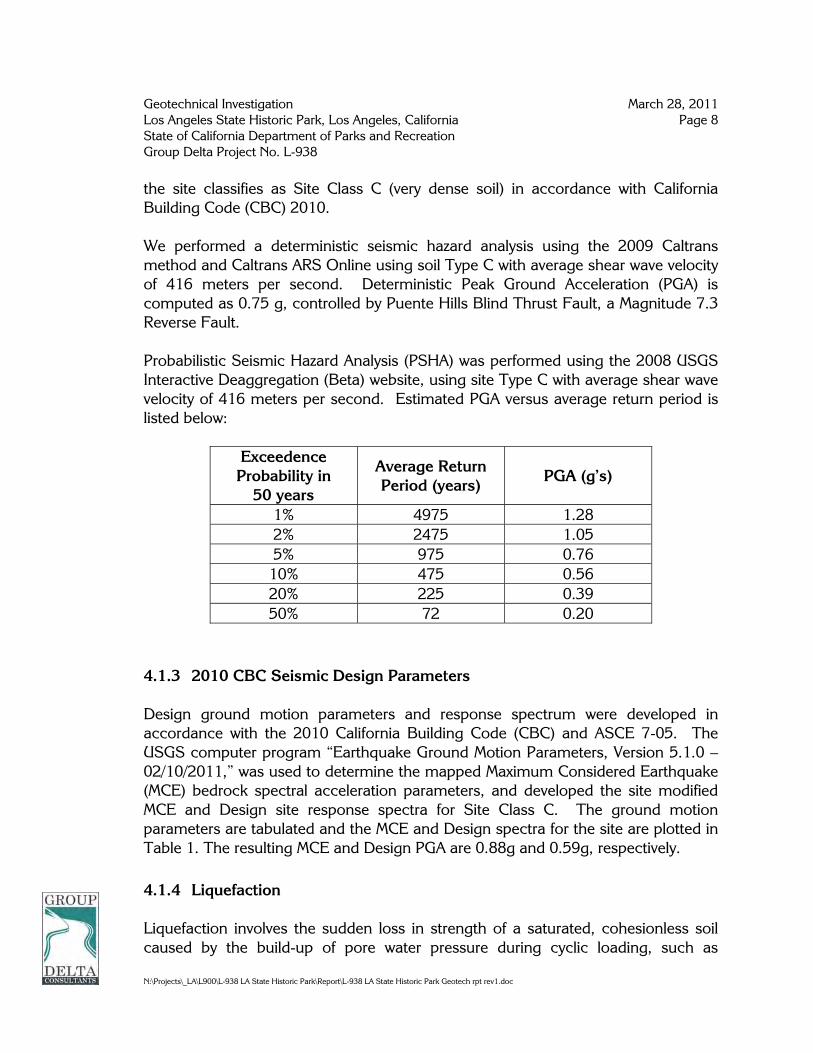
the site classifies as Site Class C (very dense soil) in accordance with California Building Code (CBC) 2010. We performed a deterministic seismic hazard analysis using the 2009 Caltrans method and Caltrans ARS Online using soil Type C with average shear wave velocity of 416 meters per second. Deterministic Peak Ground Acceleration (PGA) is computed as 0.75 g, controlled by Puente Hills Blind Thrust Fault, a Magnitude 7.3 Reverse Fault. Probabilistic Seismic Hazard Analysis (PSHA) was performed using the 2008 USGS Interactive Deaggregation (Beta) website, using site Type C with average shear wave velocity of 416 meters per second. Estimated PGA versus average return period is listed below:
Exceedence Probability in
50 years
Average Return Period (years)
PGA (g’s)
1% 4975 1.28 2% 2475 1.05 5% 975 0.76
10% 475 0.56 20% 225 0.39 50% 72 0.20
4.1.3 2010 CBC Seismic Design Parameters Design ground motion parameters and response spectrum were developed in accordance with the 2010 California Building Code (CBC) and ASCE 7-05. The USGS computer program “Earthquake Ground Motion Parameters, Version 5.1.0 – 02/10/2011,” was used to determine the mapped Maximum Considered Earthquake (MCE) bedrock spectral acceleration parameters, and developed the site modified MCE and Design site response spectra for Site Class C. The ground motion parameters are tabulated and the MCE and Design spectra for the site are plotted in Table 1. The resulting MCE and Design PGA are 0.88g and 0.59g, respectively. 4.1.4 Liquefaction Liquefaction involves the sudden loss in strength of a saturated, cohesionless soil caused by the build-up of pore water pressure during cyclic loading, such as
Geotechnical Investigation March 28, 2011 Los Angeles State Historic Park, Los Angeles, California Page 9 State of California Department of Parks and Recreation Group Delta Project No. L-938
N:\Projects\_LA\L900\L-938 LA State Historic Park\Report\L-938 LA State Historic Park Geotech rpt rev1.doc
produced by an earthquake, and where it occurs its effects can include vertical and lateral ground displacements, slope instability and lateral spreading, and bearing failure. For liquefaction to occur, all of the following must be present:
Liquefaction susceptible soils (loose to medium dense cohesionless soils); Groundwater within 50 feet of the surface; Strong Shaking, such as caused by an earthquake.
Due to location in an area of Holocene alluvium and relatively shallow groundwater, the site is located in a mapped State of California Seismic Hazard Zone for Liquefaction (see Figure 7), and is also in the “Areas Susceptible to Liquefaction” map in the City of LA Safety Element. Highest historical groundwater levels are reported at a depth of about 20 feet (Figure 5A) and current groundwater levels appear to be at a depth of 25 to 35 feet (Figure 5B). However, site specific investigation shows that the alluvial soils below the highest groundwater levels are very dense sands and hard clays and silts, which are generally considered non-liquefiable. To verify this, we performed liquefaction calculations using data from CPT C-1, a high groundwater depth of 20 feet, earthquake magnitude of Mw=6.6 from USGS probabilistic deaggregation, and code maximum considered PGA of 0.88g. The analysis indicates that liquefaction potential is negligible with calculated liquefaction settlements of 0.05 inches (see Figure 8). On this basis, liquefaction has negligible impact to the design and requires no mitigation. 4.1.5 Expansive Soils The proposed building areas of the site typically have a surface layer of up to about 2 feet of clay topsoil, underlain by sands and silty sands. Two samples consisting of a blend of auger cuttings (including the clay and silty sand) in the upper 5 feet were tested for Expansion Index (EI) in accordance with ASTM D 4829, and had EI values of 7 and 10. A sample of just the clay material was obtained from Boring B-2 and test results indicated an EI of 57. ASTM D 4829 defines expansion potential qualitatively in terms of the Expansion Index (EI) as follows:

Geotechnical Investigation March 28, 2011 Los Angeles State Historic Park, Los Angeles, California Page 10 State of California Department of Parks and Recreation Group Delta Project No. L-938
N:\Projects\_LA\L900\L-938 LA State Historic Park\Report\L-938 LA State Historic Park Geotech rpt rev1.doc
EI Expansion Potential 0-20 Very Low 21-50 Low 51-90 Medium 91-130 High >130 Very High The samples consisting of a blend of material in the upper 5 feet classify as “Very Low” expansion potential, and the near surface clayey topsoil classifies as “Medium” expansion potential. When expansive soils become wet they can expand, resulting in damage to structures, slabs, pavements, and retaining walls. Potential for expansion should be considered as recommended later in this report. 4.1.6 Other Geologic and Seismic Hazards Seismic shaking can also cause soil compaction and ground settlement without liquefaction occurring, including settlement of dry clean sands above the water table. Due to density of granular soils at the building sites seismic compaction hazard is negligible. The site is fairly level in the vicinity of the structures; therefore, static or seismic slope instability or lateral spreading or ground lurching is not considered a significant hazard for the building sites. In the City of LA Safety Element the site is not located on the “Landslide Inventory and Hillside Area” map. Due to its high elevation, the site is not subject to hazards from tsunamis; however, a portion of the site is within a “potential inundation area” from dam failure or seiche as shown on the “Inundation & Tsunami Hazard Areas” map in City of LA Safety Element. The site is not mapped in a 100-yr or 500-yr flood area. A portion of the site is mapped within the LA City Oil Field, as shown in the “Oil Field and Oil Drilling Areas” in the City of LA Safety Element. The site is located within a City methane zone; refer to Section 4.2.4 for mitigation. 4.2 Foundation Recommendations 4.2.1 Foundation Type No foundation loads are available, and structure locations have not been finalized. The anticipated buildings are single story light frame structures. The pedestrian bridge may have higher loads than the buildings, but loads are anticipated to be moderate. The proposed building structures may be supported on shallow spread
Geotechnical Investigation March 28, 2011 Los Angeles State Historic Park, Los Angeles, California Page 11 State of California Department of Parks and Recreation Group Delta Project No. L-938
N:\Projects\_LA\L900\L-938 LA State Historic Park\Report\L-938 LA State Historic Park Geotech rpt rev1.doc
footings with slab on grade, and the pedestrian bridge may be supported on shallow spread footings, provided that the foundation design and site preparation work are performed as recommended herein. 4.2.2 Expansive Soil Considerations for Footings, Slabs, & Hardscape Concrete floor slabs and hardscape should be installed on a properly prepared subgrade and should be designed for the expansion potential of the supporting subgrade, as discussed in the following sections. Since “Medium” expansive soils appear to be limited to the upper 2 feet in the building areas, it is recommended that these clayey materials be removed from the area within and extending 5 feet outside the building footprint and used in non-structural areas. It may also be desirable to remove surficial clayey soils in area of proposed hardscape features. All backfill of clayey soil removals should have EI less than 20, and the building foundations, slabs, and hardscape may be designed for “Very Low” expansion potential. If surficial clayey soils are left in place or recompacted and used as fills below structural elements, any foundations, slabs, or hardscape supported on these materials should be designed for “Medium” expansion potential.
4.2.2.1 Low to Very Low Expansion Potential If footings, slabs, and hardscape are designed for Low to Very Low Expansion Potential, then any clayey materials (typically the upper 2 feet) should be removed as described above, and all backfill below these elements should have EI=20 or less. The local standard of practice for the design and construction of foundations, slabs, and hardscape supported on soils with a low to very low expansion potential is provided below. A low expansion potential corresponds to an Expansion Index (EI) of 21 to 50 and a very low expansion potential corresponds to an Expansion Index (EI) of 0 to 20. Structural design requirements may require greater thickness and/or more reinforcing than indicated, and should evaluated by the structural engineer. Footings should be founded at least 12 inches below lowest adjacent grade. Footings should have minimum reinforcement of one #4 bar top and bottom.
Geotechnical Investigation March 28, 2011 Los Angeles State Historic Park, Los Angeles, California Page 12 State of California Department of Parks and Recreation Group Delta Project No. L-938
N:\Projects\_LA\L900\L-938 LA State Historic Park\Report\L-938 LA State Historic Park Geotech rpt rev1.doc
The concrete slabs and panels should be at least 4 inches thick and should be reinforced with a minimum 6” x 6” – 10/10 mesh.
Prior to placing concrete, the subgrade should be kept lightly watered to prevent
drying out. Concrete slabs and hardscape should have a maximum joint spacing of 10 feet;
#3 bars dowels should be considered at construction joints. The adjacent area should be sloped at 2 percent, or greater, to drain away from
slabs and pavements. Bushes and trees should be kept sufficiently away from the edges of foundations
and hardscape to prevent damage from roots.
4.2.2.2 Medium Expansion Potential Unless all clayey topsoils are removed, foundations, slabs, and hardscape should be designed for “Medium” expansion potential. The local standard of practice for the design and construction of foundations, slabs, and hardscape supported on soils with a medium expansion potential is provided below. A medium expansion potential corresponds to an Expansion Index (EI) between 51-90. Structural design requirements may require greater thickness and/or more reinforcing than indicated, and should evaluated by the structural engineer Footings should be founded at least 18 inches below lowest adjacent grade. Footings should be reinforced with one #4 bar top and bottom. The concrete slabs and panels should be at least 4 inches thick and should be
reinforced with a 6” x 6” – 10/10 mesh, or #3 bars at 24 inches center to center, both ways.
Prior to placing concrete, the subgrade should be pre-saturated to 120 percent
of optimum to a depth of at least 12 inches below the bottom of footing/slab.
Geotechnical Investigation March 28, 2011 Los Angeles State Historic Park, Los Angeles, California Page 13 State of California Department of Parks and Recreation Group Delta Project No. L-938
N:\Projects\_LA\L900\L-938 LA State Historic Park\Report\L-938 LA State Historic Park Geotech rpt rev1.doc
Concrete slabs and hardscape should have a maximum joint spacing of 10 feet; #3 bars dowels at construction joints; and, the outside edge should be deepened to a thickness of 12 inches. One #3 bar should be used to reinforce the flared edge.
The adjacent area should be slope at 2 percent, or greater, to drain away from
slabs and pavements. For additional protection, consideration should also be given to removing the
upper 6 inches of expansive soils below slabs and paving and replacing it with non-expansive sandy soil having an EI of not more than 20.
Bushes, trees and irrigation pipes and valves should be kept sufficiently way from
the edges of foundations and hardscape to prevent root damage, and/or moisture changes in the supporting subgrade.
The area within 10 feet of buildings should preferably be paved to reduce
potential for moisture infiltration. 4.2.3 Slab-on-Grade Moisture Barrier To reduce the potential for moisture transmission through slabs and where moisture sensitive covering will be installed, we recommend that a vapor retarder or vapor barrier shall be used. In accordance with ACI 302.2R-06, the material must comply with the requirements of ASTM E 1745, “Standard Specification for Water Vapor Retarders Used in Contact with Soil or Granular Fill under Concrete Slabs,” and have a permeance of less than 0.01 perms per ASTM E96. The installation of the moisture barrier should comply with ASTM E 1643-09. Care shall be taken not to puncture the vapor retarder during construction. Any utility stub-outs should be properly wrapped and sealed. Concerning whether to place 2 inches of sand over the retarder, reference is made to ACI 302.2R, Section 7.2, which states that the anticipated benefits and risks associated with the location of the vapor retarder should be reviewed on a case by case basis with all appropriate parties, considering anticipated project conditions and the potential effects of concrete curing, cracking, curling.
Geotechnical Investigation March 28, 2011 Los Angeles State Historic Park, Los Angeles, California Page 14 State of California Department of Parks and Recreation Group Delta Project No. L-938
N:\Projects\_LA\L900\L-938 LA State Historic Park\Report\L-938 LA State Historic Park Geotech rpt rev1.doc
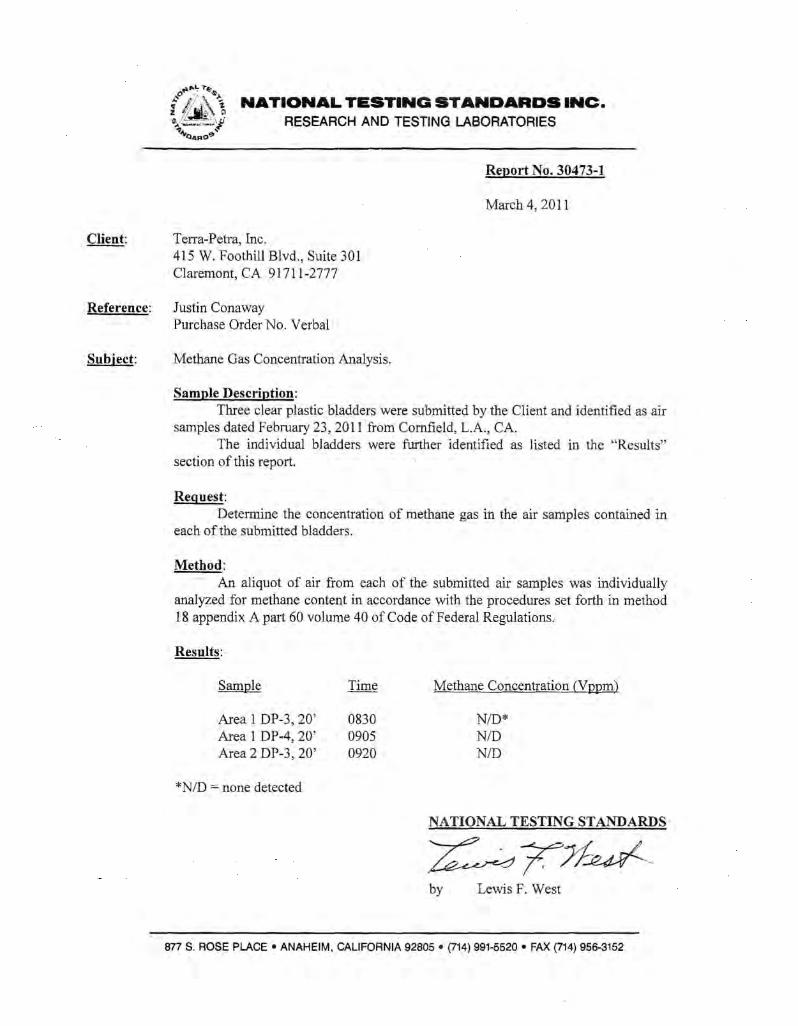
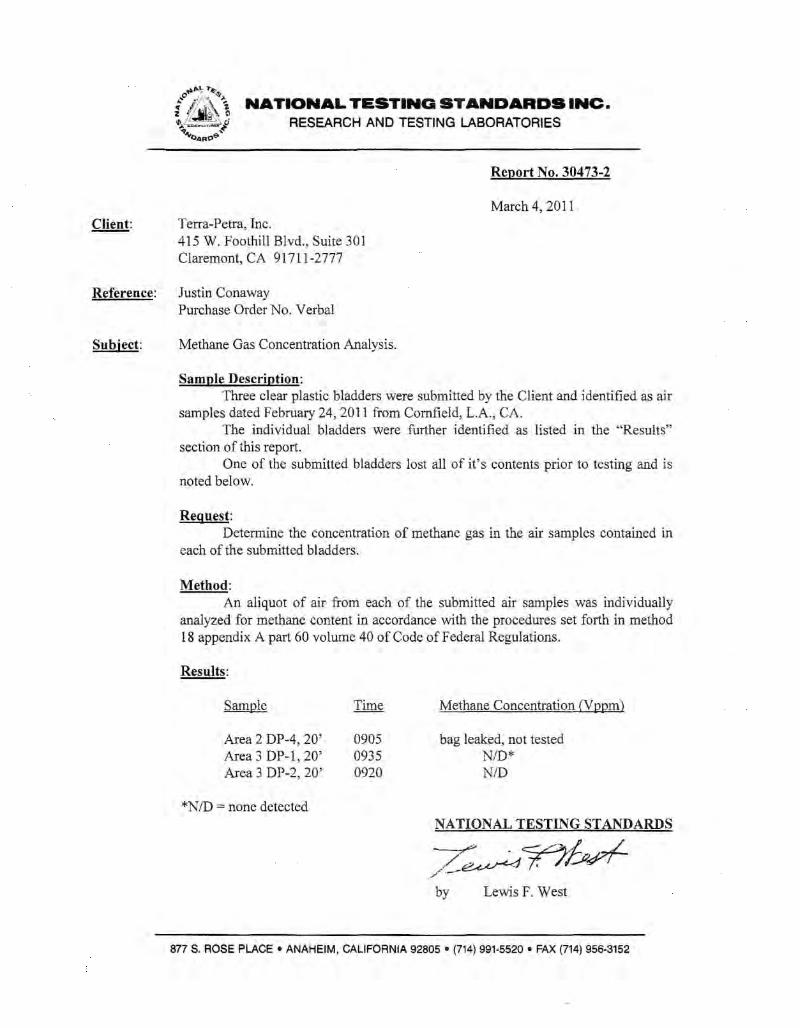
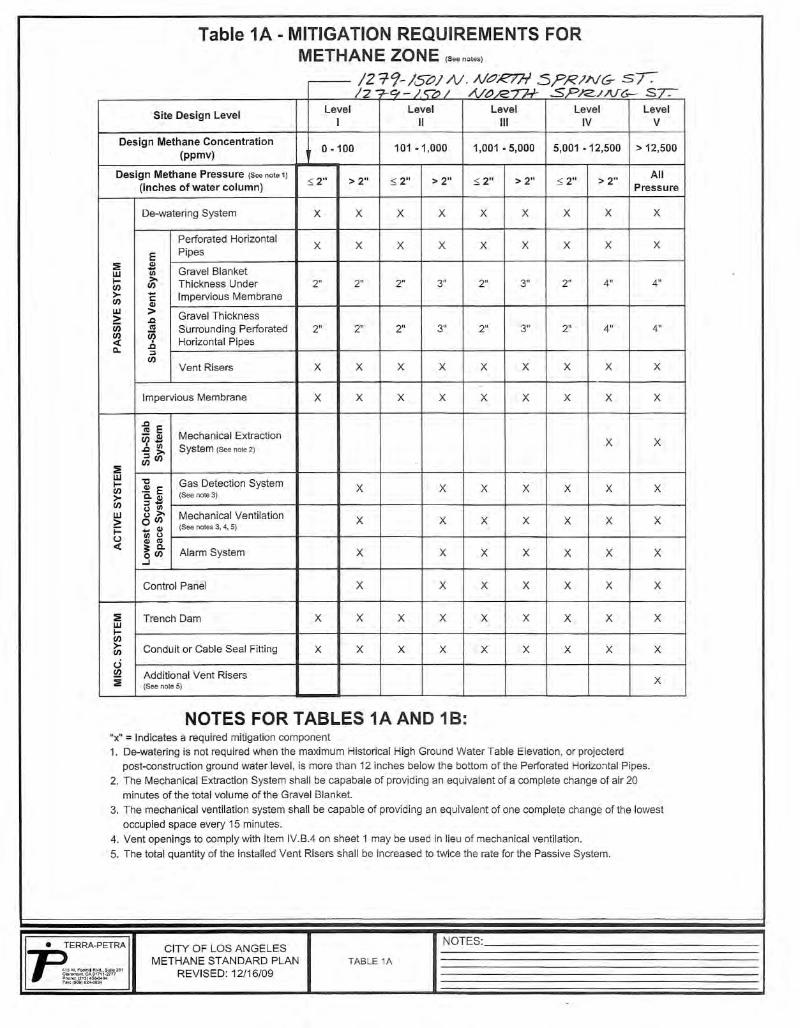
4.2.4 Methane Mitigation System The site is within a City of LA methane zone or methane buffer zone. A methane soil gas investigation was performed by our subconsultant Terra-Petra, and an LADBS Certificate of Compliance for Methane Test Data-Form 1 was prepared, and is included as Appendix E. Note that all properties within the City’s methane zone require some level of mitigation Based on the results of the investigation, the site has been classified as Level I, which requires the lowest level of methane protection. The Level I mitigation typically includes a vapor barrier, granular soil layers, and other elements typically within the upper 12 inches below the building slab. A methane consult should be contracted to provide final details and recommendations for the methane mitigation system. 4.2.5 Spread Footings
4.2.5.1 Bearing Capacity Shallow spread footings for single story structures and minor retaining walls on properly prepared subgrade (Section 4.3.3) may be designed for an allowable bearing capacity of 2,000 psf. Minimum footing width should be 12 inches and minimum footing depth should be 12 inches, or as dictated by expansive soil requirements (Section 4.2.2). If higher bearing capacity is needed for other minor structures, allowable bearing capacity may be increased by 500 psf for each 1 ft increase in footing width and by 500 psf for each 1 ft increase in footing depth, not to exceed 4,000 psf. Minimum footing depth should be at least ½ the footing width. For heavier loads foundations should be supported in dense native soils. For preliminary design of the pedestrian bridge, shallow foundations should be supported in native materials at a depth of at least 5 ft below existing grade and may be designed for an allowable bearing capacity of 5,000 psf. We recommend that GDC be contacted once foundation locations and loads have been determined to confirm or modify this recommendation as appropriate. Allowable bearing capacity may be increased by 1/3 for wind or seismic loads.
Geotechnical Investigation March 28, 2011 Los Angeles State Historic Park, Los Angeles, California Page 15 State of California Department of Parks and Recreation Group Delta Project No. L-938
N:\Projects\_LA\L900\L-938 LA State Historic Park\Report\L-938 LA State Historic Park Geotech rpt rev1.doc
4.2.5.2 Lateral Resistance Concrete bearing on existing site soils may be designed for an ultimate soil-to-concrete sliding friction coefficient of 0.45. If footings include a key, an ultimate sliding friction coefficient of 0.6 (soil-to-soil) may be used for the sliding resistance in front of the key. Passive resistance for footings cast against competent native materials or backfilled with compacted fill may be taken as an equivalent fluid pressure of 350 pcf. Sliding and passive may be combined without reduction. Sliding factor of safety should not be less than 1.5 for static and 1.1 for seismic loading conditions. Resistance to overturning is adequate if resultant on the base of footing falls within the middle third.
4.2.5.3 Settlement Total estimated footing settlements are less than ½ inch for footings supporting light frame single story structures. For large footings or heavier loads settlements are estimated at 1 inch or less. Differential settlement of footings may be taken as 1/2 inch over 30 feet.
4.2.5.4 Footing Observation Spread footing subgrade should be prepared in accordance with Section 4.3.3. The footing excavations should be observed and accepted by GDC prior to placing steel or concrete. Any unsuitable materials found below footings should be removed and recompacted to not less than 95%. 4.2.6 Retaining Walls Recommendations in Section 4.2.5 may be used for design of spread footings for retaining walls. We recommend that all retaining walls be backfilled with low-expansive granular soils (minimum Sand Equivalent of 20). On-site clayey soils should not be used for wall backfill. A 2-ft thick cap consisting of onsite clayey material should be used to minimize infiltration of surface water. Heavy compaction equipment operating adjacent to retaining walls can cause excessively high lateral soil pressures to be exerted on the wall. Therefore, soils within 5 ft of the wall should either be compacted with hand operated equipment or designed to withstand compaction pressure from heavy equipment. All walls should be constructed with a properly designed drainage system to prevent buildup of hydrostatic pressures behind the
Geotechnical Investigation March 28, 2011 Los Angeles State Historic Park, Los Angeles, California Page 16 State of California Department of Parks and Recreation Group Delta Project No. L-938
N:\Projects\_LA\L900\L-938 LA State Historic Park\Report\L-938 LA State Historic Park Geotech rpt rev1.doc
wall. Basement walls or walls with architectural facades or coverings should be properly waterproofed to minimize moisture transmission through the walls. Cantilever walls, which are free to move laterally at least ½ in. for each 10 ft height (active condition), with level backfill may be designed for an equivalent fluid pressure of 36 pcf above the water table. If walls designed for active condition retain 2:1 (horizontal: vertical) sloping backfill, they should be designed for an equivalent fluid pressure of 45 pcf. Temporary shoring or walls restrained at the top should be designed for a uniform lateral pressure of 25H psf, where H=wall height in feet. Walls designed for static loads have historically performed well during seismic events. If walls are to be designed for seismic lateral pressures, we recommend an additional lateral equivalent fluid pressure of 15 pcf as an inverted triangular distribution in addition to the static pressures. 4.3 Site Preparation and Grading 4.3.1 Clearing and Grubbing The site is currently covered by pavements, grass, shrubs, and trees, and contains other existing improvements. Prior to general site grading, clearing and grubbing should be performed in accordance with the current edition of Standard Specifications for Public Works Construction (SSPWC, a.k.a. “Greenbook”), Section 300-1. Any debris, existing building foundations, basements, septic tanks, pavements, rubble, existing undocumented fill, loose soil, vegetation, or other deleterious items should be removed and disposed of outside the construction limits. All active or inactive utilities within the construction limits should be identified for relocation, abandonment, or protection prior to grading. Any pipes greater than 2 inches in diameter to be abandoned in-place should be filled with sand/cement slurry. The adequacy of existing backfill around utilities to remain in place under new structures should be evaluated; loose or dumped trench backfill should be removed and replaced with properly compacted backfill. 4.3.2 Excavation Excavation should be readily accomplished using conventional heavy duty grading equipment.

Geotechnical Investigation March 28, 2011 Los Angeles State Historic Park, Los Angeles, California Page 17 State of California Department of Parks and Recreation Group Delta Project No. L-938
N:\Projects\_LA\L900\L-938 LA State Historic Park\Report\L-938 LA State Historic Park Geotech rpt rev1.doc
4.3.3 Subgrade Preparation The near surface medium expansion potential clayey soils should be removed from the building areas in accordance with Section 4.2.2. In general the soils in the upper 5 feet include localized clayey topsoils, variable density sandy soils, and localized undocumented fills; soils below 5 feet soils are generally dense native materials. Footings founded at a depth of 5 feet or more below existing ground may be supported directly in competent on-site native materials. The foundation area should be cleaned of all loose debris and observed / accepted by GDC prior to placing steel or concrete. If unsuitable soils are encountered below the foundation level they should be treated as recommended in the following paragraph. To provide uniform support for building or wall footings and slabs founded at a depth of less than 5 feet below existing grades, we recommend excavating the entire building footprint to a minimum of 2 ft (or one footing width, whichever is greater) below the bottom of footing level, and that the bottom be proof-rolled under GDC’s observation. It is recommended that all undocumented fill, loose, pumping, wet, or otherwise unsuitable soil be excavated to the limits and depth recommended by GDC in the field based on observation of the bottom and proof-rolling. Any soils that cannot be recompacted should be removed from the site. Excavated soils that are suitable for re-use as fill should be recompacted. We estimate that removals to a depth of up to about 5 feet below existing grades could be required due to presence of potentially loose and undocumented fills. The excavations should extend a minimum of 5 ft outside the building footprint. The bottom should then be scarified and recompacted. The area should be uniformly backfilled with native granular soils or imported fill. Imported or on-site fill, if placed in the foundation area, shall have an expansion index of less than 20. In pavement or flatwork areas clayey topsoils should be removed, and the pavement or flatwork area should be excavated to a minimum of 1 ft below existing grade or subgrade level (whichever is deeper) and proof-rolled. Unsuitable materials should be further removed to the depth and limits recommended by GDC in the field. Where new fills are placed on existing ground, following clearing and grubbing, the bottom should be proof rolled and any areas of loose soil excavated and recompacted. If the subgrade is stable under proof rolling, the surface should be
Geotechnical Investigation March 28, 2011 Los Angeles State Historic Park, Los Angeles, California Page 18 State of California Department of Parks and Recreation Group Delta Project No. L-938
N:\Projects\_LA\L900\L-938 LA State Historic Park\Report\L-938 LA State Historic Park Geotech rpt rev1.doc
scarified, brought to near optimum moisture content, and compacted prior to placing new fills. All foundation excavations and footing subgrade should be observed and accepted by GDC prior to placing steel, concrete, and pavement structural section. 4.3.4 Fills Preliminary plans (Figures 2B through 2D) shown that minor fills may be placed to create grassy knolls up to about 10 feet high or approaches to the pedestrian bridge. Placement of fills is expected to cause settlements of 1 inch or less, and the settlements will be completed within 2 weeks of fill placement. General compacted fills should be compacted to not less than 90% relative compaction. Compacted fills placed below foundations, slabs, or pavements should be compacted to not less than 95% relative compaction. All compaction control should follow the standard test method ASTM D 1557, and be performed within 2% of the optimum moisture content. A sufficient number of field density and laboratory compaction tests should be performed during construction to verify minimum compaction requirements. We recommend that any imported fills have Expansion Index less than 50, have less than 40% passing No. 200 sieve, and have a maximum particle size not to exceed 3 inches. All on-site fills and imported soils should be tested and accepted by GDC. 4.3.5 Earthwork Grading Factors Native materials or existing fills of similar composition to the native materials may be excavated and compacted, or excavated and removed from the site. Imported fills may be brought in and compacted. Shrinkage or bulking may occur. Grading factors are defined as the original volume divided by the final volume. The following earthwork grading factors are recommended for the project: On site fill or alluvial soils excavated and placed at 90% compaction: 0.90-0.95
On site fill or alluvial soils excavated and placed at 95% compaction: 0.85-0.90
Import fill trucked in loose condition and compacted on site: 0.75-0.80
Export material excavated on-site & trucked out in loose condition: 1.25 to 1.33

Geotechnical Investigation March 28, 2011 Los Angeles State Historic Park, Los Angeles, California Page 19 State of California Department of Parks and Recreation Group Delta Project No. L-938
N:\Projects\_LA\L900\L-938 LA State Historic Park\Report\L-938 LA State Historic Park Geotech rpt rev1.doc
Grading factors may require adjustment during construction, and should consider the processing of material, wasting of spoil, and actual rather than specified placement percent compaction. The compaction characteristics of the materials from the borrow site excavation should be tested for density control during construction. 4.3.6 Permanent Slopes Any permanent graded slopes should be 2h:1v or flatter, and planted with suitable vegetation. Runoff should not be allowed to discharge over the top of slopes. 4.4 Temporary Excavation and Shoring Near soils generally classify as OSHA Type C; temporary excavations should comply with 29 CFR – 1926 Subpart P. The designated competent person on site should observe all excavations to verify they are stable or recommend laying back or shoring the excavation if necessary. No surcharge loads should be permitted within a horizontal distance equal to the height of cut or 5 ft from the top of the slopes, whichever is greater, unless the cut is shored. Excavations that extend below an imaginary plane inclined at 1h:1v below the edge of any adjacent existing site foundations or roadways should be properly shored to maintain support of the adjacent structures. The contractor will be responsible for the design of the shoring. If space is not available for excavation, shoring may be used. For restrained shoring such as trench shields a uniform rectangular earth pressure lateral pressure of 25H psf (H=retained height in feet) plus 50 percent of any surcharge or traffic loads should be included as a uniform rectangular loading on the shoring. 4.5 Utility Trenches 4.5.1 Bedding Bedding zone shall be defined as the area containing the material specified that is supporting, surrounding, and extending to 1 foot above the top of pipe. The bedding shall satisfy the requirements of Standard Specifications for Public Works Construction (SSPWC) Section 306-1.2.1. There shall be 4-inch minimum of bedding below the pipe and 1 inch minimum clearance below a projecting bell.
Geotechnical Investigation March 28, 2011 Los Angeles State Historic Park, Los Angeles, California Page 20 State of California Department of Parks and Recreation Group Delta Project No. L-938
N:\Projects\_LA\L900\L-938 LA State Historic Park\Report\L-938 LA State Historic Park Geotech rpt rev1.doc
There shall be a minimum side clearance of 6 inches on each side of the pipe. Bedding material shall be sand, gravel, crushed aggregate, or native free-draining material having a Sand Equivalent of not less than 30, or other material approved by the engineer. We recommend that the materials used for the bedding zone be placed, and compacted with mechanical means. Jetting shall not be allowed. 4.5.2 Backfill Backfill shall be considered as starting 12-inches above the pipe. Any boulders or cobbles larger than 3 inches in any dimensions should be removed before backfilling. We recommend that all backfill should be placed in lifts not exceeding six to eight inches in thickness and be compacted to at least 90 percent of maximum dry density as determined by the ASTM D-1557. The upper 12 inches below pavement should be compacted to at least 95 percent of maximum dry density. Mechanical compaction will be required to accomplish compaction above the bedding zone; jetting shall not be allowed. In backfill areas, where mechanical compaction of soil backfill is impractical due to space constraints, sand-cement slurry may be substituted for compacted backfill. The slurry should contain one sack of cement per cubic yard and have a maximum slump of 5-inches. When set, such a mix typically has the consistency of hard compacted soil, and allows for future excavation. 4.6 Soil Corrosivity Laboratory corrosivity test results showed a pH of 8.0 to 8.2, soluble chlorides of 100 ppm or less, soluble sulfates of 100 to 690 ppm, and minimum resistivity values of 1478 to 2023 ohm-cm for the near-surface soils. Based on the test results, the potential for sulfate attack on concrete is negligible and no special type of cement or mix design is required for sulfate resistance. The tested level of chlorides in soil is not expected to have an adverse effect on reinforced concrete. To evaluate the corrosion potential of near-surface soils on buried metals, we used the following correlation between electrical resistivity and corrosion potential:
Geotechnical Investigation March 28, 2011 Los Angeles State Historic Park, Los Angeles, California Page 21 State of California Department of Parks and Recreation Group Delta Project No. L-938
N:\Projects\_LA\L900\L-938 LA State Historic Park\Report\L-938 LA State Historic Park Geotech rpt rev1.doc
Elect. Resistivity, Ohm-cm Corrosion Potential Less than 1,000 Severe 1,000-2,000 Corrosive 2,000-10,000 Moderate Greater than 10,000 Mild Based on these data, it is our opinion that general onsite near-surface soils have a corrosive potential for buried metal. This should be considered in design of any buried metal elements, and a corrosion expert should be consulted for mitigation measures if required. Laboratory corrosion test results from the site are presented in Appendix B. 4.7 Pavement Design Asphalt pavement sections should be designed based on this design R-value and an appropriate Traffic Index (TI). The Caltrans Highway Design Manual was used for design of the recommended Asphalt Concrete (AC) over Aggregate Base (AB) pavement sections. Based on testing of the near surface granular soils, we used an R-Value of 50 for the subgrade. The following AC pavement sections are recommended for Traffic Index (TI) values of 5, 6, and 7: R-value 50 Section Thickness Traffic Index AC Over AB (feet) 5 0.25 AC/0.35 AB 6 0.30 AC/0.35 AB 7 0.35 AC/0.35 AB Minimum traffic Index of 5 is recommended for car parking and non-truck driveways, and 6 or higher may be used for truck areas or access driveways. The upper 12-inches of subgrade supporting pavements should be moisture conditioned to near optimum and compacted to at least 95 percent relative compaction within 2% of optimum moisture (ASTM D1557). AB should be Class 2 or Crushed Miscellaneous Base in accordance with Caltrans or Greenbook and be compacted to not less than 95% relative compaction. If needed, bus pads may be designed following Section 626.4 of Caltrans Highway Design Manual. The minimum pavement structure for bus pads should be 0.85 foot Jointed Plain Concrete Pavement (JPCP) with dowel bars at transverse joints on top
Geotechnical Investigation March 28, 2011 Los Angeles State Historic Park, Los Angeles, California Page 22 State of California Department of Parks and Recreation Group Delta Project No. L-938
N:\Projects\_LA\L900\L-938 LA State Historic Park\Report\L-938 LA State Historic Park Geotech rpt rev1.doc
of 0.5 foot lean concrete base or Type A hot mix asphalt. Relative slab dimensions for bus pads should be approximately 1:1 to 1:1.25, transverse-to longitudinal. The width of the bus pad should be no less than the width of the bus plus 4 feet. The minimum length of the bus pad should be 1.5 times the length of the bus(es) that will use the pad at any given time.
Geotechnical Investigation March 28, 2011 Los Angeles State Historic Park, Los Angeles, California Page 23 State of California Department of Parks and Recreation Group Delta Project No. L-938
N:\Projects\_LA\L900\L-938 LA State Historic Park\Report\L-938 LA State Historic Park Geotech rpt rev1.doc
5.0 LIMITATIONS This investigation was performed in accordance with generally accepted geotechnical engineering principles and practice. The professional engineering work and judgments presented in this report meet the standard of care of our profession at this time. No other warranty, expressed or implied, is made. The recommendations for this project are, to a high degree dependent upon proper quality control of grading and foundation construction. Consequently, the recommendations are made contingent on the opportunity of GDC to observe grading operations, mat foundation installation, and subgrade/base preparation. If parties other than GDC are engaged to provide such services, they must be notified that they will be required to assume complete responsibility for the geotechnical phase of the project by concurring with the recommendations in this report or provide alternate recommendations as deemed appropriate.

Geotechnical Investigation March 28, 2011 Los Angeles State Historic Park, Los Angeles, California Page 24 State of California Department of Parks and Recreation Group Delta Project No. L-938
N:\Projects\_LA\L900\L-938 LA State Historic Park\Report\L-938 LA State Historic Park Geotech rpt rev1.doc
6.0 REFERENCES 2010 California Building Code
California Department of Conservation, Division of Mines and Geology, “State of California Special Study Zones.
Caltrans Highway Design Manual, 2010.
Caltrans, ARS Online website.
City of Los Angeles, “Safety Element Of The Los Angeles City General Plan,” Approved by the City Planning Commission, August 8, 1996, Adopted by the City Council, November 26, 1996.
ERM-West, Inc., “Additional Site Investigation Summary and Groundwater Monitoring Report, Former Cornfield Yard, 1245 N. Spring Street, Los Angeles, California,” October 2006.
NCEER, Liquefaction Resistance of Soils: Summary Report From the 1996 NCEER and 1998 NCEER/NSF Workshops (Edited by: T.L. Youd and I.M. Idriss, 2001).
Southern California Earthquake Center, “Recommended Procedures for Implementation of DMG Special Publication 117, Guidelines for Analyzing and Mitigating Liquefaction Hazards in California,” March 1999.
Standard Specifications for Public Works Construction 2006, “Greenbook,” Building News, Inc., November 2005.
Seed, et. al., “Recent Advances in Soil Liquefaction Engineering: A Unified and Consistent Framework,” 26th Annual ASCE Los Angeles Geotechnical Spring Seminar, April 30, 2003.
Shaw Environmental, Inc., “Removal Action Completion Report, 32-acre parcel of the former Cornfield Rail Yard, 1245 Spring Street, Los Angeles, California,” February 2003.
State of California Seismic Hazard Zones for Los Angeles 7.5-m Quadrangle, Los Angeles County, California, March 25, 1999.
Tokimatsu, Kohji, and Seed, H.B., " Evaluation of Settlements in Sands Due to Earthquake Shaking," Journal of Geotechnical Engineering, Vol. 113, No. 8, Proc. Paper No. 21706, August 1987.
Geotechnical Investigation March 28, 2011 Los Angeles State Historic Park, Los Angeles, California Page 25 State of California Department of Parks and Recreation Group Delta Project No. L-938
N:\Projects\_LA\L900\L-938 LA State Historic Park\Report\L-938 LA State Historic Park Geotech rpt rev1.doc
U.S. Dept. of the Interior, Bureau of Reclamation, Earth Sciences and Research Laboratory, “CME Automatic Hammer Operations Bulletin,” DSO-99-03, November 1999.
Yerkes, R.F, and Campbell, R.H., “Preliminary Geologic Map of the Los Angeles 30’ x 60’ Quadrangle, Version 1.0, 2005.
Ziony, J.I., editor, “Evaluating Earthquake Hazards in the Los Angeles Region-An Earth Science Perspective,” USGS Professional Paper 1360, 1985.


TABLES

SS= 2.209 g = short period (0.2 sec) mapped spectral response acceleration MCE Site Class B (CBC 2007 Fig. 1613.5(3) or USGS Ground Motion Calculator)S1= 0.786 g = 1.0 sec period mapped spectral response acceleration MCE Site Class B (CBC 2007 Fig. 1613.5(4) or USGS Ground Motion Calculator)
Site Class= C = Site Class definition based on CBC 2007 Table 1613.5.2Fa= 1.00 = Site Coefficient applied to Ss to account for soil type (CBC 2007 Table 1613.5.3(1))Fv= 1.30 = Site Coefficient applied to S1 to account for soil type (CBC 2007 Table 1613.5.3(2))TL= 8.00 sec = Long Period Transition Period (ASCE 7-05 Figure 22-16)
SMS= 2.209 = site class modified short period (0.2 sec) MCE spectral response acceleration = Fa x Ss (CBC 2007 Eqn. 16-37)
SM1= 1.022 = site class modified 1.0 sec period MCE spectral response acceleration = Fv x S1 (CBC 2007 Eqn. 16-38)
SDS= 1.473 = site class modified short period (0.2 sec) Design spectral response acceleration = 2/3 x SMS (CBC 2007 Eqn. 16-39)
SD1= 0.681 = site class modified 1.0 sec period Design spectral response acceleration = 2/3 x SM1 (CBC 2007 Eqn. 16-40)
T0= 0.093 sec = 0.2 SD1/SDS = Control Period (left end of peak) for ARS Curve (Section 11.4.5 ASCE 7-05)
TS= 0.463 sec = SD1/SDS = Control Period (right end of peak) for ARS Curve (Section 11.4.5 ASCE 7-05)
Design MCE Design MCESa (g) Sa (g) Sa (g) Sa (g)
0.000 0.589 0.884 4.250 0.160 0.2400.093 1.473 2.209 4.500 0.151 0.2270.463 1.473 2.209 4.750 0.143 0.2150.500 1.362 2.044 5.000 0.136 0.2040.600 1.135 1.703 5.250 0.130 0.1950.700 0.973 1.460 5.500 0.124 0.1860.800 0.852 1.277 5.750 0.118 0.1780.900 0.757 1.135 6.000 0.114 0.1701.000 0.681 1.022 6.250 0.109 0.1631.100 0.619 0.929 6.500 0.105 0.1571.200 0.568 0.852 6.750 0.101 0.1511.300 0.524 0.786 7.000 0.097 0.1461.400 0.487 0.730 7.250 0.094 0.1411.500 0.454 0.681 7.500 0.091 0.1361.600 0.426 0.639 7.750 0.088 0.1321.700 0.401 0.601 8.000 0.085 0.1281.800 0.378 0.568 8.250 0.080 0.1201.900 0.359 0.538 8.500 0.075 0.1132.000 0.341 0.511 8.750 0.071 0.1072.100 0.324 0.487 9.000 0.067 0.1012.200 0.310 0.464 9.250 0.064 0.0962.300 0.296 0.444 9.500 0.060 0.0912.400 0.284 0.426 9.750 0.057 0.0862.500 0.272 0.409 10.000 0.054 0.0822.600 0.262 0.393 10.250 0.052 0.0782.700 0.252 0.378 10.500 0.049 0.0742.800 0.243 0.365 10.750 0.047 0.0712.900 0.235 0.352 11.000 0.045 0.0683.000 0.227 0.341 11.250 0.043 0.0653.100 0.220 0.330 11.500 0.041 0.0623.200 0.213 0.319 11.750 0.039 0.0593.300 0.206 0.310 12.000 0.038 0.0573.400 0.200 0.301 12.250 0.036 0.0543.500 0.195 0.292 12.500 0.035 0.0523.600 0.189 0.284 12.750 0.034 0.0503.700 0.184 0.276 13.000 0.032 0.0483.800 0.179 0.269 13.250 0.031 0.0473.900 0.175 0.2624.000 0.170 0.255 13.500 0.030 0.045
T(seconds)
SPEC
TRU
M C
ALC
ULA
TIO
NO
UTP
UT
T(seconds)
TABLE 1CBC 2007 / ASCE 7-05 ACCELERATION RESPONSE SPECTRA
GDC PROJECT NO. L-938 Los Angeles State Historic Park
INPU
T
Site Latitude: 34.0685 Site Longitude: -118.2323
0.0
0.5
1.0
1.5
2.0
2.5
0.0 0.5 1.0 1.5 2.0 2.5 3.0 3.5 4.0
Period (seconds)
Spec
tral
Acc
eler
atio
n (g
)
Design
MCE
N:\Projects\_LA\L900\L-938 LA State Historic Park\Report\Tables\Table 1_2007 CBC Calculation.xls

FIGURES
GDC Project No. L-938
Los Angeles State Historic ParkLos Angeles, CA
Vicinity MapFigure 1A
SITE
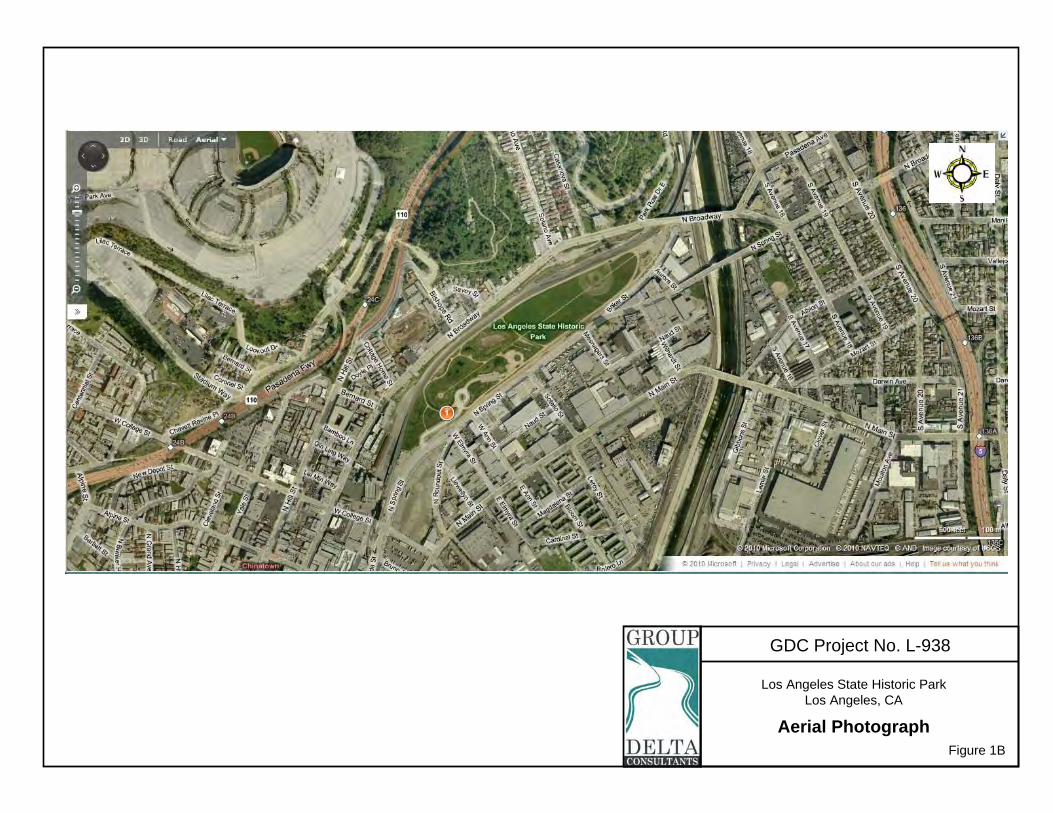
GDC Project No. L-938
Los Angeles State Historic ParkLos Angeles, CA
Aerial PhotographFigure 1B
Los Angeles State Historic Park Los Angeles, California
Los Angeles State Historic Park Los Angeles, California

Los Angeles State Historic Park Los Angeles, California
Los Angeles State Historic Park Los Angeles, California
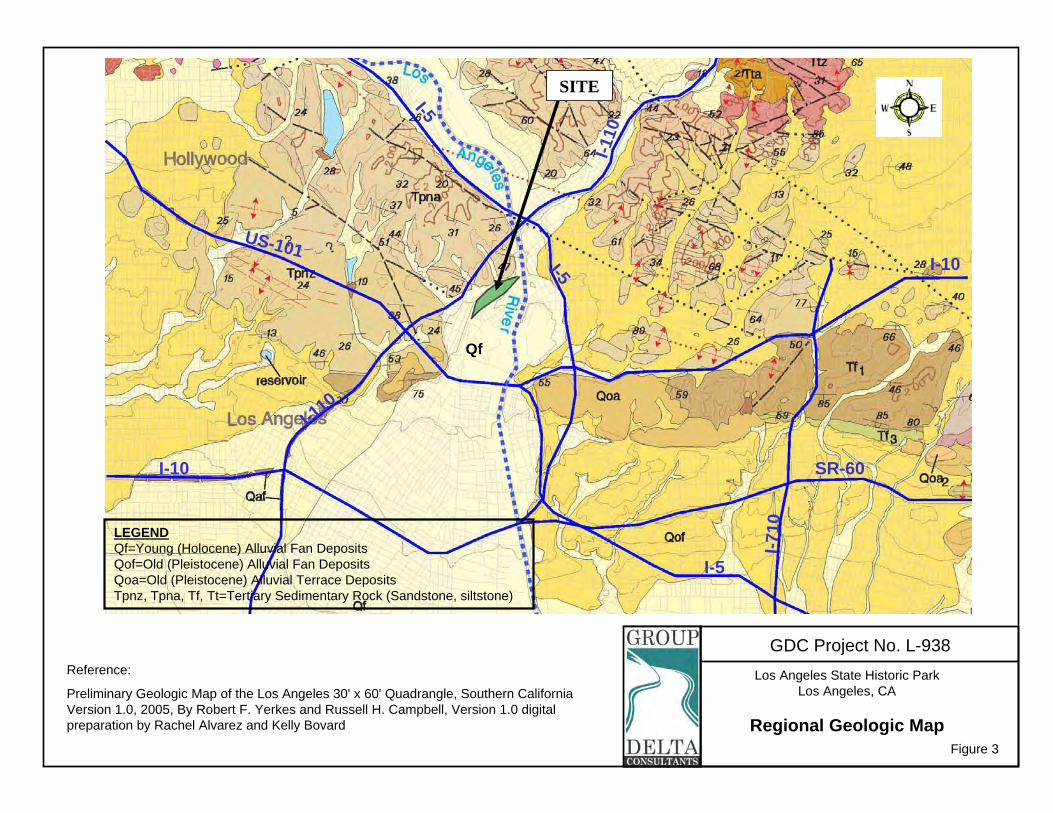
GDC Project No. L-938
Los Angeles State Historic ParkLos Angeles, CA
Regional Geologic MapFigure 3
Reference:
Preliminary Geologic Map of the Los Angeles 30' x 60' Quadrangle, Southern CaliforniaVersion 1.0, 2005, By Robert F. Yerkes and Russell H. Campbell, Version 1.0 digital preparation by Rachel Alvarez and Kelly Bovard
Qf
I-10
I-10
SR-60
US-101
I-110
I-110
I-5
I-5
I-5
I-710LEGEND
Qf=Young (Holocene) Alluvial Fan DepositsQof=Old (Pleistocene) Alluvial Fan DepositsQoa=Old (Pleistocene) Alluvial Terrace DepositsTpnz, Tpna, Tf, Tt=Tertiary Sedimentary Rock (Sandstone, siltstone)
SITE

GDC Project No. L-938
Los Angeles State Historic ParkLos Angeles, CA
Historically Highest Groundwater MapFigure 5A
SITE
GDC Project No. L-938
Los Angeles State Historic ParkLos Angeles, CA
Fault MapFigure 6
SITE
Reference: Caltrans ARS Online
PUENTE HILLS BLIND THRUST, M=7.3
UPPER ELYSIAN
PARK BLIND THRUST, M=6.4NEWPORT-INGLEW
OOD
FAULT ZONE, RLSS, M=7.5
HOLLYWOOD FAULT, LLSS, M=6.6 RAYMOND FAULT, LLSS, M=6.6
VERDUGO FAULT, R, M=6.9
WHITTIER-ELSINORE FZ,
RLSS, M=7.6

GDC Project No. L-938
Los Angeles State Historic ParkLos Angeles, CA
Liquefaction Zone MapFigure 7
SITE
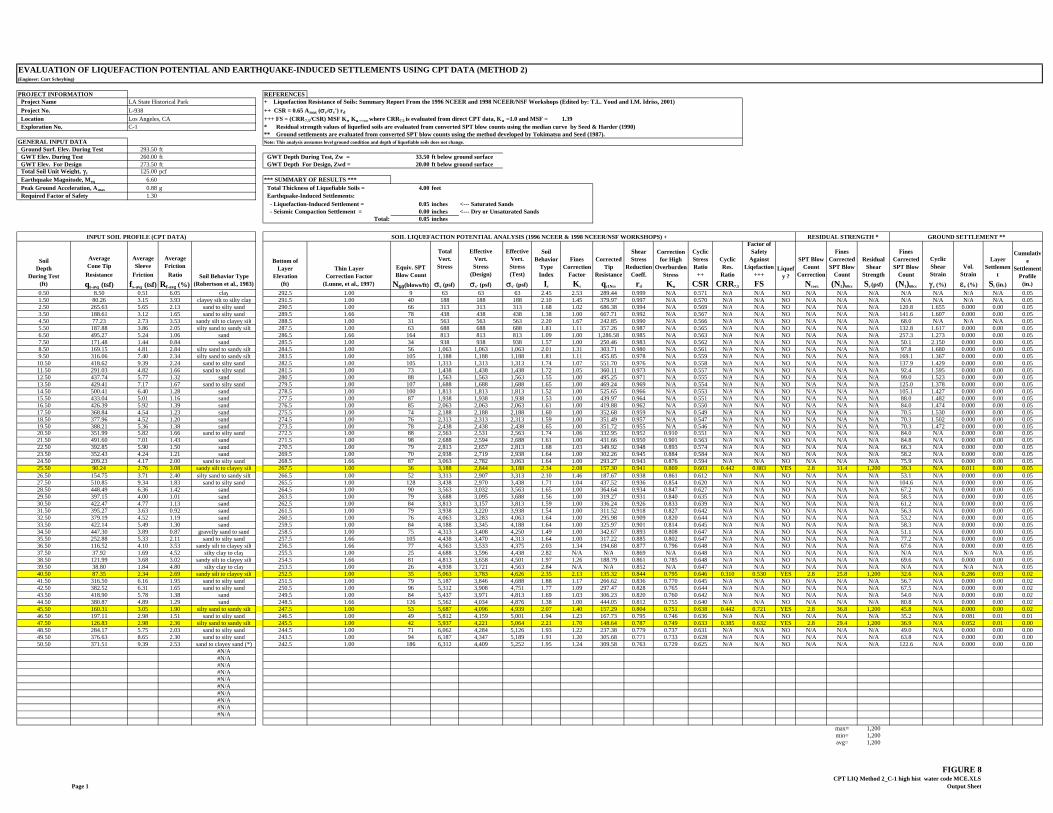
EVALUATION OF LIQUEFACTION POTENTIAL AND EARTHQUAKE-INDUCED SETTLEMENTS USING CPT DATA (METHOD 2)(Engineer: Curt Scheyhing)
PROJECT INFORMATION REFERENCES Project Name LA State Historical Park + Liquefaction Resistance of Soils: Summary Report From the 1996 NCEER and 1998 NCEER/NSF Workshops (Edited by: T.L. Youd and I.M. Idriss, 2001)
Project No. L-938 ++ CSR = 0.65 Amax (v/v') rd
Location Los Angeles, CA +++ FS = (CRR7.5/CSR) MSF KK where CRR7.5 is evaluated from direct CPT data, K =1.0 and MSF = 1.39 Exploration No. C-1 * Residual strength values of liquefied soils are evaluated from converted SPT blow counts using the median curve by Seed & Harder (1990)
** Ground settlements are evaluated from converted SPT blow counts using the method developed by Tokimatsu and Seed (1987).GENERAL INPUT DATA Note: This analysis asssumes level ground condition and depth of liquefiable soils does not change.
Ground Surf. Elev. During Test 293.50 ft GWT Elev. During Test 260.00 ft GWT Depth During Test, Zw = 33.50 ft below ground surface GWT Elev. For Design 273.50 ft GWT Depth For Design, Zwd = 20.00 ft below ground surface Total Soil Unit Weight, t 125.00 pcf Earthquake Magnitude, Meq 6.60 *** SUMMARY OF RESULTS *** Peak Ground Acceleration, Amax 0.88 g Total Thickness of Liquefiable Soils = 4.00 feet Required Factor of Safety 1.30 Earthquake-Induced Settlements:
- Liquefaction-Induced Settlement = 0.05 inches <--- Saturated Sands - Seismic Compaction Settlement = 0.00 inches <--- Dry or Unsaturated Sands
Total: 0.05 inches
INPUT SOIL PROFILE (CPT DATA) SOIL LIQUEFACTION POTENTIAL ANALYSIS (1996 NCEER & 1998 NCEER/NSF WORKSHOPS) + RESIDUAL STRENGTH * GROUND SETTLEMENT **
SoilDepth
During Test(ft)
AverageCone Tip
Resistance
qt-avg (tsf)
AverageSleeve
Friction
fs-avg (tsf)
AverageFriction
Ratio
Rf-avg (%)Soil Behavior Type
(Robertson et al., 1983)
Bottom of Layer
Elevation(ft)
Thin Layer Correction Factor
(Lunne, et al., 1997)
Equiv. SPTBlow Count
N60(blows/ft)
TotalVert.Stress
v (psf)
EffectiveVert.Stress
(Design)
v' (psf)
EffectiveVert.Stress(Test)
v' (psf)
SoilBehavior
TypeIndex
Ic
FinesCorrection
Factor
Kc
CorrectedTip
Resistance
qc1Ncs
ShearStress
ReductionCoeff.
rd
Correctionfor High
OverburdenStress
K
CyclicStressRatio
++
CSR
CyclicRes.
Ratio
CRR7.5
Factor ofSafety
AgainstLiqefaction
+++
FS
Liquefy ?
SPT BlowCount
Correction
Ncorr.
FinesCorrectedSPT Blow
Count
(N1)60cs
ResidualShear
Strength
Sr (psf)
FinesCorrectedSPT Blow
Count
(N1)60cs
CyclicShearStrain
c (%)
Vol.Strain
v (%)
LayerSettlemen
t
Si (in.)
Cumulative
SettlementProfile
(in.)
0.50 8.50 0.51 6.05 clay 292.5 1.00 9 63 63 63 2.45 2.53 289.44 0.999 N/A 0.571 N/A N/A NO N/A N/A N/A N/A N/A N/A N/A 0.051.50 80.26 3.15 3.93 clayey silt to silty clay 291.5 1.00 40 188 188 188 2.10 1.45 379.97 0.997 N/A 0.570 N/A N/A NO N/A N/A N/A N/A N/A N/A N/A 0.052.50 265.63 5.65 2.13 sand to silty sand 290.5 1.00 66 313 313 313 1.68 1.02 686.38 0.994 N/A 0.569 N/A N/A NO N/A N/A N/A 120.8 1.655 0.000 0.00 0.053.50 188.61 3.12 1.65 sand to silty sand 289.5 1.66 78 438 438 438 1.38 1.00 667.71 0.992 N/A 0.567 N/A N/A NO N/A N/A N/A 141.6 1.607 0.000 0.00 0.054.50 77.23 2.73 3.53 sandy silt to clayey silt 288.5 1.00 31 563 563 563 2.20 1.67 242.85 0.990 N/A 0.566 N/A N/A NO N/A N/A N/A 68.0 N/A N/A N/A 0.055.50 187.88 3.86 2.05 silty sand to sandy silt 287.5 1.00 63 688 688 688 1.81 1.11 357.26 0.987 N/A 0.565 N/A N/A NO N/A N/A N/A 132.8 1.617 0.000 0.00 0.056.50 495.27 5.24 1.06 sand 286.5 1.66 164 813 813 813 1.09 1.00 1,286.58 0.985 N/A 0.563 N/A N/A NO N/A N/A N/A 257.3 1.273 0.000 0.00 0.057.50 171.48 1.44 0.84 sand 285.5 1.00 34 938 938 938 1.57 1.00 250.46 0.983 N/A 0.562 N/A N/A NO N/A N/A N/A 50.1 2.150 0.000 0.00 0.058.50 169.15 4.81 2.84 silty sand to sandy silt 284.5 1.00 56 1,063 1,063 1,063 2.01 1.31 303.71 0.980 N/A 0.561 N/A N/A NO N/A N/A N/A 97.8 1.680 0.000 0.00 0.059.50 316.06 7.40 2.34 silty sand to sandy silt 283.5 1.00 105 1,188 1,188 1,188 1.81 1.11 455.85 0.978 N/A 0.559 N/A N/A NO N/A N/A N/A 169.1 1.367 0.000 0.00 0.0510.50 418.62 9.39 2.24 sand to silty sand 282.5 1.00 105 1,313 1,313 1,313 1.74 1.07 551.70 0.976 N/A 0.558 N/A N/A NO N/A N/A N/A 137.9 1.429 0.000 0.00 0.0511.50 291.03 4.82 1.66 sand to silty sand 281.5 1.00 73 1,438 1,438 1,438 1.72 1.05 360.11 0.973 N/A 0.557 N/A N/A NO N/A N/A N/A 92.4 1.595 0.000 0.00 0.0512.50 437.74 5.77 1.32 sand 280.5 1.00 88 1,563 1,563 1,563 1.55 1.00 495.25 0.971 N/A 0.555 N/A N/A NO N/A N/A N/A 99.0 1.523 0.000 0.00 0.0513.50 429.41 7.17 1.67 sand to silty sand 279.5 1.00 107 1,688 1,688 1,688 1.65 1.00 469.24 0.969 N/A 0.554 N/A N/A NO N/A N/A N/A 125.0 1.378 0.000 0.00 0.0514.50 500.41 6.40 1.28 sand 278.5 1.00 100 1,813 1,813 1,813 1.52 1.00 525.65 0.966 N/A 0.553 N/A N/A NO N/A N/A N/A 105.1 1.427 0.000 0.00 0.0515.50 433.04 5.01 1.16 sand 277.5 1.00 87 1,938 1,938 1,938 1.53 1.00 439.97 0.964 N/A 0.551 N/A N/A NO N/A N/A N/A 88.0 1.482 0.000 0.00 0.0516.50 426.39 5.92 1.39 sand 276.5 1.00 85 2,063 2,063 2,063 1.61 1.00 419.88 0.962 N/A 0.550 N/A N/A NO N/A N/A N/A 84.0 1.474 0.000 0.00 0.0517.50 368.84 4.54 1.23 sand 275.5 1.00 74 2,188 2,188 2,188 1.60 1.00 352.68 0.959 N/A 0.549 N/A N/A NO N/A N/A N/A 70.5 1.530 0.000 0.00 0.0518.50 377.96 4.52 1.20 sand 274.5 1.00 76 2,313 2,313 2,313 1.59 1.00 351.49 0.957 N/A 0.547 N/A N/A NO N/A N/A N/A 70.3 1.502 0.000 0.00 0.0519.50 388.21 5.36 1.38 sand 273.5 1.00 78 2,438 2,438 2,438 1.65 1.00 351.72 0.955 N/A 0.546 N/A N/A NO N/A N/A N/A 70.3 1.472 0.000 0.00 0.0520.50 351.99 5.82 1.66 sand to silty sand 272.5 1.00 88 2,563 2,531 2,563 1.74 1.06 332.95 0.952 0.910 0.551 N/A N/A NO N/A N/A N/A 84.0 N/A 0.000 0.00 0.0521.50 491.60 7.01 1.43 sand 271.5 1.00 98 2,688 2,594 2,688 1.61 1.00 431.66 0.950 0.901 0.563 N/A N/A NO N/A N/A N/A 84.8 N/A 0.000 0.00 0.0522.50 392.85 5.90 1.50 sand 270.5 1.00 79 2,813 2,657 2,813 1.68 1.03 349.92 0.948 0.893 0.574 N/A N/A NO N/A N/A N/A 66.3 N/A 0.000 0.00 0.0523.50 352.43 4.24 1.21 sand 269.5 1.00 70 2,938 2,719 2,938 1.64 1.00 302.26 0.945 0.884 0.584 N/A N/A NO N/A N/A N/A 58.2 N/A 0.000 0.00 0.0524.50 209.23 4.17 2.00 sand to silty sand 268.5 1.66 87 3,063 2,782 3,063 1.64 1.00 293.27 0.943 0.876 0.594 N/A N/A NO N/A N/A N/A 75.9 N/A 0.000 0.00 0.0525.50 90.24 2.76 3.08 sandy silt to clayey silt 267.5 1.00 36 3,188 2,844 3,188 2.34 2.08 157.30 0.941 0.869 0.603 0.442 0.883 YES 2.8 31.4 1,200 39.3 N/A 0.011 0.00 0.0526.50 154.75 3.71 2.40 silty sand to sandy silt 266.5 1.00 52 3,313 2,907 3,313 2.10 1.46 187.67 0.938 0.861 0.612 N/A N/A NO N/A N/A N/A 53.1 N/A 0.000 0.00 0.0527.50 510.85 9.34 1.83 sand to silty sand 265.5 1.00 128 3,438 2,970 3,438 1.71 1.04 437.52 0.936 0.854 0.620 N/A N/A NO N/A N/A N/A 104.6 N/A 0.000 0.00 0.0528.50 448.49 6.36 1.42 sand 264.5 1.00 90 3,563 3,032 3,563 1.65 1.00 364.64 0.934 0.847 0.627 N/A N/A NO N/A N/A N/A 67.2 N/A 0.000 0.00 0.0529.50 397.15 4.00 1.01 sand 263.5 1.00 79 3,688 3,095 3,688 1.56 1.00 319.27 0.931 0.840 0.635 N/A N/A NO N/A N/A N/A 58.5 N/A 0.000 0.00 0.0530.50 422.47 4.77 1.13 sand 262.5 1.00 84 3,813 3,157 3,813 1.59 1.00 336.24 0.926 0.833 0.639 N/A N/A NO N/A N/A N/A 61.2 N/A 0.000 0.00 0.0531.50 395.27 3.63 0.92 sand 261.5 1.00 79 3,938 3,220 3,938 1.54 1.00 311.52 0.918 0.827 0.642 N/A N/A NO N/A N/A N/A 56.3 N/A 0.000 0.00 0.0532.50 379.19 4.52 1.19 sand 260.5 1.00 76 4,063 3,283 4,063 1.64 1.00 295.98 0.909 0.820 0.644 N/A N/A NO N/A N/A N/A 53.2 N/A 0.000 0.00 0.0533.50 422.14 5.49 1.30 sand 259.5 1.00 84 4,188 3,345 4,188 1.64 1.00 325.97 0.901 0.814 0.645 N/A N/A NO N/A N/A N/A 58.3 N/A 0.000 0.00 0.0534.50 447.30 3.89 0.87 gravelly sand to sand 258.5 1.00 75 4,313 3,408 4,250 1.49 1.00 342.67 0.893 0.808 0.647 N/A N/A NO N/A N/A N/A 51.1 N/A 0.000 0.00 0.0535.50 252.88 5.33 2.11 sand to silty sand 257.5 1.66 105 4,438 3,470 4,313 1.64 1.00 317.22 0.885 0.802 0.647 N/A N/A NO N/A N/A N/A 77.2 N/A 0.000 0.00 0.0536.50 116.52 4.10 3.53 sandy silt to clayey silt 256.5 1.66 77 4,563 3,533 4,375 2.03 1.34 194.68 0.877 0.796 0.648 N/A N/A NO N/A N/A N/A 67.6 N/A 0.000 0.00 0.0537.50 37.92 1.69 4.52 silty clay to clay 255.5 1.00 25 4,688 3,596 4,438 2.82 N/A N/A 0.869 N/A 0.648 N/A N/A NO N/A N/A N/A N/A N/A N/A N/A 0.0538.50 121.99 3.68 3.02 sandy silt to clayey silt 254.5 1.66 81 4,813 3,658 4,501 1.97 1.26 188.79 0.861 0.785 0.648 N/A N/A NO N/A N/A N/A 69.6 N/A 0.000 0.00 0.0539.50 38.80 1.84 4.80 silty clay to clay 253.5 1.00 26 4,938 3,721 4,563 2.84 N/A N/A 0.852 N/A 0.647 N/A N/A NO N/A N/A N/A N/A N/A N/A N/A 0.0540.50 87.35 2.34 2.69 sandy silt to clayey silt 252.5 1.00 35 5,063 3,783 4,626 2.35 2.13 135.32 0.844 0.795 0.646 0.310 0.530 YES 2.8 25.8 1,200 32.6 N/A 0.286 0.03 0.0241.50 316.50 6.16 1.95 sand to silty sand 251.5 1.00 79 5,187 3,846 4,688 1.88 1.17 266.62 0.836 0.770 0.645 N/A N/A NO N/A N/A N/A 56.7 N/A 0.000 0.00 0.0242.50 382.52 6.31 1.65 sand to silty sand 250.5 1.00 96 5,312 3,908 4,751 1.77 1.09 297.47 0.828 0.765 0.644 N/A N/A NO N/A N/A N/A 67.5 N/A 0.000 0.00 0.0243.50 418.90 5.78 1.38 sand 249.5 1.00 84 5,437 3,971 4,813 1.69 1.03 306.23 0.820 0.760 0.642 N/A N/A NO N/A N/A N/A 54.0 N/A 0.000 0.00 0.0244.50 380.87 4.89 1.29 sand 248.5 1.66 126 5,562 4,034 4,876 1.38 1.00 444.05 0.812 0.755 0.640 N/A N/A NO N/A N/A N/A 80.8 N/A 0.000 0.00 0.0245.50 160.31 3.05 1.90 silty sand to sandy silt 247.5 1.00 53 5,687 4,096 4,939 2.07 1.40 157.29 0.804 0.751 0.638 0.442 0.721 YES 2.8 36.8 1,200 45.8 N/A 0.000 0.00 0.0246.50 197.11 2.98 1.51 sand to silty sand 246.5 1.00 49 5,812 4,159 5,001 1.94 1.23 167.73 0.795 0.746 0.636 N/A N/A NO N/A N/A N/A 35.2 N/A 0.081 0.01 0.0147.50 126.83 2.98 2.36 silty sand to sandy silt 245.5 1.00 42 5,937 4,221 5,064 2.21 1.70 148.64 0.787 0.749 0.633 0.385 0.632 YES 2.8 29.4 1,200 36.9 N/A 0.052 0.01 0.0048.50 284.17 5.75 2.03 sand to silty sand 244.5 1.00 71 6,062 4,284 5,126 1.93 1.22 237.38 0.779 0.737 0.631 N/A N/A NO N/A N/A N/A 49.0 N/A 0.000 0.00 0.0049.50 376.63 8.65 2.30 sand to silty sand 243.5 1.00 94 6,187 4,347 5,189 1.91 1.20 305.68 0.771 0.733 0.628 N/A N/A NO N/A N/A N/A 63.8 N/A 0.000 0.00 0.0050.50 371.51 9.39 2.53 sand to clayey sand (*) 242.5 1.00 186 6,312 4,409 5,252 1.95 1.24 309.58 0.763 0.729 0.625 N/A N/A NO N/A N/A N/A 122.6 N/A 0.000 0.00 0.00
#N/A#N/A#N/A#N/A#N/A#N/A#N/A#N/A#N/A#N/A
max= 1,200min= 1,200avg= 1,200
Page 1
FIGURE 8CPT LIQ Method 2_C-1 high hist water code MCE.XLS
Output Sheet

APPENDIX A FIELD EXPLORATION

Geotechnical Report Los Angeles State Historical Park Los Angeles, California Page A-1 GDC Project No. L-938
APPENDIX A
FIELD EXPLORATION A.1 Introduction Group Delta Consultants, Inc. (GDC) investigated the subsurface conditions at the Los Angeles State Historical Park project site by performing nine hollow-stem auger soil borings (B-1 through B-9) and eleven Cone Penetration Tests (C-1 through C-11) at the site on February 22nd through February 25th, 2011. The borings were drilled to depths ranging from 6 ft to 51 ft below ground surface (bgs). The CPT’s were advanced to depths ranging from 10 ft to 50 feet bgs. Locations of the borings and CPT’s are presented in Figures 2A through 2D of the main report. Exploration summary information is presented in Table A-1. A.2 Soil Drilling and Sampling The boring was advanced by 8-inch diameter hollow stem auger utilizing a hybrid Mobile B-61/CME-85 drill rig with CME 85 automatic hammer operated by our subcontractor Choice Drilling Inc. of Canoga Park, CA. The borings were performed under the continuous technical supervision of a GDC field engineer, who visually inspected the soil samples, maintained detailed logs of the borings, and visually classified the soils in accordance with the Unified Soil Classification System (USCS). A key for soil classification and boring log legend are presented in Figures A-1a and A-1b, respectively. A summary of the field explorations is presented in Table A-1, and the boring logs are presented in Figures A-2a through A-10. Bulk samples of the near-surface soils were obtained from auger cuttings and sealed in plastic bags. Drive samples were collected from the borings at a typical interval of five (5) feet. The sampling utilized Standard Penetration Test (SPT) and Modified California samplers. SPT drive samples were obtained in accordance with ASTM D1586 using a 2-inch outside diameter and 1.38-inch inside diameter split-spoon sampler without lining. The soil recovered from the SPT sampling was sealed in plastic bags to retain the natural moisture content. The California sampler is a 3-inch outside diameter split barrel sampler lined with a 2.42-inch inside diameter metal rings. Compared to the SPT, the California sampler provides relatively undisturbed samples. California samples were removed from the sampler, retained in the metal rings and placed in sealed plastic canisters to prevent loss of moisture. At each sampling interval, the drive samplers were fitted onto a sampling rod, lowered to the bottom of the boring, and driven into the soil a depth of 18-inches or refusal (more than 50 blows per 6 inches) by repeated blows of a 140-lb CME
N:\Projects\_LA\L900\L-938 LA State Historical Park\Report\Appendices\L-938_APPENDIX A - text.doc

Geotechnical Report Los Angeles State Historical Park Los Angeles, California Page A-2 GDC Project No. L-938
N:\Projects\_LA\L900\L-938 LA State Historical Park\Report\Appendices\L-938_APPENDIX A - text.doc
automatic hammer free-falling a height of 30-inches. SPT blow counts are often used as an index of the relative density and resistance of the sampled materials. The number of blows to drive the sampler each 6-inch increment into the soil was recorded on the boring logs and it was used to estimate relative soil density or consistency. For purposes of estimating relative densities or consistency, California drive sampler blow counts can be approximately converted to equivalent SPT blow counts by multiplying the field blow counts by a factor of 0.67 to correct for larger sampler end-area. The CME Automatic hammer has a hammer efficiency of about 80%. An energy correction factor of 1.33 (=80/60) may be used to adjust to 60 percent efficiency for relative density classification. Drive sample blow counts and corresponding density/consistency classifications are presented on the boring logs. Groundwater recorded at the time of drilling is indicated on the boring logs in Figures A-2a through A-10. Water-bentonite slurry was added into the hollow-stem when groundwater was encountered to mitigate the heaving of sand into the auger stem and to provide better blowcount and samples. Upon withdrawal of the auger, bentonite chips were added up to 5 feet above the groundwater table. The remaining depth was backfilled with soil cuttings. Excess cuttings and fluids were placed in 55-gallon drums, tested for chemicals, and disposed of off-site. Geotechnical samples were sealed in plastic bags to prevent moisture loss, and transported to the geotechnical laboratory for further inspection and geotechnical testing. The soils were classified in the field and further examined in the laboratory in accordance with the Unified Soil Classification System (see Figure A-1a). Field classifications were modified where necessary on the basis of laboratory test results. Detailed logs of the soil borings including blow count data, percent passing the No. 200 sieve, Atterberg Limits, in-situ moisture content and dry density are presented in Figures A-2a through A-10. Additional laboratory tests performed (other than those where results are shown on the logs) are indicated on the boring logs in the column labeled "Other Tests". Figure A-1b lists abbreviations used on the logs for “Other Tests”. Descriptions of the laboratory tests performed and a summary of the results are presented in Appendix B. A.3 Cone Penetration Testing The CPT soundings were performed by Middle Earth Geo Testing Inc. A 10-cm2 cone penetrometer was deployed using a 25-ton CPT rig. Parameters measured nearly continuously during the CPT are soil bearing resistance at the cone tip (qc), soil frictional resistance along the cylindrical friction sleeve (fs), and pore water pressure directly behind the cone tip (U). These measured values are then used to estimate the type and engineering properties of soils being penetrated using relationships between qc, fs, and U (Robertson et al., 1986). Downhole shear wave velocities are measured in CPT C-3. The CPT soundings were backfilled with bentonite pellets.
Geotechnical Report Los Angeles State Historical Park Los Angeles, California Page A-3 GDC Project No. L-938
N:\Projects\_LA\L900\L-938 LA State Historical Park\Report\Appendices\L-938_APPENDIX A - text.doc
The CPT data in graphical form and accompanying CPT data interpretation are presented in on Figures A-11a through A-21b, and shear wave measurement is included in Figure A-22. A.4 List of Attached Tables and Figures The following figures are attached and complete this appendix: Table 1 Field Investigation Summary Figure A-1a Key for Soil Classification Figure A-1b Boring Legend Figures A-2a to A-10 Boring Logs Figures A-11a to A-21b CPT Logs and Interpretation Figure A-22 Shear Wave Velocity Measurement

Depth(ft)
Elevation(ft)
B-1 294 51 33.5 260.5B-2 294.5 6.5 Not Encountered Not EncounteredB-3 297 50.5 34 263 Drill rig lifting off jacks at 46 ft.B-4 297.5 11 Not Encountered Not Encountered
B-5 300 46 44 256
Encountered black sand layerwith slight tar odor and
a green shimmer at 36 ft.
Strong sulfer odor at 40 ft.
Boring abandoned at 46 ft due to odor.
B-6 298.5 10.5 Not Encountered Not EncounteredB-7 302 11.5 Not Encountered Not EncounteredB-8 309 6 Not Encountered Not EncounteredB-9 304 6.5 Not Encountered Not Encountered
CPT-1 293.5 50 Not Measured Not MeasuredHand augered first 1.5 ft
Hole caved at 20 ftCPT-2 296 20 Not Encountered Not Encountered Hand augered first 1.5 ftCPT-3 300 22 Not Encountered Not Encountered Hand augered first 1.5 ftCPT-4 298 27 Not Encountered Not Encountered Hand augered first 1.5 ftCPT-5 303.5 18 Not Encountered Not EncounteredCPT-6 304 10 Not Encountered Not EncounteredCPT-7 311 15 Not Encountered Not EncounteredCPT-8 307 18 Not Encountered Not EncounteredCPT-9 302 15 Not Encountered Not EncounteredCPT-10 300 16 Not Encountered Not Encountered Hand augered first 1.5 ftCPT-11 299.5 19 Not Encountered Not Encountered Hand augered first 1.5 ft
Note: Elevations estimated to nearest 0.5 ft from topographic contours in Figure 2.
Groundwater
Notes
TABLE A-1FIELD INVESTIGATION SUMMARY TABLE
Exploration No.
Total Depth
(ft)
ApproximateSurface
Elevation(ft)
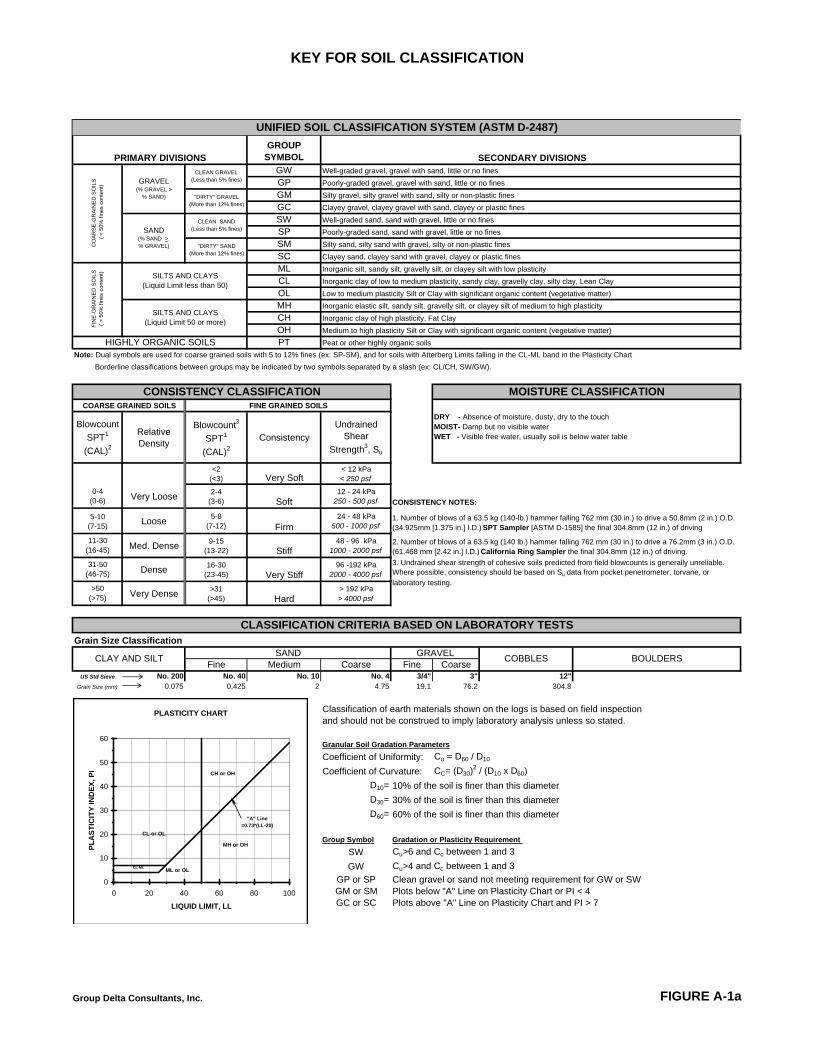
KEY FOR SOIL CLASSIFICATION
GROUP SYMBOL
GW Well-graded gravel, gravel with sand, little or no fines
GP Poorly-graded gravel, gravel with sand, little or no fines
GM Silty gravel, silty gravel with sand, silty or non-plastic fines
GC Clayey gravel, clayey gravel with sand, clayey or plastic fines
SW Well-graded sand, sand with gravel, little or no fines
SP Poorly-graded sand, sand with gravel, little or no fines
SM Silty sand, silty sand with gravel, silty or non-plastic fines
SC Clayey sand, clayey sand with gravel, clayey or plastic fines
ML Inorganic silt, sandy silt, gravelly silt, or clayey silt with low plasticity
CL Inorganic clay of low to medium plasticity, sandy clay, gravelly clay, silty clay, Lean Clay
OL Low to medium plasticity Silt or Clay with significant organic content (vegetative matter)
MH Inorganic elastic silt, sandy silt, gravelly silt, or clayey silt of medium to high plasticity
CH Inorganic clay of high plasticity, Fat Clay
OH Medium to high plasticity Silt or Clay with significant organic content (vegetative matter)
PT Peat or other highly organic soils
Note: Dual symbols are used for coarse grained soils with 5 to 12% fines (ex: SP-SM), and for soils with Atterberg Limits falling in the CL-ML band in the Plasticity Chart
Borderline classifications between groups may be indicated by two symbols separated by a slash (ex: CL/CH, SW/GW).
Blowcount
SPT1
(CAL)2
RelativeDensity
Blowcount3
SPT1
(CAL)2
Consistency
Undrained Shear
Strength3, Su
<2 (<3) Very Soft
< 12 kPa < 250 psf
0-4 (0-6) Very Loose
2-4 (3-6) Soft
12 - 24 kPa250 - 500 psf
5-10 (7-15)
Loose5-8
(7-12) Firm24 - 48 kPa
500 - 1000 psf
11-30 (16-45) Med. Dense
9-15 (13-22) Stiff
48 - 96 kPa1000 - 2000 psf
31-50 (46-75) Dense
16-30 (23-45) Very Stiff
96 -192 kPa2000 - 4000 psf
>50 (>75) Very Dense
>31 (>45) Hard
> 192 kPa > 4000 psf
Grain Size Classification
Fine Medium Coarse Fine CoarseUS Std Sieve No. 200 No. 40 No. 10 No. 4 3/4" 3" 12"
Grain Size (mm) 0.075 0.425 2 4.75 19.1 76.2 304.8
Classification of earth materials shown on the logs is based on field inspectionand should not be construed to imply laboratory analysis unless so stated.
Granular Soil Gradation ParametersCoefficient of Uniformity: Cu = D60 / D10
Coefficient of Curvature: CC= (D30)2 / (D10 x D60)
D10= 10% of the soil is finer than this diameter
D30= 30% of the soil is finer than this diameter
D60= 60% of the soil is finer than this diameter
Group Symbol Gradation or Plasticity Requirement SW Cu>6 and Cc between 1 and 3
GW Cu>4 and Cc between 1 and 3
GP or SP Clean gravel or sand not meeting requirement for GW or SWGM or SM Plots below "A" Line on Plasticity Chart or PI < 4GC or SC Plots above "A" Line on Plasticity Chart and PI > 7
GRAVEL (% GRAVEL >
% SAND)
SAND (% SAND >. % GRAVEL)
PRIMARY DIVISIONSCLEAN GRAVEL
(Less than 5% fines)
"DIRTY" GRAVEL (More than 12% fines)
UNIFIED SOIL CLASSIFICATION SYSTEM (ASTM D-2487)
SECONDARY DIVISIONS
COARSE GRAINED SOILS
FIN
E-G
RA
INE
D S
OIL
S(
> 5
0% f
ines
con
tent
)
HIGHLY ORGANIC SOILS
SILTS AND CLAYS (Liquid Limit less than 50)
SILTS AND CLAYS (Liquid Limit 50 or more)
CLEAN SAND (Less than 5% fines)
"DIRTY" SAND (More than 12% fines)
CO
AR
SE
-GR
AIN
ED
SO
ILS
(
< 5
0% f
ines
con
tent
)
CONSISTENCY CLASSIFICATIONFINE GRAINED SOILS
MOISTURE CLASSIFICATION
DRY - Absence of moisture, dusty, dry to the touch MOIST- Damp but no visible water WET - Visible free water, usually soil is below water table
CLASSIFICATION CRITERIA BASED ON LABORATORY TESTS
CLAY AND SILTSAND GRAVEL
COBBLES BOULDERS
3. Undrained shear strength of cohesive soils predicted from field blowcounts is generally unreliable. Where possible, consistency should be based on Su data from pocket penetrometer, torvane, or
laboratory testing.
2. Number of blows of a 63.5 kg (140 lb.) hammer falling 762 mm (30 in.) to drive a 76.2mm (3 in.) O.D. (61.468 mm [2.42 in.] I.D.) California Ring Sampler the final 304.8mm (12 in.) of driving.
1. Number of blows of a 63.5 kg (140-lb.) hammer falling 762 mm (30 in.) to drive a 50.8mm (2 in.) O.D. (34.925mm [1.375 in.] I.D.) SPT Sampler [ASTM D-1585] the final 304.8mm (12 in.) of driving
CONSISTENCY NOTES:
PLASTICITY CHART
0
10
20
30
40
50
60
0 20 40 60 80 100
LIQUID LIMIT, LL
PLA
STIC
ITY
IND
EX, P
I
CL or OL
CH or OH
ML or OL
MH or OH
CL-ML
"A" Line=0.73*(LL-20)
Group Delta Consultants, Inc. FIGURE A-1a

1
2
3
GRAB, CAL, SPT - Refers to the sampling method asdescribed below
GRAB - Refers to collecting sample by method of placingdisturbed soil cuttings into a plastic bag
CAL (CALIFORNIA MODIFIED) - A 3.0" o.d. split tubesampler lined with 2.42" i.d. metal sample rings generallydriven into the soil by a free falling hammer
SPT (STANDARD PENETRATION TEST) - A 2.0" o.d. splitspoon sampler with a 1.375" i.d. generally driven into thesoil with a 140# hammer free falling a height of 30"
PP = POCKET PENETROMETER READING (TSF)
ABBREVIATIONS FOR OTHER TESTS:
CR = CorrosivityEI = Expansion IndexPA = Particle Size AnalysisPI = Plasticity IndexR = R-Value
GROUP DELTA CONSULTANTS, INC.
25 / na
S. Prenovost
CME 85
DR
Y D
EN
SIT
Y(p
cf)
DRILLING METHOD
LEGEND
32 Mauchly, Suite B
START
SA
MP
LE T
YP
EBORING DIA. (in)
L-938
Hammer Efficiency = 80%
GR
AP
HIC
LOG
LOGGED BY1 of 1
PE
NE
TRA
TIO
NR
ES
ISTA
NC
E(B
LOW
S /
6 IN
)
OTH
ER
TES
TS
5
10
15
20
DESCRIPTION AND CLASSIFICATION
PROJECT NAME
C. Scheyhing
Los Angeles State Historical Park
CHECKED BY
Hammer: 140 lbs., Drop: 30 in.SAMPLING METHOD
DEPTH/ELEV. GROUND WATER (ft)
DRILLING COMPANY2/24/2010
ELE
VA
TIO
N(fe
et)
SITE LOCATION
60
PROJECT NUMBER
Los Angeles, California
% P
AS
SIN
G #
200
BORING RECORD
8TOTAL DEPTH (ft)
BORING
Choice Drilling Hollow Stem Auger
FINISH
BLO
W/F
T "N
"
SA
MP
LE N
O.
5/24/2010
FIGURE
A-1bIrvine, CA 92618
DE
PTH
(fee
t)
GROUND ELEV (ft)DRILLING EQUIPMENT
NOTES
MO
ISTU
RE
(%)
SP
T N
THIS SUMMARY APPLIES ONLY AT THE LOCATION OFTHIS BORING AND AT THE TIME OF DRILLING.SUBSURFACE CONDITIONS MAY DIFFER AT OTHERLOCATIONS AND MAY CHANGE AT THIS LOCATIONWITH THE PASSAGE OF TIME. THE DATA PRESENTEDIS A SIMPLIFICATION OF THE ACTUAL CONDITIONSENCOUNTERED.
SHEET NO.
GD
C_L
OG
_BO
RIN
G_M
MX
_SO
IL L
AS
HP
.GP
J G
DC
LOG
.GD
T 3
/17/
11
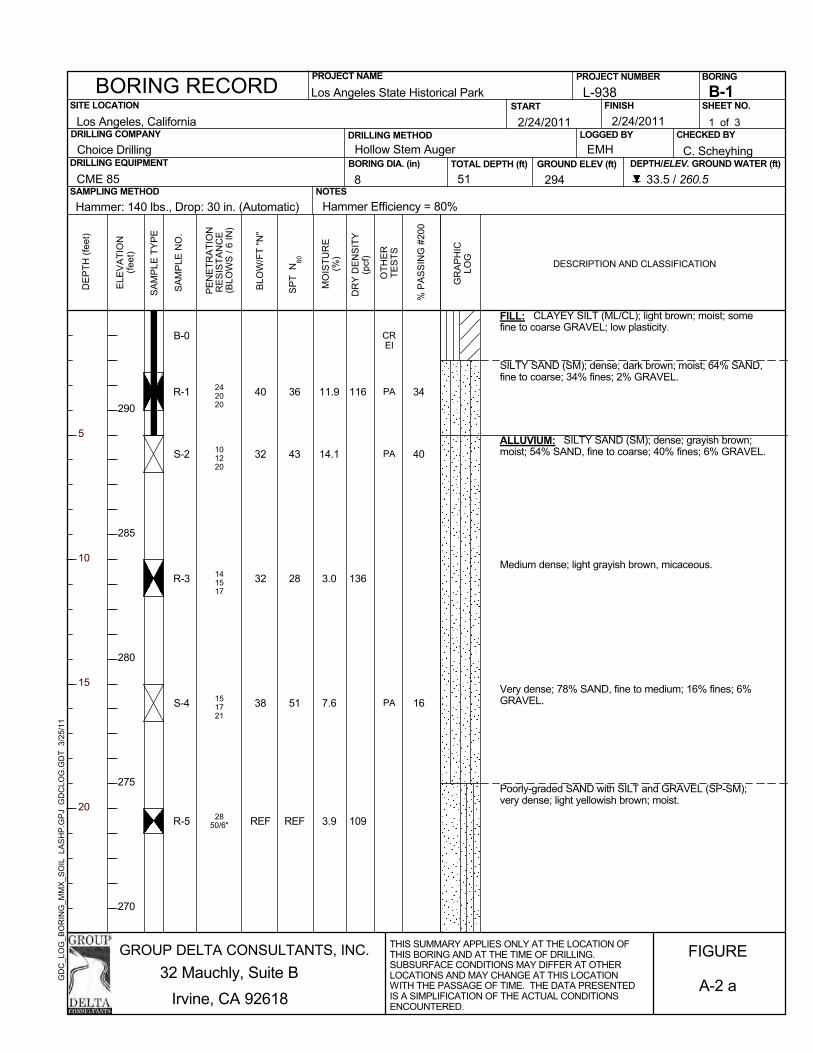
242020
101220
141517
151721
2850/6"
B-0
R-1
S-2
R-3
S-4
R-5
FILL: CLAYEY SILT (ML/CL); light brown; moist; somefine to coarse GRAVEL; low plasticity.
SILTY SAND (SM); dense; dark brown; moist; 64% SAND,fine to coarse; 34% fines; 2% GRAVEL.
ALLUVIUM: SILTY SAND (SM); dense; grayish brown;moist; 54% SAND, fine to coarse; 40% fines; 6% GRAVEL.
Medium dense; light grayish brown, micaceous.
Very dense; 78% SAND, fine to medium; 16% fines; 6%GRAVEL.
Poorly-graded SAND with SILT and GRAVEL (SP-SM);very dense; light yellowish brown; moist.
34
40
16
CREI
PA
PA
PA
11.9
14.1
3.0
7.6
3.9
40
32
32
38
REF
36
43
28
51
REF
116
136
109
GROUP DELTA CONSULTANTS, INC.
51 294 33.5 / 260.5
EMH
CME 85
DR
Y D
EN
SIT
Y(p
cf)
DRILLING METHOD
B-1
32 Mauchly, Suite B
START
SA
MP
LE T
YP
EBORING DIA. (in)
L-938
Hammer Efficiency = 80%
GR
AP
HIC
LOG
LOGGED BY1 of 3
PE
NE
TRA
TIO
NR
ES
ISTA
NC
E(B
LOW
S /
6 IN
)
OTH
ER
TES
TS
5
10
15
20
DESCRIPTION AND CLASSIFICATION
PROJECT NAME
C. Scheyhing
Los Angeles State Historical Park
CHECKED BY
Hammer: 140 lbs., Drop: 30 in. (Automatic)SAMPLING METHOD
DEPTH/ELEV. GROUND WATER (ft)
DRILLING COMPANY2/24/2011
ELE
VA
TIO
N(fe
et)
SITE LOCATION
60
PROJECT NUMBER
Los Angeles, California
% P
AS
SIN
G #
200
BORING RECORD
8TOTAL DEPTH (ft)
BORING
Choice Drilling Hollow Stem Auger
FINISH
290
285
280
275
270
BLO
W/F
T "N
"
SA
MP
LE N
O.
2/24/2011
FIGURE
A-2 aIrvine, CA 92618
DE
PTH
(fee
t)
GROUND ELEV (ft)DRILLING EQUIPMENT
NOTES
MO
ISTU
RE
(%)
SP
T N
THIS SUMMARY APPLIES ONLY AT THE LOCATION OFTHIS BORING AND AT THE TIME OF DRILLING.SUBSURFACE CONDITIONS MAY DIFFER AT OTHERLOCATIONS AND MAY CHANGE AT THIS LOCATIONWITH THE PASSAGE OF TIME. THE DATA PRESENTEDIS A SIMPLIFICATION OF THE ACTUAL CONDITIONSENCOUNTERED.
SHEET NO.
GD
C_L
OG
_BO
RIN
G_M
MX
_SO
IL L
AS
HP
.GP
J G
DC
LOG
.GD
T 3
/25/
11
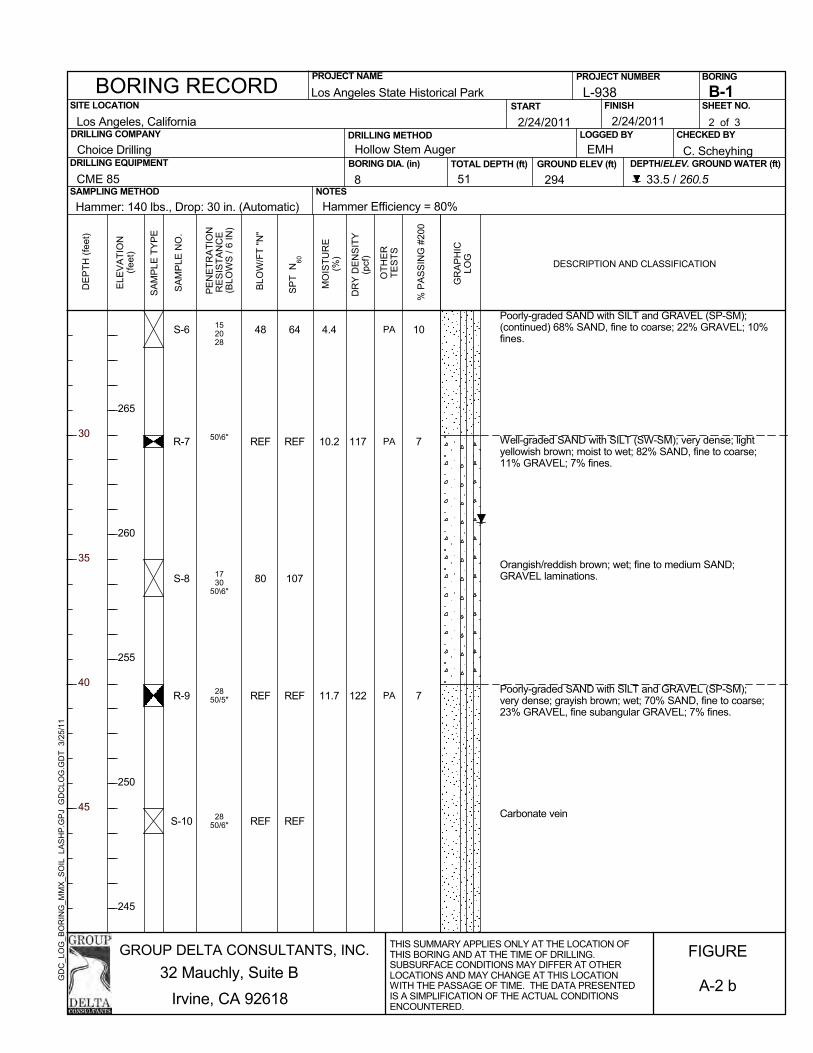
152028
50\6"
1730
50\6"
2850/5"
2850/6"
S-6
R-7
S-8
R-9
S-10
Poorly-graded SAND with SILT and GRAVEL (SP-SM);(continued) 68% SAND, fine to coarse; 22% GRAVEL; 10%fines.
Well-graded SAND with SILT (SW-SM); very dense; lightyellowish brown; moist to wet; 82% SAND, fine to coarse;11% GRAVEL; 7% fines.
Orangish/reddish brown; wet; fine to medium SAND;GRAVEL laminations.
Poorly-graded SAND with SILT and GRAVEL (SP-SM);very dense; grayish brown; wet; 70% SAND, fine to coarse;23% GRAVEL, fine subangular GRAVEL; 7% fines.
Carbonate vein
10
7
7
PA
PA
PA
4.4
10.2
11.7
48
REF
80
REF
REF
64
REF
107
REF
REF
117
122
GROUP DELTA CONSULTANTS, INC.
51 294 33.5 / 260.5
EMH
CME 85
DR
Y D
EN
SIT
Y(p
cf)
DRILLING METHOD
B-1
32 Mauchly, Suite B
START
SA
MP
LE T
YP
EBORING DIA. (in)
L-938
Hammer Efficiency = 80%
GR
AP
HIC
LOG
LOGGED BY2 of 3
PE
NE
TRA
TIO
NR
ES
ISTA
NC
E(B
LOW
S /
6 IN
)
OTH
ER
TES
TS
30
35
40
45
DESCRIPTION AND CLASSIFICATION
PROJECT NAME
C. Scheyhing
Los Angeles State Historical Park
CHECKED BY
Hammer: 140 lbs., Drop: 30 in. (Automatic)SAMPLING METHOD
DEPTH/ELEV. GROUND WATER (ft)
DRILLING COMPANY2/24/2011
ELE
VA
TIO
N(fe
et)
SITE LOCATION
60
PROJECT NUMBER
Los Angeles, California
% P
AS
SIN
G #
200
BORING RECORD
8TOTAL DEPTH (ft)
BORING
Choice Drilling Hollow Stem Auger
FINISH
265
260
255
250
245
BLO
W/F
T "N
"
SA
MP
LE N
O.
2/24/2011
FIGURE
A-2 bIrvine, CA 92618
DE
PTH
(fee
t)
GROUND ELEV (ft)DRILLING EQUIPMENT
NOTES
MO
ISTU
RE
(%)
SP
T N
THIS SUMMARY APPLIES ONLY AT THE LOCATION OFTHIS BORING AND AT THE TIME OF DRILLING.SUBSURFACE CONDITIONS MAY DIFFER AT OTHERLOCATIONS AND MAY CHANGE AT THIS LOCATIONWITH THE PASSAGE OF TIME. THE DATA PRESENTEDIS A SIMPLIFICATION OF THE ACTUAL CONDITIONSENCOUNTERED.
SHEET NO.
GD
C_L
OG
_BO
RIN
G_M
MX
_SO
IL L
AS
HP
.GP
J G
DC
LOG
.GD
T 3
/25/
11

3050/6"R-11
SILTY SAND (SM); very dense, dark gray; wet; 65% SAND,fine to medium; 25% fines; 10% GRAVEL.Groundwater encountered at 33.5 feetBore hole filled with bentonite chips up to 5 feet abovewater table and soil cuttings.
25PA20.4REF REF 107
GROUP DELTA CONSULTANTS, INC.
51 294 33.5 / 260.5
EMH
CME 85
DR
Y D
EN
SIT
Y(p
cf)
DRILLING METHOD
B-1
32 Mauchly, Suite B
START
SA
MP
LE T
YP
EBORING DIA. (in)
L-938
Hammer Efficiency = 80%
GR
AP
HIC
LOG
LOGGED BY3 of 3
PE
NE
TRA
TIO
NR
ES
ISTA
NC
E(B
LOW
S /
6 IN
)
OTH
ER
TES
TS
55
60
65
70
DESCRIPTION AND CLASSIFICATION
PROJECT NAME
C. Scheyhing
Los Angeles State Historical Park
CHECKED BY
Hammer: 140 lbs., Drop: 30 in. (Automatic)SAMPLING METHOD
DEPTH/ELEV. GROUND WATER (ft)
DRILLING COMPANY2/24/2011
ELE
VA
TIO
N(fe
et)
SITE LOCATION
60
PROJECT NUMBER
Los Angeles, California
% P
AS
SIN
G #
200
BORING RECORD
8TOTAL DEPTH (ft)
BORING
Choice Drilling Hollow Stem Auger
FINISH
240
235
230
225
220
BLO
W/F
T "N
"
SA
MP
LE N
O.
2/24/2011
FIGURE
A-2 cIrvine, CA 92618
DE
PTH
(fee
t)
GROUND ELEV (ft)DRILLING EQUIPMENT
NOTES
MO
ISTU
RE
(%)
SP
T N
THIS SUMMARY APPLIES ONLY AT THE LOCATION OFTHIS BORING AND AT THE TIME OF DRILLING.SUBSURFACE CONDITIONS MAY DIFFER AT OTHERLOCATIONS AND MAY CHANGE AT THIS LOCATIONWITH THE PASSAGE OF TIME. THE DATA PRESENTEDIS A SIMPLIFICATION OF THE ACTUAL CONDITIONSENCOUNTERED.
SHEET NO.
GD
C_L
OG
_BO
RIN
G_M
MX
_SO
IL L
AS
HP
.GP
J G
DC
LOG
.GD
T 3
/25/
11
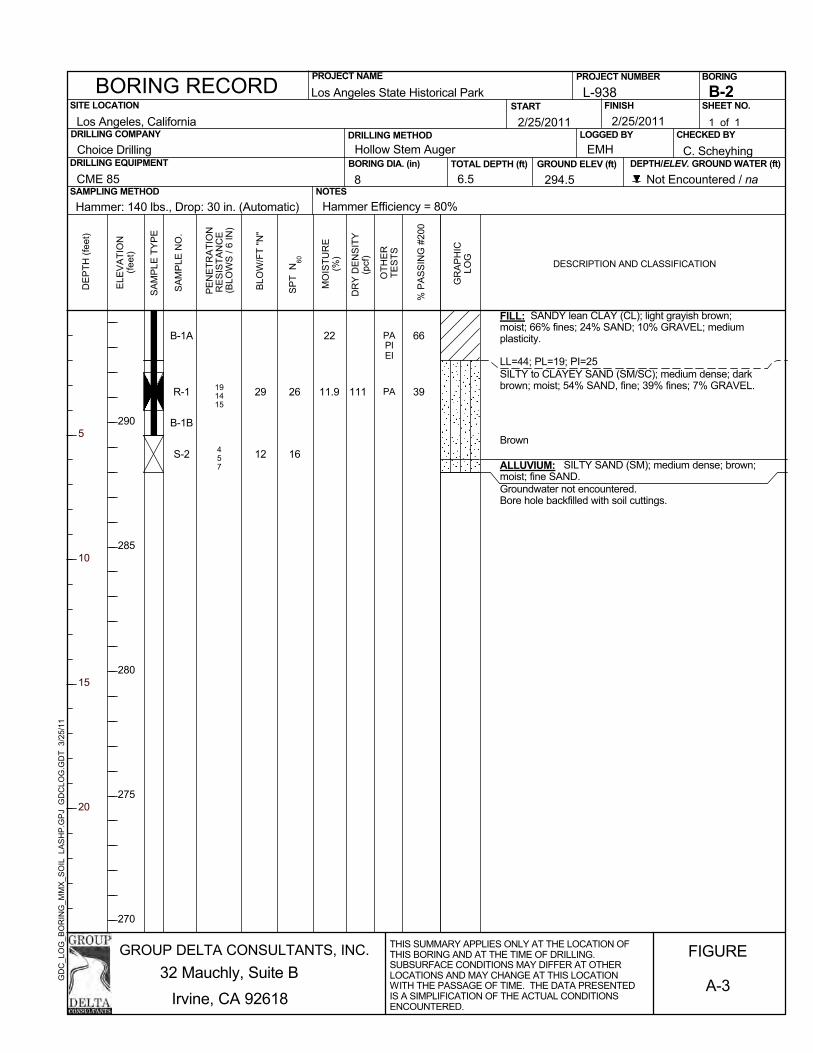
191415
457
B-1A
R-1
B-1B
S-2
FILL: SANDY lean CLAY (CL); light grayish brown;moist; 66% fines; 24% SAND; 10% GRAVEL; mediumplasticity.
LL=44; PL=19; PI=25SILTY to CLAYEY SAND (SM/SC); medium dense; darkbrown; moist; 54% SAND, fine; 39% fines; 7% GRAVEL.
Brown
ALLUVIUM: SILTY SAND (SM); medium dense; brown;moist; fine SAND.Groundwater not encountered.Bore hole backfilled with soil cuttings.
66
39
PAPIEI
PA
22
11.929
12
26
16
111
GROUP DELTA CONSULTANTS, INC.
6.5 294.5 Not Encountered / na
EMH
CME 85
DR
Y D
EN
SIT
Y(p
cf)
DRILLING METHOD
B-2
32 Mauchly, Suite B
START
SA
MP
LE T
YP
EBORING DIA. (in)
L-938
Hammer Efficiency = 80%
GR
AP
HIC
LOG
LOGGED BY1 of 1
PE
NE
TRA
TIO
NR
ES
ISTA
NC
E(B
LOW
S /
6 IN
)
OTH
ER
TES
TS
5
10
15
20
DESCRIPTION AND CLASSIFICATION
PROJECT NAME
C. Scheyhing
Los Angeles State Historical Park
CHECKED BY
Hammer: 140 lbs., Drop: 30 in. (Automatic)SAMPLING METHOD
DEPTH/ELEV. GROUND WATER (ft)
DRILLING COMPANY2/25/2011
ELE
VA
TIO
N(fe
et)
SITE LOCATION
60
PROJECT NUMBER
Los Angeles, California
% P
AS
SIN
G #
200
BORING RECORD
8TOTAL DEPTH (ft)
BORING
Choice Drilling Hollow Stem Auger
FINISH
290
285
280
275
270
BLO
W/F
T "N
"
SA
MP
LE N
O.
2/25/2011
FIGURE
A-3Irvine, CA 92618
DE
PTH
(fee
t)
GROUND ELEV (ft)DRILLING EQUIPMENT
NOTES
MO
ISTU
RE
(%)
SP
T N
THIS SUMMARY APPLIES ONLY AT THE LOCATION OFTHIS BORING AND AT THE TIME OF DRILLING.SUBSURFACE CONDITIONS MAY DIFFER AT OTHERLOCATIONS AND MAY CHANGE AT THIS LOCATIONWITH THE PASSAGE OF TIME. THE DATA PRESENTEDIS A SIMPLIFICATION OF THE ACTUAL CONDITIONSENCOUNTERED.
SHEET NO.
GD
C_L
OG
_BO
RIN
G_M
MX
_SO
IL L
AS
HP
.GP
J G
DC
LOG
.GD
T 3
/25/
11
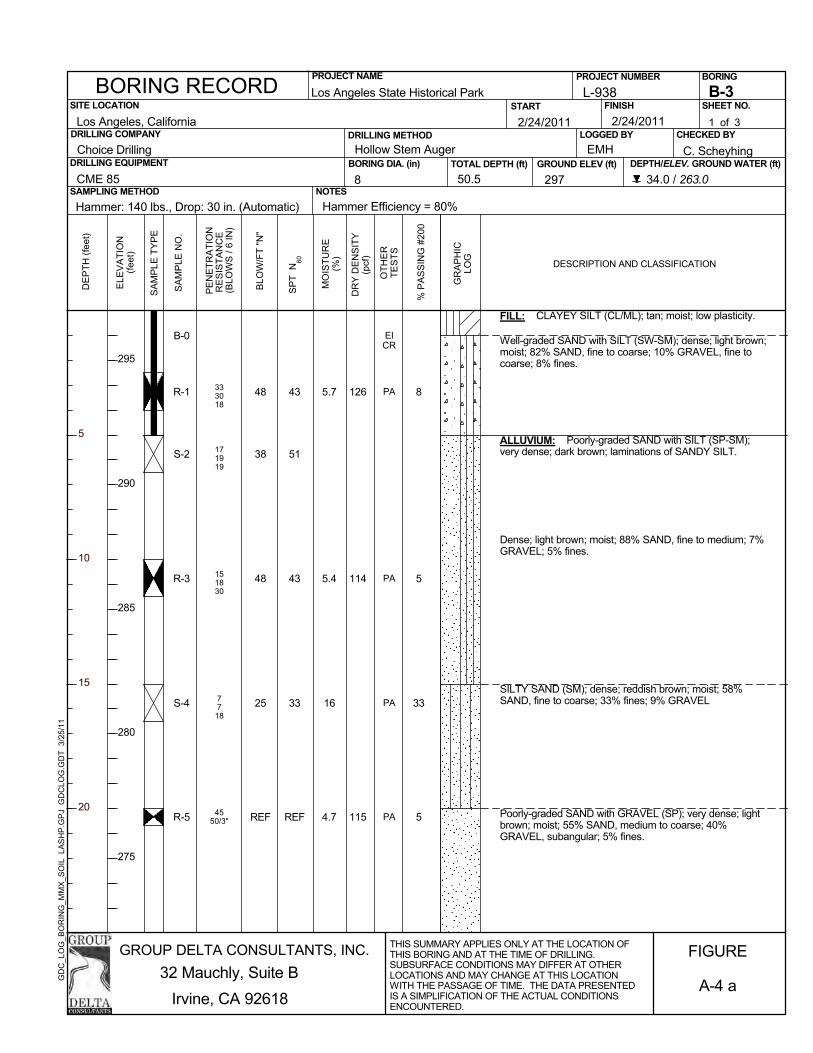
333018
171919
151830
77
18
4550/3"
B-0
R-1
S-2
R-3
S-4
R-5
FILL: CLAYEY SILT (CL/ML); tan; moist; low plasticity.
Well-graded SAND with SILT (SW-SM); dense; light brown;moist; 82% SAND, fine to coarse; 10% GRAVEL, fine tocoarse; 8% fines.
ALLUVIUM: Poorly-graded SAND with SILT (SP-SM);very dense; dark brown; laminations of SANDY SILT.
Dense; light brown; moist; 88% SAND, fine to medium; 7%GRAVEL; 5% fines.
SILTY SAND (SM); dense; reddish brown; moist; 58%SAND, fine to coarse; 33% fines; 9% GRAVEL
Poorly-graded SAND with GRAVEL (SP); very dense; lightbrown; moist; 55% SAND, medium to coarse; 40%GRAVEL, subangular; 5% fines.
8
5
33
5
EICR
PA
PA
PA
PA
5.7
5.4
16
4.7
48
38
48
25
REF
43
51
43
33
REF
126
114
115
GROUP DELTA CONSULTANTS, INC.
50.5 297 34.0 / 263.0
EMH
CME 85
DR
Y D
EN
SIT
Y(p
cf)
DRILLING METHOD
B-3
32 Mauchly, Suite B
START
SA
MP
LE T
YP
EBORING DIA. (in)
L-938
Hammer Efficiency = 80%
GR
AP
HIC
LOG
LOGGED BY1 of 3
PE
NE
TRA
TIO
NR
ES
ISTA
NC
E(B
LOW
S /
6 IN
)
OTH
ER
TES
TS
5
10
15
20
DESCRIPTION AND CLASSIFICATION
PROJECT NAME
C. Scheyhing
Los Angeles State Historical Park
CHECKED BY
Hammer: 140 lbs., Drop: 30 in. (Automatic)SAMPLING METHOD
DEPTH/ELEV. GROUND WATER (ft)
DRILLING COMPANY2/24/2011
ELE
VA
TIO
N(fe
et)
SITE LOCATION
60
PROJECT NUMBER
Los Angeles, California
% P
AS
SIN
G #
200
BORING RECORD
8TOTAL DEPTH (ft)
BORING
Choice Drilling Hollow Stem Auger
FINISH
295
290
285
280
275
BLO
W/F
T "N
"
SA
MP
LE N
O.
2/24/2011
FIGURE
A-4 aIrvine, CA 92618
DE
PTH
(fee
t)
GROUND ELEV (ft)DRILLING EQUIPMENT
NOTES
MO
ISTU
RE
(%)
SP
T N
THIS SUMMARY APPLIES ONLY AT THE LOCATION OFTHIS BORING AND AT THE TIME OF DRILLING.SUBSURFACE CONDITIONS MAY DIFFER AT OTHERLOCATIONS AND MAY CHANGE AT THIS LOCATIONWITH THE PASSAGE OF TIME. THE DATA PRESENTEDIS A SIMPLIFICATION OF THE ACTUAL CONDITIONSENCOUNTERED.
SHEET NO.
GD
C_L
OG
_BO
RIN
G_M
MX
_SO
IL L
AS
HP
.GP
J G
DC
LOG
.GD
T 3
/25/
11
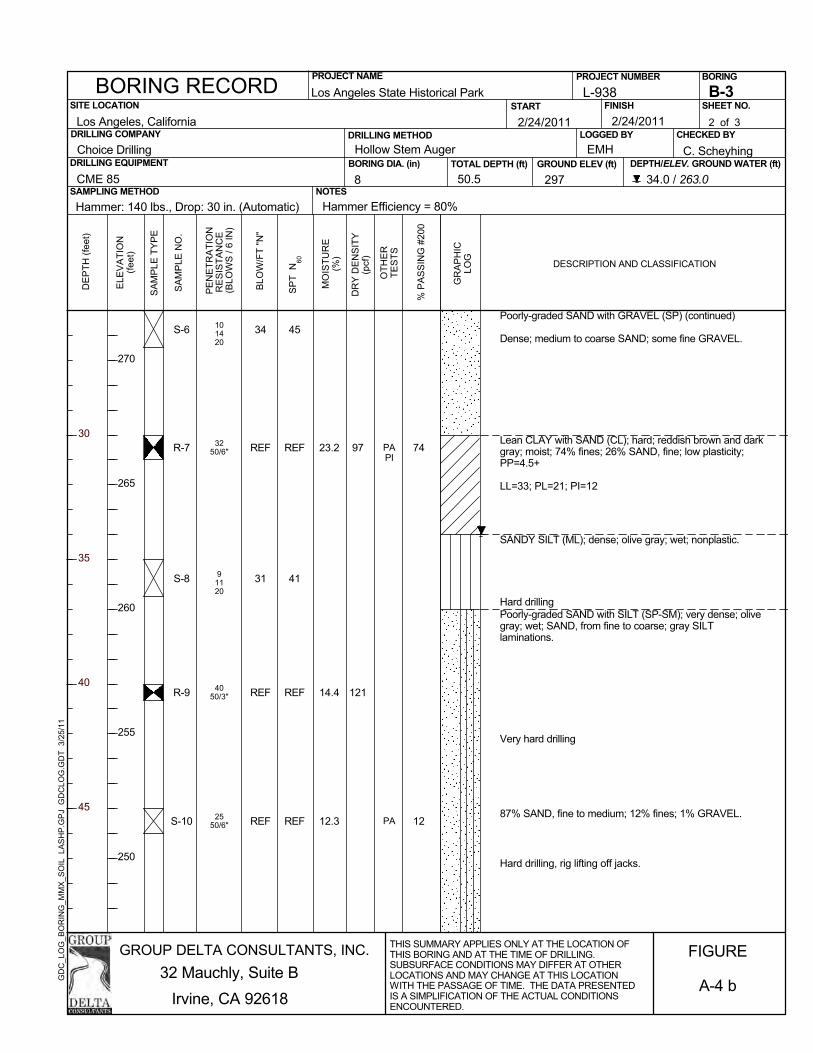
101420
3250/6"
91120
4050/3"
2550/6"
S-6
R-7
S-8
R-9
S-10
Poorly-graded SAND with GRAVEL (SP) (continued)
Dense; medium to coarse SAND; some fine GRAVEL.
Lean CLAY with SAND (CL); hard; reddish brown and darkgray; moist; 74% fines; 26% SAND, fine; low plasticity;PP=4.5+
LL=33; PL=21; PI=12
SANDY SILT (ML); dense; olive gray; wet; nonplastic.
Hard drillingPoorly-graded SAND with SILT (SP-SM); very dense; olivegray; wet; SAND, from fine to coarse; gray SILTlaminations.
Very hard drilling
87% SAND, fine to medium; 12% fines; 1% GRAVEL.
Hard drilling, rig lifting off jacks.
74
12
PAPI
PA
23.2
14.4
12.3
34
REF
31
REF
REF
45
REF
41
REF
REF
97
121
GROUP DELTA CONSULTANTS, INC.
50.5 297 34.0 / 263.0
EMH
CME 85
DR
Y D
EN
SIT
Y(p
cf)
DRILLING METHOD
B-3
32 Mauchly, Suite B
START
SA
MP
LE T
YP
EBORING DIA. (in)
L-938
Hammer Efficiency = 80%
GR
AP
HIC
LOG
LOGGED BY2 of 3
PE
NE
TRA
TIO
NR
ES
ISTA
NC
E(B
LOW
S /
6 IN
)
OTH
ER
TES
TS
30
35
40
45
DESCRIPTION AND CLASSIFICATION
PROJECT NAME
C. Scheyhing
Los Angeles State Historical Park
CHECKED BY
Hammer: 140 lbs., Drop: 30 in. (Automatic)SAMPLING METHOD
DEPTH/ELEV. GROUND WATER (ft)
DRILLING COMPANY2/24/2011
ELE
VA
TIO
N(fe
et)
SITE LOCATION
60
PROJECT NUMBER
Los Angeles, California
% P
AS
SIN
G #
200
BORING RECORD
8TOTAL DEPTH (ft)
BORING
Choice Drilling Hollow Stem Auger
FINISH
270
265
260
255
250
BLO
W/F
T "N
"
SA
MP
LE N
O.
2/24/2011
FIGURE
A-4 bIrvine, CA 92618
DE
PTH
(fee
t)
GROUND ELEV (ft)DRILLING EQUIPMENT
NOTES
MO
ISTU
RE
(%)
SP
T N
THIS SUMMARY APPLIES ONLY AT THE LOCATION OFTHIS BORING AND AT THE TIME OF DRILLING.SUBSURFACE CONDITIONS MAY DIFFER AT OTHERLOCATIONS AND MAY CHANGE AT THIS LOCATIONWITH THE PASSAGE OF TIME. THE DATA PRESENTEDIS A SIMPLIFICATION OF THE ACTUAL CONDITIONSENCOUNTERED.
SHEET NO.
GD
C_L
OG
_BO
RIN
G_M
MX
_SO
IL L
AS
HP
.GP
J G
DC
LOG
.GD
T 3
/25/
11
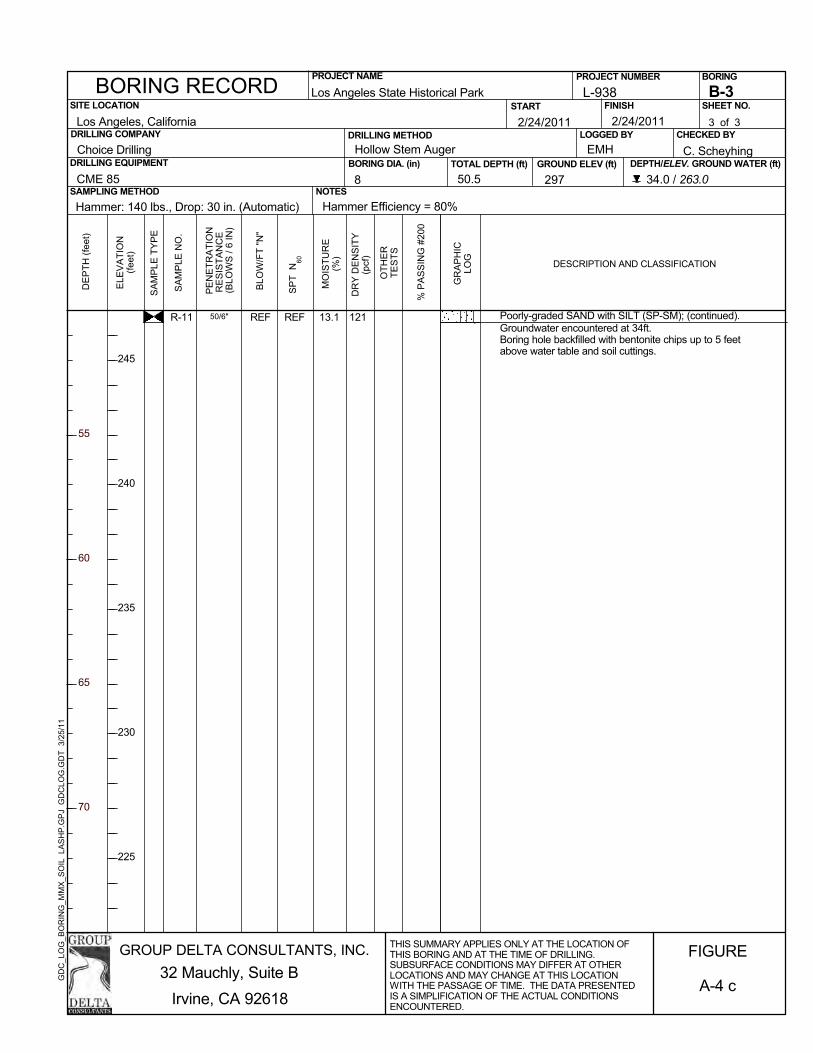
50/6"R-11 Poorly-graded SAND with SILT (SP-SM); (continued).Groundwater encountered at 34ft.Boring hole backfilled with bentonite chips up to 5 feetabove water table and soil cuttings.
13.1REF REF 121
GROUP DELTA CONSULTANTS, INC.
50.5 297 34.0 / 263.0
EMH
CME 85
DR
Y D
EN
SIT
Y(p
cf)
DRILLING METHOD
B-3
32 Mauchly, Suite B
START
SA
MP
LE T
YP
EBORING DIA. (in)
L-938
Hammer Efficiency = 80%
GR
AP
HIC
LOG
LOGGED BY3 of 3
PE
NE
TRA
TIO
NR
ES
ISTA
NC
E(B
LOW
S /
6 IN
)
OTH
ER
TES
TS
55
60
65
70
DESCRIPTION AND CLASSIFICATION
PROJECT NAME
C. Scheyhing
Los Angeles State Historical Park
CHECKED BY
Hammer: 140 lbs., Drop: 30 in. (Automatic)SAMPLING METHOD
DEPTH/ELEV. GROUND WATER (ft)
DRILLING COMPANY2/24/2011
ELE
VA
TIO
N(fe
et)
SITE LOCATION
60
PROJECT NUMBER
Los Angeles, California
% P
AS
SIN
G #
200
BORING RECORD
8TOTAL DEPTH (ft)
BORING
Choice Drilling Hollow Stem Auger
FINISH
245
240
235
230
225
BLO
W/F
T "N
"
SA
MP
LE N
O.
2/24/2011
FIGURE
A-4 cIrvine, CA 92618
DE
PTH
(fee
t)
GROUND ELEV (ft)DRILLING EQUIPMENT
NOTES
MO
ISTU
RE
(%)
SP
T N
THIS SUMMARY APPLIES ONLY AT THE LOCATION OFTHIS BORING AND AT THE TIME OF DRILLING.SUBSURFACE CONDITIONS MAY DIFFER AT OTHERLOCATIONS AND MAY CHANGE AT THIS LOCATIONWITH THE PASSAGE OF TIME. THE DATA PRESENTEDIS A SIMPLIFICATION OF THE ACTUAL CONDITIONSENCOUNTERED.
SHEET NO.
GD
C_L
OG
_BO
RIN
G_M
MX
_SO
IL L
AS
HP
.GP
J G
DC
LOG
.GD
T 3
/25/
11
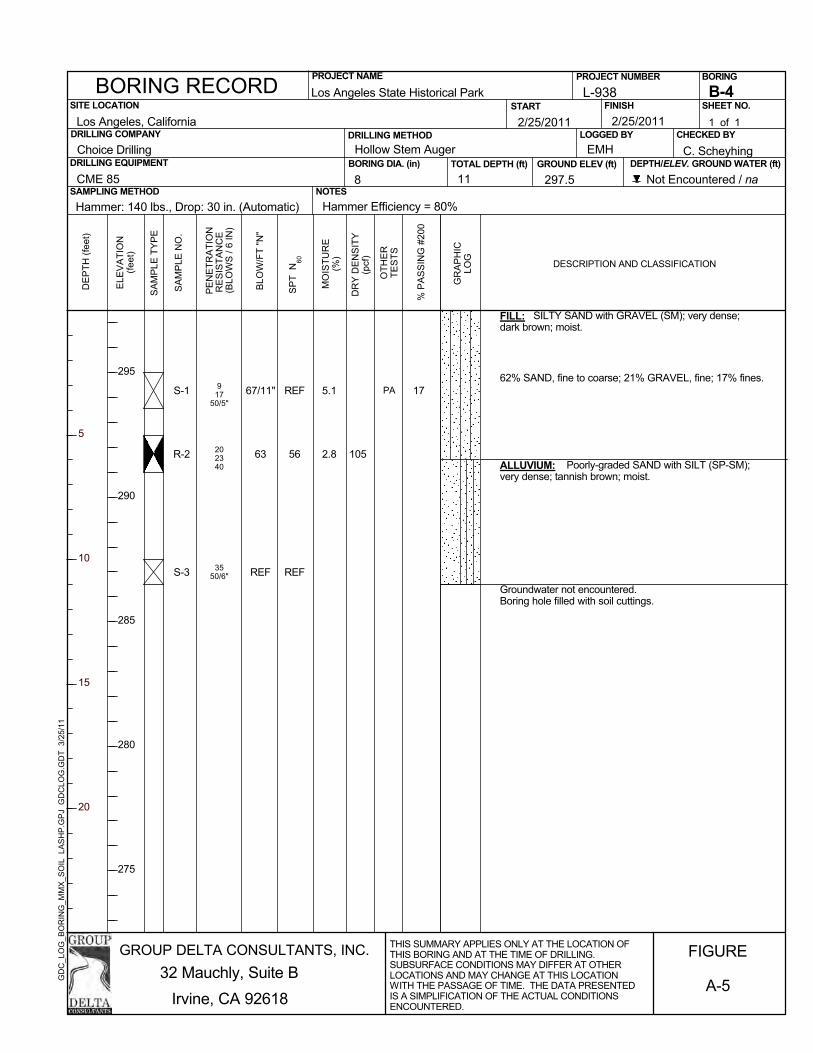
917
50/5"
202340
3550/6"
S-1
R-2
S-3
FILL: SILTY SAND with GRAVEL (SM); very dense;dark brown; moist.
62% SAND, fine to coarse; 21% GRAVEL, fine; 17% fines.
ALLUVIUM: Poorly-graded SAND with SILT (SP-SM);very dense; tannish brown; moist.
Groundwater not encountered.Boring hole filled with soil cuttings.
17PA5.1
2.8
67/11"
63
REF
REF
56
REF
105
GROUP DELTA CONSULTANTS, INC.
11 297.5 Not Encountered / na
EMH
CME 85
DR
Y D
EN
SIT
Y(p
cf)
DRILLING METHOD
B-4
32 Mauchly, Suite B
START
SA
MP
LE T
YP
EBORING DIA. (in)
L-938
Hammer Efficiency = 80%
GR
AP
HIC
LOG
LOGGED BY1 of 1
PE
NE
TRA
TIO
NR
ES
ISTA
NC
E(B
LOW
S /
6 IN
)
OTH
ER
TES
TS
5
10
15
20
DESCRIPTION AND CLASSIFICATION
PROJECT NAME
C. Scheyhing
Los Angeles State Historical Park
CHECKED BY
Hammer: 140 lbs., Drop: 30 in. (Automatic)SAMPLING METHOD
DEPTH/ELEV. GROUND WATER (ft)
DRILLING COMPANY2/25/2011
ELE
VA
TIO
N(fe
et)
SITE LOCATION
60
PROJECT NUMBER
Los Angeles, California
% P
AS
SIN
G #
200
BORING RECORD
8TOTAL DEPTH (ft)
BORING
Choice Drilling Hollow Stem Auger
FINISH
295
290
285
280
275
BLO
W/F
T "N
"
SA
MP
LE N
O.
2/25/2011
FIGURE
A-5Irvine, CA 92618
DE
PTH
(fee
t)
GROUND ELEV (ft)DRILLING EQUIPMENT
NOTES
MO
ISTU
RE
(%)
SP
T N
THIS SUMMARY APPLIES ONLY AT THE LOCATION OFTHIS BORING AND AT THE TIME OF DRILLING.SUBSURFACE CONDITIONS MAY DIFFER AT OTHERLOCATIONS AND MAY CHANGE AT THIS LOCATIONWITH THE PASSAGE OF TIME. THE DATA PRESENTEDIS A SIMPLIFICATION OF THE ACTUAL CONDITIONSENCOUNTERED.
SHEET NO.
GD
C_L
OG
_BO
RIN
G_M
MX
_SO
IL L
AS
HP
.GP
J G
DC
LOG
.GD
T 3
/25/
11
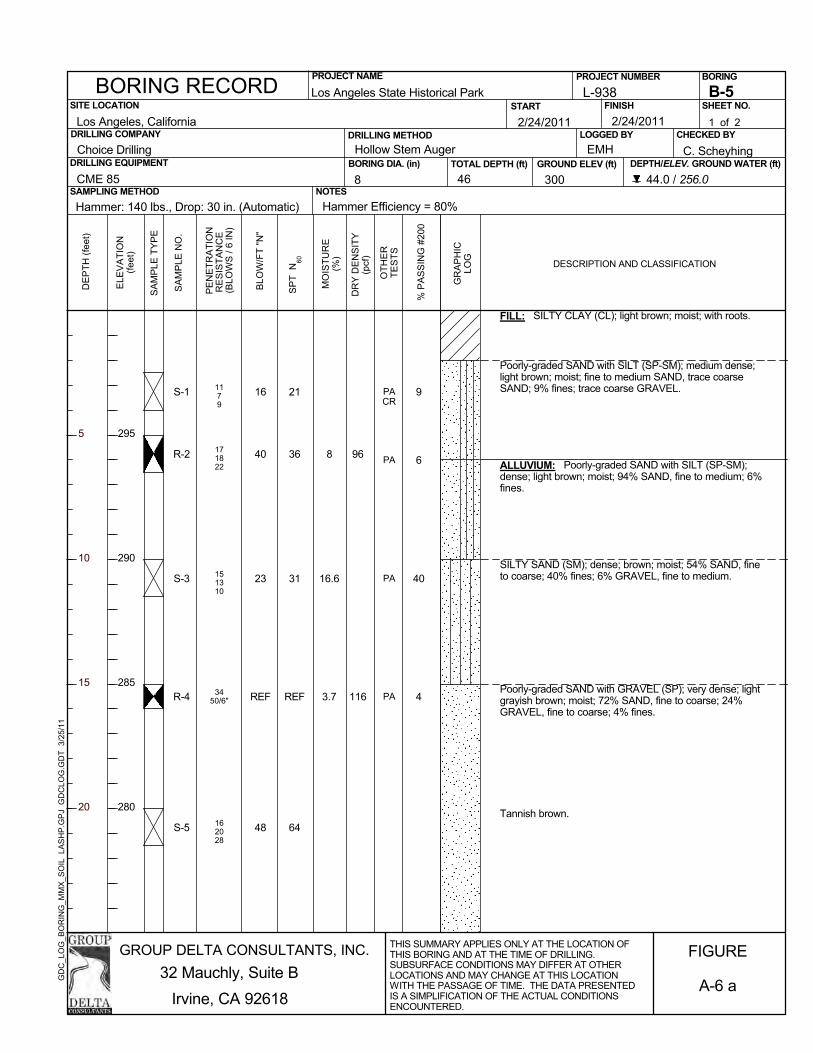
1179
171822
151310
3450/6"
162028
S-1
R-2
S-3
R-4
S-5
FILL: SILTY CLAY (CL); light brown; moist; with roots.
Poorly-graded SAND with SILT (SP-SM); medium dense;light brown; moist; fine to medium SAND, trace coarseSAND; 9% fines; trace coarse GRAVEL.
ALLUVIUM: Poorly-graded SAND with SILT (SP-SM);dense; light brown; moist; 94% SAND, fine to medium; 6%fines.
SILTY SAND (SM); dense; brown; moist; 54% SAND, fineto coarse; 40% fines; 6% GRAVEL, fine to medium.
Poorly-graded SAND with GRAVEL (SP); very dense; lightgrayish brown; moist; 72% SAND, fine to coarse; 24%GRAVEL, fine to coarse; 4% fines.
Tannish brown.
9
6
40
4
PACR
PA
PA
PA
8
16.6
3.7
16
40
23
REF
48
21
36
31
REF
64
96
116
GROUP DELTA CONSULTANTS, INC.
46 300 44.0 / 256.0
EMH
CME 85
DR
Y D
EN
SIT
Y(p
cf)
DRILLING METHOD
B-5
32 Mauchly, Suite B
START
SA
MP
LE T
YP
EBORING DIA. (in)
L-938
Hammer Efficiency = 80%
GR
AP
HIC
LOG
LOGGED BY1 of 2
PE
NE
TRA
TIO
NR
ES
ISTA
NC
E(B
LOW
S /
6 IN
)
OTH
ER
TES
TS
5
10
15
20
DESCRIPTION AND CLASSIFICATION
PROJECT NAME
C. Scheyhing
Los Angeles State Historical Park
CHECKED BY
Hammer: 140 lbs., Drop: 30 in. (Automatic)SAMPLING METHOD
DEPTH/ELEV. GROUND WATER (ft)
DRILLING COMPANY2/24/2011
ELE
VA
TIO
N(fe
et)
SITE LOCATION
60
PROJECT NUMBER
Los Angeles, California
% P
AS
SIN
G #
200
BORING RECORD
8TOTAL DEPTH (ft)
BORING
Choice Drilling Hollow Stem Auger
FINISH
295
290
285
280
BLO
W/F
T "N
"
SA
MP
LE N
O.
2/24/2011
FIGURE
A-6 aIrvine, CA 92618
DE
PTH
(fee
t)
GROUND ELEV (ft)DRILLING EQUIPMENT
NOTES
MO
ISTU
RE
(%)
SP
T N
THIS SUMMARY APPLIES ONLY AT THE LOCATION OFTHIS BORING AND AT THE TIME OF DRILLING.SUBSURFACE CONDITIONS MAY DIFFER AT OTHERLOCATIONS AND MAY CHANGE AT THIS LOCATIONWITH THE PASSAGE OF TIME. THE DATA PRESENTEDIS A SIMPLIFICATION OF THE ACTUAL CONDITIONSENCOUNTERED.
SHEET NO.
GD
C_L
OG
_BO
RIN
G_M
MX
_SO
IL L
AS
HP
.GP
J G
DC
LOG
.GD
T 3
/25/
11
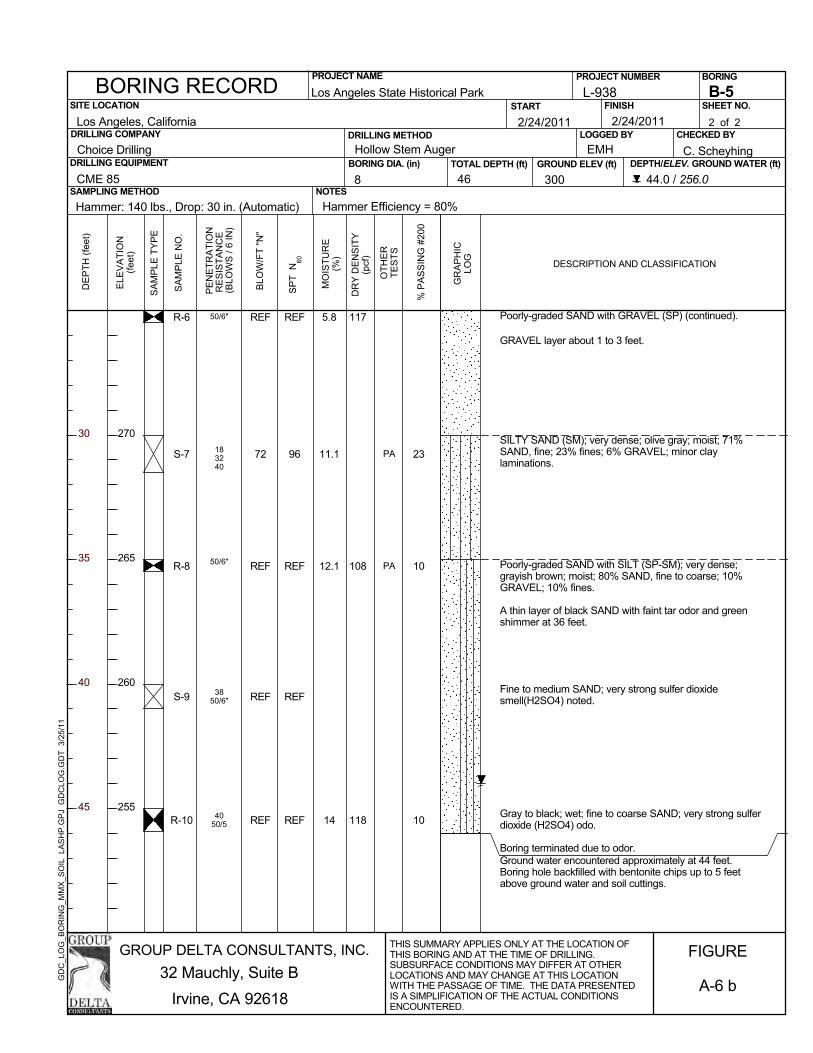
50/6"
183240
50/6"
3850/6"
4050/5
R-6
S-7
R-8
S-9
R-10
Poorly-graded SAND with GRAVEL (SP) (continued).
GRAVEL layer about 1 to 3 feet.
SILTY SAND (SM); very dense; olive gray; moist; 71%SAND, fine; 23% fines; 6% GRAVEL; minor claylaminations.
Poorly-graded SAND with SILT (SP-SM); very dense;grayish brown; moist; 80% SAND, fine to coarse; 10%GRAVEL; 10% fines.
A thin layer of black SAND with faint tar odor and greenshimmer at 36 feet.
Fine to medium SAND; very strong sulfer dioxidesmell(H2SO4) noted.
Gray to black; wet; fine to coarse SAND; very strong sulferdioxide (H2SO4) odo.
Boring terminated due to odor.Ground water encountered approximately at 44 feet.Boring hole backfilled with bentonite chips up to 5 feetabove ground water and soil cuttings.
23
10
10
PA
PA
5.8
11.1
12.1
14
REF
72
REF
REF
REF
REF
96
REF
REF
REF
117
108
118
GROUP DELTA CONSULTANTS, INC.
46 300 44.0 / 256.0
EMH
CME 85
DR
Y D
EN
SIT
Y(p
cf)
DRILLING METHOD
B-5
32 Mauchly, Suite B
START
SA
MP
LE T
YP
EBORING DIA. (in)
L-938
Hammer Efficiency = 80%
GR
AP
HIC
LOG
LOGGED BY2 of 2
PE
NE
TRA
TIO
NR
ES
ISTA
NC
E(B
LOW
S /
6 IN
)
OTH
ER
TES
TS
30
35
40
45
DESCRIPTION AND CLASSIFICATION
PROJECT NAME
C. Scheyhing
Los Angeles State Historical Park
CHECKED BY
Hammer: 140 lbs., Drop: 30 in. (Automatic)SAMPLING METHOD
DEPTH/ELEV. GROUND WATER (ft)
DRILLING COMPANY2/24/2011
ELE
VA
TIO
N(fe
et)
SITE LOCATION
60
PROJECT NUMBER
Los Angeles, California
% P
AS
SIN
G #
200
BORING RECORD
8TOTAL DEPTH (ft)
BORING
Choice Drilling Hollow Stem Auger
FINISH
270
265
260
255
BLO
W/F
T "N
"
SA
MP
LE N
O.
2/24/2011
FIGURE
A-6 bIrvine, CA 92618
DE
PTH
(fee
t)
GROUND ELEV (ft)DRILLING EQUIPMENT
NOTES
MO
ISTU
RE
(%)
SP
T N
THIS SUMMARY APPLIES ONLY AT THE LOCATION OFTHIS BORING AND AT THE TIME OF DRILLING.SUBSURFACE CONDITIONS MAY DIFFER AT OTHERLOCATIONS AND MAY CHANGE AT THIS LOCATIONWITH THE PASSAGE OF TIME. THE DATA PRESENTEDIS A SIMPLIFICATION OF THE ACTUAL CONDITIONSENCOUNTERED.
SHEET NO.
GD
C_L
OG
_BO
RIN
G_M
MX
_SO
IL L
AS
HP
.GP
J G
DC
LOG
.GD
T 3
/25/
11

192025
67
10
50/6"
R-1
S-2
R-3
FILL: SILTY SAND (SM) with GRAVEL and COBBLES;brown; moist; fine to coarse SAND; fine to coarse GRAVEL.
Poorly-graded SAND with GRAVEL (SP); dense; lightbrown; moist; 68% SAND, medium to coarse; 29%GRAVEL, fine; 3% fines.
SILTY SAND (SM); medium dense; brown; moist; 78%SAND, fine; 15% fines; 7% GRAVEL.ALLUVIUM: Poorly-graded SAND with SILT (SP-SM);medium dense; mostly fine SAND.
Very dense; subangular GRAVEL.Groundwater not encountered.Boring hole backfilled with soil cuttings.
3
15PA
5.1
8.3
5.2
45
17
REF
40
23
REF
119
115
GROUP DELTA CONSULTANTS, INC.
10.5 298.5 Not Encountered / na
EMH
CME 85
DR
Y D
EN
SIT
Y(p
cf)
DRILLING METHOD
B-6
32 Mauchly, Suite B
START
SA
MP
LE T
YP
EBORING DIA. (in)
L-938
Hammer Efficiency = 80%
GR
AP
HIC
LOG
LOGGED BY1 of 1
PE
NE
TRA
TIO
NR
ES
ISTA
NC
E(B
LOW
S /
6 IN
)
OTH
ER
TES
TS
5
10
15
20
DESCRIPTION AND CLASSIFICATION
PROJECT NAME
C. Scheyhing
Los Angeles State Historical Park
CHECKED BY
Hammer: 140 lbs., Drop: 30 in. (Automatic)SAMPLING METHOD
DEPTH/ELEV. GROUND WATER (ft)
DRILLING COMPANY2/25/2011
ELE
VA
TIO
N(fe
et)
SITE LOCATION
60
PROJECT NUMBER
Los Angeles, California
% P
AS
SIN
G #
200
BORING RECORD
8TOTAL DEPTH (ft)
BORING
Choice Drilling Hollow Stem Auger
FINISH
295
290
285
280
275
BLO
W/F
T "N
"
SA
MP
LE N
O.
2/25/2011
FIGURE
A-7Irvine, CA 92618
DE
PTH
(fee
t)
GROUND ELEV (ft)DRILLING EQUIPMENT
NOTES
MO
ISTU
RE
(%)
SP
T N
THIS SUMMARY APPLIES ONLY AT THE LOCATION OFTHIS BORING AND AT THE TIME OF DRILLING.SUBSURFACE CONDITIONS MAY DIFFER AT OTHERLOCATIONS AND MAY CHANGE AT THIS LOCATIONWITH THE PASSAGE OF TIME. THE DATA PRESENTEDIS A SIMPLIFICATION OF THE ACTUAL CONDITIONSENCOUNTERED.
SHEET NO.
GD
C_L
OG
_BO
RIN
G_M
MX
_SO
IL L
AS
HP
.GP
J G
DC
LOG
.GD
T 3
/25/
11
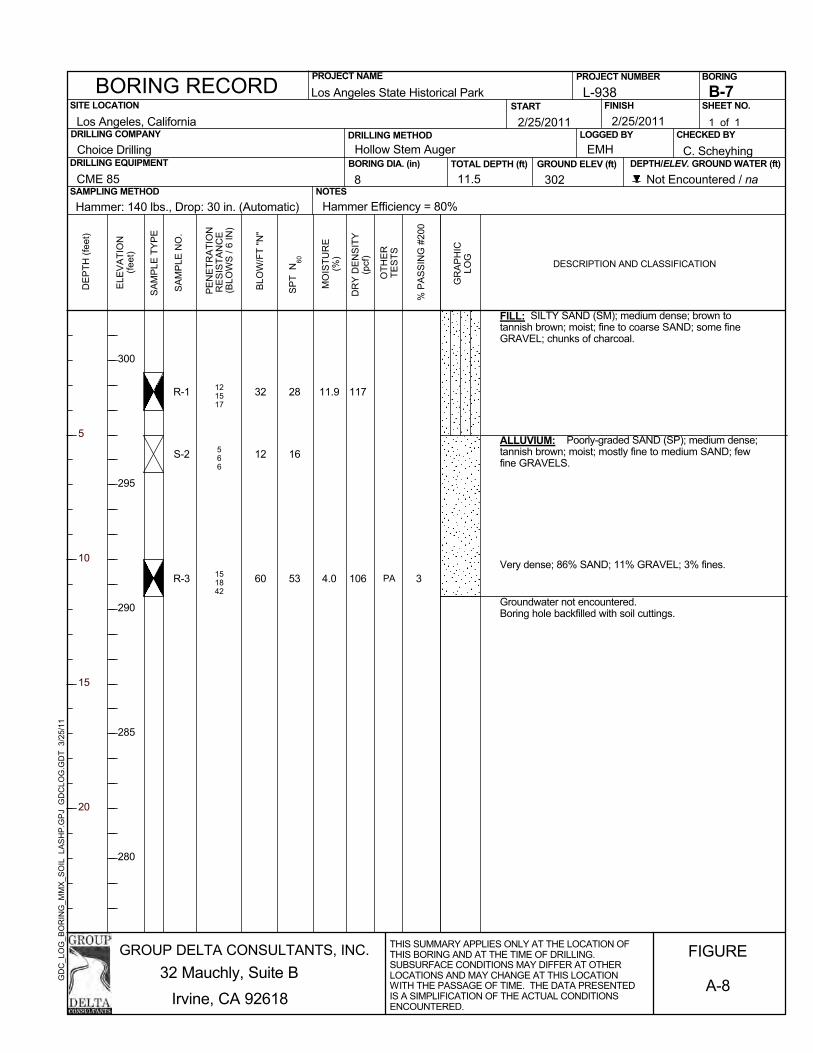
121517
566
151842
R-1
S-2
R-3
FILL: SILTY SAND (SM); medium dense; brown totannish brown; moist; fine to coarse SAND; some fineGRAVEL; chunks of charcoal.
ALLUVIUM: Poorly-graded SAND (SP); medium dense;tannish brown; moist; mostly fine to medium SAND; fewfine GRAVELS.
Very dense; 86% SAND; 11% GRAVEL; 3% fines.
Groundwater not encountered.Boring hole backfilled with soil cuttings.
3PA
11.9
4.0
32
12
60
28
16
53
117
106
GROUP DELTA CONSULTANTS, INC.
11.5 302 Not Encountered / na
EMH
CME 85
DR
Y D
EN
SIT
Y(p
cf)
DRILLING METHOD
B-7
32 Mauchly, Suite B
START
SA
MP
LE T
YP
EBORING DIA. (in)
L-938
Hammer Efficiency = 80%
GR
AP
HIC
LOG
LOGGED BY1 of 1
PE
NE
TRA
TIO
NR
ES
ISTA
NC
E(B
LOW
S /
6 IN
)
OTH
ER
TES
TS
5
10
15
20
DESCRIPTION AND CLASSIFICATION
PROJECT NAME
C. Scheyhing
Los Angeles State Historical Park
CHECKED BY
Hammer: 140 lbs., Drop: 30 in. (Automatic)SAMPLING METHOD
DEPTH/ELEV. GROUND WATER (ft)
DRILLING COMPANY2/25/2011
ELE
VA
TIO
N(fe
et)
SITE LOCATION
60
PROJECT NUMBER
Los Angeles, California
% P
AS
SIN
G #
200
BORING RECORD
8TOTAL DEPTH (ft)
BORING
Choice Drilling Hollow Stem Auger
FINISH
300
295
290
285
280
BLO
W/F
T "N
"
SA
MP
LE N
O.
2/25/2011
FIGURE
A-8Irvine, CA 92618
DE
PTH
(fee
t)
GROUND ELEV (ft)DRILLING EQUIPMENT
NOTES
MO
ISTU
RE
(%)
SP
T N
THIS SUMMARY APPLIES ONLY AT THE LOCATION OFTHIS BORING AND AT THE TIME OF DRILLING.SUBSURFACE CONDITIONS MAY DIFFER AT OTHERLOCATIONS AND MAY CHANGE AT THIS LOCATIONWITH THE PASSAGE OF TIME. THE DATA PRESENTEDIS A SIMPLIFICATION OF THE ACTUAL CONDITIONSENCOUNTERED.
SHEET NO.
GD
C_L
OG
_BO
RIN
G_M
MX
_SO
IL L
AS
HP
.GP
J G
DC
LOG
.GD
T 3
/25/
11
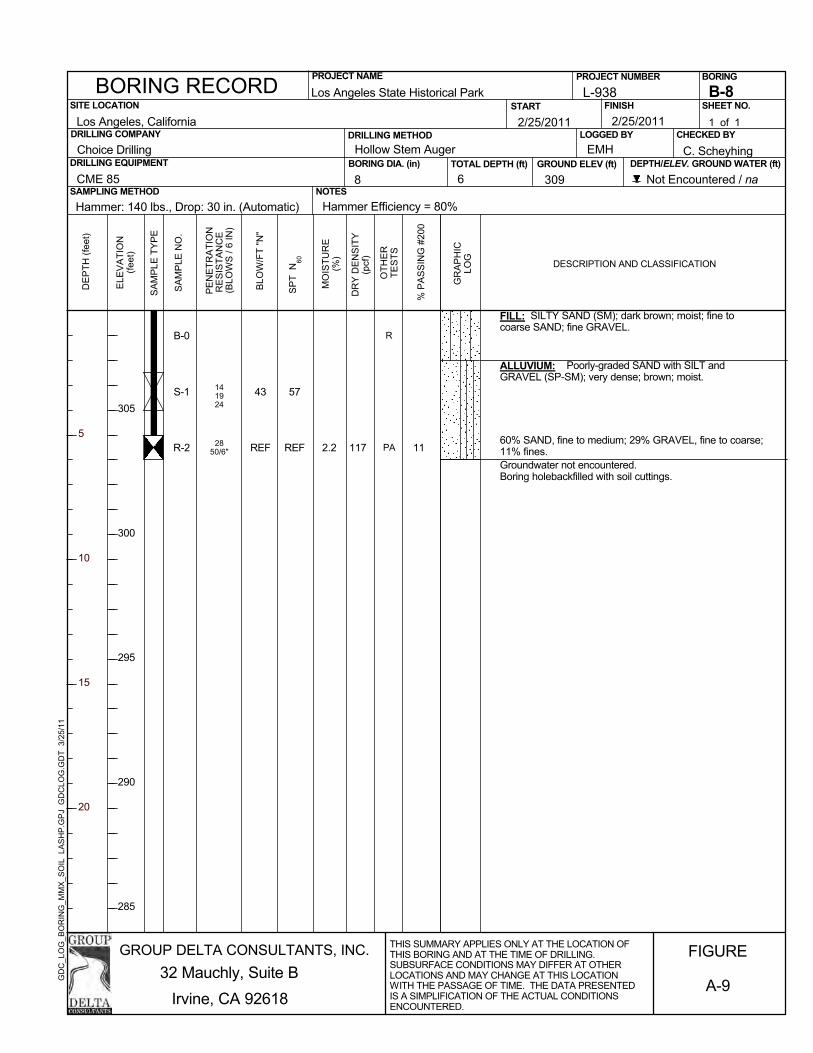
141924
2850/6"
B-0
S-1
R-2
FILL: SILTY SAND (SM); dark brown; moist; fine tocoarse SAND; fine GRAVEL.
ALLUVIUM: Poorly-graded SAND with SILT andGRAVEL (SP-SM); very dense; brown; moist.
60% SAND, fine to medium; 29% GRAVEL, fine to coarse;11% fines.Groundwater not encountered.Boring holebackfilled with soil cuttings.
11
R
PA2.2
43
REF
57
REF 117
GROUP DELTA CONSULTANTS, INC.
6 309 Not Encountered / na
EMH
CME 85
DR
Y D
EN
SIT
Y(p
cf)
DRILLING METHOD
B-8
32 Mauchly, Suite B
START
SA
MP
LE T
YP
EBORING DIA. (in)
L-938
Hammer Efficiency = 80%
GR
AP
HIC
LOG
LOGGED BY1 of 1
PE
NE
TRA
TIO
NR
ES
ISTA
NC
E(B
LOW
S /
6 IN
)
OTH
ER
TES
TS
5
10
15
20
DESCRIPTION AND CLASSIFICATION
PROJECT NAME
C. Scheyhing
Los Angeles State Historical Park
CHECKED BY
Hammer: 140 lbs., Drop: 30 in. (Automatic)SAMPLING METHOD
DEPTH/ELEV. GROUND WATER (ft)
DRILLING COMPANY2/25/2011
ELE
VA
TIO
N(fe
et)
SITE LOCATION
60
PROJECT NUMBER
Los Angeles, California
% P
AS
SIN
G #
200
BORING RECORD
8TOTAL DEPTH (ft)
BORING
Choice Drilling Hollow Stem Auger
FINISH
305
300
295
290
285
BLO
W/F
T "N
"
SA
MP
LE N
O.
2/25/2011
FIGURE
A-9Irvine, CA 92618
DE
PTH
(fee
t)
GROUND ELEV (ft)DRILLING EQUIPMENT
NOTES
MO
ISTU
RE
(%)
SP
T N
THIS SUMMARY APPLIES ONLY AT THE LOCATION OFTHIS BORING AND AT THE TIME OF DRILLING.SUBSURFACE CONDITIONS MAY DIFFER AT OTHERLOCATIONS AND MAY CHANGE AT THIS LOCATIONWITH THE PASSAGE OF TIME. THE DATA PRESENTEDIS A SIMPLIFICATION OF THE ACTUAL CONDITIONSENCOUNTERED.
SHEET NO.
GD
C_L
OG
_BO
RIN
G_M
MX
_SO
IL L
AS
HP
.GP
J G
DC
LOG
.GD
T 3
/25/
11

1220
50/6"
14109
R-1
S-2
FILL: SILTY SAND (SM); dark brown; moist; fine tocoarse SAND; some fine GRAVEL.
Very dense.
ALLUVIUM: SILTY to CLAYEY SAND with GRAVEL(SM/SC); medium dense; dark brown; slightly moist; 63%SAND, fine; 20% fines; 17% GRAVEL.Groundwater not encountered.Boring hole backfilled with soil cuttings.
20PA
6.3
13.9
70
19
62
25
112
GROUP DELTA CONSULTANTS, INC.
6.5 304 Not Encountered / na
EMH
CME 85
DR
Y D
EN
SIT
Y(p
cf)
DRILLING METHOD
B-9
32 Mauchly, Suite B
START
SA
MP
LE T
YP
EBORING DIA. (in)
L-938
Hammer Efficiency = 80%
GR
AP
HIC
LOG
LOGGED BY1 of 1
PE
NE
TRA
TIO
NR
ES
ISTA
NC
E(B
LOW
S /
6 IN
)
OTH
ER
TES
TS
5
10
15
20
DESCRIPTION AND CLASSIFICATION
PROJECT NAME
C. Scheyhing
Los Angeles State Historical Park
CHECKED BY
Hammer: 140 lbs., Drop: 30 in. (Automatic)SAMPLING METHOD
DEPTH/ELEV. GROUND WATER (ft)
DRILLING COMPANY2/25/2011
ELE
VA
TIO
N(fe
et)
SITE LOCATION
60
PROJECT NUMBER
Los Angeles, California
% P
AS
SIN
G #
200
BORING RECORD
8TOTAL DEPTH (ft)
BORING
Choice Drilling Hollow Stem Auger
FINISH
300
295
290
285
280
BLO
W/F
T "N
"
SA
MP
LE N
O.
2/25/2011
FIGURE
A-10Irvine, CA 92618
DE
PTH
(fee
t)
GROUND ELEV (ft)DRILLING EQUIPMENT
NOTES
MO
ISTU
RE
(%)
SP
T N
THIS SUMMARY APPLIES ONLY AT THE LOCATION OFTHIS BORING AND AT THE TIME OF DRILLING.SUBSURFACE CONDITIONS MAY DIFFER AT OTHERLOCATIONS AND MAY CHANGE AT THIS LOCATIONWITH THE PASSAGE OF TIME. THE DATA PRESENTEDIS A SIMPLIFICATION OF THE ACTUAL CONDITIONSENCOUNTERED.
SHEET NO.
GD
C_L
OG
_BO
RIN
G_M
MX
_SO
IL L
AS
HP
.GP
J G
DC
LOG
.GD
T 3
/25/
11
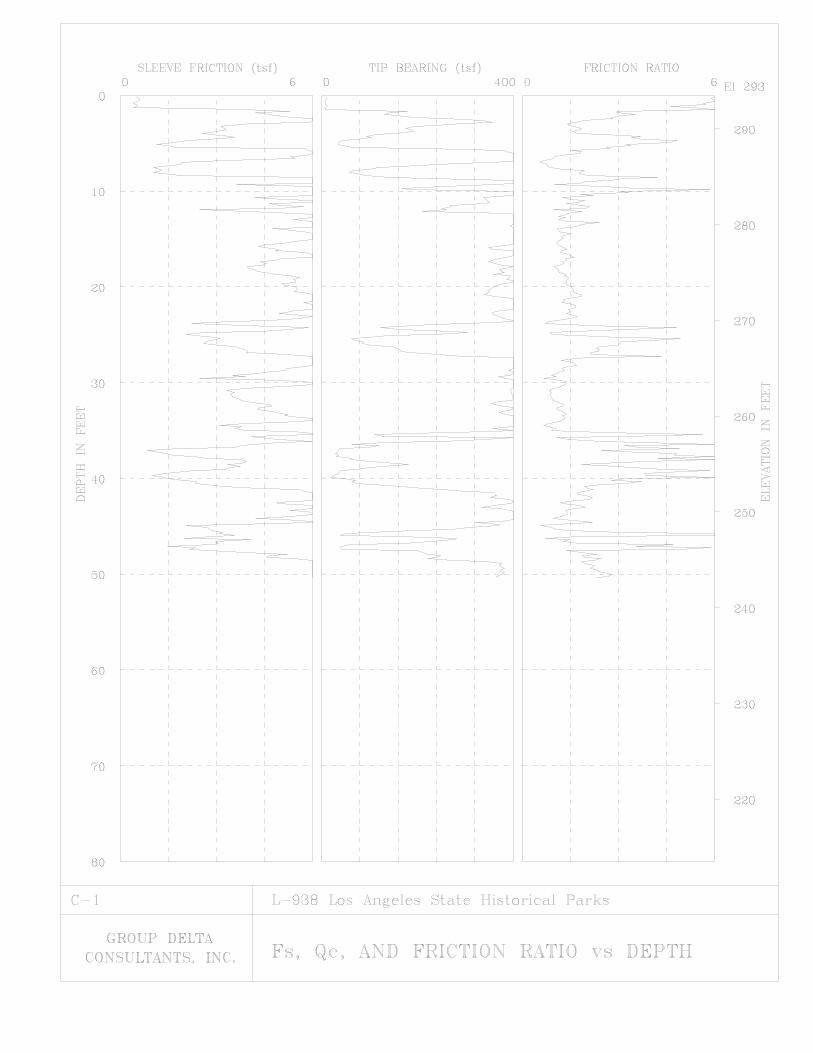
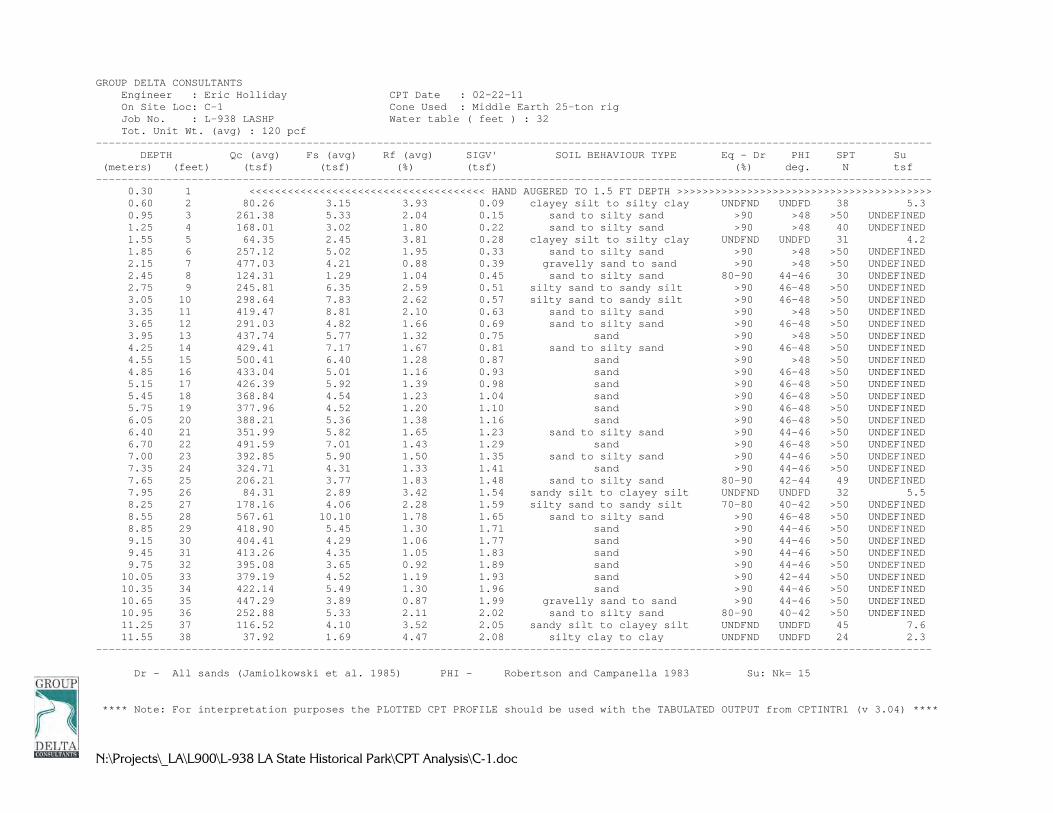
N:\Projects\_LA\L900\L-938 LA State Historical Park\CPT Analysis\C-1.doc
GROUP DELTA CONSULTANTS Engineer : Eric Holliday CPT Date : 02-22-11 On Site Loc: C-1 Cone Used : Middle Earth 25-ton rig Job No. : L-938 LASHP Water table ( feet ) : 32 Tot. Unit Wt. (avg) : 120 pcf ----------------------------------------------------------------------------------------------------------------------------------- DEPTH Qc (avg) Fs (avg) Rf (avg) SIGV' SOIL BEHAVIOUR TYPE Eq - Dr PHI SPT Su (meters) (feet) (tsf) (tsf) (%) (tsf) (%) deg. N tsf ----------------------------------------------------------------------------------------------------------------------------------- 0.30 1 <<<<<<<<<<<<<<<<<<<<<<<<<<<<<<<<<<<<< HAND AUGERED TO 1.5 FT DEPTH >>>>>>>>>>>>>>>>>>>>>>>>>>>>>>>>>>>>>>>> 0.60 2 80.26 3.15 3.93 0.09 clayey silt to silty clay UNDFND UNDFD 38 5.3 0.95 3 261.38 5.33 2.04 0.15 sand to silty sand >90 >48 >50 UNDEFINED 1.25 4 168.01 3.02 1.80 0.22 sand to silty sand >90 >48 40 UNDEFINED 1.55 5 64.35 2.45 3.81 0.28 clayey silt to silty clay UNDFND UNDFD 31 4.2 1.85 6 257.12 5.02 1.95 0.33 sand to silty sand >90 >48 >50 UNDEFINED 2.15 7 477.03 4.21 0.88 0.39 gravelly sand to sand >90 >48 >50 UNDEFINED 2.45 8 124.31 1.29 1.04 0.45 sand to silty sand 80-90 44-46 30 UNDEFINED 2.75 9 245.81 6.35 2.59 0.51 silty sand to sandy silt >90 46-48 >50 UNDEFINED 3.05 10 298.64 7.83 2.62 0.57 silty sand to sandy silt >90 46-48 >50 UNDEFINED 3.35 11 419.47 8.81 2.10 0.63 sand to silty sand >90 >48 >50 UNDEFINED 3.65 12 291.03 4.82 1.66 0.69 sand to silty sand >90 46-48 >50 UNDEFINED 3.95 13 437.74 5.77 1.32 0.75 sand >90 >48 >50 UNDEFINED 4.25 14 429.41 7.17 1.67 0.81 sand to silty sand >90 46-48 >50 UNDEFINED 4.55 15 500.41 6.40 1.28 0.87 sand >90 >48 >50 UNDEFINED 4.85 16 433.04 5.01 1.16 0.93 sand >90 46-48 >50 UNDEFINED 5.15 17 426.39 5.92 1.39 0.98 sand >90 46-48 >50 UNDEFINED 5.45 18 368.84 4.54 1.23 1.04 sand >90 46-48 >50 UNDEFINED 5.75 19 377.96 4.52 1.20 1.10 sand >90 46-48 >50 UNDEFINED 6.05 20 388.21 5.36 1.38 1.16 sand >90 46-48 >50 UNDEFINED 6.40 21 351.99 5.82 1.65 1.23 sand to silty sand >90 44-46 >50 UNDEFINED 6.70 22 491.59 7.01 1.43 1.29 sand >90 46-48 >50 UNDEFINED 7.00 23 392.85 5.90 1.50 1.35 sand to silty sand >90 44-46 >50 UNDEFINED 7.35 24 324.71 4.31 1.33 1.41 sand >90 44-46 >50 UNDEFINED 7.65 25 206.21 3.77 1.83 1.48 sand to silty sand 80-90 42-44 49 UNDEFINED 7.95 26 84.31 2.89 3.42 1.54 sandy silt to clayey silt UNDFND UNDFD 32 5.5 8.25 27 178.16 4.06 2.28 1.59 silty sand to sandy silt 70-80 40-42 >50 UNDEFINED 8.55 28 567.61 10.10 1.78 1.65 sand to silty sand >90 46-48 >50 UNDEFINED 8.85 29 418.90 5.45 1.30 1.71 sand >90 44-46 >50 UNDEFINED 9.15 30 404.41 4.29 1.06 1.77 sand >90 44-46 >50 UNDEFINED 9.45 31 413.26 4.35 1.05 1.83 sand >90 44-46 >50 UNDEFINED 9.75 32 395.08 3.65 0.92 1.89 sand >90 44-46 >50 UNDEFINED 10.05 33 379.19 4.52 1.19 1.93 sand >90 42-44 >50 UNDEFINED 10.35 34 422.14 5.49 1.30 1.96 sand >90 44-46 >50 UNDEFINED 10.65 35 447.29 3.89 0.87 1.99 gravelly sand to sand >90 44-46 >50 UNDEFINED 10.95 36 252.88 5.33 2.11 2.02 sand to silty sand 80-90 40-42 >50 UNDEFINED 11.25 37 116.52 4.10 3.52 2.05 sandy silt to clayey silt UNDFND UNDFD 45 7.6 11.55 38 37.92 1.69 4.47 2.08 silty clay to clay UNDFND UNDFD 24 2.3 ----------------------------------------------------------------------------------------------------------------------------------- Dr - All sands (Jamiolkowski et al. 1985) PHI - Robertson and Campanella 1983 Su: Nk= 15 **** Note: For interpretation purposes the PLOTTED CPT PROFILE should be used with the TABULATED OUTPUT from CPTINTR1 (v 3.04) ****

N:\Projects\_LA\L900\L-938 LA State Historical Park\CPT Analysis\C-1.doc
GROUP DELTA CONSULTANTS Engineer : Eric Holliday On Site Loc: C-1 Page No. 2 ----------------------------------------------------------------------------------------------------------------------------------- DEPTH Qc (avg) Fs (avg) Rf (avg) SIGV' SOIL BEHAVIOUR TYPE Eq - Dr PHI SPT Su (meters) (feet) (tsf) (tsf) (%) (tsf) (%) deg. N tsf ----------------------------------------------------------------------------------------------------------------------------------- 11.85 39 121.99 3.68 3.01 2.10 sandy silt to clayey silt UNDFND UNDFD 47 7.9 12.15 40 38.80 1.84 4.75 2.13 silty clay to clay UNDFND UNDFD 25 2.4 12.45 41 87.35 2.34 2.68 2.16 sandy silt to clayey silt UNDFND UNDFD 33 5.6 12.80 42 316.50 6.16 1.95 2.19 sand to silty sand 80-90 42-44 >50 UNDEFINED 13.10 43 382.52 6.31 1.65 2.22 sand to silty sand >90 42-44 >50 UNDEFINED 13.40 44 418.90 5.78 1.38 2.25 sand >90 42-44 >50 UNDEFINED 13.75 45 370.49 4.59 1.24 2.28 sand >90 42-44 >50 UNDEFINED 14.05 46 136.07 3.07 2.26 2.31 silty sand to sandy silt 60-70 38-40 43 UNDEFINED 14.35 47 176.97 2.75 1.55 2.34 sand to silty sand 70-80 38-40 42 UNDEFINED 14.65 48 161.21 3.51 2.18 2.37 silty sand to sandy silt 60-70 38-40 >50 UNDEFINED 14.95 49 304.85 6.37 2.09 2.40 sand to silty sand 80-90 42-44 >50 UNDEFINED 15.25 50 377.14 8.99 2.38 2.42 sand to clayey sand (*) UNDFND UNDFD >50 UNDEFINED ----------------------------------------------------------------------------------------------------------------------------------- Dr - All sands (Jamiolkowski et al. 1985) PHI - Robertson and Campanella 1983 Su: Nk= 15 (*) overconsolidated or cemented **** Note: For interpretation purposes the PLOTTED CPT PROFILE should be used with the TABULATED OUTPUT from CPTINTR1 (v 3.04) ****

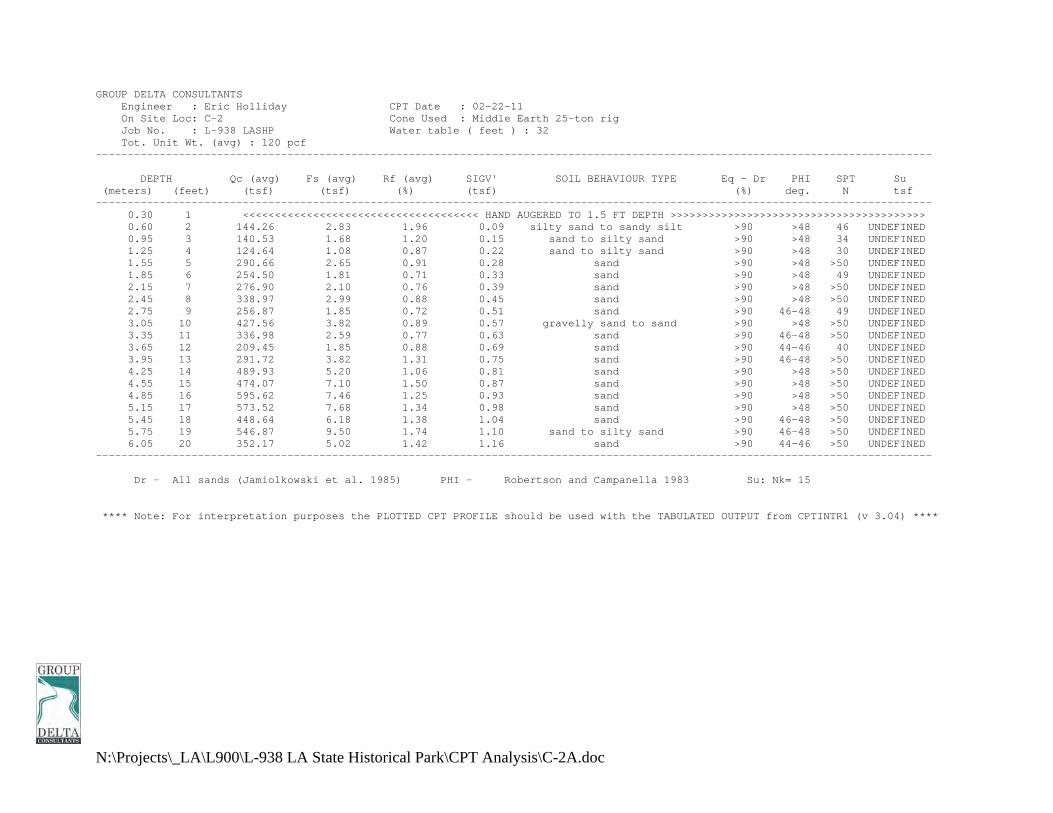
N:\Projects\_LA\L900\L-938 LA State Historical Park\CPT Analysis\C-2A.doc
GROUP DELTA CONSULTANTS Engineer : Eric Holliday CPT Date : 02-22-11 On Site Loc: C-2 Cone Used : Middle Earth 25-ton rig Job No. : L-938 LASHP Water table ( feet ) : 32 Tot. Unit Wt. (avg) : 120 pcf ----------------------------------------------------------------------------------------------------------------------------------- DEPTH Qc (avg) Fs (avg) Rf (avg) SIGV' SOIL BEHAVIOUR TYPE Eq - Dr PHI SPT Su (meters) (feet) (tsf) (tsf) (%) (tsf) (%) deg. N tsf ----------------------------------------------------------------------------------------------------------------------------------- 0.30 1 <<<<<<<<<<<<<<<<<<<<<<<<<<<<<<<<<<<<< HAND AUGERED TO 1.5 FT DEPTH >>>>>>>>>>>>>>>>>>>>>>>>>>>>>>>>>>>>>>>> 0.60 2 144.26 2.83 1.96 0.09 silty sand to sandy silt >90 >48 46 UNDEFINED 0.95 3 140.53 1.68 1.20 0.15 sand to silty sand >90 >48 34 UNDEFINED 1.25 4 124.64 1.08 0.87 0.22 sand to silty sand >90 >48 30 UNDEFINED 1.55 5 290.66 2.65 0.91 0.28 sand >90 >48 >50 UNDEFINED 1.85 6 254.50 1.81 0.71 0.33 sand >90 >48 49 UNDEFINED 2.15 7 276.90 2.10 0.76 0.39 sand >90 >48 >50 UNDEFINED 2.45 8 338.97 2.99 0.88 0.45 sand >90 >48 >50 UNDEFINED 2.75 9 256.87 1.85 0.72 0.51 sand >90 46-48 49 UNDEFINED 3.05 10 427.56 3.82 0.89 0.57 gravelly sand to sand >90 >48 >50 UNDEFINED 3.35 11 336.98 2.59 0.77 0.63 sand >90 46-48 >50 UNDEFINED 3.65 12 209.45 1.85 0.88 0.69 sand >90 44-46 40 UNDEFINED 3.95 13 291.72 3.82 1.31 0.75 sand >90 46-48 >50 UNDEFINED 4.25 14 489.93 5.20 1.06 0.81 sand >90 >48 >50 UNDEFINED 4.55 15 474.07 7.10 1.50 0.87 sand >90 >48 >50 UNDEFINED 4.85 16 595.62 7.46 1.25 0.93 sand >90 >48 >50 UNDEFINED 5.15 17 573.52 7.68 1.34 0.98 sand >90 >48 >50 UNDEFINED 5.45 18 448.64 6.18 1.38 1.04 sand >90 46-48 >50 UNDEFINED 5.75 19 546.87 9.50 1.74 1.10 sand to silty sand >90 46-48 >50 UNDEFINED 6.05 20 352.17 5.02 1.42 1.16 sand >90 44-46 >50 UNDEFINED ----------------------------------------------------------------------------------------------------------------------------------- Dr - All sands (Jamiolkowski et al. 1985) PHI - Robertson and Campanella 1983 Su: Nk= 15 **** Note: For interpretation purposes the PLOTTED CPT PROFILE should be used with the TABULATED OUTPUT from CPTINTR1 (v 3.04) ****
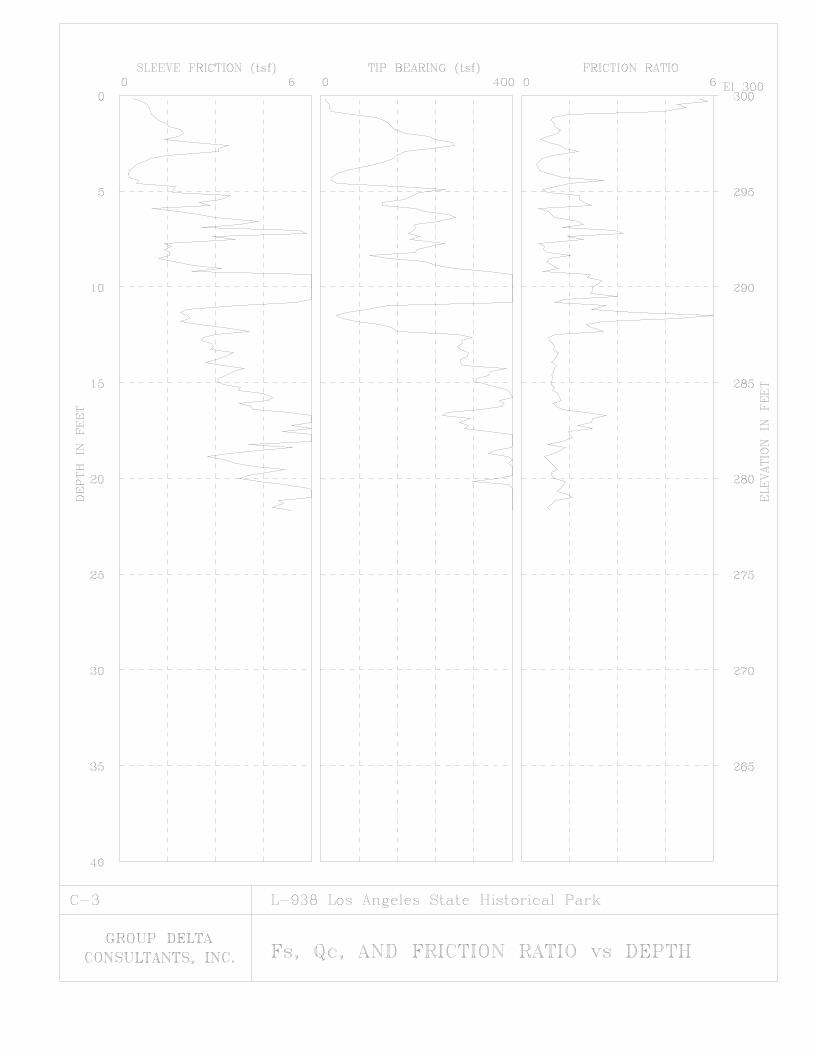
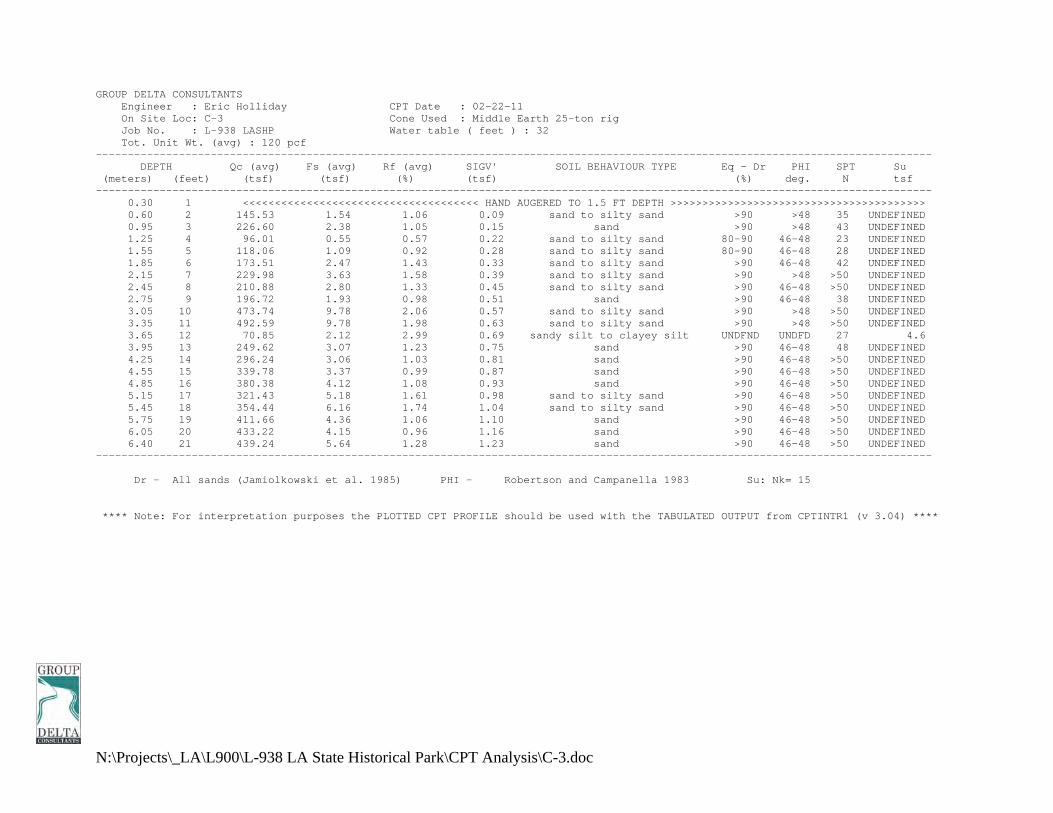
N:\Projects\_LA\L900\L-938 LA State Historical Park\CPT Analysis\C-3.doc
GROUP DELTA CONSULTANTS Engineer : Eric Holliday CPT Date : 02-22-11 On Site Loc: C-3 Cone Used : Middle Earth 25-ton rig Job No. : L-938 LASHP Water table ( feet ) : 32 Tot. Unit Wt. (avg) : 120 pcf ----------------------------------------------------------------------------------------------------------------------------------- DEPTH Qc (avg) Fs (avg) Rf (avg) SIGV' SOIL BEHAVIOUR TYPE Eq - Dr PHI SPT Su (meters) (feet) (tsf) (tsf) (%) (tsf) (%) deg. N tsf ----------------------------------------------------------------------------------------------------------------------------------- 0.30 1 <<<<<<<<<<<<<<<<<<<<<<<<<<<<<<<<<<<<< HAND AUGERED TO 1.5 FT DEPTH >>>>>>>>>>>>>>>>>>>>>>>>>>>>>>>>>>>>>>>> 0.60 2 145.53 1.54 1.06 0.09 sand to silty sand >90 >48 35 UNDEFINED 0.95 3 226.60 2.38 1.05 0.15 sand >90 >48 43 UNDEFINED 1.25 4 96.01 0.55 0.57 0.22 sand to silty sand 80-90 46-48 23 UNDEFINED 1.55 5 118.06 1.09 0.92 0.28 sand to silty sand 80-90 46-48 28 UNDEFINED 1.85 6 173.51 2.47 1.43 0.33 sand to silty sand >90 46-48 42 UNDEFINED 2.15 7 229.98 3.63 1.58 0.39 sand to silty sand >90 >48 >50 UNDEFINED 2.45 8 210.88 2.80 1.33 0.45 sand to silty sand >90 46-48 >50 UNDEFINED 2.75 9 196.72 1.93 0.98 0.51 sand >90 46-48 38 UNDEFINED 3.05 10 473.74 9.78 2.06 0.57 sand to silty sand >90 >48 >50 UNDEFINED 3.35 11 492.59 9.78 1.98 0.63 sand to silty sand >90 >48 >50 UNDEFINED 3.65 12 70.85 2.12 2.99 0.69 sandy silt to clayey silt UNDFND UNDFD 27 4.6 3.95 13 249.62 3.07 1.23 0.75 sand >90 46-48 48 UNDEFINED 4.25 14 296.24 3.06 1.03 0.81 sand >90 46-48 >50 UNDEFINED 4.55 15 339.78 3.37 0.99 0.87 sand >90 46-48 >50 UNDEFINED 4.85 16 380.38 4.12 1.08 0.93 sand >90 46-48 >50 UNDEFINED 5.15 17 321.43 5.18 1.61 0.98 sand to silty sand >90 46-48 >50 UNDEFINED 5.45 18 354.44 6.16 1.74 1.04 sand to silty sand >90 46-48 >50 UNDEFINED 5.75 19 411.66 4.36 1.06 1.10 sand >90 46-48 >50 UNDEFINED 6.05 20 433.22 4.15 0.96 1.16 sand >90 46-48 >50 UNDEFINED 6.40 21 439.24 5.64 1.28 1.23 sand >90 46-48 >50 UNDEFINED ----------------------------------------------------------------------------------------------------------------------------------- Dr - All sands (Jamiolkowski et al. 1985) PHI - Robertson and Campanella 1983 Su: Nk= 15 **** Note: For interpretation purposes the PLOTTED CPT PROFILE should be used with the TABULATED OUTPUT from CPTINTR1 (v 3.04) ****


N:\Projects\_LA\L900\L-938 LA State Historical Park\CPT Analysis\C-4.doc
GROUP DELTA CONSULTANTS Engineer : Eric Holliday CPT Date : 02-23-11 On Site Loc: C-4 Cone Used : Middle Earth 25-ton rig Job No. : L-938 LASHP Water table ( feet ) : 32 Tot. Unit Wt. (avg) : 120 pcf ----------------------------------------------------------------------------------------------------------------------------------- DEPTH Qc (avg) Fs (avg) Rf (avg) SIGV' SOIL BEHAVIOUR TYPE Eq - Dr PHI SPT Su (meters) (feet) (tsf) (tsf) (%) (tsf) (%) deg. N tsf ----------------------------------------------------------------------------------------------------------------------------------- 0.30 1 <<<<<<<<<<<<<<<<<<<<<<<<<<<<<<<<<<<<< HAND AUGERED TO 1.5 FT DEPTH >>>>>>>>>>>>>>>>>>>>>>>>>>>>>>>>>>>>>>>> 0.60 2 188.09 2.88 1.53 0.09 sand to silty sand >90 >48 45 UNDEFINED 0.95 3 284.68 3.51 1.23 0.15 sand >90 >48 >50 UNDEFINED 1.25 4 197.34 1.60 0.81 0.22 sand >90 >48 38 UNDEFINED 1.55 5 130.67 1.27 0.97 0.28 sand to silty sand >90 46-48 31 UNDEFINED 1.85 6 187.92 1.86 0.99 0.33 sand >90 >48 36 UNDEFINED 2.15 7 229.51 2.90 1.27 0.39 sand >90 >48 44 UNDEFINED 2.45 8 273.27 2.80 1.02 0.45 sand >90 >48 >50 UNDEFINED 2.75 9 281.65 4.28 1.52 0.51 sand to silty sand >90 >48 >50 UNDEFINED 3.05 10 217.44 2.89 1.33 0.57 sand to silty sand >90 46-48 >50 UNDEFINED 3.35 11 184.93 3.24 1.75 0.63 sand to silty sand >90 44-46 44 UNDEFINED 3.65 12 381.72 2.85 0.75 0.69 gravelly sand to sand >90 >48 >50 UNDEFINED 3.95 13 394.83 4.26 1.08 0.75 sand >90 46-48 >50 UNDEFINED 4.25 14 502.92 6.11 1.21 0.81 sand >90 >48 >50 UNDEFINED 4.55 15 396.38 3.66 0.92 0.87 sand >90 46-48 >50 UNDEFINED 4.85 16 347.89 2.43 0.70 0.93 sand >90 46-48 >50 UNDEFINED 5.15 17 272.34 1.40 0.52 0.98 sand >90 44-46 >50 UNDEFINED 5.45 18 144.95 4.76 3.29 1.04 sandy silt to clayey silt UNDFND UNDFD >50 9.5 5.75 19 503.13 6.64 1.32 1.10 sand >90 46-48 >50 UNDEFINED 6.05 20 422.97 4.49 1.06 1.16 sand >90 46-48 >50 UNDEFINED 6.40 21 408.95 3.81 0.93 1.23 sand >90 46-48 >50 UNDEFINED 6.70 22 397.57 4.32 1.09 1.29 sand >90 44-46 >50 UNDEFINED 7.00 23 364.61 4.43 1.21 1.35 sand >90 44-46 >50 UNDEFINED 7.35 24 351.02 4.71 1.34 1.41 sand >90 44-46 >50 UNDEFINED 7.65 25 374.91 5.50 1.47 1.48 sand >90 44-46 >50 UNDEFINED 7.95 26 350.75 5.17 1.47 1.54 sand to silty sand >90 44-46 >50 UNDEFINED 8.25 27 400.68 6.18 1.54 1.59 sand to silty sand >90 44-46 >50 UNDEFINED ----------------------------------------------------------------------------------------------------------------------------------- Dr - All sands (Jamiolkowski et al. 1985) PHI - Robertson and Campanella 1983 Su: Nk= 15 **** Note: For interpretation purposes the PLOTTED CPT PROFILE should be used with the TABULATED OUTPUT from CPTINTR1 (v 3.04) ****
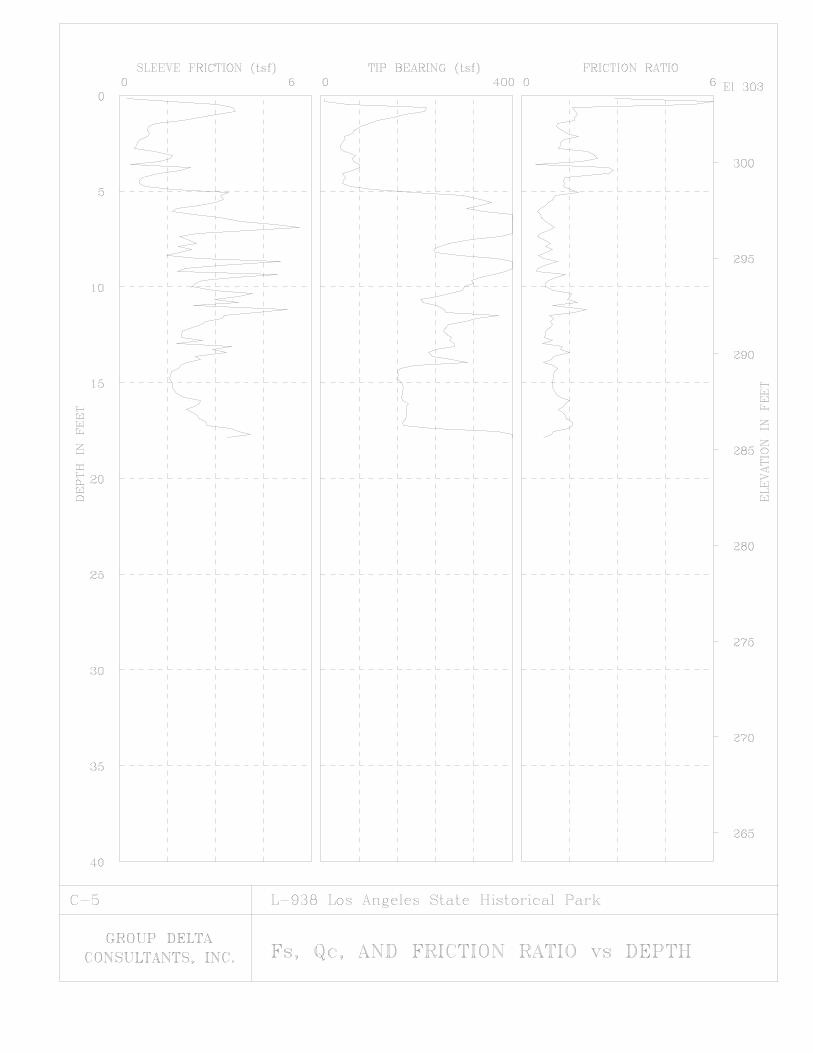

N:\Projects\_LA\L900\L-938 LA State Historical Park\CPT Analysis\C-5.doc
GROUP DELTA CONSULTANTS Engineer : Eric Holliday CPT Date : 02-23-11 On Site Loc: C-5 Cone Used : Middle Earth 25-ton rig Job No. : L-938 LASHP Water table ( feet ) : 32 Tot. Unit Wt. (avg) : 120 pcf ----------------------------------------------------------------------------------------------------------------------------------- DEPTH Qc (avg) Fs (avg) Rf (avg) SIGV' SOIL BEHAVIOUR TYPE Eq - Dr PHI SPT Su (meters) (feet) (tsf) (tsf) (%) (tsf) (%) deg. N tsf ----------------------------------------------------------------------------------------------------------------------------------- 0.30 1 113.90 2.51 2.21 0.03 silty sand to sandy silt >90 >48 36 UNDEFINED 0.60 2 99.10 1.39 1.40 0.09 sand to silty sand >90 >48 24 UNDEFINED 0.95 3 50.52 0.83 1.65 0.15 silty sand to sandy silt 70-80 46-48 16 UNDEFINED 1.25 4 68.13 1.42 2.09 0.22 silty sand to sandy silt 70-80 44-46 22 UNDEFINED 1.55 5 85.26 1.31 1.54 0.28 silty sand to sandy silt 80-90 44-46 27 UNDEFINED 1.85 6 327.27 2.56 0.78 0.33 sand >90 >48 >50 UNDEFINED 2.15 7 500.77 3.97 0.79 0.39 gravelly sand to sand >90 >48 >50 UNDEFINED 2.45 8 311.88 2.16 0.69 0.45 sand >90 >48 >50 UNDEFINED 2.75 9 368.50 2.67 0.73 0.51 gravelly sand to sand >90 >48 >50 UNDEFINED 3.05 10 335.76 2.93 0.87 0.57 sand >90 >48 >50 UNDEFINED 3.35 11 245.23 3.30 1.35 0.63 sand >90 46-48 47 UNDEFINED 3.65 12 297.54 3.55 1.19 0.69 sand >90 46-48 >50 UNDEFINED 3.95 13 267.19 2.08 0.78 0.75 sand >90 46-48 >50 UNDEFINED 4.25 14 259.56 2.80 1.08 0.81 sand >90 44-46 50 UNDEFINED 4.55 15 168.69 1.70 1.01 0.87 sand 80-90 42-44 32 UNDEFINED 4.85 16 170.86 1.90 1.11 0.93 sand to silty sand 80-90 42-44 41 UNDEFINED 5.15 17 179.41 2.36 1.31 0.98 sand to silty sand 80-90 42-44 43 UNDEFINED 5.45 18 314.32 3.35 1.07 1.04 sand >90 44-46 >50 UNDEFINED ----------------------------------------------------------------------------------------------------------------------------------- Dr - All sands (Jamiolkowski et al. 1985) PHI - Robertson and Campanella 1983 Su: Nk= 15 **** Note: For interpretation purposes the PLOTTED CPT PROFILE should be used with the TABULATED OUTPUT from CPTINTR1 (v 3.04) ****
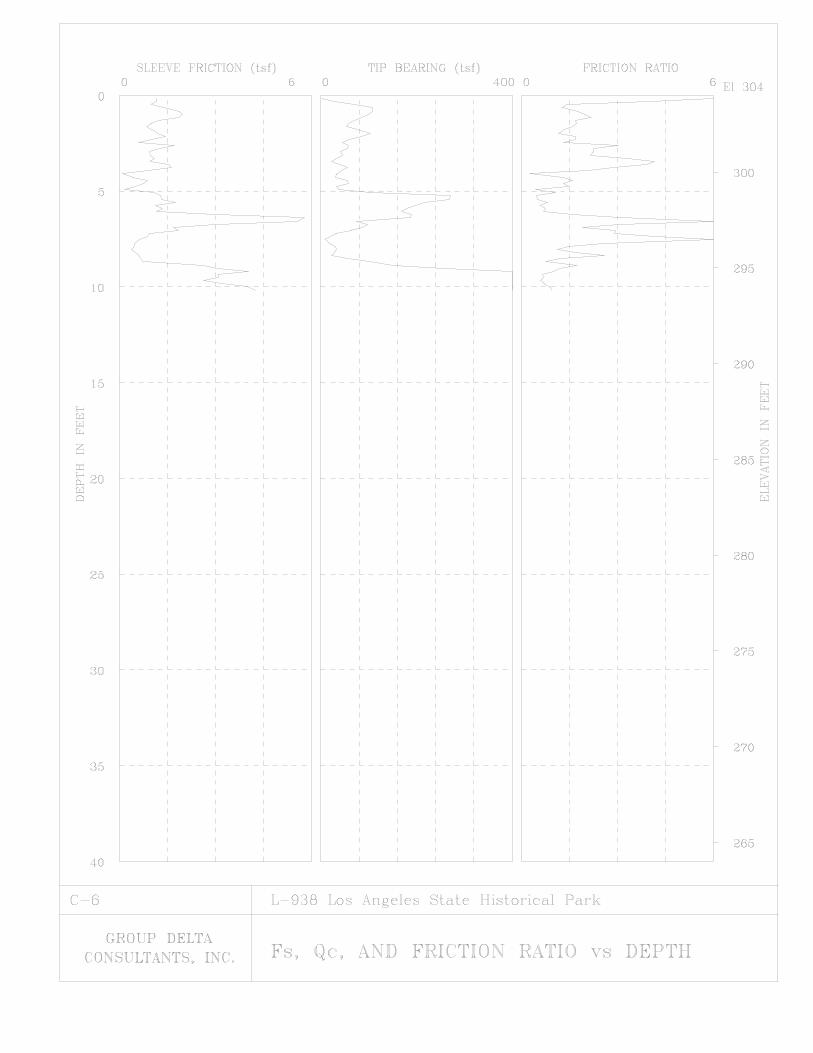
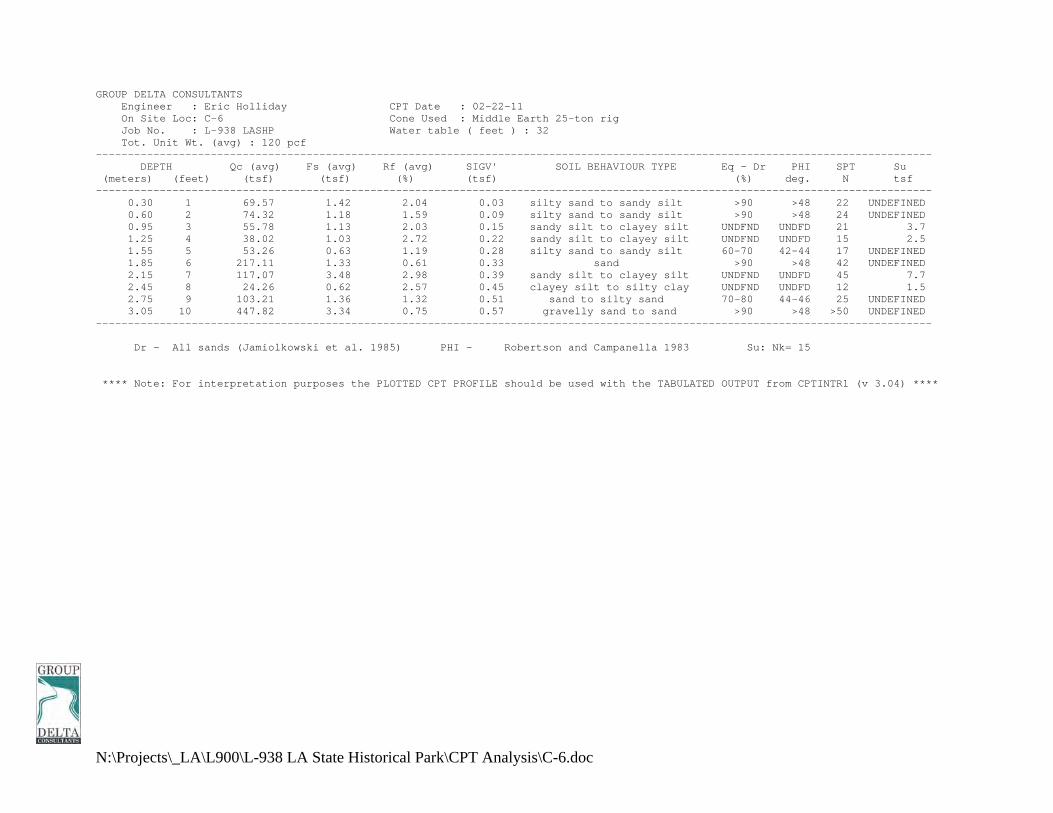
N:\Projects\_LA\L900\L-938 LA State Historical Park\CPT Analysis\C-6.doc
GROUP DELTA CONSULTANTS Engineer : Eric Holliday CPT Date : 02-22-11 On Site Loc: C-6 Cone Used : Middle Earth 25-ton rig Job No. : L-938 LASHP Water table ( feet ) : 32 Tot. Unit Wt. (avg) : 120 pcf ----------------------------------------------------------------------------------------------------------------------------------- DEPTH Qc (avg) Fs (avg) Rf (avg) SIGV' SOIL BEHAVIOUR TYPE Eq - Dr PHI SPT Su (meters) (feet) (tsf) (tsf) (%) (tsf) (%) deg. N tsf ----------------------------------------------------------------------------------------------------------------------------------- 0.30 1 69.57 1.42 2.04 0.03 silty sand to sandy silt >90 >48 22 UNDEFINED 0.60 2 74.32 1.18 1.59 0.09 silty sand to sandy silt >90 >48 24 UNDEFINED 0.95 3 55.78 1.13 2.03 0.15 sandy silt to clayey silt UNDFND UNDFD 21 3.7 1.25 4 38.02 1.03 2.72 0.22 sandy silt to clayey silt UNDFND UNDFD 15 2.5 1.55 5 53.26 0.63 1.19 0.28 silty sand to sandy silt 60-70 42-44 17 UNDEFINED 1.85 6 217.11 1.33 0.61 0.33 sand >90 >48 42 UNDEFINED 2.15 7 117.07 3.48 2.98 0.39 sandy silt to clayey silt UNDFND UNDFD 45 7.7 2.45 8 24.26 0.62 2.57 0.45 clayey silt to silty clay UNDFND UNDFD 12 1.5 2.75 9 103.21 1.36 1.32 0.51 sand to silty sand 70-80 44-46 25 UNDEFINED 3.05 10 447.82 3.34 0.75 0.57 gravelly sand to sand >90 >48 >50 UNDEFINED ----------------------------------------------------------------------------------------------------------------------------------- Dr - All sands (Jamiolkowski et al. 1985) PHI - Robertson and Campanella 1983 Su: Nk= 15 **** Note: For interpretation purposes the PLOTTED CPT PROFILE should be used with the TABULATED OUTPUT from CPTINTR1 (v 3.04) ****
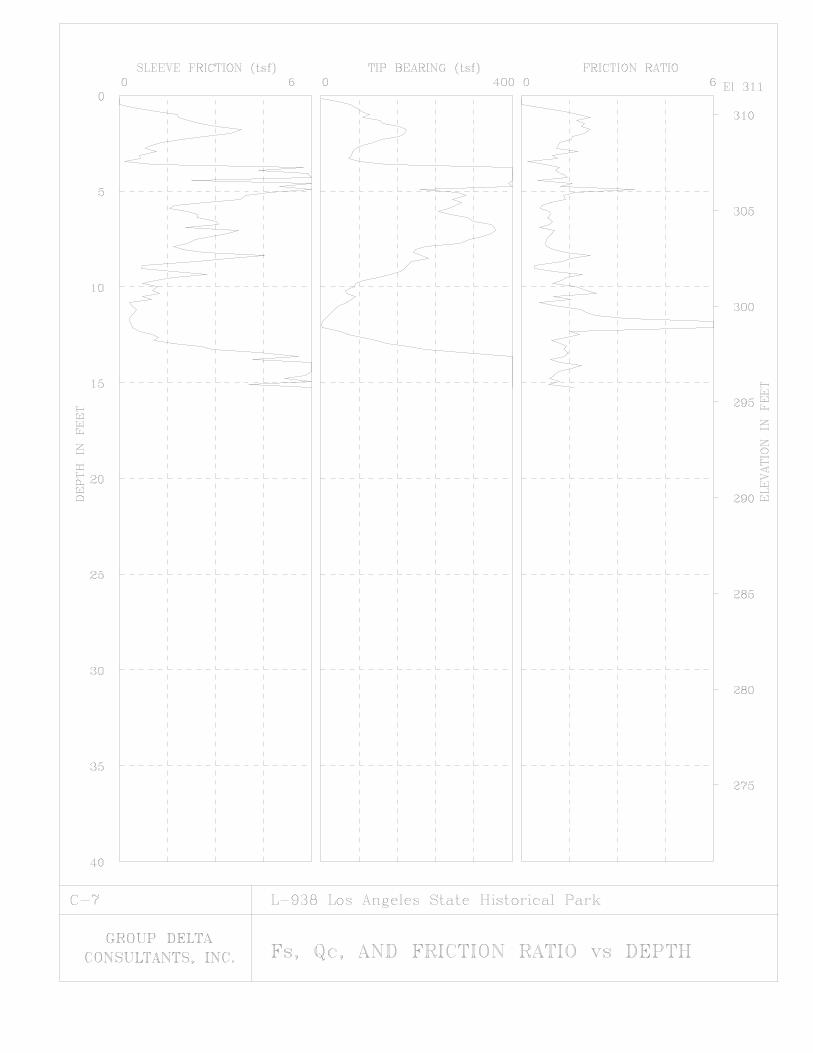
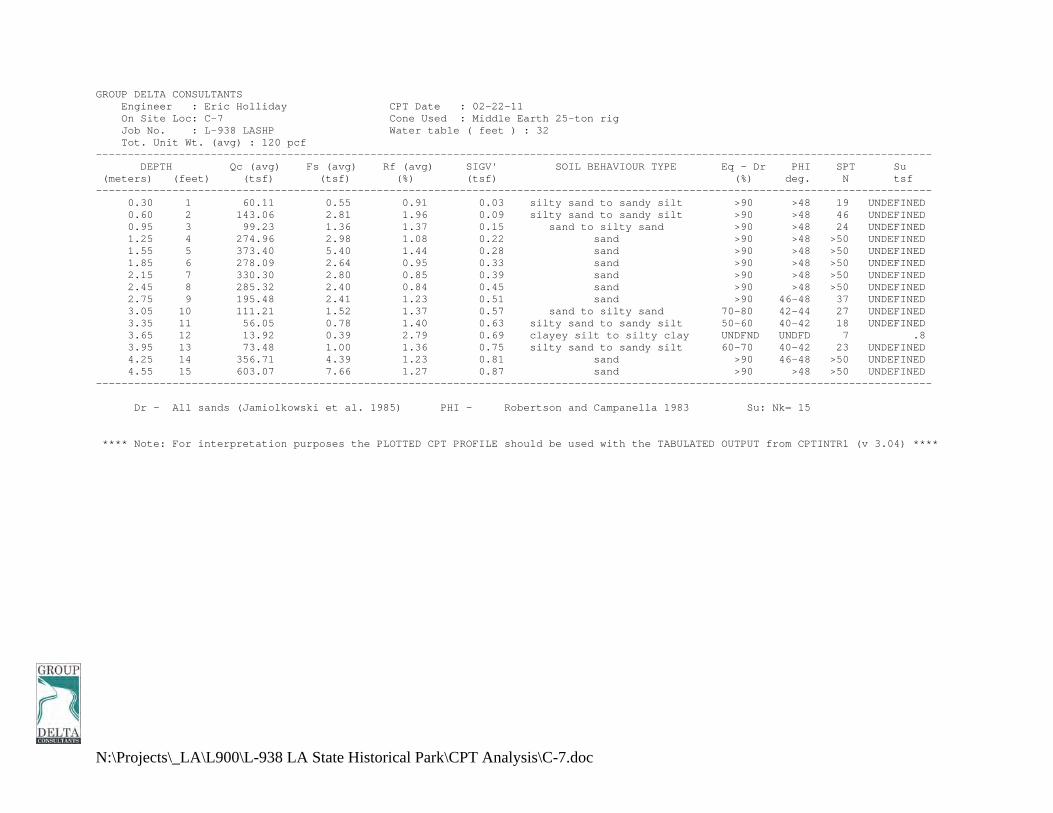
N:\Projects\_LA\L900\L-938 LA State Historical Park\CPT Analysis\C-7.doc
GROUP DELTA CONSULTANTS Engineer : Eric Holliday CPT Date : 02-22-11 On Site Loc: C-7 Cone Used : Middle Earth 25-ton rig Job No. : L-938 LASHP Water table ( feet ) : 32 Tot. Unit Wt. (avg) : 120 pcf ----------------------------------------------------------------------------------------------------------------------------------- DEPTH Qc (avg) Fs (avg) Rf (avg) SIGV' SOIL BEHAVIOUR TYPE Eq - Dr PHI SPT Su (meters) (feet) (tsf) (tsf) (%) (tsf) (%) deg. N tsf ----------------------------------------------------------------------------------------------------------------------------------- 0.30 1 60.11 0.55 0.91 0.03 silty sand to sandy silt >90 >48 19 UNDEFINED 0.60 2 143.06 2.81 1.96 0.09 silty sand to sandy silt >90 >48 46 UNDEFINED 0.95 3 99.23 1.36 1.37 0.15 sand to silty sand >90 >48 24 UNDEFINED 1.25 4 274.96 2.98 1.08 0.22 sand >90 >48 >50 UNDEFINED 1.55 5 373.40 5.40 1.44 0.28 sand >90 >48 >50 UNDEFINED 1.85 6 278.09 2.64 0.95 0.33 sand >90 >48 >50 UNDEFINED 2.15 7 330.30 2.80 0.85 0.39 sand >90 >48 >50 UNDEFINED 2.45 8 285.32 2.40 0.84 0.45 sand >90 >48 >50 UNDEFINED 2.75 9 195.48 2.41 1.23 0.51 sand >90 46-48 37 UNDEFINED 3.05 10 111.21 1.52 1.37 0.57 sand to silty sand 70-80 42-44 27 UNDEFINED 3.35 11 56.05 0.78 1.40 0.63 silty sand to sandy silt 50-60 40-42 18 UNDEFINED 3.65 12 13.92 0.39 2.79 0.69 clayey silt to silty clay UNDFND UNDFD 7 .8 3.95 13 73.48 1.00 1.36 0.75 silty sand to sandy silt 60-70 40-42 23 UNDEFINED 4.25 14 356.71 4.39 1.23 0.81 sand >90 46-48 >50 UNDEFINED 4.55 15 603.07 7.66 1.27 0.87 sand >90 >48 >50 UNDEFINED ----------------------------------------------------------------------------------------------------------------------------------- Dr - All sands (Jamiolkowski et al. 1985) PHI - Robertson and Campanella 1983 Su: Nk= 15 **** Note: For interpretation purposes the PLOTTED CPT PROFILE should be used with the TABULATED OUTPUT from CPTINTR1 (v 3.04) ****
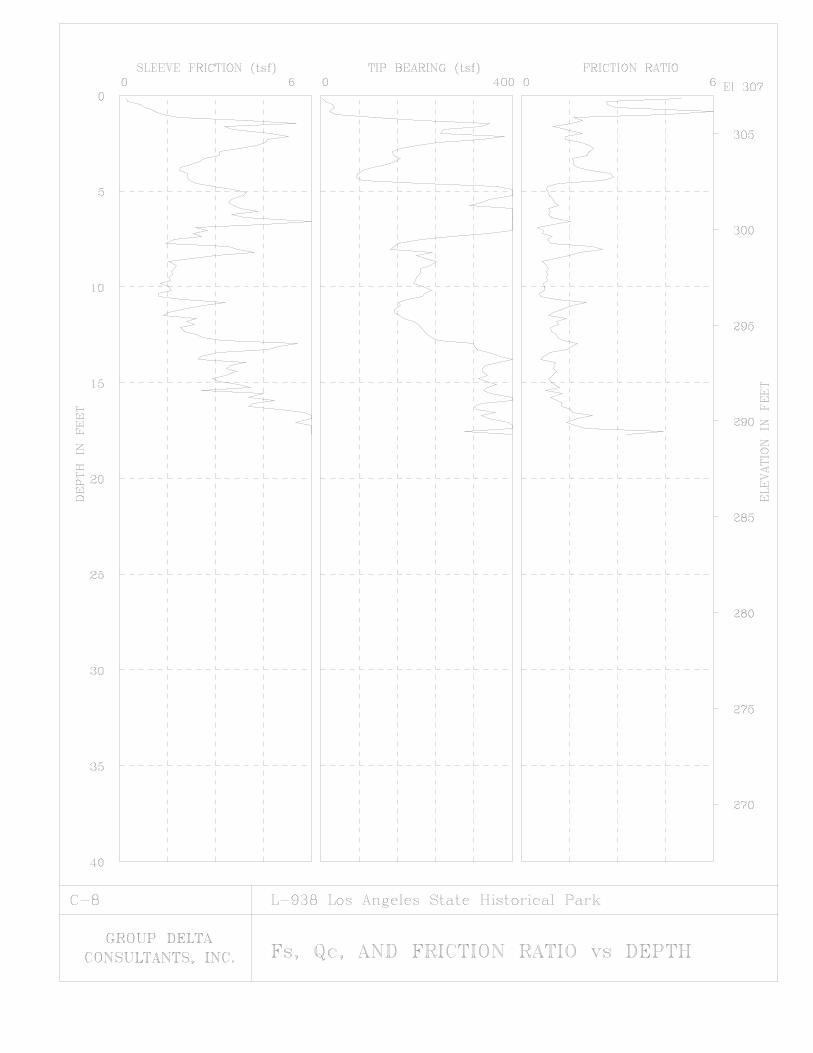
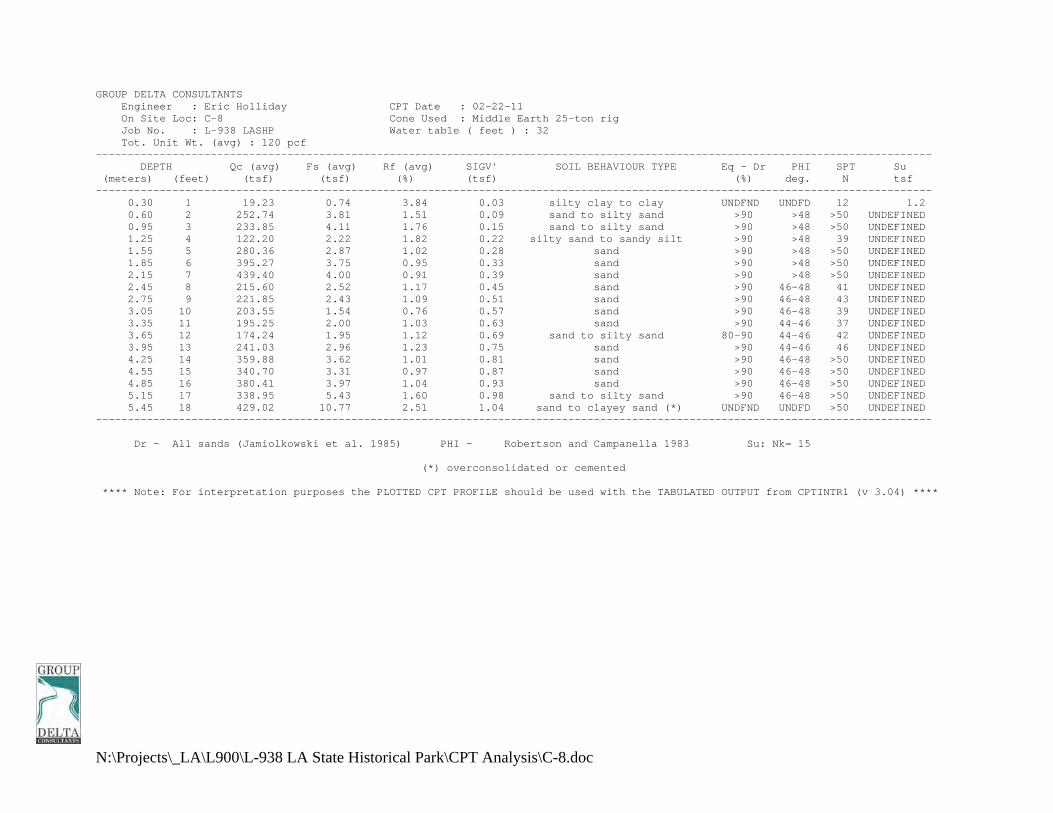
N:\Projects\_LA\L900\L-938 LA State Historical Park\CPT Analysis\C-8.doc
GROUP DELTA CONSULTANTS Engineer : Eric Holliday CPT Date : 02-22-11 On Site Loc: C-8 Cone Used : Middle Earth 25-ton rig Job No. : L-938 LASHP Water table ( feet ) : 32 Tot. Unit Wt. (avg) : 120 pcf ----------------------------------------------------------------------------------------------------------------------------------- DEPTH Qc (avg) Fs (avg) Rf (avg) SIGV' SOIL BEHAVIOUR TYPE Eq - Dr PHI SPT Su (meters) (feet) (tsf) (tsf) (%) (tsf) (%) deg. N tsf ----------------------------------------------------------------------------------------------------------------------------------- 0.30 1 19.23 0.74 3.84 0.03 silty clay to clay UNDFND UNDFD 12 1.2 0.60 2 252.74 3.81 1.51 0.09 sand to silty sand >90 >48 >50 UNDEFINED 0.95 3 233.85 4.11 1.76 0.15 sand to silty sand >90 >48 >50 UNDEFINED 1.25 4 122.20 2.22 1.82 0.22 silty sand to sandy silt >90 >48 39 UNDEFINED 1.55 5 280.36 2.87 1.02 0.28 sand >90 >48 >50 UNDEFINED 1.85 6 395.27 3.75 0.95 0.33 sand >90 >48 >50 UNDEFINED 2.15 7 439.40 4.00 0.91 0.39 sand >90 >48 >50 UNDEFINED 2.45 8 215.60 2.52 1.17 0.45 sand >90 46-48 41 UNDEFINED 2.75 9 221.85 2.43 1.09 0.51 sand >90 46-48 43 UNDEFINED 3.05 10 203.55 1.54 0.76 0.57 sand >90 46-48 39 UNDEFINED 3.35 11 195.25 2.00 1.03 0.63 sand >90 44-46 37 UNDEFINED 3.65 12 174.24 1.95 1.12 0.69 sand to silty sand 80-90 44-46 42 UNDEFINED 3.95 13 241.03 2.96 1.23 0.75 sand >90 44-46 46 UNDEFINED 4.25 14 359.88 3.62 1.01 0.81 sand >90 46-48 >50 UNDEFINED 4.55 15 340.70 3.31 0.97 0.87 sand >90 46-48 >50 UNDEFINED 4.85 16 380.41 3.97 1.04 0.93 sand >90 46-48 >50 UNDEFINED 5.15 17 338.95 5.43 1.60 0.98 sand to silty sand >90 46-48 >50 UNDEFINED 5.45 18 429.02 10.77 2.51 1.04 sand to clayey sand (*) UNDFND UNDFD >50 UNDEFINED ----------------------------------------------------------------------------------------------------------------------------------- Dr - All sands (Jamiolkowski et al. 1985) PHI - Robertson and Campanella 1983 Su: Nk= 15 (*) overconsolidated or cemented **** Note: For interpretation purposes the PLOTTED CPT PROFILE should be used with the TABULATED OUTPUT from CPTINTR1 (v 3.04) ****

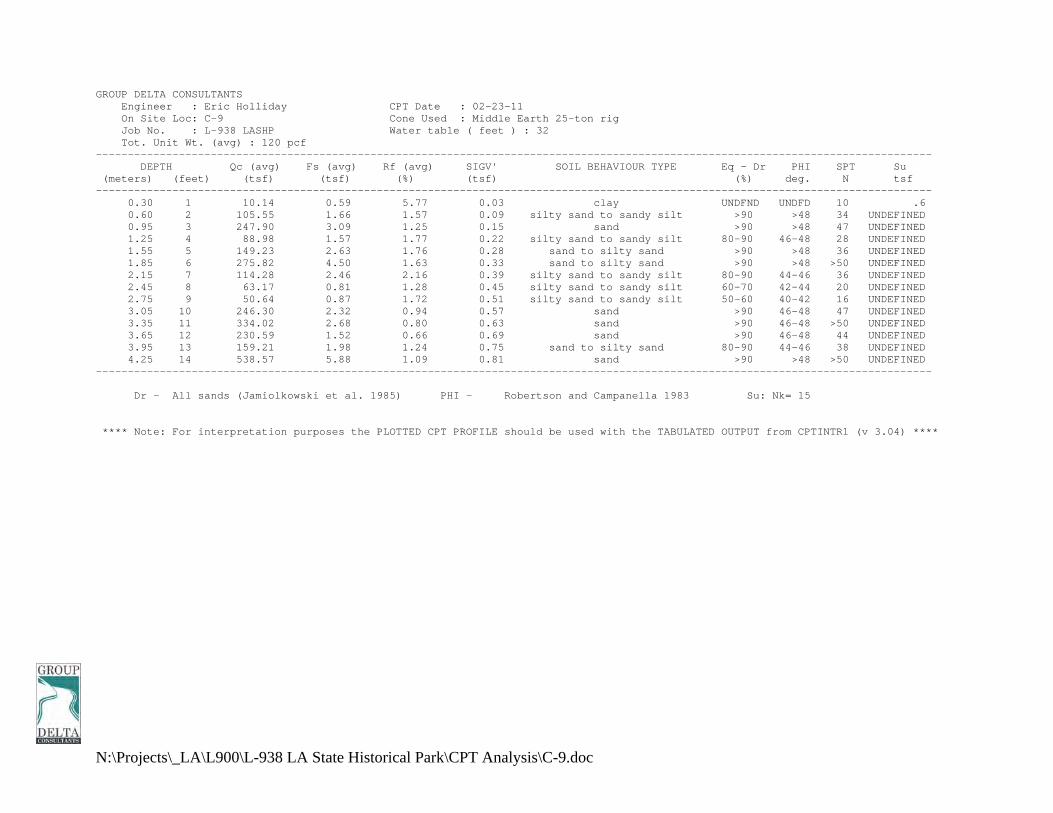
N:\Projects\_LA\L900\L-938 LA State Historical Park\CPT Analysis\C-9.doc
GROUP DELTA CONSULTANTS Engineer : Eric Holliday CPT Date : 02-23-11 On Site Loc: C-9 Cone Used : Middle Earth 25-ton rig Job No. : L-938 LASHP Water table ( feet ) : 32 Tot. Unit Wt. (avg) : 120 pcf ----------------------------------------------------------------------------------------------------------------------------------- DEPTH Qc (avg) Fs (avg) Rf (avg) SIGV' SOIL BEHAVIOUR TYPE Eq - Dr PHI SPT Su (meters) (feet) (tsf) (tsf) (%) (tsf) (%) deg. N tsf ----------------------------------------------------------------------------------------------------------------------------------- 0.30 1 10.14 0.59 5.77 0.03 clay UNDFND UNDFD 10 .6 0.60 2 105.55 1.66 1.57 0.09 silty sand to sandy silt >90 >48 34 UNDEFINED 0.95 3 247.90 3.09 1.25 0.15 sand >90 >48 47 UNDEFINED 1.25 4 88.98 1.57 1.77 0.22 silty sand to sandy silt 80-90 46-48 28 UNDEFINED 1.55 5 149.23 2.63 1.76 0.28 sand to silty sand >90 >48 36 UNDEFINED 1.85 6 275.82 4.50 1.63 0.33 sand to silty sand >90 >48 >50 UNDEFINED 2.15 7 114.28 2.46 2.16 0.39 silty sand to sandy silt 80-90 44-46 36 UNDEFINED 2.45 8 63.17 0.81 1.28 0.45 silty sand to sandy silt 60-70 42-44 20 UNDEFINED 2.75 9 50.64 0.87 1.72 0.51 silty sand to sandy silt 50-60 40-42 16 UNDEFINED 3.05 10 246.30 2.32 0.94 0.57 sand >90 46-48 47 UNDEFINED 3.35 11 334.02 2.68 0.80 0.63 sand >90 46-48 >50 UNDEFINED 3.65 12 230.59 1.52 0.66 0.69 sand >90 46-48 44 UNDEFINED 3.95 13 159.21 1.98 1.24 0.75 sand to silty sand 80-90 44-46 38 UNDEFINED 4.25 14 538.57 5.88 1.09 0.81 sand >90 >48 >50 UNDEFINED ----------------------------------------------------------------------------------------------------------------------------------- Dr - All sands (Jamiolkowski et al. 1985) PHI - Robertson and Campanella 1983 Su: Nk= 15 **** Note: For interpretation purposes the PLOTTED CPT PROFILE should be used with the TABULATED OUTPUT from CPTINTR1 (v 3.04) ****
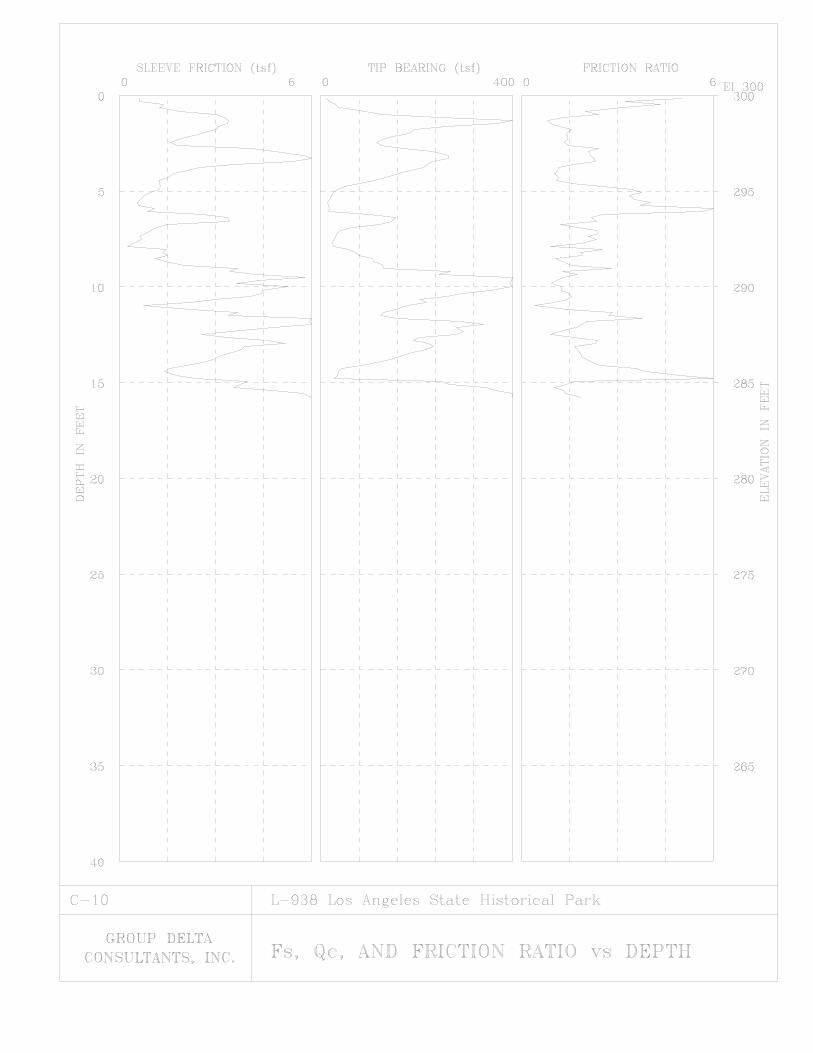

N:\Projects\_LA\L900\L-938 LA State Historical Park\CPT Analysis\C-10.doc
GROUP DELTA CONSULTANTS Engineer : Eric Holliday CPT Date : 02-23-11 On Site Loc: C-10 Cone Used : Middle Earth 25-ton rig Job No. : L-938 LASHP Water table ( feet ) : 32 Tot. Unit Wt. (avg) : 120 pcf ----------------------------------------------------------------------------------------------------------------------------------- DEPTH Qc (avg) Fs (avg) Rf (avg) SIGV' SOIL BEHAVIOUR TYPE Eq - Dr PHI SPT Su (meters) (feet) (tsf) (tsf) (%) (tsf) (%) deg. N tsf ----------------------------------------------------------------------------------------------------------------------------------- 0.30 1 <<<<<<<<<<<<<<<<<<<<<<<<<<<<<<<<<<<<< HAND AUGERED TO 1.5 FT DEPTH >>>>>>>>>>>>>>>>>>>>>>>>>>>>>>>>>>>>>>>> 0.60 2 281.92 3.13 1.11 0.09 sand >90 >48 >50 UNDEFINED 0.95 3 170.72 3.17 1.86 0.15 sand to silty sand >90 >48 41 UNDEFINED 1.25 4 214.89 3.57 1.66 0.22 sand to silty sand >90 >48 >50 UNDEFINED 1.55 5 73.63 1.26 1.70 0.28 silty sand to sandy silt 70-80 44-46 24 UNDEFINED 1.85 6 17.36 0.76 4.35 0.33 clay UNDFND UNDFD 17 1.1 2.15 7 106.09 2.17 2.05 0.39 silty sand to sandy silt 80-90 44-46 34 UNDEFINED 2.45 8 33.70 0.72 2.12 0.45 sandy silt to clayey silt UNDFND UNDFD 13 2.2 2.75 9 105.79 1.86 1.75 0.51 silty sand to sandy silt 70-80 44-46 34 UNDEFINED 3.05 10 362.96 4.48 1.23 0.57 sand >90 >48 >50 UNDEFINED 3.35 11 253.76 3.16 1.24 0.63 sand >90 46-48 49 UNDEFINED 3.65 12 200.71 4.62 2.30 0.69 silty sand to sandy silt >90 44-46 >50 UNDEFINED 3.95 13 248.56 4.00 1.61 0.75 sand to silty sand >90 46-48 >50 UNDEFINED 4.25 14 179.05 3.32 1.85 0.81 sand to silty sand 80-90 44-46 43 UNDEFINED 4.55 15 80.59 2.21 2.74 0.87 sandy silt to clayey silt UNDFND UNDFD 31 5.3 4.85 16 381.70 5.03 1.32 0.93 sand >90 46-48 >50 UNDEFINED ----------------------------------------------------------------------------------------------------------------------------------- Dr - All sands (Jamiolkowski et al. 1985) PHI - Robertson and Campanella 1983 Su: Nk= 15 **** Note: For interpretation purposes the PLOTTED CPT PROFILE should be used with the TABULATED OUTPUT from CPTINTR1 (v 3.04) ****


N:\Projects\_LA\L900\L-938 LA State Historical Park\CPT Analysis\C-11.doc
GROUP DELTA CONSULTANTS Engineer : Eric Holliday CPT Date : 02-22-11 On Site Loc: C-11 Cone Used : Middle Earth 25-ton rig Job No. : L-938 LASHP Water table ( feet ) : 32 Tot. Unit Wt. (avg) : 120 pcf ----------------------------------------------------------------------------------------------------------------------------------- DEPTH Qc (avg) Fs (avg) Rf (avg) SIGV' SOIL BEHAVIOUR TYPE Eq - Dr PHI SPT Su (meters) (feet) (tsf) (tsf) (%) (tsf) (%) deg. N tsf ----------------------------------------------------------------------------------------------------------------------------------- 0.30 1 <<<<<<<<<<<<<<<<<<<<<<<<<<<<<<<<<<<<< HAND AUGERED TO 1.5 FT DEPTH >>>>>>>>>>>>>>>>>>>>>>>>>>>>>>>>>>>>>>>> 0.60 2 325.04 3.41 1.05 0.09 sand >90 >48 >50 UNDEFINED 0.95 3 472.33 7.62 1.61 0.15 sand to silty sand >90 >48 >50 UNDEFINED 1.25 4 117.03 2.74 2.34 0.22 silty sand to sandy silt >90 >48 37 UNDEFINED 1.55 5 14.05 0.65 4.61 0.28 clay UNDFND UNDFD 13 .9 1.85 6 17.18 0.83 4.81 0.33 clay UNDFND UNDFD 16 1.1 2.15 7 22.00 1.07 4.86 0.39 clay UNDFND UNDFD 21 1.4 2.45 8 34.00 1.11 3.25 0.45 clayey silt to silty clay UNDFND UNDFD 16 2.2 2.75 9 93.44 2.19 2.34 0.51 silty sand to sandy silt 70-80 42-44 30 UNDEFINED 3.05 10 63.49 1.86 2.93 0.57 sandy silt to clayey silt UNDFND UNDFD 24 4.1 3.35 11 141.40 2.45 1.73 0.63 sand to silty sand 80-90 44-46 34 UNDEFINED 3.65 12 186.39 3.73 2.00 0.69 silty sand to sandy silt 80-90 44-46 >50 UNDEFINED 3.95 13 170.73 4.92 2.88 0.75 silty sand to sandy silt 80-90 44-46 >50 UNDEFINED 4.25 14 455.69 5.22 1.15 0.81 sand >90 >48 >50 UNDEFINED 4.55 15 503.91 6.94 1.38 0.87 sand >90 >48 >50 UNDEFINED 4.85 16 488.90 5.47 1.12 0.93 sand >90 46-48 >50 UNDEFINED 5.15 17 453.34 6.08 1.34 0.98 sand >90 46-48 >50 UNDEFINED 5.45 18 513.93 7.61 1.48 1.04 sand >90 46-48 >50 UNDEFINED ----------------------------------------------------------------------------------------------------------------------------------- Dr - All sands (Jamiolkowski et al. 1985) PHI - Robertson and Campanella 1983 Su: Nk= 15 **** Note: For interpretation purposes the PLOTTED CPT PROFILE should be used with the TABULATED OUTPUT from CPTINTR1 (v 3.04) ****

Group Delta ConsultantsLocation LA STATE HISTORIC PARK Operator RS/BHJob Number L-938 Cone Number DSG1104 GPSHole Number C-3 Date and Time 2/22/2011 12:22:14 PM
4.92 ft9.34 mS
Unknown Vel
10.01 ft12.07 mS
1444.92 ft/S
14.93 ft15.39 mS
1338.61 ft/S
20.01 ft18.55 mS
1523.07 ft/S
Page 1 of 1
0 TIME (mS) 100

APPENDIX B LABORATORY TESTING

Geotechnical Report Los Angeles State Historical Park Los Angeles, California Page B-1 GDC Project No. L-938
APPENDIX B
LABORATORY TESTING
B.1 General Laboratory testing was performed to aid in the classification of soils encountered in the borings and to evaluate their physical properties and engineering characteristics. The laboratory testing was performed by Group Delta Consultants Laboratories. The investigation included the following tests: Visual / Manual Soil Classification, ASTM D 2488 In situ moisture content and dry unit weight, ASTM D 2216 / 2937 Atterberg limits, ASTM D 4318 Grain Size Distribution, ASTM D 422 Percent passing No. 200 sieve, ASTM D 1140 Corrosivity CTM 643, 422, 417 Expansion Index ASTM D 4829 R-Value CTM 301
Descriptions of these tests are given below. B.2 Soil Classification The subsurface materials were classified visually in the field using the Unified Soil Classification System (USCS), in accordance with ASTM Test Methods D 2487 and D 2488. Soil classifications were modified as necessary based on further inspection and testing in the laboratory. The soil classification system is presented on the key for soil classification, and field / laboratory classifications are presented on the boring logs, Figures A-2a through A-10 of Appendix A. B.3 Moisture Content and Dry Unit Weight
The field moisture and dry unit weight of each relatively undisturbed sample were determined in general accordance with ASTM D 2216 and D 2937, respectively. Results of these tests are presented on the boring logs in Figures A-2a through A-10 of Appendix A. B.4 Atterberg Limits Characterization of the fine-grained fractions of the encountered soils was evaluated using the Atterberg Limits. This test includes Liquid Limit and Plastic Limit tests to determine the Plasticity Index in accordance with ASTM D 4318. Results of these
N:\Projects\_LA\L900\L-938 LA State Historical Park\Report\Appendices\L-938_APPENDIX B - text.doc

Geotechnical Report Los Angeles State Historical Park Los Angeles, California Page B-2 GDC Project No. L-938
tests are presented on the boring logs in Figures A-2a through A-10 of Appendix A and in Figure B-1of this Appendix. B.5 Percent Passing No. 200 Sieve and Grain Size Distribution Representative samples were dried, weighed, soaked in water until individual soil particles were separated, and then washed on the No. 200 sieve. The portion of the material retained on the No. 200 sieve was oven-dried in accordance with ASTM D 1140. The portion retained on #200 was passed through a #4 sieve to determine the % gravel, % sand, and % passing the + 200 sieve. For selected samples, the portion retained on #200 sieve was passed through a standard set of sieves and the grain size distribution was determined in accordance with ASTM D 422. The percentage of gravel, sand, and fines (i.e., soil passing #200 sieve) is presented on the boring logs in Figures A-2a through A-10 of Appendix A. Grain size distribution of selected samples is plotted in Figure B-2 of this appendix. B.6 Soil Corrosivity Tests were performed in order to determine corrosion potential of site soils on concrete and ferrous metals. Corrosivity testing included soil pH (Caltrans method 643), water-soluble chlorides (Caltrans Test method 422), water-soluble sulfates (Caltrans Test Method 417) and minimum electrical resistivity (Caltrans Test method 643). The test results are summarized below in Table B-1.
TABLE B-1: SUMMARY OF CORROSION TEST RESULTS
BORING NO
SAMPLE NO
DEPTH (feet)
SOIL TYPE PH
CALTRANS 643
CHLORIDE CONTENT
CALTRANS 422 (ppm)
SULFATE CONTENT
CALTRANS 417 (ppm)
MINIMUM RESISTIVITY
CALTRANS 643 (ohm-cm)
B-1 B-0 0-5 ML/CL + SM
8.0 <100 690 1478
B-3 B-0 0-5 ML/CL +SW-SM
8.24 <100 <100 2023
B-5 S-1 2.5-4 SP-SM 8.03 100 310 Not tested
B.7 R-Value A Resistance or R-Value test was performed on a selected bulk sample of the subgrade soils encountered under proposed pavement widen locations. The test
N:\Projects\_LA\L900\L-938 LA State Historical Park\Report\Appendices\L-938_APPENDIX B - text.doc
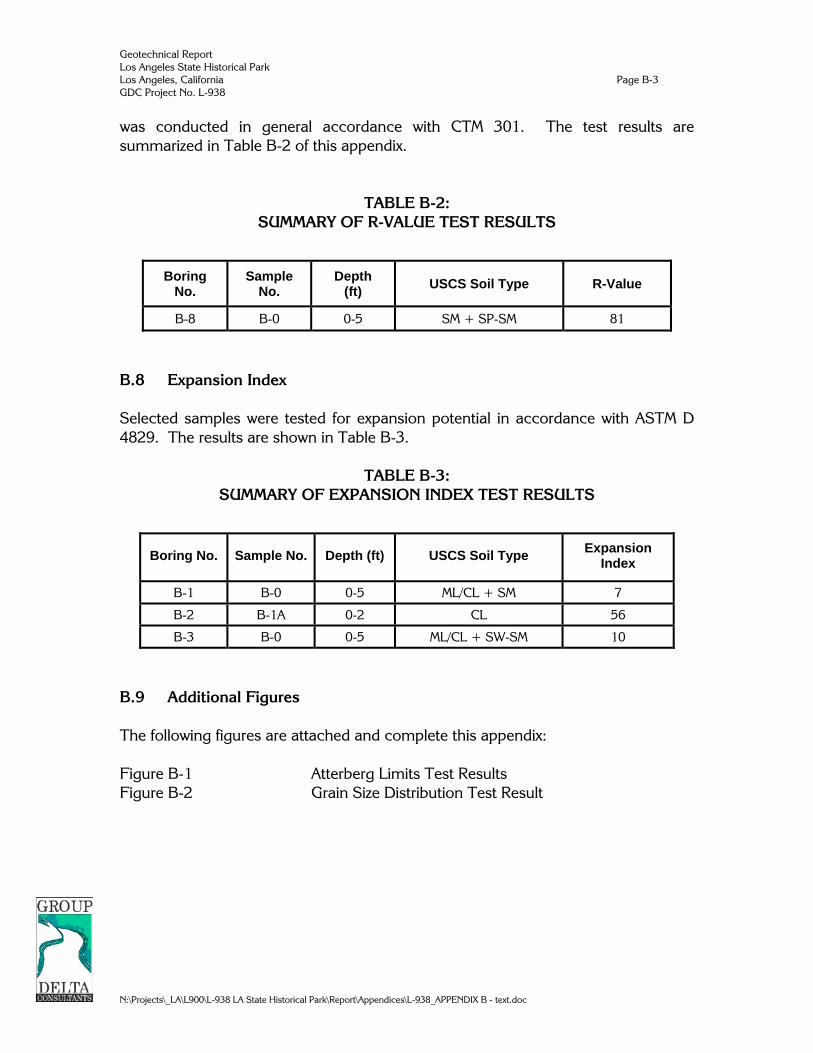
Geotechnical Report Los Angeles State Historical Park Los Angeles, California Page B-3 GDC Project No. L-938
N:\Projects\_LA\L900\L-938 LA State Historical Park\Report\Appendices\L-938_APPENDIX B - text.doc
was conducted in general accordance with CTM 301. The test results are summarized in Table B-2 of this appendix.
TABLE B-2: SUMMARY OF R-VALUE TEST RESULTS
Boring No.
Sample No.
Depth (ft) USCS Soil Type R-Value
B-8 B-0 0-5 SM + SP-SM 81
B.8 Expansion Index Selected samples were tested for expansion potential in accordance with ASTM D 4829. The results are shown in Table B-3.
TABLE B-3: SUMMARY OF EXPANSION INDEX TEST RESULTS
Boring No. Sample No. Depth (ft) USCS Soil Type Expansion Index
B-1 B-0 0-5 ML/CL + SM 7
B-2 B-1A 0-2 CL 56
B-3 B-0 0-5 ML/CL + SW-SM 10
B.9 Additional Figures The following figures are attached and complete this appendix: Figure B-1 Atterberg Limits Test Results Figure B-2 Grain Size Distribution Test Result
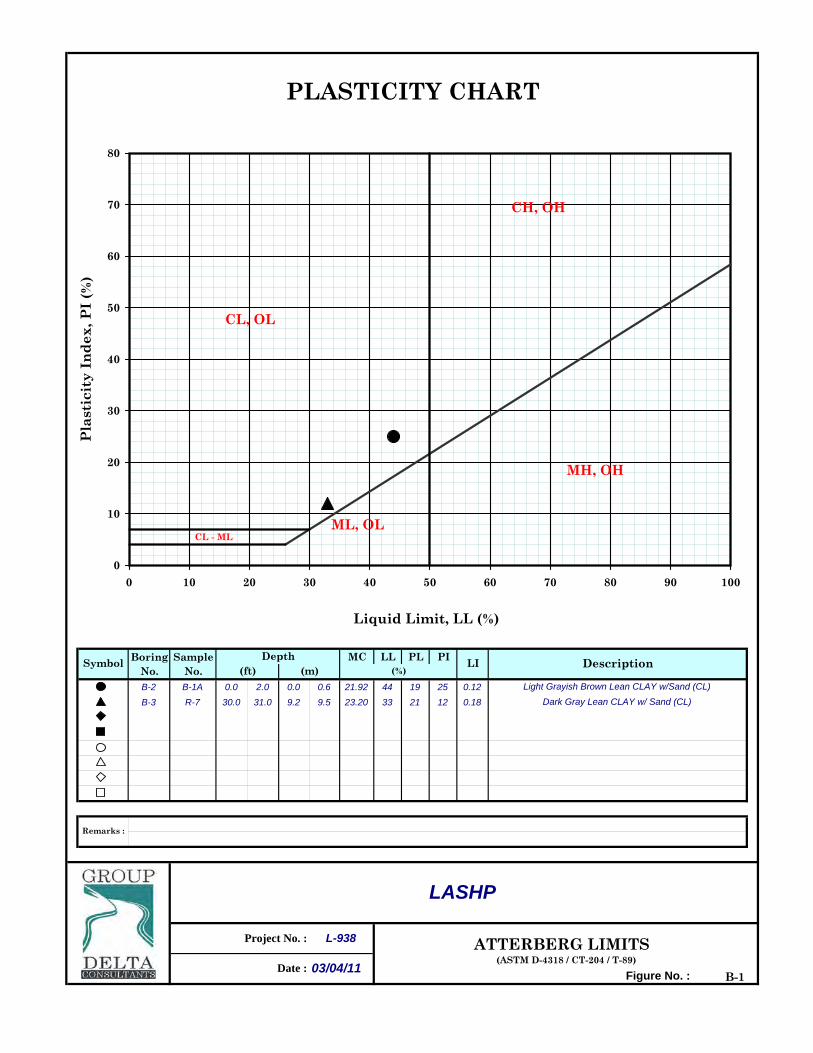
#
A Line 26 4 CL-ML 0 4 0 7 0-50 50 80
100 58.4 Box 26 4 30 7 Vert 50 0
Boring Sample MC LL PL PINo. No.B-2 B-1A 0.0 2.0 0.0 0.6 21.92 44 19 25 0.12
B-3 R-7 30.0 31.0 9.2 9.5 23.20 33 21 12 0.18
Figure No. : B-1Date :
(ASTM D-4318 / CT-204 / T-89)03/04/11
ATTERBERG LIMITS
PLASTICITY CHART
Light Grayish Brown Lean CLAY w/Sand (CL)
Dark Gray Lean CLAY w/ Sand (CL)
DescriptionSymbol(%)
LIDepth
(ft) (m)
L-938
LASHP
Project No. :
Remarks :
0
10
20
30
40
50
60
70
80
0 10 20 30 40 50 60 70 80 90 100
Liquid Limit, LL (%)
Pla
stic
ity
In
dex
, PI
(%)
MH, OH
CL - MLML, OL
CL, OL
CH, OH

0.0 0.00 #REF! #REF! #REF!
Boring SampleNumber Number Gravel Sand Fines LL PI
B-1 R-7 30.0 30.5 9.14 9.30 11 82 7 Well Graded SAND w/Silt and SW-SM
B-3 R-5 20.0 20.5 6.10 6.25 40 55 5 Poorly Graded SAND w/ Gravel SP
B-3 S-10 45.0 46.0 13.72 14.02 1 87 12 Poorly Graded SAND w/ Silt SP-SM
+
Date : Figure No. : B-203/04/11L-938Project No. :
Symbol( m )
Sample Depth [from/to] ( ft )
Hydrometer AnalysisUS Standard Sieve Sizes
Soil Description U.S.C.S.Atterberg LimitsGrain Size Percentage
LASHP GRAIN SIZE ANALYSIS (ASTM D-422)
0
10
20
30
40
50
60
70
80
90
100
0.0010.010.11101001000
Grain Size (mm)
Per
cent
Fin
er B
y D
ry W
eigh
t (%
)
3" #200
#100
#40
#60
#30
#16
#10
#41/2"
1"2"6"
Boulders CobblesGravel Sand
Fines (Silt / Clay)Coarse CoarseFine FineMedium

APPENDIX C SITE PHOTOGRAPHS


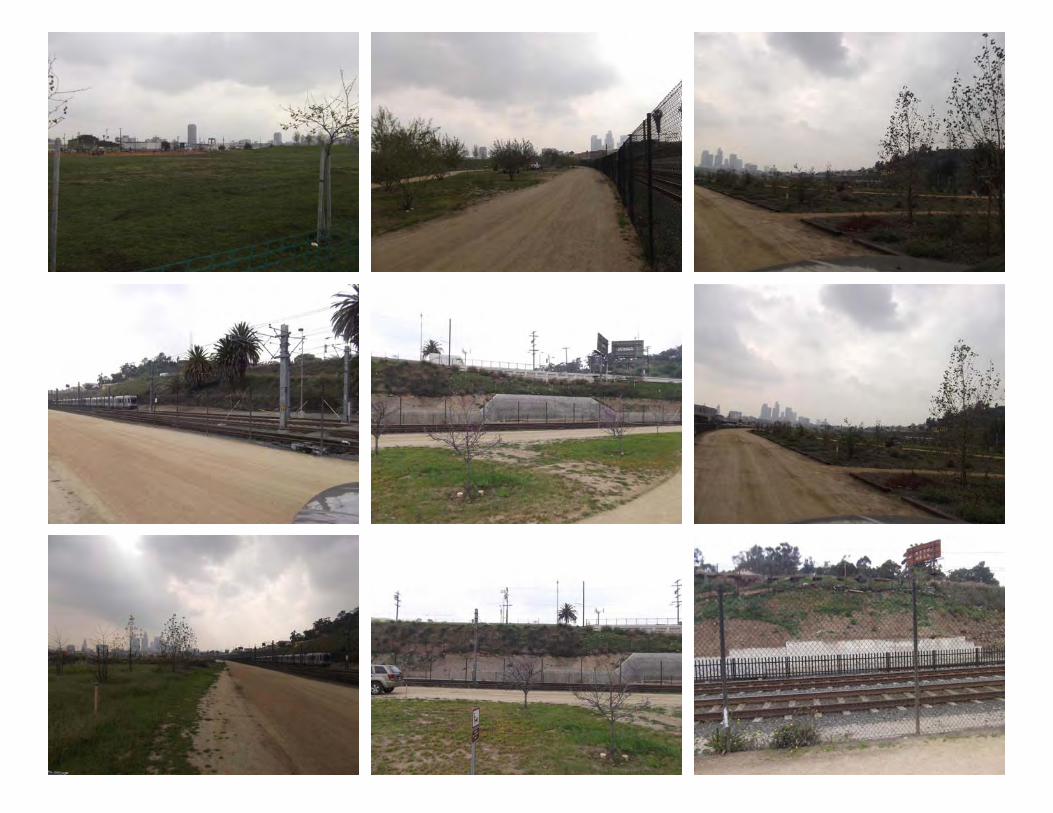

APPENDIX D ENVIRONMENTAL REVIEW LETTER
March 28, 2011
State of California Department of Parks and Recreation Southern Service Center 8885 Rio San Diego Drive, #270 San Diego, CA 92108
Attention: Mr. Jeff Brown, RLA Project Manager
SUBJECT: DOCUMENT REVIEW FOR ENVIRONMENTAL CONDITIONS LOS ANGELES STATE HISTORICAL PARK LOS ANGELES, CALIFORNIA GROUP DELTA PROJECT NO. L-938 MASTER SERVICES AGREEMENT NO. C08E0061
Dear Mr. Brown:
As requested by you, Group Delta Consultants, Inc. (GDC) has reviewed the two reports that were provided to us to evaluate potential environmental conditions at the site — previously the Cornfield Yard operation of Union Pacific Railroad Company (UPRC). The area is being studied for improvement to a park area and this review is intended to review site conditions to the extent that these may in some manner impact the proposed improvements. It is understood that the proposed park area is a smaller portion of UPRCs operational area that was investigated over many years for environmental conditions and impacts under California regulatory oversight (CA/EPA Department of Toxic Substances Control or DTSC).
The two documents reviewed are:
Removal Action Completion Report, 32-acre parcel of the former Cornfield Rail Yard, 1245 Spring Street, Los Angeles, California by Shaw Environmental, Inc. dated February 2003
Additional Site Investigation Summary and Groundwater Monitoring Report, Former Cornfield Yard, 1245 N. Spring Street, Los Angeles, California by ERM-West, Inc. dated October 2006.
The reports were provided and reviewed in electronic PDF format.
Environmental Conditions Review March 28, 2011 Los Angeles State Historic Park, Los Angeles, California Page 2 State of California Department of Parks and Recreation Group Delta Project No. L-938
N:\Projects\_LA\L900\L-938 LA State Historic Park\Environmental Reports\OP Summary Letter rev1.doc
SITE DESCRIPTION
The Los Angeles State Historic Park site consists of approximately 32 acres located within a half mile from El Pueblo de Los Angeles Historical Monument and Los Angeles City Hall in the heart of downtown Los Angeles. The park is on a historical site known as “The Cornfield,” a site of remarkable social, historical, and cultural significance and the last vast open space in downtown Los Angeles. The northern end of the site is located approximately 150 feet from the Los Angeles River and the southern end is located approximately 150 feet from the Chinatown Gold Line commuter train station. DPR is proposing to develop the full 32 acres of the park in phases. The major structural components of the proposed park will consist of a Welcome Station, a Ranger operations building, Roundhouse Pedestrian Bridge, and Turntable Stage. The Roundhouse Bridge will be the terminus of an anticipated future span of the existing railroad tracks and connect to a development planned along North Broadway at the intersection of Bishop Road. Future plans may connect the park to the adjacent Los Angeles River, resulting in a potential rise in groundwater levels.
The Site Vicinity Map and Aerial Photograph are shown in Figures 1A and 1B, and a Site Plan is shown in Figures 2A-2D. The park is located south of the Gold Line railroad right-of-way and north of Spring Street and Baker Street. The park area extends about 3,800 feet along the southern part of the railroad right-of-way to the crossing with Broadway.
BACKGROUND
Southern Pacific Transportation Company (SPTC) ·owned and operated the property from at least 1888 through 1998 (Burns & McDonnell, 2000). In February 1998, SPTC merged with the Union Pacific Railroad Company (UPRC), and UPRC divided the former Cornfield Rail Yard property into three areas: the 8-acre parcel, Metropolitan Transportation Authority (MTA) Easement, and the 32-acre parcel. The latter is the subject site: it is currently owned by the Department of Parks and Recreation (DPR). Transaction details, including due diligence undertaken at the time the land was transferred to DPR is not known and the reporting for that transaction was not reviewed for this evaluation. It has been reported that the groundwater beneath the Cornfield site is impacted and is being investigated/remediated by the previous owner, UPRC. The groundwater investigations are being completed under the oversight of the Los Angeles Regional Water Quality Control Board (RWQCB).
Environmental Conditions Review March 28, 2011 Los Angeles State Historic Park, Los Angeles, California Page 3 State of California Department of Parks and Recreation Group Delta Project No. L-938
N:\Projects\_LA\L900\L-938 LA State Historic Park\Environmental Reports\OP Summary Letter rev1.doc
Removal Action Completion Report (Shaw, 2003)
IT Corporation, subsequently known as Shaw Environmental, has served as the environmental consultant to the Trust for Public Land (TPL) since 2002. A Preliminary Endangerment Assessment (PEA) report was prepared by IT Corporation in January 2002 to describe the Cornfield site's environmental conditions. A Final Site Characterization letter report (Shaw, June 2002) was also prepared to further describe the extent of site contamination. These investigations determined that soil at the site contained chemical constituents (heavy metals — arsenic and lead, and total petroleum hydrocarbons [TPH]) that posed a potential human health hazard and risk. Results indicated that localized areas within the site contained arsenic and lead at concentrations exceeding the DTSC screening concentrations for arsenic [10 milligrams per kilogram (mg/kg) and lead (255 mg/kg). Two areas also contained total petroleum hydrocarbons (TPH) at concentrations exceeding a commonly used screening concentration of 1,000 mg/kg. A Removal Action Work Plan (RAW) was subsequently prepared and approved by the DTSC on the basis of which remedial action was undertaken at the site. The February 2003 report by Shaw describes the remedial action taken at that time.
The removal action reported by Shaw and completed in late 2002 consisted of the excavation of impacted soil from site areas identified in the RAW. The planned boundaries and depths of the identified excavation areas were used as a basis for defining the field action. It was discovered that in some areas Metropolitan Transportation Authority has already removed soil during their use of the site as a Gold Line construction staging area. In other areas, over-excavation was necessary to achieve the remediation goals. A total of 5,238 tons of impacted soil was removed during remediation and disposed off-site. The following are the main features of the remediation as reported by Shaw (2003):
Thirteen locations were over-excavated in order to meet clean up objectives;
Seven locations contained brick foundation and railroad artifacts that obstructed complete excavation. Excavation activities at these locations were continued to remove as much of the impacted soil as possible without risking damage to the buried feature. The volume of impacted soil that was left in-place at these locations is not estimated or reported by Shaw.
At two locations (Locations G-66 and G-111) excavations were incomplete because of the presence of fiber optic cables at these locations. The volume of impacted soil that was left in-place at these locations is not estimated or reported by Shaw.
Environmental Conditions Review March 28, 2011 Los Angeles State Historic Park, Los Angeles, California Page 4 State of California Department of Parks and Recreation Group Delta Project No. L-938
N:\Projects\_LA\L900\L-938 LA State Historic Park\Environmental Reports\OP Summary Letter rev1.doc
Archeological findings in a number of excavation areas delayed scheduled completion time due to the time required by archeologist to document uncovered features. Archeological findings are separately reported and were not available for this review.
At two locations (Locations G-50 and G-99) no excavation was made because it was determined that during the construction of the MTA Gold Line contaminated soil at these locations was already removed. Confirmation samples taken in these areas verified that the RAW clean up goals were met.
It is assumed that the DTSC approved the remedial action undertaken at the site and reported in the Shaw (2003) report. Such approval letter was not part of the reporting or available for review.
Additional Site Investigation Summary and Groundwater Monitoring Report (ERM-West, 2006)
ERM-West is groundwater consultant to UPRC and this report is part of on-going groundwater monitoring that is being conducted at the site. At least 10 of the monitoring wells that are being periodically sampled are located on the site. This report also discusses the results of an investigation around well BMW-4 consisting of groundwater sampling at seven locations to study the nature of groundwater impact in that area.
Groundwater is typically reported at a depth of between 30 and 35 feet below adjacent ground surface at the site. Groundwater beneath the Site is reported to flow toward the southwest at a general flow gradient of approximately 0.0017 feet per foot.
Groundwater samples are analyzed for VOCs using EPA Test Method 8260 and total fuel hydrocarbons using EPA Test Method 8015M. High concentrations of BTEX – gasoline based contaminants are reported in the groundwater. Also, 1,2-dichloroethane, a volatile compound is reported in excess of its Maximum Contamination Level (MCL). It is reported that the observed gasoline impacts to groundwater have been defined and are confined to a limited, interior portion of the Site. This conclusion is based on non-detectable constituent concentrations in three down-gradient wells. The report does not contain sufficient information to independently interpret this conclusion. The well where the maximum concentrations have been reported was abandoned and re-installed.
Environmental Conditions Review March 28, 2011 Los Angeles State Historic Park, Los Angeles, California Page 5 State of California Department of Parks and Recreation Group Delta Project No. L-938
N:\Projects\_LA\L900\L-938 LA State Historic Park\Environmental Reports\OP Summary Letter rev1.doc
Almost 5 years have elapsed since the report that was reviewed. Current reporting covering the period since 2006 is needed for further assessment and evaluation.
OBSERVATION AND RECOMMENDATIONS
Based on GDC review of the reports, our general interpretation of the reported conditions, and our experience working in the downtown Los Angeles area, we are able to make the following observations and recommendations. These are made assuming that there will be limited near-surface earthwork during construction of the proposed improvements at the park. It is our understanding that buildings to be constructed are light single-story construction and that earthwork is likely limited to shallow excavation and backfill for foundations, pavements, hardscape, and utility construction.
1. The investigation and remedial action described used an approach where the locations of the impacted soil were identified on the basis of sampling and pot-hole excavations in these areas were deemed sufficient removal. Because of the inherent uncertainties in the sampling and the unknowns regarding past operational use, it is possible that additional soil with metals and TPH-impact are present at the site. Although there is no requirement to look for these materials, if such materials are identified either by visual or olfactory clues during construction, the soil will need to be stockpiled, sampled and properly managed on the basis of sampling results. The same approach is recommended for any soil that is excavated to be surplus at the site and requires off-site disposal.
2. The high BTEX concentrations in the groundwater lead to a concern regarding presence of volatiles in the soil vapor. The reports indicate that a vapor recovery system was operated at the site. It is not know whether this remediated conditions to the point that further action is not necessary and there is no concern for protection of from these volatiles making their way into the building areas or enclosed spaces at the park. Further investigation may be necessary to evaluate exposure risk from these chemicals to indoor air. If preventative measures are being taken for methane mitigation, such measures may also mitigate VOC exposure risk. It is recommended that either this risk be independently assessed or be assessed concurrent with assessment for methane risk.
3. Contaminants reported in the groundwater are not a direct concern to surface use of the site. To the extent that there is unknown fuel contamination source in the soil contributing to groundwater contamination

Environmental Conditions Review March 28, 2011 Los Angeles State Historic Park, Los Angeles, California Page 6 State of California Department of Parks and Recreation Group Delta Project No. L-938
N:\Projects\_LA\L900\L-938 LA State Historic Park\Environmental Reports\OP Summary Letter rev1.doc
or the existing groundwater contamination is off-gassing to the soil vapor, it will need to be assessed as part of item 2 above.
We hope this review meets project needs at this time. Please contact us at 949.450.2100 at your convenience if there are questions regarding this letter.
REFERENCES
Burns & McDonnell. 2000, Site-wide Investigation Report for the Former UPRR Cornfield Yard, 1245 N. Spring Street, Los Angeles, California (not reviewed).
ERM-West, Inc. 2006, Additional Site Investigation Summary and Groundwater Monitoring Report, Former Cornfield Yard, 1245 N. Spring Street, Los Angeles, California
Shaw Environmental, Inc., 2002, Final Site Characterization Sampling Results for the 32-Acre Parcel of the Former Cornfield Rail Yard, Los Angeles, California, June 17(not reviewed).
Shaw Environmental, Inc., 2002, Final Removal Action Workplan for the 32-Acre Parcel of the Former Cornfield Rail Yard, Los Angeles, California, November 2002 (not reviewed).
Shaw Environmental, Inc., 2003, Removal Action Completion Report, 32-acre parcel of the former Cornfield Rail Yard, 1245 Spring Street, Los Angeles, California.
We appreciate your selection of Group Delta Consultants, Inc. for this project and look forward to assisting you further on this and other projects. If you have any questions, please do not hesitate to contact us.
Sincerely, GROUP DELTA CONSULTANTS, INC.
Curt Scheyhing, P.E., G.E. Opjit S. Ghuman, P.E. Senior Engineer Associate

APPENDIX E LADBS CERTIFICATE OF COMPLIANCE FOR METHANE TEST DATA

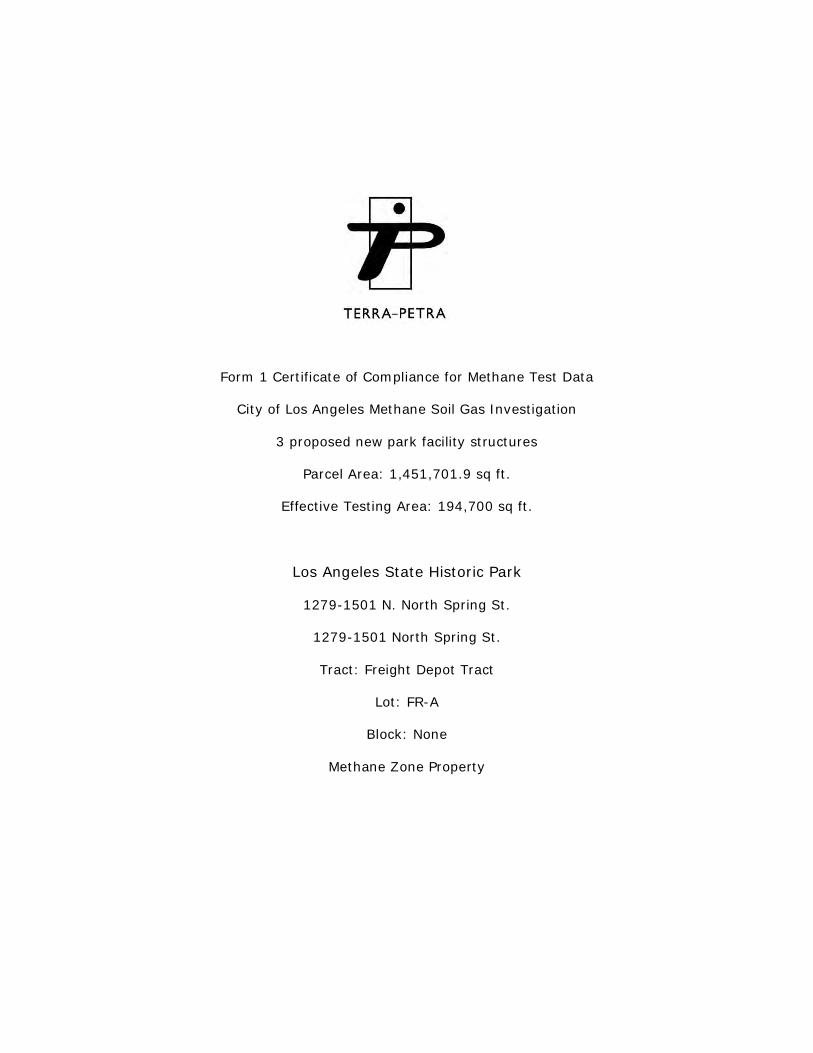
Form 1 Certificate of Compliance for Methane Test Data
City of Los Angeles Methane Soil Gas Investigation
3 proposed new park facility structures
Parcel Area: 1,451,701.9 sq ft.
Effective Testing Area: 194,700 sq ft.
Los Angeles State Historic Park
1279-1501 N. North Spring St.
1279-1501 North Spring St.
Tract: Freight Depot Tract
Lot: FR-A
Block: None
Methane Zone Property