appendix f – kipda traffic forecast with updated …transportation.ky.gov/planning/planning...
TRANSCRIPT

Appendix F – KIPDA Traffic Forecast with Updated Numbers for Urban Collector
1
Old Henry Road Extension Traffic Forecast
KYTC ID: 5‐367.00
KIPDA Project ID: 198
General Background
The Kentucky Transportation Cabinet (KYTC) has requested that the Kentuckiana Regional Planning & Development Agency (KIPDA) provide them traffic forecasts in the vicinity of Old Henry Road by utilizing KIPDA’s regional travel demand model. The study area is located in northeastern Jefferson County and southern Oldham County. Shelby County is located a few miles to the east of the immediate study area however Shelby County is not part of the Louisville (KY‐IN) Metropolitan Planning Area and is therefore not a part of the modeling domain of the regional travel demand model.
Project Background
This project, which will widen, extend, and re‐align Old Henry Road from near I‐265 in northeastern Jefferson County to KY 22 in Oldham County (near Crestwood), has been in KIPDA’s Metropolitan Transportation Plan (MTP) since 1999. It is currently scheduled to be open to the public in 2020. The project as is currently shown in the MTP is scheduled to have five lanes (two lanes in each direction with a median and/or center left‐turn lane). A breakout project was provided to KIPDA in December 2010 by KYTC that would significantly modify the project as is currently described in the MTP. The details of the new breakout project are as follows:
o The eastern (or northern) terminus of the breakout project is KY 362 (Ash Avenue) in southern Oldham County.
o The number of lanes has been reduced from 5 to 3 (one lane in each direction, with a continuous center left‐turn lane)
o The Open to Public date for the breakout project is 2014.
This new breakout project is part of an ongoing (at the date of this writing) amendment of KIPDA’s Horizon 2030 MTP and the Transportation Improvement Program (TIP). This amendment was presented to KIPDA’s Transportation Policy Committee (TPC) on April 28, 2011 for their approval, and subsequently has been presented to the federal planning partners for their review and approval, for which they have 60 days to do so.
All model analyses include the project as it is described in its new description above.
Description of Study Area
The immediate study area analyzed for this traffic forecast is approximately 21 square miles. It includes seven Traffic Analysis Zones (TAZ’s) in the KIPDA model surrounding the existing and proposed Old Henry Road corridor. TAZ’s are small geographical areas used for analyses in the model that are accumulations of Census blocks. The study area includes portions of both Jefferson and Oldham

2
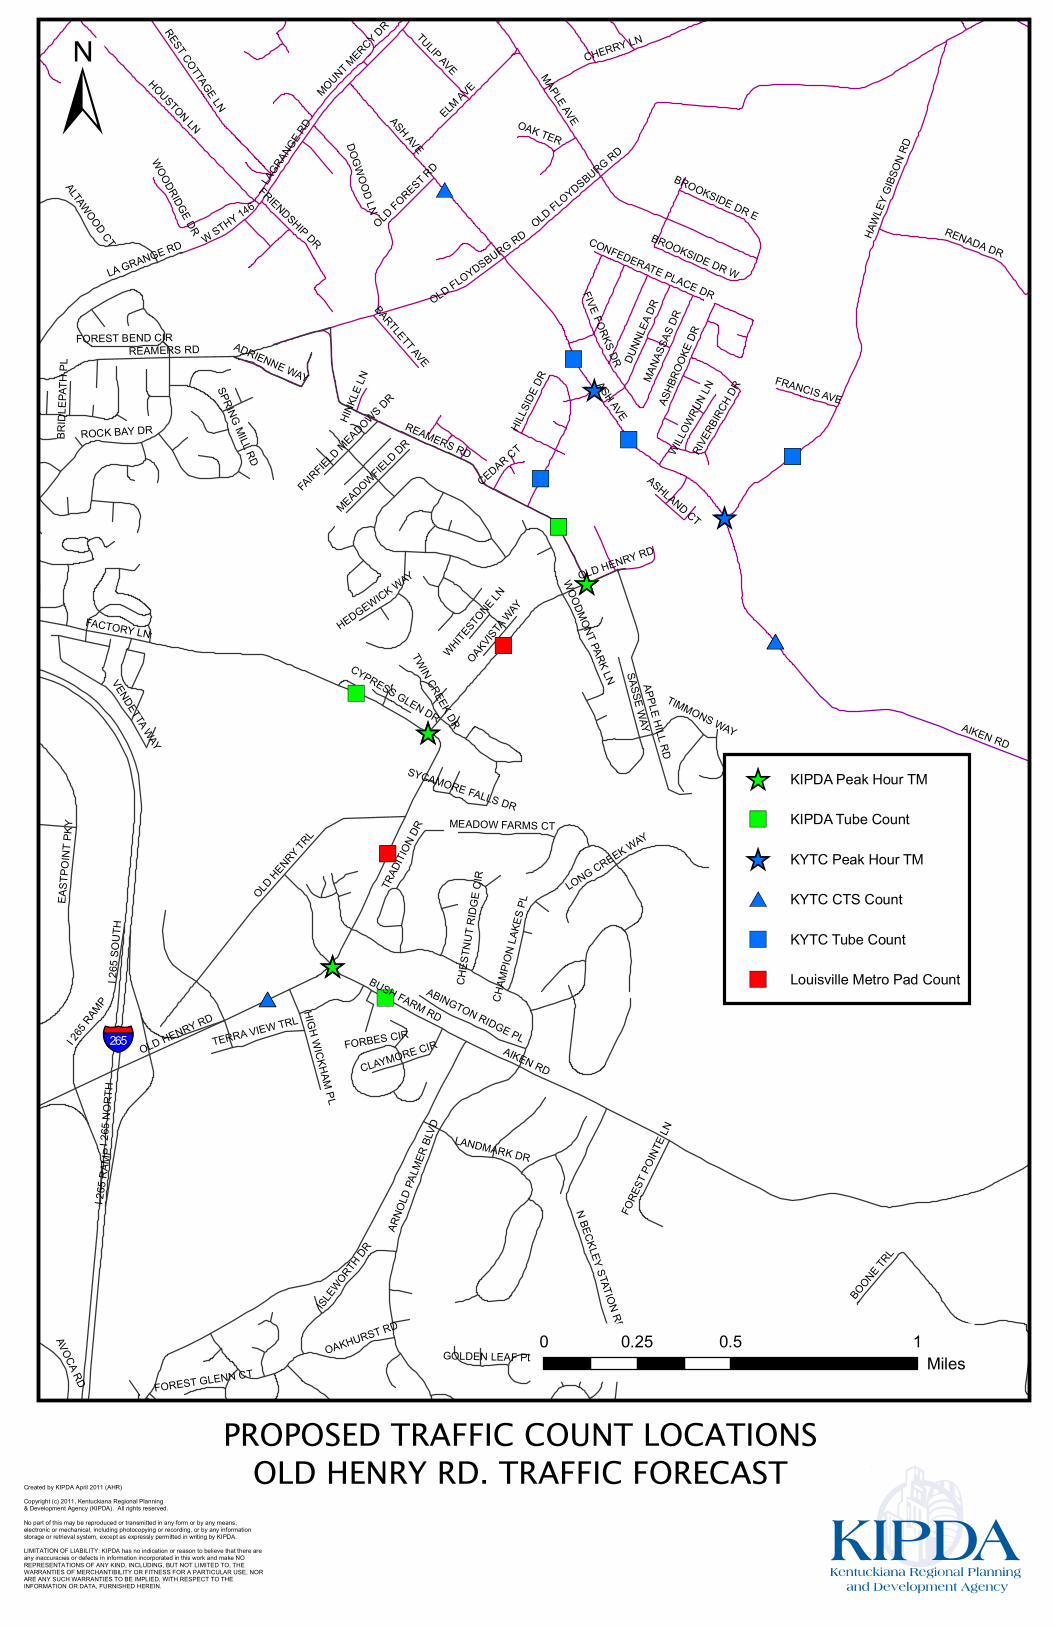
Counties. In Jefferson County, the study area includes 5.85 sq. mi., which includes the portion of northeastern Jefferson County that is northeast of I‐265 (Gene Snyder Freeway) between KY 146 and Floyds Fork. In Oldham County the immediate study area is 15.36 sq. mi. and includes the portion of the county between the Shelby County border and KY 146 (west of Crestwood) and KY 22 (east of Crestwood). The study area is on the eastern boundary of the Louisville (KY‐IN) Metropolitan Planning Area and therefore it is also on the eastern limit of the KIPDA modeling domain. Additional traffic forecasts are provided for interstates and other major roadways in this portion of the region that are near the study area. However, detailed socioeconomic analysis and traffic counting were only performed in the immediate study area as described above. A map showing the location of the traffic count locations can be found at the end of this document. A map showing the location of the TAZ’s within the study area (outlined in green) is provided in the screenshot below:
Population Growth
Oldham County and eastern portions of Jefferson County have experienced significant population growth over the last few decades. Oldham County has almost doubled in population over the last 20 years. Jefferson County has grown at a much slower rate, yet the county has still added over 75,000 residents over the same time period. Countywide population totals are shown in the table below:

3
Year Oldham Co. Jefferson Co. 1990 33,263 664,937 2000 46,178 693,604 2010 60,316 741,096
2020 est. 73,755 744,311 2030 est. 89,470 771,658 2040 est. 103,931 792,179 2050 est. 117,956 808,880
Sources: Census Data & Kentucky State Data Center Estimates
The growth experienced in the study area is no exception to the countywide numbers. From 2010 to 2030, the population in the study area is expected to approximately double. Just within the past several years, the area near the I‐265/Old Henry Road Interchange has undergone significant development, which includes outpatient medical facilities, industrial facilities, office space, and continued residential development. The table below compares 3 estimates of population within the study area by individual TAZ’s. The 2007 and 2030 estimates are the populations used in the model analysis. These estimates are based on population forecasts provided to KIPDA by local agencies in the region, Louisville Metro Planning & Design Services and Oldham County Planning in this case. The recently released 2010 Census population is provided for comparison purposes only. The 2010 Census data will be fully incorporated into the KIPDA model at a later date. One difference between the estimates and the Census data is that the estimates do not include population housed in group quarters (prisons, nursing homes, dormitories, etc.). This difference is not expected to be significant within the established study area.
TAZ
2007 Base Model
Population 2010 Census Population
2030 Forecasted Population
2010 ‐ 2030 Total
Population Growth
2010 ‐ 2030 Annual
Population Growth Rate
Jefferson 523 2,704 2,456 6,839 178.5% 5.3% 525 4,037 7,144 11,966 67.5% 2.6%
Oldham 599 1,221 593 1,588 167.8% 5.0% 602 1,106 1,372 1,163 ‐15.2% ‐0.8% 603 1,720 1,278 1,531 19.8% 0.9% 606 490 426 1,501 252.3% 6.5% 637 3,437 5,017 4,113 ‐18.0% ‐1.0% Total
Sub‐Area 14,715 18,286 28,701 57.0% 2.3%
Sources: PL 94‐171 Data from the 2010 Census. 2007 & 2030 Estimates/Forecasts from Louisville Metro and Oldham County.
Note: 2010 Population includes group quarters. 2007 & 2030 Estimates/Forecasts do not include group quarters.

4
Employment Growth Similar to the growth that is forecasted in population, this study area is expected to experience significant employment growth over the next 20 years. The table below shows estimated place‐of‐work employment estimates from the 2007 base model as well as the 2030 model. This is place‐of‐work employment, meaning that this represents the number of workers that work in the TAZ, not the number of workers that live in the TAZ. Even though total employment is forecasted to grow by a greater percentage over a similar time period, the growth in employment is not nearly as great in absolute numbers (approximately 10,000 new residents vs. 2,700 new employees). These growth estimates show that this study area will likely remain primarily a residential area into the future.
TAZ 2007 Model Employment
2030 Forecasted Employment
2007 ‐ 2030 Total
Employment Growth
2007 ‐ 2030 Annual
Employment Growth Rate
Jefferson 523 262 480 83.2% 2.7% 525 413 529 28.1% 1.1%
Oldham 599 587 562 ‐4.3% ‐0.2% 602 395 848 114.7% 3.4% 603 196 473 141.3% 3.9% 606 646 2,379 268.3% 5.8% 637 270 232 ‐14.1% ‐0.7%
Total Sub‐Area 2,769 5,503 98.7% 3.5%
Existing Roadway Descriptions
Old Henry Road Old Henry Road is located at approximately the center of the study area. It runs from the southwest to the northeast, roughly parallel to the KY 146, KY 22, and Interstate 71 corridors. It currently connects northeastern Jefferson County to southern Oldham County, near the border of Shelby County. An interchange at I‐265 (Gene Snyder Freeway) has been opened over the last decade, spurring additional development near the interchange. The development in the immediate vicinity of the interchange has been primarily commercial and industrial land uses, including new outpatient healthcare facilities. The development that has occurred farther east of the interchange has been exclusively residential.

5
Continued residential development is expected in both Jefferson and Oldham (and Shelby) Counties near this corridor. There are 5 lanes (2 in each direction with a two‐way center turn lane) on Old Henry Road from the vicinity of the I‐265 Interchange to Bush Farm Road. From Bush Farm Road to Reamers Road, there are only 2 lanes. Recent (April 2011) traffic counts are listed below:
Segment AADT Lanes I‐265 to Bush Farm 15,200 5 Bush Farm to Factory 8,100 2 Factory to Reamers 5,700 2
Traffic is heaviest near the I‐265 Interchange, and it decreases until Old Henry Road ends at Reamers Road, near the Jefferson/Oldham Co. line. Existing truck traffic is negligible. KYTC maintains a count station in the CTS Traffic Counts Database between I‐265 and Bush Farm Road. This station was opened after the interchange was opened, so the historical traffic count data only goes back to 2004. From 2004 to 2011, traffic at this count station increased by more than 70%. This data is listed below:
Bush Farm Road Bush Farm Road is a short (less than ½ mile) two lane road that connects Old Henry Road in the west to Aiken Road in the east. A center turn lane has recently been added to Bush Farm Road near Old Henry Road. Several subdivisions are located along Bush Farm Road and there is an elementary school on Aiken Road near the intersection of Bush Farm Road and Aiken Road. A recent (April 2011) traffic count on this road showed an AADT of approximately 8,300 vehicles per day. Bush Farm Road is used primarily as a means to get from the school or these subdivisions to Old Henry Road and its interchange with I‐265. Additional historical traffic counts are not available on this roadway, but it is expected that this roadway has experienced significant growth in traffic as this area has added new residential development and the elementary school. Factory Lane Factory Lane is a two lane road in northeastern Jefferson County that connects Old Henry Road in the east to KY 146 (LaGrange Road) in the west. It is approximately 1.5 miles long. West of KY 146, Factory Lane turns into Chamberlain Lane, which is a 4 lane road that carries
Year AADT 2004 9,050 2005 13,100 2006 13,900 2007 14,800 2010 15,500

6
significant truck traffic since Ford’s Kentucky Truck Plant is located on this road. Factory Lane almost exclusively contains residential development along its entire length. This includes a large apartment complex and an entrance to a large subdivision near KY 146. A recent (April 2011) traffic count taken on Factory Lane near its intersection with Old Henry Road showed an AADT of approximately 3,800 vehicles per day. There are no historical traffic counts that are available to use as a comparison. Reamers Road Reamers Road is a rural two lane road that connects KY 146 at its intersection with KY 1447 (Westport Road) to Old Henry Road at its existing northern terminus. It is approximately 1.9 miles long and runs very close to the Jefferson/Oldham County line. It currently contains residential development over its entire length, but with much less density than the roads described above. A recent (April 2011) traffic count taken on Reamers Road between Old Henry Road and Village Green Boulevard showed an AADT of approximately 2,400 vehicles per day. There are no historical traffic counts that are available to use as a comparison. Village Green Boulevard Village Green Boulevard is a local street through a subdivision in southern Oldham County that connects Reamers Road, near its intersection with Old Henry Road to KY 362 (Ash Avenue). It is less than 0.4 miles long. There are fewer than 100 homes in this subdivision. A recent (April 2011) traffic count taken on Village Green Boulevard near Reamers Road showed an AADT of approximately 1,900 vehicles per day. This road is thought to be used as a shortcut or a cut‐through for drivers going to/from north of KY 362 to access Old Henry Road and its interchange with I‐265. There are no historical traffic counts that are available to use as a comparison. KY 362 (Ash Avenue) Ash Avenue is a rural two lane roadway that connects KY 146 in Pewee Valley to northwestern Shelby County. KY 362 (Central Avenue) continues north of KY 146 to its northern terminus at KY 22. The portion of KY 362 within the immediate study area (KY 146 to Shelby County) is approximately 2.1 miles long. Development along this portion of KY 362 is primarily residential, with the exception of the Kentucky Correctional Institution for Women (KCIW), which is located on KY 362 just east of the Oldham/Shelby County line. KCIW houses almost 700 inmates and employs a staff of more than 200. The ITE Trip Generation Manual does not contain reliable data for trip generation rates for prisons, but it can be expected to contribute significant traffic to the study area’s roadways, particularly around the time of a shift change and during visiting hours. There were 4 recent (April 2011) traffic counts performed along KY 362. This data is listed below:
7
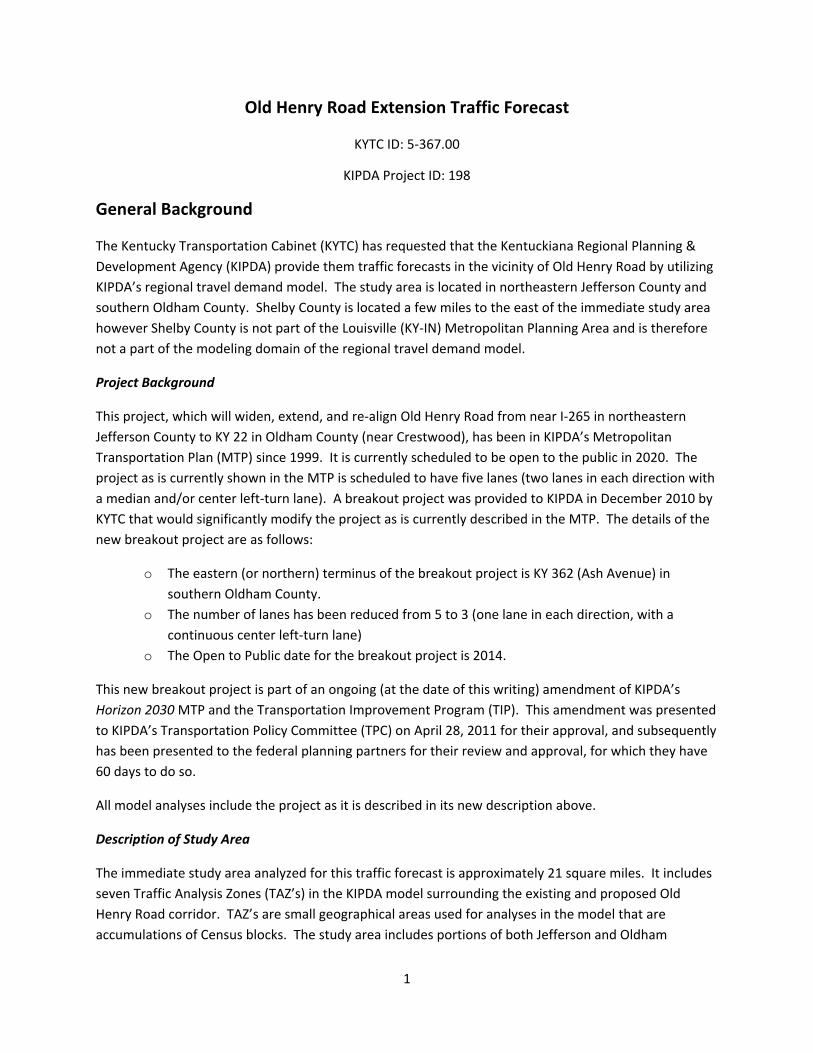
Segment AADT KY 146 to Old Floydsburg 1,500
Old Floydsburg to Village Green 3,300 Village Green to Hawley Gibson 3,600
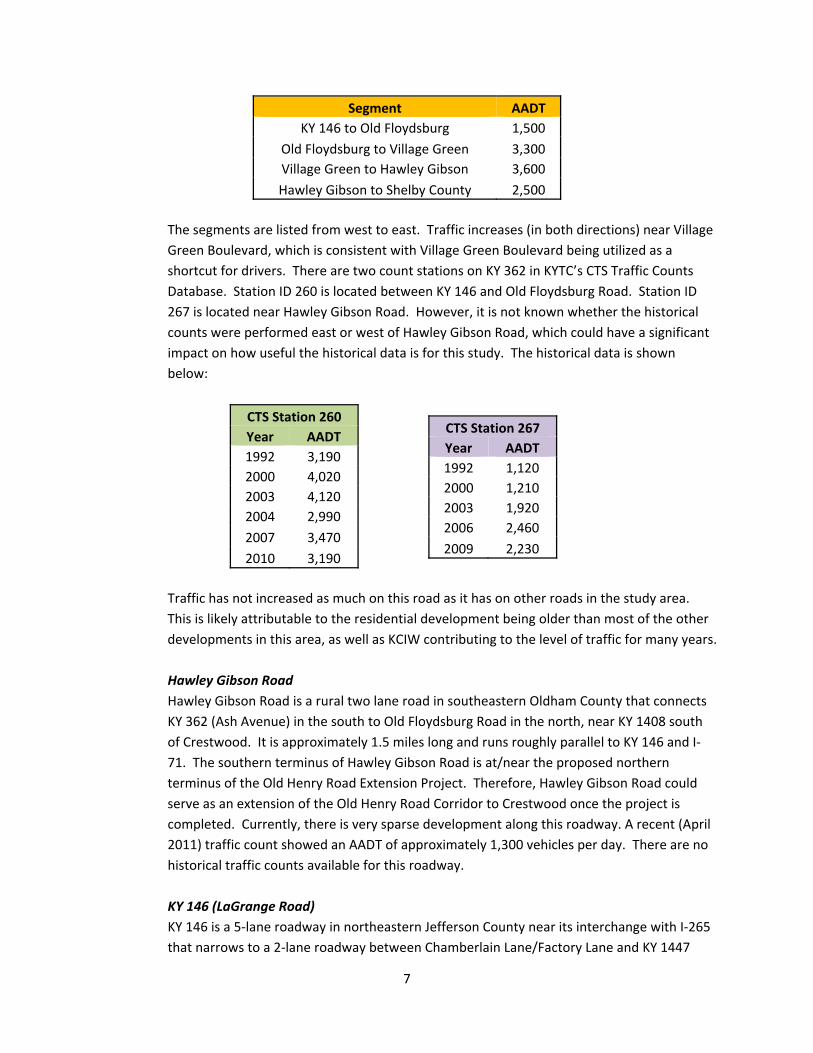
Hawley Gibson to Shelby County 2,500 The segments are listed from west to east. Traffic increases (in both directions) near Village Green Boulevard, which is consistent with Village Green Boulevard being utilized as a shortcut for drivers. There are two count stations on KY 362 in KYTC’s CTS Traffic Counts Database. Station ID 260 is located between KY 146 and Old Floydsburg Road. Station ID 267 is located near Hawley Gibson Road. However, it is not known whether the historical counts were performed east or west of Hawley Gibson Road, which could have a significant impact on how useful the historical data is for this study. The historical data is shown below:
Traffic has not increased as much on this road as it has on other roads in the study area. This is likely attributable to the residential development being older than most of the other developments in this area, as well as KCIW contributing to the level of traffic for many years. Hawley Gibson Road Hawley Gibson Road is a rural two lane road in southeastern Oldham County that connects KY 362 (Ash Avenue) in the south to Old Floydsburg Road in the north, near KY 1408 south of Crestwood. It is approximately 1.5 miles long and runs roughly parallel to KY 146 and I‐71. The southern terminus of Hawley Gibson Road is at/near the proposed northern terminus of the Old Henry Road Extension Project. Therefore, Hawley Gibson Road could serve as an extension of the Old Henry Road Corridor to Crestwood once the project is completed. Currently, there is very sparse development along this roadway. A recent (April 2011) traffic count showed an AADT of approximately 1,300 vehicles per day. There are no historical traffic counts available for this roadway. KY 146 (LaGrange Road) KY 146 is a 5‐lane roadway in northeastern Jefferson County near its interchange with I‐265 that narrows to a 2‐lane roadway between Chamberlain Lane/Factory Lane and KY 1447
CTS Station 267 Year AADT 1992 1,120 2000 1,210 2003 1,920 2006 2,460
2009 2,230
CTS Station 260 Year AADT 1992 3,190 2000 4,020 2003 4,120 2004 2,990
2007 3,470 2010 3,190

8
(Westport Road). It continues as a 2‐lane roadway into Oldham County. It connects the Oldham County communities of Pewee Valley, Crestwood, Buckner, and LaGrange. Current traffic volumes in the study area range from near 18,000 vehicles per day near I‐265 to 12,000 vehicles per day in southern Oldham County. This roadway runs parallel to Old Henry Road, KY 22, and I‐71. CSX operates a railroad line just north of KY 146 throughout the study area. Trains will sometimes block crossings, leading to significant congestion on KY 146 at those times. Historical traffic data is available on KY 146 and it does not indicate a significant increase in traffic on this roadway over the past 10‐15 years, despite the significant residential development along the corridor. KY 22 KY 22 is a roadway that changes from an urban section with up to 7 lanes of traffic near I‐265 to a 2‐lane rural roadway in northeastern Jefferson County and through Oldham County. This corridor has seen significant development over the last 10‐20 years. This includes significant commercial development at the I‐265 interchange in the past decade. Traffic volumes range from over 20,000 vehicles per day near I‐265 to approximately 7,000 vehicles per day near the Jefferson/Oldham County line. Historical traffic counts exist on KY 22, and they approximately doubled around 2000, when much of the development near I‐265 was opened. The more rural portions have not experienced nearly as much of an increase in traffic. Interstate 71 I‐71 is an interstate that begins near downtown Louisville and runs parallel to the Ohio River through Oldham County and eventually to Cincinnati, Columbus, and Cleveland, Ohio. There are 4 lanes on I‐71 (2 in each direction) throughout the KIPDA Region. Traffic volumes range from near 70,000 south of I‐65 to around 50,000 near Crestwood. These current traffic volumes are very high for a 4‐lane interstate. There are only 5 interchanges on I‐71 in the 14 miles between where I‐71 begins and KY 329 near Crestwood, including those at both ends of these limits. Of these 5 interchanges, only Zorn Avenue and KY 329 are interchanges with non‐interstate facilities. This interchange density is extremely low for urban interstates in this region. Interstate 265 I‐265 (Gene Synder Freeway) is a circumferential interstate route that connects I‐65 in southern Jefferson County to I‐71 in northeastern Jefferson County. It is 4 lanes for almost its entire length, including the entirety of the study area. There is another portion of I‐265 in Southern Indiana that will be connected to the Kentucky portion upon completion of the Ohio River Bridges Project. Similar to the other corridors, development along the I‐265 has increased significantly in recent years. Within the study area, traffic volumes on I‐265 range from around 50,000 vehicles per day between KY 146 and KY 1447 to near 75,000 vehicles per day south of I‐71. Historical traffic volumes are available on I‐265, and many of the

9
count stations have indicated that traffic has approximately doubled over the past 15‐20 years (or less).
10
Future Conditions
KIPDA Model
A series of 4 model runs of the KIPDA Regional Travel Demand Model were run for this analysis. These 4 runs were 1) Year 2007, 2) Year 2012, 3) Year 2030 Build, and 4) Year 2030 No‐Build. The 2007 and 2012 model runs were used to create current year traffic estimates for 2011. These current year estimates were used to compare to the recent traffic count data and to adjust future year model estimates, as well as to provide supplemental data for the links where recent traffic counts are not available. The 2030 Build and No‐Build runs were performed to measure the impact of the project on this area’s forecasted traffic. To create the Year 2035 estimates, the growth (or decline) from 2011 to 2030 was extrapolated for 5 additional years.
The KIPDA Regional Travel Demand Model is designed to develop regional estimates of travel within the 5‐county metropolitan planning region. It is not specifically designed to generate project‐level forecasts. Therefore, a significant amount of uncertainty or margin of error can be applied to all of the estimates provided in this report, particularly for the forecasts that are 20+ years in the future. There are 2 fundamental inputs to the model that create much of this uncertainty: 1) the modeled network and 2) the socioeconomic data used in the model. These are described below:
1. Model Network: The modeled network consists of all major roadways (generally collectors and above) in the 5‐county KIPDA Region. The future year model scenarios contain all of the projects in the Horizon 2030 Metropolitan Transportation Plan (MTP) based on the Open to Traffic date of each project provided by the project’s sponsor. The links in the KIPDA model are capacity‐constrained. As a result, increasing traffic volumes will not necessarily correlate with increases in population and employment near a roadway. This process encourages trips in the model to divert to alternate paths until an equilibrium between several paths is reached. Additional links (Reamers Rd., Old Floydsburg Rd., and Hawley Gibson Rd.) were added to the existing KIPDA model for this analysis for connectivity purposes.
2. Socioeconomic Data: Compared to a future year model network, the socioeconomic inputs to the model are a much greater challenge to forecast. KIPDA relies on 2 sources for these inputs to the model. First, the base year estimates of population, households, and employment are based on the most recent Census data. Second, the planning staff from local agencies in the KIPDA Region provide forecasts of population and employment for the horizon year of the MTP. These estimates are revised each time the MTP is updated (at least once every 4 years). At this time, 2010 Census data is not available at a level of geography to use in the model (KIPDA staff expect this data to become available in late 2012‐early 2013). Therefore, the model continues to rely on data from the 2000 Census which likely creates some errors in the more rapidly growing portions of this region, including the study area of this project.

11
External Stations As mentioned throughout this report, this study area is on the eastern edge of the KIPDA modeling domain. The modeling domain includes Jefferson & Oldham Counties, but does not include Shelby County. At the boundaries of the modeling domain, external stations exist where roadways enter or exit the KIDPA Region. There are approximately 50 external stations surrounding the region where external trips are loaded on the network. These trips are representing those trips whose origin is outside of the region. This includes external‐internal trips, as well as through trips which do not stop in the region. To generate future year traffic projections at the external stations, a historical growth rate is used based on historical traffic growth. In this study area, all external stations between Interstate 64 (on the eastern boundary of the modeling domain) to Interstate 71 (on the northeastern boundary) are shown below. These volumes are held constant in all modeled scenarios of the same year. So, there will never be a difference (in the modeled traffic projections) between a Build scenario and a No Build scenario for the same year.
External Station
ID Roadway 2007 Model
2012 Model
2011 Model Estimate
2030 Model
Recent Count
Recent Count Year
853 I‐64 52,042 58,280 57,030 72,195 51,400 2009 854 US 60 8,737 9,512 9,360 11,094 8,900 2008 855 KY 1531 3,266 4,005 3,860 6,667 4,100 2008 856 KY 362 2,340 2,747 2,670 4,211 2,470 2011 857 KY 1408 1,210 1,397 1,360 2,070 1,270 2010 858 KY 1315 810 912 890 1,278 710 2009 859 KY 53 1,766 2,008 1,960 2,877 1,700 2008 860 KY 22 2,475 2,745 2,690 3,719 2,260 2010 861 KY 712 1,758 1,928 1,890 2,274 1,350 2009
862 I‐71 35,949 39,171 38,530 48,168 35,500 2009

12
Future Roadway Descriptions
This report discusses Year 2030 conditions since that is the horizon year of the MTP and in the travel demand model. A yearly (compound) growth rate from 2011‐2030 was developed for each link and applied to the 2030 traffic volumes to extrapolate them to generate the Year 2035 estimates that can be found in the attached table and maps. Please refer to the maps at the end of the report and the table at the end of the section to see all of the forecasted traffic volumes. In addition to the traffic forecasts, the table includes existing and forecasted truck percentages as well as peak hour data. A series of intersection turning movement forecasts are included as well.
Old Henry Road
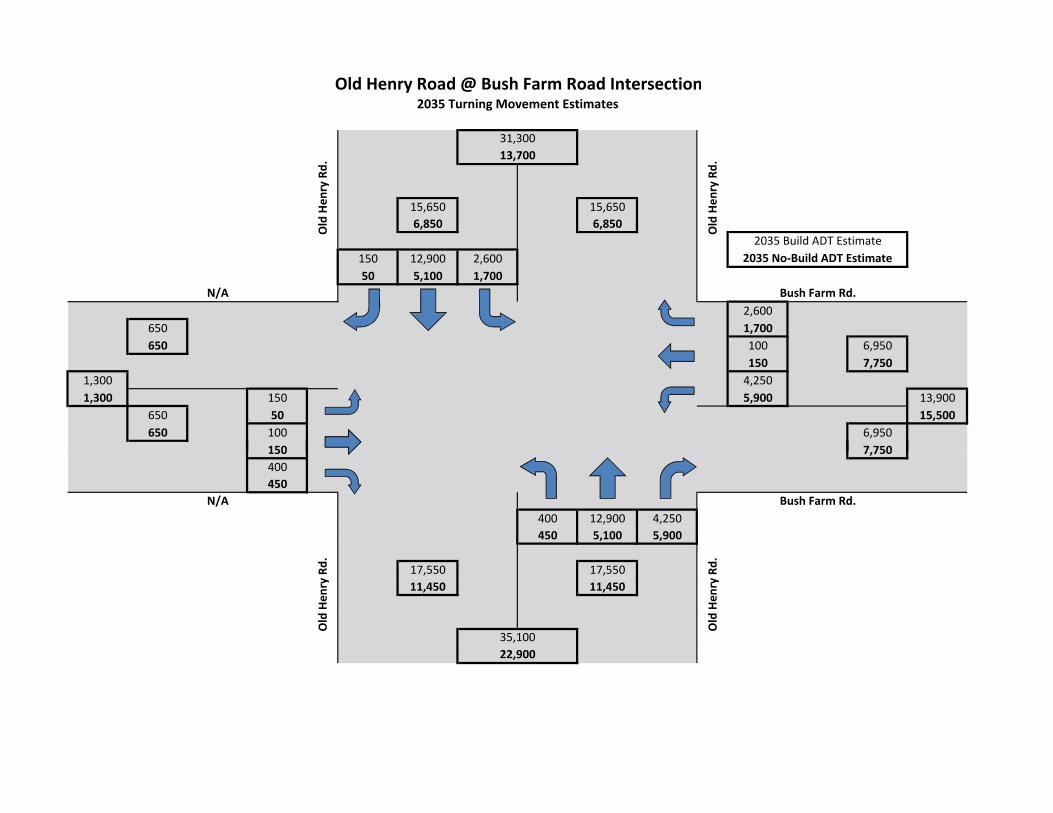
The 2030 Build scenario contains Old Henry Road as a 3 lane roadway from Bush Farm Road to KY 362. It is also slightly realigned near the Old Henry Road/Factory Lane intersection so that the through movement is for traffic that remains on Old Henry Road. No changes are made on Old Henry Road near the I‐265 Interchange.
Forecasted traffic volumes increase significantly for all portions of Old Henry Road in the 2030 Build scenario. Traffic along each section of Old Henry Road increased by approximately 15,000 vehicles per day in this scenario over the 2011 traffic counts. In terms of (compound) percentage growth, the traffic increases by approximately 3.6% per year near I‐265 and by over 7% per year near the county line. While the KIPDA model analysis does not provide specific information as to the origins and destinations of the vehicles that are forecasted to use an extended Old Henry Road, it does appear that much of the additional traffic forecasted to utilize Old Henry Road continues to the northeast along Hawley Gibson Road to Crestwood and points east of Crestwood. The model also shows significant increases in traffic on KY 362 (Ash Avenue) which, with the extension of Old Henry Road, will provide an additional connection between Crestwood and I‐265 beyond what currently exists.
In the 2030 No‐Build scenario, traffic is projected to increase by a much lesser amount. Traffic is forecasted to grow approximately 2% per year near I‐265 and less than 1% per year near the county line. Trips to/from near the I‐265/Old Henry Road Interchange to near Crestwood are forced onto existing roadways in the No‐Build scenario. Many of these roadways (KY 146, I‐71, and KY 22) are at or near capacity in the 2030 runs, which forces diversion of some portion of these trips onto other roadways. This diversion would likely include additional trips utilizing Village Green Boulevard as a cut‐through from KY 362 to Reamers Road and Old Henry Road. The forecasted 2030 traffic volumes are in the table below:

13
Segment
Projected 2030 Build
AADT
Projected 2030 No
Build AADT Lanes I‐265 to Bush Farm 29,500 21,000 5 Bush Farm to Factory 23,600 12,300 3 Factory to Reamers 21,200 6,400 3 Reamers to KY 362 17,000 N/A 3
From the recent classification traffic count, trucks currently constitute approximately 3.6% of the traffic on Old Henry Road east of I‐265. 48‐hour classification counts were not available for the other portions of Old Henry Road, but based on the peak‐hour turning movement counts at its intersections with Factory Lane and Reamers Road, the truck percentages appear to decrease farther from the interchange. With the development near the county line being almost exclusively residential development, a low truck percentage is expected. Future development along this corridor is expected to be primarily residential, which should keep truck percentages down somewhat. The KIPDA model does not explicitly model trucks, so estimates of future year truck traffic are based on roads with similar functional classification around the state. Using this methodology, the assumed truck percentage growth rate for Urban Minor Arterials and Urban Collectors is estimated at 2.5% per year. This results in a forecasted 2030 truck percentage on Old Henry Road of approximately 3‐6%.
Bush Farm Road
Due to the location of the intersection of Old Henry Road and Bush Farm Road, the model shows that increases in traffic on Bush Farm Road in future year scenarios are independent of Old Henry Road being extended. Old Henry Road is not planned to be widened between Bush Farm Road and I‐265 in any scenario. Both the 2030 Build and No‐Build analyses show approximately a 50% increase in traffic on Bush Farm Road over current levels. The No‐Build scenario forecasts traffic to be slightly higher since less traffic will be on Old Henry Road in this scenario, making it a much less congested route to get to/from I‐265.
Current Truck traffic is estimated at approximately 4.6% of total traffic. Bush Farm Road is an Urban Local road, so there are no standard adjustment factors to apply to the current truck percentage. Assuming a 2.5% per year growth rate (the rate for Urban Collectors), 2030 truck traffic is estimated to be approximately 7% on Bush Farm Road.

14
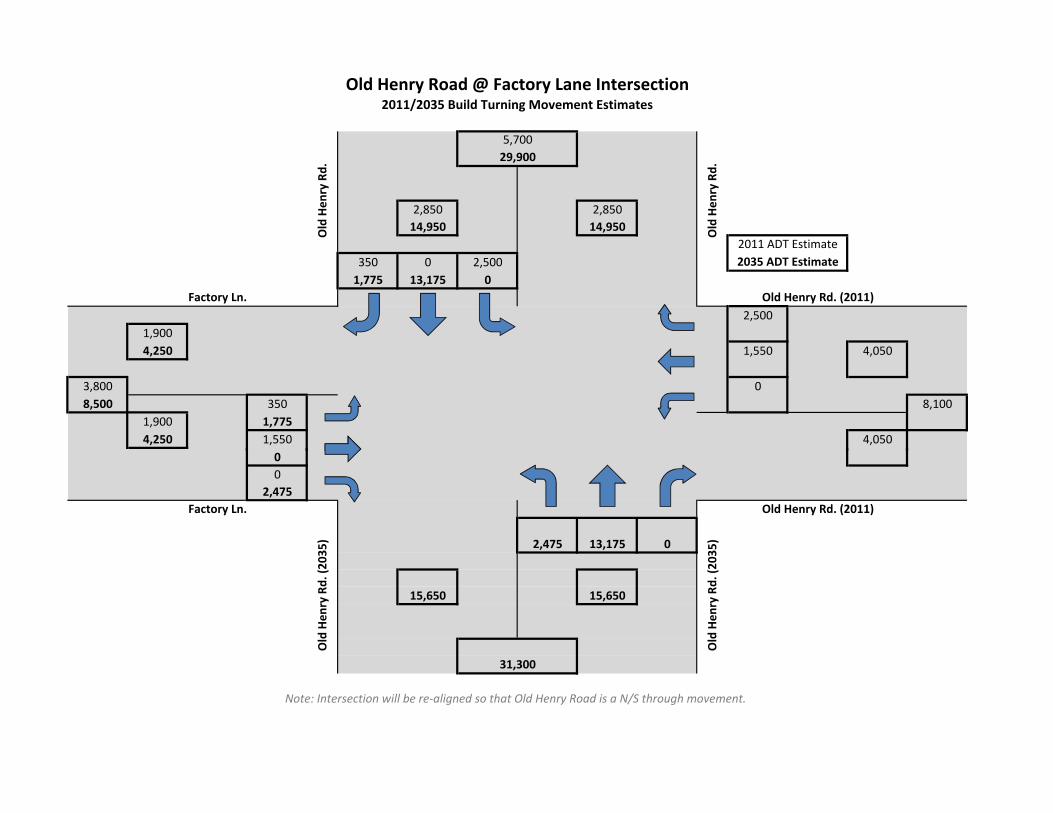
Factory Lane
Similar to Bush Farm Road, the model shows only a slight difference between 2030 Build and No‐Build scenarios. Each 2030 scenario projects traffic will approximately double (100% increase) on Factory Lane. Since Old Henry Road will only be slightly modified (two‐way center turn lane and minor realignment) between Factory Lane and I‐265, only a minor impact in traffic should be expected.
Factory Lane had the greatest percentage of truck traffic of any of the classification counts performed for this analysis. The current truck percentage on Factory Lane is approximately 6.8% of total traffic. This is likely due to the development along Factory Lane not being exclusively residential as it is with many of the roadways being analyzed in this study. Ford Motor Company’s Kentucky Truck Plant is a major freight generator that is located on Chamberlain Lane just across KY 146 from Factory Lane. Utilizing KYTC’s 2.5% per year growth rate for Urban Collectors, 2030 truck traffic is estimated to be approximately 11%.
Reamers Road
Unlike Bush Farm Road and Factory Lane, the model shows a major difference in traffic on Reamers Road between the 2030 Build and No‐Build scenarios. In the Build scenario, the portion of the traffic that would use Reamers Road to get to/from Village Green Boulevard from/to Old Henry Road would no longer use this road. This traffic would now get to KY 362 directly via Old Henry Road. In the No‐Build scenario, traffic is estimated to increase by approximately 50% over current levels.
Truck traffic is currently very low on Reamers Road (approximately 2%). Using KYTC’s standard growth rate for truck percentages on Urban Collectors of 2.5%, the percentage of trucks in 2030 is estimated to be less than 4% of total traffic.
Village Green Boulevard
Similar to Reamers Road, projected 2030 traffic volumes on Village Green Boulevard vary greatly in the Build and No‐Build scenarios. In the 2030 No‐Build scenario, traffic is forecasted to approximately double as compared to the recent traffic count. This road would likely remain a shortcut from KY 362 to Old Henry and only get worse as development continues in this portion of the region. This amount of traffic on a local neighborhood street is far from ideal and other solutions to limiting the amount of cut‐through traffic would likely be pursued.
In the 2030 Build scenario, the model shows traffic decreasing by nearly half of the existing traffic. Traffic that may use Village Green Boulevard in the No‐Build scenario would shift over to the new parallel route that the Old Henry Extension would provide.

15
Current year classification data from the recent count is not available. However, truck traffic on Village Green Boulevard will be no more than the truck traffic along Reamers Road or KY 362. Using a similar growth rate that was used for those roads, the 2030 truck percentage is likely to be less than 4%. In the Build scenario, it is likely to be much less since only local delivery and service vehicles would need to use this roadway while the larger vehicles would use Old Henry Road.
KY 362 (Ash Avenue)
Traffic volumes on KY 362 are also projected to be strongly impacted by the addition of the Old Henry Extension Project. In the Build scenario, Old Henry Road provides a more viable alternative path for drivers to get between the Crestwood and I‐265. Forecasted 2030 traffic volumes are forecasted to triple on KY 362 near Village Green Boulevard. The forecasted traffic volumes east of Hawley Gibson Road are not impacted by the project in the model analysis since it is on the edge of the KIPDA modeling domain and are controlled by the external station volume in the model. Traffic growth along this portion of KY 362 will depend heavily on the amount of future development in Shelby County and at the Kentucky Correctional Institute for Women.
The No‐Build scenario shows much more modest traffic growth than the Build scenario does. Forecasted traffic levels are well below the capacity of this roadway and are forecasted to grow by only 0‐3% per year. The heaviest traffic is expected between Village Green Boulevard and Hawley Gibson Road as it exists today.
Current truck percentages on KY 362 are between 4‐5%. By applying the standard (KYTC) truck percentage growth rate for urban collectors of 2.5% per year, 2030 truck traffic would grow to approximately 7%. Similar to the overall 2030 traffic levels, this amount of truck traffic depends on the type of development that occurs in this area. If the future development is primarily residential, the truck percentage is likely to remain near the existing 4‐5% level.
Hawley Gibson Road
Hawley Gibson Road currently carries the least amount of traffic in the study area that traffic count data was collected for. The current ADT of less than 1,300 vpd reflects the rural character of this roadway and of the development near it. In the 2030 Build scenario, traffic is forecasted to more than triple with the Old Henry Extension Project in place. With the removal of the portion of the Old Henry Extension project from KY 362 to Crestwood, Hawley Gibson Road could essentially serve as a continuation of the Old Henry corridor. Should additional development occur along the Old Henry/Hawley Gibson corridor beyond what is currently expected, the forecasted traffic levels could increase significantly. Similarly, if Hawley Gibson

16
Road is upgraded to a roadway similar to the proposed Old Henry Extension (3 lanes, reduced curvature, reduced grade), additional development could follow, leading to even more traffic.
The No‐Build scenario shows only modest growth on Hawley Gibson Road in 2030. It remains an option to get between I‐265 and Crestwood, but not a truly viable one until either the corridor is upgraded or the congestion on the parallel routes gets significantly worse.
Truck traffic is minimal now and is not expected to grow beyond 5% even after applying the KYTC standard growth rate for rural collector of 2.0% per year. Only significant changes in development patterns or upgrading Hawley Gibson (i.e. widening, less curvature, less grade) would have a major impact on the amount of truck traffic.
KY 146
KY 146 is the parallel route is closest proximity to the proposed Old Henry Road Extension. It directly connects Crestwood to I‐265. It is likely to remain the primary route for those trips from Crestwood to eastern and southern Jefferson County via I‐265 until capacity on this roadway(s) is exceeded. There are capacity adding projects on KY 146 included in the 2030 model scenarios. This includes a widening project on KY 146 from Factory Lane to KY 1447 (Westport Road) / Reamers Road to 5 lanes. Similarly, there is a series of widening projects on KY 146 in Crestwood. Additional capacity adding projects will likely be limited due to the road’s proximity to the CSX railroad line, among other reasons. Even with the capacity adding projects on KY 146 and Old Henry Road included in the analysis, both 2030 model scenarios show traffic levels on KY 146 that exceed the roadway’s capacity.
In the 2030 Build scenario, traffic is forecasted to more than double over the next 20 years near I‐265. This is the portion where capacity will be added by the KYTC project mentioned above (currently scheduled to be open to traffic in 2015 in the KIPDA MTP). The portions of KY 146 in the study area in Oldham County are expected to see little traffic growth by 2030. The model shows traffic growth of less than 1.0% per year. This is an example of the capacity constraint in the model. With the amount of development in the model and the amount of traffic on other portions of KY 146, the forecasted traffic volume is being constrained as trips that would use KY 146 are shifted to other routes.
The 2030 No‐Build scenario shows that traffic on KY 146 would be impacted by the Old Henry Road Extension project. For the portion of KY 146 that parallels Old Henry Road, 2030 traffic is forecasted to be approximately 5‐10% greater in the No‐Build scenario as compared to the Build scenario.
Current truck percentages on KY 146 are in the range of 3‐6%. Assuming a consistent truck percentage throughout this corridor within the study area and the standard KYTC 2.5% per year

17
growth rate for urban minor arterials, trucks can be expected to constitute approximately 5‐9% of the total traffic mix in 2030.
KY 22
Similar to KY 146, KY 22 provides another parallel route to the proposed Old Henry Road Extension from I‐265 to the Crestwood area. Also similar to KY 146, KY 22 currently experiences very high traffic volumes near I‐265 as compared to the traffic volumes on this road in Oldham County, at least partly due to recent development that has occurred near I‐265. There are several KY 22 improvement projects currently listed in the MTP. These include projects that would involve widening KY 22 to (at least) 5 lanes from I‐265 to KY 329 in Crestwood. Other projects would widen KY 22 in Crestwood and east of Crestwood as well. All of these projects are included in both 2030 model scenarios, which provide substantial added capacity beyond what presently exists. Any changes (including delays or reduction in the number of lanes) to the projects would likely have a significant impact to all of the forecasts provided in this report.
In both 2030 scenarios, traffic on all sections of KY 22 is consistent over the entire route within the study area, which is unlike the current traffic counts which are much less in what are currently rural portions of Oldham County. Both scenarios show traffic increasing by nearly 8% year between now and 2030 on the Oldham County portions of KY 22. KY 22 is one corridor that the model over‐assigns traffic in the current scenario, meaning that it overestimates traffic when compared to the traffic counts. Once the future scenario forecasts are adjusted to account for this, the adjusted traffic volumes are still at or near the capacity of this roadway. The No‐Build scenario is forecasted to carry more than traffic than the Build scenario over all sections of KY 22. The amount of additional traffic carried by KY 22 in the No‐Build scenario versus the Build scenario is actually greater than the difference on KY 146. This would indicate that KY 22 is as much of a viable alternative route (especially considering capacity constraint) to the Old Henry Extension as KY 146 is. The model appears to indicate that KY 22 will carry a significant portion of the traffic that diverts from the other capacity constrained roadways in the area (primarily I‐71 and KY 146) once capacity is added to it.
Trucks do not currently constitute a large percentage of traffic on the KY 22 corridor. Current truck percentages range from 2‐5%, with the higher truck percentages in the more heavily developed portion of the corridor in Jefferson County. Applying a 2.5% per year growth rate to these percentages equals a truck percentage of approximately 4% in Oldham County and near 8% near I‐265.
18
Interstate 71
I‐71 is another route that the model shows additional traffic on in the 2030 No‐Build scenario as compared to the Build scenario. The percent difference is not as great on I‐71 as KY 146 and KY 22, but the number of vehicles estimated to “shift” to I‐71 is similar to the amount that shifts to KY 22 and would shift to KY 146 if it had additional capacity available. Growth on I‐71 is limited between the current traffic levels and either 2030 scenarios. Less than 1% per year growth is forecasted on all sections of I‐71 near the study area. This is due to I‐71 being near the capacity for a 4‐lane interstate in the model, which limits the amount of additional traffic assigned to it in the model. If a widening project was included in the MTP for this portion of I‐71 (as there once was) and therefore included in the model, the forecasted traffic volumes over the entire study area would likely be very different. The significant capacity adding projects on KY 22 should also contribute to this slow growth in traffic on I‐71
Truck traffic is a major issue on I‐71. Currently, trucks constitute between 12‐18% of the total traffic on I‐71 in this area. I‐71 is the only viable option for intercity trips between Louisville and Cincinnati (and points beyond each). Therefore, the truck traffic on all of the other routes is likely to be local traffic. Only in extreme congestion would a long‐haul truck utilize any of the arterial routes in this study area to get through this study area. Applying the 2.5% per year growth rate yields truck percentages in the range of 20‐30%. As residential development expands farther out from downtown Louisville, local commuters will make up a greater amount of the traffic on I‐71 in this area. Therefore, truck percentages are likely to remain around the current percentage on I‐71.
I‐265
The impact of the Old Henry Extension project on I‐265 is seen in the model on the portion of I‐265 between the Old Henry Road Interchange and the I‐71 Interchange. Without the Old Henry Road Extension in place in the 2030 No‐Build scenario, traffic volumes are approximately 5% higher than in the 2030 Build scenario. In each of the 2030 scenarios, it is assumed that I‐265 will be 6 lanes wide as the KYTC’s projects in the MTP indicate.
Currently, trucks make up about 8‐9% of the total traffic on I‐265. By applying the 2.5% per year growth rate for urban interstates, 2030 truck percentages are estimated to be around 13%. Providing added uncertainty to these estimates is the Louisville Southern Indiana Ohio River Bridges Project (LSIORB). Both bridges are included in the 2030 model scenarios, and include tolling. Any changes to this project, including a changed to the assumed tolling rate, will affect all traffic, including truck traffic on I‐265 and throughout this study area.

19
Peak Hour Conditions
The Design Hour Volume (DHV) or K‐Factor was calculated for each of the count stations in the study area. Additional data from KYTC’s Highway Information Systems (HIS) Data was utilized to calculate these volumes and percentages. For the counts that were performed by Louisville Metro, KIPDA, and KYTC District 5 staff, the K‐Factor was calculated by dividing the single highest peak hour (AM or PM) of the entire count (some were 48‐hour counts while others were 7 days) by average weekday (unadjusted) traffic volumes.
K‐Factors were calculated on the other roadways in a similar fashion by dividing the reported peak hour traffic by the reported ADT. Hour by hour data were not available for these routes, but this should yield a similar result for comparison purposes.
The K‐Factors in the immediate study area range from 10‐15%. These are higher than the average roadways around the state, where the average is around 10%. The high K‐Factors in this area are likely attributable to the nature of the development in this area. With this area being almost exclusively developed as a residential area at this time, coupled with the lack of commercial developments in the immediate area, it is logical that a higher percentage of trips are those to/from work or school in the morning or afternoon peak hours. Should the area add additional commercial development, the K‐Factors would likely decrease to a level closer to the statewide average.
On the major roadways where data was analyzed from CTS counts and HIS data, the K‐Factors were lower. They ranged from 8‐9%. The interstates in the area will always carry a larger number of trips in the off‐peak hours due to the nature of the longer distance trips that traditionally utilize interstate facilities. On KY 22 and KY 146, each of these corridors has a good amount of commercial development along them and industrial development nearby, contributing to a lower K‐Factor. These types of development will spread the traffic out more evenly throughout the day than on a corridor that contains almost exclusively residential development.
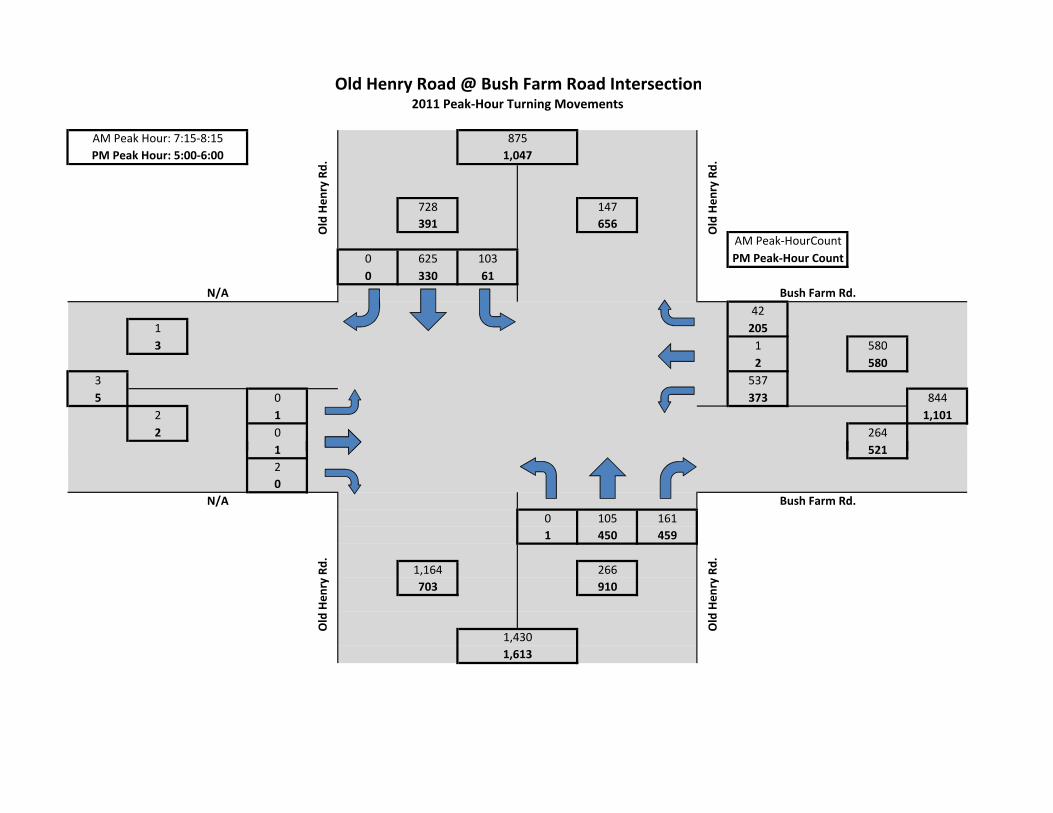
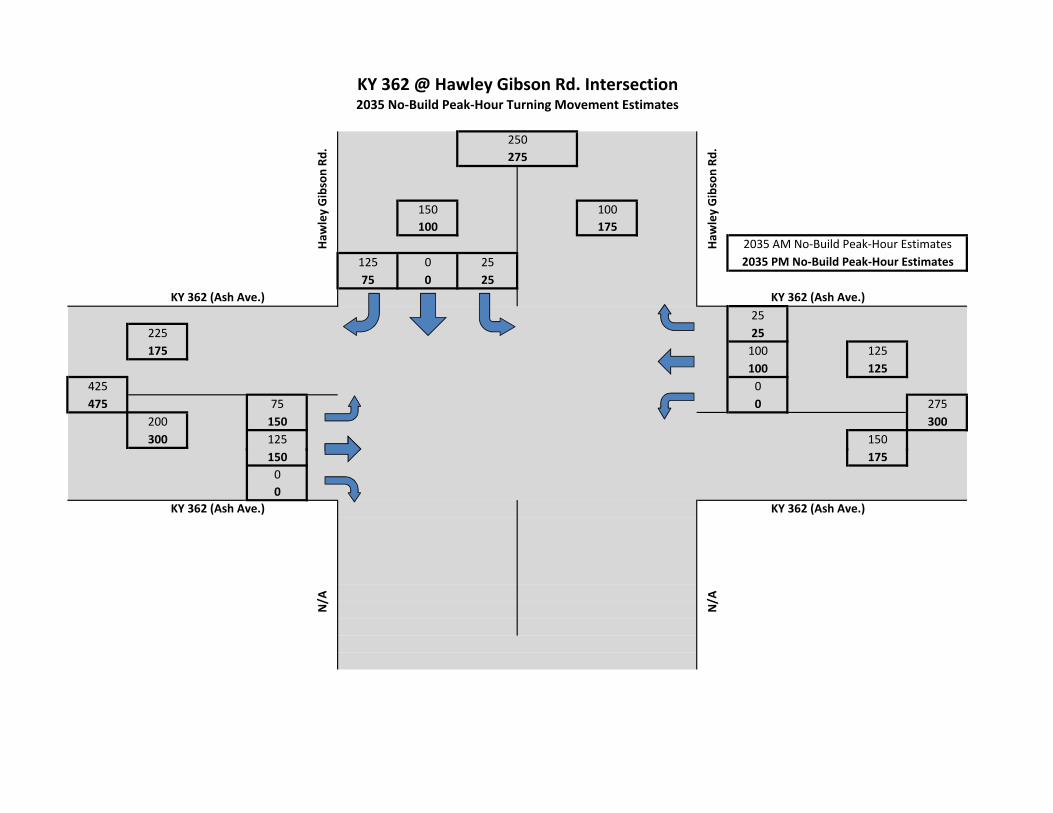
Peak hour turning movement counts and 2035 estimates can be found in the intersection diagrams on the following pages.

Station
Recent
Count 2030 Build
2030
NoBuild2011
Truck %
Truck %
GR
2030
Truck %
Peak
Hour %
2011 -
2035
Build GR
2011 -
2035
NoBuild
GR 2035 Build
2035
NoBuildOld Henry Road (KY 3084)
south of Bush Farm 15,161 29,500 21,000 3.6% 2.5% 5.8% 13.3% 3.6% 1.7% 35,100 22,900Bush Farm to Factory 8,099 23,600 12,300 2.5% 2.5% 4.0% 14.2% 5.8% 2.2% 31,300 13,700Factory to Reamers 5,736 21,200 6,400 2.0% 2.5% 3.2% 15.0% 7.1% 0.6% 29,900 6,600Reamers to KY 362 N/A 17,000 N/A 1.5% 2.5% 2.4% 14.2% 5.5% N/A 22,200 N/A
Bush Farm Road
east of Old Henry 8,317 12,500 13,600 4.6% 2.5% 7.4% 10.9% 2.2% 2.6% 13,900 15,500
Factory Lane
west of Old Henry 3,758 7,200 8,200 6.8% 2.5% 10.9% 10.3% 3.5% 4.2% 8,500 10,100
Reamers Road
west of Old Henry 2,420 1,300 3,800 2.1% 2.5% 3.4% 12.0% -3.2% 2.4% 1,100 4,300
Ash Avenue (KY 362)
KY 146 to Old Floydsburg 1,465 8,000 2,900 4.5% 2.5% 7.2% 10.7% 9.3% 3.7% 12,500 3,500Old Floydsburg to Village Green 3,318 9,400 3,500 4.1% 2.5% 6.6% 10.3% 5.6% 0.3% 12,400 3,500Village Green to Hawley Gibson 3,552 8,200 5,100 4.5% 2.5% 7.2% 10.2% 4.5% 1.9% 10,200 5,600
east of Hawley Gibson 2,465 3,900 3,900 4.3% 2.5% 6.9% 11.0% 2.4% 2.4% 4,400 4,400
Hawley Gibson Road
east of KY 362 1,289 4,300 2,000 2.9% 2.0% 4.2% 12.4% 6.5% 2.3% 5,900 2,200
Village Green Blvd.
north of Reamers 1,937 1,300 3,600 11.9% -2.1% 3.3% 1,200 4,200
KY 146
east of Chamberlain 112 18,100 37,500 39,700 3.5% 2.5% 5.6% 8.1% 3.9% 4.2% 45,400 48,800near Jefferson/Oldham Co. line B01 12,800 13,200 15,400 3.5% 2.5% 5.6% 8.1% 0.2% 1.0% 13,300 16,200
at Pewee Valley/Crestwood line B08 12,700 15,200 13,700 5.6% 2.5% 9.0% 8.1% 1.0% 0.4% 15,900 14,000
KY 22
east of I-265 V28 20,700 36,700 38,300 4.9% 2.5% 7.8% 8.4% 3.1% 3.3% 42,700 45,000east of Jefferson/Oldham Co. line 500 7,000 29,100 34,000 2.5% 2.5% 4.0% 8.4% 7.8% 8.7% 42,300 51,500
near Clore Ln. B23 8,970 37,900 38,600 2.5% 2.5% 4.0% 8.4% 7.9% 8.0% 55,400 56,700
I-71
south of I-265 A07 69,000 70,100 70,500 12.4% 2.5% 19.8% 7.7% 0.1% 0.1% 70,400 70,900north of I-265 A05 56,600 64,500 67,000 18.5% 2.5% 29.6% 7.8% 0.7% 0.9% 66,800 70,000
north of KY 329 311 50,700 56,400 57,900 17.8% 2.5% 28.5% 8.1% 0.6% 0.7% 58,000 60,000
I-265
south of Old Henry B14 56,600 99,700 99,100 8.2% 2.5% 13.1% 8.4% 3.0% 3.0% 115,700 114,800north of Old Henry B39 52,700 91,800 98,200 8.9% 2.5% 14.2% 8.0% 3.0% 3.3% 106,200 115,700south of KY 1447 A76 50,800 95,100 99,600 8.7% 2.5% 13.9% 8.6% 3.4% 3.6% 112,200 118,900
south of KY 22 A13 53,500 95,800 100,500 8.7% 2.5% 13.9% 8.6% 3.1% 3.4% 111,700 118,600south of I-71 A11 74,800 125,200 128,200 8.7% 2.5% 13.9% 9.3% 2.7% 2.9% 143,400 147,700
Note: Cells in red are estimates based on other values
Old Henry Road (KY 3084)/Crestwood Connector Traffic Forecasts
")
")
")
")
")
")")
")
")
#*
#*
#*
#*
#*
")
")
")
")")
")
")
_̂
_̂
_̂
_̂
_̂
")
_̂
_̂
_̂
AIKEN RD
I 265
NOR
THI 2
65 SO
UTH
OLD HENRY RD
REAMERS RD
FACTORY LN
ARNO
LD PA
LMER
BLVD
I 265 R
AMP
EAST
POIN
T PKY
OLD HENRY TRL
BUSH FARM RD
APPLE HILL RD
BOONE TRL
ROCK BAY DR
OAKHURST RD
N BECKLEY STATION RD
LA GRANGE RD
VENDETTA WAY
ALTAWOOD CT
TRAD
ITION
DR
ISLEW
ORTH DR
LANDMARK DR
LONG CREEK WAY
TIMMONS WAY
SASSE WAY
WOODMONT PARK LN
AVOCA RD
CHAM
PION
LAKE
S PL
ABINGTON RIDGE PLTERRA VIEW TRL
HIGH WICKHAM PL
SPRING MILL RD
CLAYMORE CIR
ADRIENNE WAY
MEADOWFIELD DR
MEADOW FARMS CT
HEDGEWICK WAY
FORE
ST PO
INTE L
N
FOREST BEND CIR
TWIN CREEK DR
FORBES CIR
CHES
TNUT
RID
GE C
IROAKVISTA
WAY
GOLDEN LEAF PL
FAIRFIELD MEADOWS DR
SYCAMORE FALLS DR
CYPRESS GLEN DR
FOREST GLENN CT
BRID
LEPA
TH PL
WHITESTO
NE LN
I 265
RAM
P
AIKEN RD
ASH AVE
MAPLE AVE
REAMERS RD
HAWL
EY G
IBSON
RD
OLD FLOYDSBURG RD
HOUSTON LN
ELM AVE
LAGRA
NGE R
D
RENADA DR
MOUNT MERCY DRREST COTTAGE LN
ASHB
ROOK
E DR
DUNN
LEA D
R
FIVE FORKS DR
CHERRY LNTULIP AVE
OLD FOREST RD
MANA
SSAS
DR
FRIENDSHIP DR
DOGWOOD LN
WOODRIDGE DR
W STHY 146
BROOKSIDE DR EBROOKSIDE DR W
RIVER
BIRCH
DR
OLD HENRY RD
FRANCIS AVE
BARTLETT AVE
HILLS
IDE DR
OAK TER
WILLOW
RUN L
N
CEDAR CT
ASHLAND CT
HINKL
E LN
CONFEDERATE PLACE DROLD FLOYDSBURG RD
ASH AVE
Created by KIPDA April 2011 (AHR)Copyright (c) 2011, Kentuckiana Regional Planning & Development Agency (KIPDA). All rights reserved.No part of this may be reproduced or transmitted in any form or by any means,electronic or mechanical, including photocopying or recording, or by any informationstorage or retrieval system, except as expressly permitted in writing by KIPDA.LIMITATION OF LIABILITY: KIPDA has no indication or reason to believe that there areany inaccuracies or defects in information incorporated in this work and make NOREPRESENTATIONS OF ANY KIND, INCLUDING, BUT NOT LIMITED TO, THEWARRANTIES OF MERCHANTIBILITY OR FITNESS FOR A PARTICULAR USE, NORARE ANY SUCH WARRANTIES TO BE IMPLIED, WITH RESPECT TO THEINFORMATION OR DATA, FURNISHED HEREIN.
PROPOSED TRAFFIC COUNT LOCATIONSOLD HENRY RD. TRAFFIC FORECAST
_̂ KIPDA Peak Hour TM
") KIPDA Tube Count
_̂ KYTC Peak Hour TM
#* KYTC CTS Count
") KYTC Tube Count
") Louisville Metro Pad Count
±
0 0.5 10.25Miles
§̈¦652

2011: 8,3002035: 13,900
2035 NB: 15,500
2011: 8,1002035: 31,300
2035 NB: 13,700
2011: 3,8002035: 8,500
2035 NB: 10,100
2011: 5,7002035: 29,900
2035 NB: 6,600
2011: 1,3002035: 5,900
2035 NB: 2,200
2011: 2,5002035: 4,400
2035 NB: 4,400
2011: 1,9002035: 1,200
2035 NB: 4,200
2011: 3,6002035: 10,200
2035 NB: 5,600
2011: 3,3002035: 12,400
2035 NB:3,500
2011: 1,5002035: 12,500
2035 NB: 3,500
2011: N/A2035: 22,0002035 NB: N/A
2011: 2,4002035: 1,100
2035 NB: 4,300
AIKEN
RD
I 265
NOR
THI 2
65 S
OUTH
OLD HENRY RD
REAMERS RD
FACTORY LN
ARNOLD PALMER BLVDI 265 RAMP
EASTPOINT PKY
OLD HENRY T
RL BUSH FARM RD
APPLE HILL RD
BOONE TRL
ROCK BAY DR
O AKHURST R D
N BE
CKLE
Y STA
TION R
D
LA GRANGE RD
TRADI
TION DR
ISLEWORTH DR
VENDETTA WAY
ALTAW OOD CT
LANDMARK DR
LONG CREEK WAY
SASSE WAY
CHAMPION LAKE
S PL
AVOCA RD
TERRA VIEW TRL
HIGH WICKHAM PL
SPRING MILL RD
CLAYMORE CIR
CLUB VISTA PL
BROKEN B RANCH WAY
TIMMO
NS CT
MEADOWFIELD DR
ADRIENNE WAY
MEADOW FARMS CT
HEDGEWICK W
AY
FORE
ST PO
INTE L
N
FAIRWAY VISTA DR
FOR E ST BEND CIR
CRYS
TAL S
PRINGS WAY
TWIN CREEK DR
FORB E S CIR
HED G EWICK PL
HIGHLAND S PRIN
GS PL
OAKVISTA WAY
GOLDE N LEAF PL
TERR
ACE SPRINGS DR
FAIRFIELD MEADOWS DR
COLO
NIAL
SPR
INGS
RD
FOREST GLENN CT
BRID
LEPA
TH P
L
BLUE
TEAL
PL
WHITESTO
NE LN
PROT
EGE P
L
LANDMARK PL
I 265
RAM
P
ASH AVE
MAPLE AVE
REAMERS RD
HAWL
EY G
IBSON
RD
OLD FLOYDSBURG RDHOUSTON LN
LAGRA
NGE R
D
ELM AVE
RENADA DR
MOUNT MER
CY DRREST COTTAGE LN
FIVE FORKS DR
DUNN
LEA D
R
CHERRY LNTULIP AVE
OLD FOREST RD
FRIENDSHIP DR
MANA
SSAS
DR
DOGWOOD LN
WOODRI DGE DR
W STHY 146
BROOKSIDE DR E
BROOKSID E DR W
CROS
SBRO
OK DR
HILLRIDGE DR
POLLOCK AVE
ASH LAND CT
STONEY CREEK CT
HICKORY FALLS LN
HINKL
E LN
CONFEDERATE PLACE DROLD FLOYDSBURG RD
ASH AVE
Created by KIPDA June 2011 (AHR)Copyright (c) 2011, Kentuckiana Regional Planning & Development Agency (KIPDA). All rights reserved.No part of this may be reproduced or transmitted in any form or by any means,electronic or mechanical, including photocopying or recording, or by any informationstorage or retrieval system, except as expressly permitted in writing by KIPDA.LIMITATION OF LIABILITY: KIPDA has no indication or reason to believe that there areany inaccuracies or defects in information incorporated in this work and make NOREPRESENTATIONS OF ANY KIND, INCLUDING, BUT NOT LIMITED TO, THEWARRANTIES OF MERCHANTIBILITY OR FITNESS FOR A PARTICULAR USE, NORARE ANY SUCH WARRANTIES TO BE IMPLIED, WITH RESPECT TO THEINFORMATION OR DATA, FURNISHED HEREIN.
TRAFFIC FORECASTSOLD HENRY RD. TRAFFIC FORECAST
±
0 0.5 10.25Miles
§̈¦652
2011: 15,2002035: 35,100
2035 NB: 22,900
J e f f e r s o nJ e f f e r s o n
O l d h a mO l d h a m
S h e l b yS h e l b y

UV1694
UV1817
UV329
UV841
UV1531
UV1747 UV362
UV1819
UV22
UV146
UV1408
UV1447
UV913
UV3084
UV2840UV1819
UV329
UV362
UV1694
UV146
Created by KIPDA June 2011 (AHR)Copyright (c) 2011, Kentuckiana Regional Planning & Development Agency (KIPDA). All rights reserved.No part of this may be reproduced or transmitted in any form or by any means,electronic or mechanical, including photocopying or recording, or by any informationstorage or retrieval system, except as expressly permitted in writing by KIPDA.LIMITATION OF LIABILITY: KIPDA has no indication or reason to believe that there areany inaccuracies or defects in information incorporated in this work and make NOREPRESENTATIONS OF ANY KIND, INCLUDING, BUT NOT LIMITED TO, THEWARRANTIES OF MERCHANTIBILITY OR FITNESS FOR A PARTICULAR USE, NORARE ANY SUCH WARRANTIES TO BE IMPLIED, WITH RESPECT TO THEINFORMATION OR DATA, FURNISHED HEREIN.
TRAFFIC FORECASTSOLD HENRY RD. TRAFFIC FORECAST
±
0 0.5 1 1.5 2 2.5 3 3.50.25Miles
§̈¦652
§̈¦652
§̈¦71
2011: 56,6002035: 66,800
2035 NB: 70,000
2011: 69,0002035: 70,400
2035 NB: 70,900
2011: 74,8002035: 143,400
2035 NB: 147,700
2011: 53,5002035: 111,700
2035 NB: 118,600
2011: 50,8002035: 112,200
2035 NB: 118,900
2011: 52,7002035: 106,200
2035 NB: 115,700
2011: 56,6002035: 115,700
2035 NB: 114,800
2011: 18,1002035: 45,400
2035 NB: 48,800 2011: 12,8002035: 13,300
2035 NB: 16,200
2011: 12,7002035: 15,900
2035 NB: 14,000
2011: 9,0002035: 55,400
2035 NB: 56,700
2011: 7,0002035: 42,300
2035 NB: 51,500
2011: 20,7002035: 42,700
2035 NB: 45,000
2011: 50,7002035: 58,000
2035 NB: 60,000
J e f f e r s o nJ e f f e r s o n
O l d h a mO l d h a m
728 147391 656
0 625 1030 330 61
421 2053 1 580
2 5803 5375 0 373 844
2 1 1,1012 0 264
1 521
AM Peak‐HourCountPM Peak‐Hour Count
Old Hen
ry Rd.
Bush Farm Rd.
2011 Peak‐Hour Turning MovementsOld Henry Road @ Bush Farm Road Intersection
AM Peak Hour: 7:15‐8:15PM Peak Hour: 5:00‐6:00
8751,047
Old Hen
ry Rd.
N/A
1 52120
0 105 1611 450 459
1,164 266703 910
1,613
Bush Farm Rd.N/A
Old Hen
ry Rd.
Old Hen
ry Rd.
1,430

4,050 4,05015,650 15,650
0 3,700 350150 12,900 2,600
350100 2,600650 0 4,150
100 6,950200 3,8001,300 0 4,250 8,300
100 150 13,900650 0 4,150
100 6,950
Bush Farm Rd.
Old Henry Road @ Bush Farm Road Intersection2011/2035 Build Turning Movement Estimates
8,100
Old Hen
ry Rd.
31,300
Old Hen
ry Rd.
2011 ADT Estimate2035 ADT Estimate
N/A
100 6,950100400
100 3,700 3,800400 12,900 4,250
7,600 7,60017,550 17,550
35,100
Old Hen
ry Rd.
Old Hen
ry Rd.
15,200
N/A Bush Farm Rd.

2,400 9001,450 2,100
2035 AM Peak‐Hour Estimate50 2,100 250 2035 PM Peak‐Hour Estimate50 1,150 250
300150 350150 50 850
50 850250 500400 50 450 1,350
100 100 1,650250 0 500
50 800
Old Henry Road @ Bush Farm Road Intersection2035 Build Peak‐Hour Turning Movement Estimates
3,300
Old Hen
ry Rd.
3,550
Old Hen
ry Rd.
N/A Bush Farm Rd.
50 80050100
50 550 25050 1,650 500
2,650 8501,700 2,200
3,900
N/A Bush Farm Rd.
Old Hen
ry Rd.
Old Hen
ry Rd.
3,500

1,125 300550 1,050
25 925 17525 425 100
150100 350150 50 1,000
50 1,050250 800400 25 650 1,450
100 100 1,875250 25 450
50 825
2035 AM No‐Build Peak‐Hour Estimate2035 PM No‐Build Peak‐Hour Estimate
N/A Bush Farm Rd.
Old Henry Road @ Bush Farm Road Intersection2035 No‐Build Peak‐Hour Turning Movement Estimates
1,425
Old Hen
ry Rd.
1,600
Old Hen
ry Rd.
50 82550100
25 125 25075 600 675
1,775 4001,175 1,350
2,525
N/A Bush Farm Rd.
Old Hen
ry Rd.
Old Hen
ry Rd.
2,175
15,650 15,6506,850 6,850
150 12,900 2,60050 5,100 1,700
2,600650 1,700650 100 6,950
150 7,7501,300 4,2501,300 150 5,900 13,900
650 50 15,500650 100 6,950
150 7,750
2035 Build ADT Estimate2035 No‐Build ADT Estimate
Old Henry Road @ Bush Farm Road Intersection2035 Turning Movement Estimates
31,300
Old Hen
ry Rd.
13,700
Old Hen
ry Rd.
N/A Bush Farm Rd.
150 7,750400450
400 12,900 4,250450 5,100 5,900
17,550 17,55011,450 11,450
22,900
N/A Bush Farm Rd.
Old Hen
ry Rd.
Old Hen
ry Rd.
35,100

481 94244 450
39 0 44229 0 215
7799 372223 60 137
194 566281 0406 17 0 744
182 78 886183 165 607
105 320
AM Peak Hour: 7:15‐8:15PM Peak Hour: 5:15‐6:15
Factory Ln. Old Henry Rd.
AM Peak‐HourCountPM Peak‐Hour Count
Old Henry Road @ Factory Lane Intersection2011 Peak‐Hour Turning Movements
575
Old Hen
ry Rd.
694
Old Hen
ry Rd.
105 32000
Old Henry Rd.
N/A
N/A
Factory Ln.
2,850 2,85014,950 14,950
350 0 2,5001,775 13,175 0
2,5001,9004,250 1,550 4,050
3,800 08,500 350 8,100
1,900 1,7754,250 1,550 4,050
0
2035 ADT Estimate2011 ADT Estimate
Factory Ln. Old Henry Rd. (2011)
Old Henry Road @ Factory Lane Intersection2011/2035 Build Turning Movement Estimates
5,700
Old Hen
ry Rd.
29,900
Old Hen
ry Rd.
00
2,475
2,475 13,175 0
15,650 15,650
Old Hen
ry Rd. (2
035)
Old Hen
ry Rd. (2
035)
31,300
Note: Intersection will be re‐aligned so that Old Henry Road is a N/S through movement.
Factory Ln. Old Henry Rd. (2011)

2,500 5501,350 2,050
2035 AM Peak‐Hour Estimate300 2,200 0 2035 PM Peak‐Hour Estimate150 1,200 0
350450
750900 100
400 250450 0
0
Factory Ln. N/A
Old Henry Road @ Factory Lane Intersection2035 Build Peak‐Hour Turning Movement Estimates
3,050
Old Hen
ry Rd.
3,400
Old Hen
ry Rd.
0300200
50 450 0300 1,800 0
2,500 5001,400 2,100
Note: Intersection will be re‐aligned so that Old Henry Road is a N/S through movement.
3,500
Old Hen
ry Rd.
Old Hen
ry Rd.
3,000
Factory Ln. N/A

500 225300 600
50 450 050 250 0
150425
7251,000 75
575 150575 0
2035 AM Peak‐Hour Estimate2035 PM Peak‐Hour Estimate
Factory Ln. N/A
Old Henry Road @ Factory Lane Intersection2035 No‐Build Peak‐Hour Turning Movement Estimates
725
Old Hen
ry Rd.
900
Old Hen
ry Rd.
575 00500425
100 150 0375 450 0
950 250675 825
1,500
Note: Intersection will be re‐aligned so that Old Henry Road is a N/S through movement.
Factory Ln. N/A
Old Hen
ry Rd.
Old Hen
ry Rd.
1,200

14,950 14,9503,300 3,300
1,775 13,175 0750 2,550 0
4,2505,050
8,50010,100 1,775
4,250 7505 050 0
2035 Build ADT Estimate2035 No‐Build ADT Estimate
Factory Ln. N/A
Old Henry Road @ Factory Lane Intersection2035 Turning Movement Estimates
29,900
Old Hen
ry Rd.
6,600
Old Hen
ry Rd.
5,050 00
2,4754,300
2,475 13,175 04,300 2,550 0
15,650 15,6506,850 6,850
Note: Intersection will be re‐aligned so that Old Henry Road is a N/S through movement.
Old Hen
ry Rd.
Old Hen
ry Rd.
31,30013,700
Factory Ln. N/A

11 87 14
1 10 03 4 0
041 0203 0 1
0 0267 1291 3 0 1
226 3 188 0 0
0 1
AM Peak‐HourCountPM Peak‐Hour Count
Reamers Rd. Private Driveway
Old Henry Road @ Reamers Road Intersection2011 Peak‐Hour Turning Movements
AM Peak Hour: 7:15‐8:15 19PM Peak Hour: 5:15‐6:15
New
Son
g Drivewa
21
New
Son
g Drivewa
0 122385
40 5 0200 11 1
234 4589 212
301
Reamers Rd. Private Driveway
Old Hen
ry Rd.
Old Hen
ry Rd.
279

150 15011,100 11,100
50 100 0250 10,850 0
01,200 0550 0 0
0 02,400 01,100 50 0 0
1,200 250 0550 0 0
2011 ADT Estimate2035 ADT Estimate
Old Hen
ry Rd. (2
035)
Old Hen
ry Rd. (2
035)
Private Driveway
22,200
Reamers Rd.
Old Henry Road @ Reamers Road Intersection2011/2035 Build Turning Movement Estimates
300
550 0 00 0
1,150300
1,150 100 0300 10,850 0
1,250 1,25011,150 11,150
Note: 2035 ADT Estimate adjusted to reflect location of subdivisions on Old Henry Road
Reamers Rd. Private Driveway
Old Hen
ry Rd.
Old Hen
ry Rd.
2,50022,300
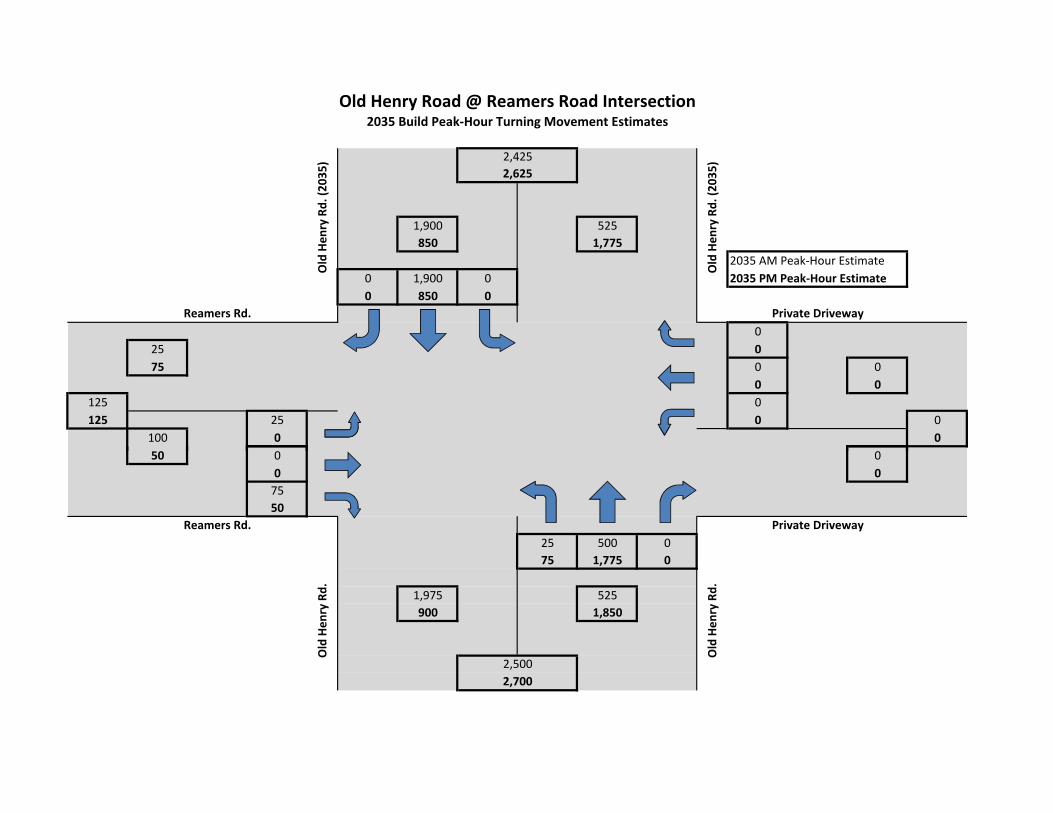
1,900 525850 1,775
2035 AM Peak‐Hour Estimate0 1,900 0 2035 PM Peak‐Hour Estimate0 850 0
025 075 0 0
0 0125 0125 25 0 0
100 0 050 0 0
Old Hen
ry Rd. (2
035)
Old Hen
ry Rd. (2
035)
Reamers Rd. Private Driveway
Old Henry Road @ Reamers Road Intersection2035 Build Peak‐Hour Turning Movement Estimates
2,4252,625
50 0 00 07550
25 500 075 1,775 0
1,975 525900 1,850
2,700
Old Hen
ry Rd.
Old Hen
ry Rd.
2,500
Reamers Rd. Private Driveway
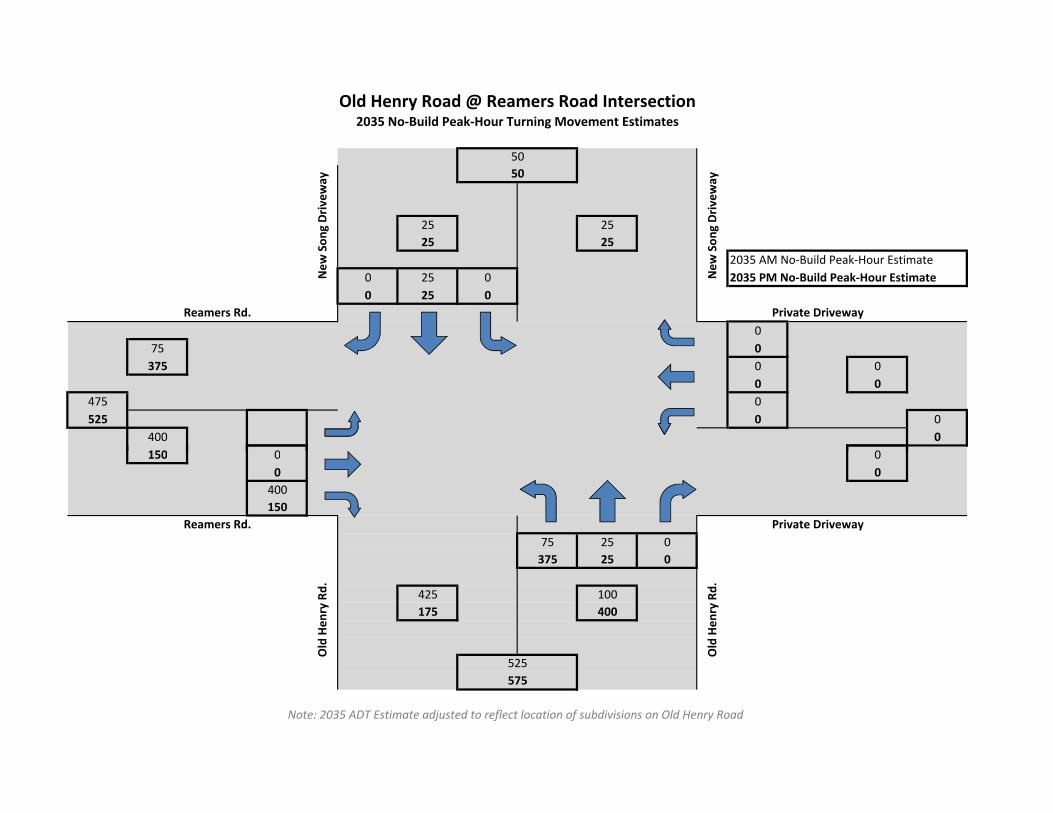
25 2525 25
2035 AM No‐Build Peak‐Hour Estimate0 25 0 2035 PM No‐Build Peak‐Hour Estimate0 25 0
075 0375 0 0
0 0475 0525 0 0
400 0150 0 0
Reamers Rd. Private DrivewayNew
Son
g Driveway
New
Son
g Driveway
Old Henry Road @ Reamers Road Intersection2035 No‐Build Peak‐Hour Turning Movement Estimates
5050
150 0 00 0400150
75 25 0375 25 0
425 100175 400
Old Hen
ry Rd.
Old Hen
ry Rd.
525575
Note: 2035 ADT Estimate adjusted to reflect location of subdivisions on Old Henry Road
Reamers Rd. Private Driveway

11,100 11,100350 350
250 10,850 025 325
0550 02,150 0 0
0 01,100 04,300 250 0 0
550 25 02 150 0 0
Reamers Rd. Private Driveway
2035 Build ADT Estimate2035 No‐Build ADT Estimate
Old Henry Road @ Reamers Road Intersection2035 Turning Movement Estimates
New
Son
g Driveway
New
Son
g Driveway22,200
700
2,150 0 00 03002,125
300 10,850 02,125 325 0
11,150 11,1502,450 2,450
Old Hen
ry Rd.
Old Hen
ry Rd.
22,3004,900
Note: 2035 ADT Estimate adjusted to reflect location of subdivisions on Old Henry Road
Reamers Rd. Private Driveway
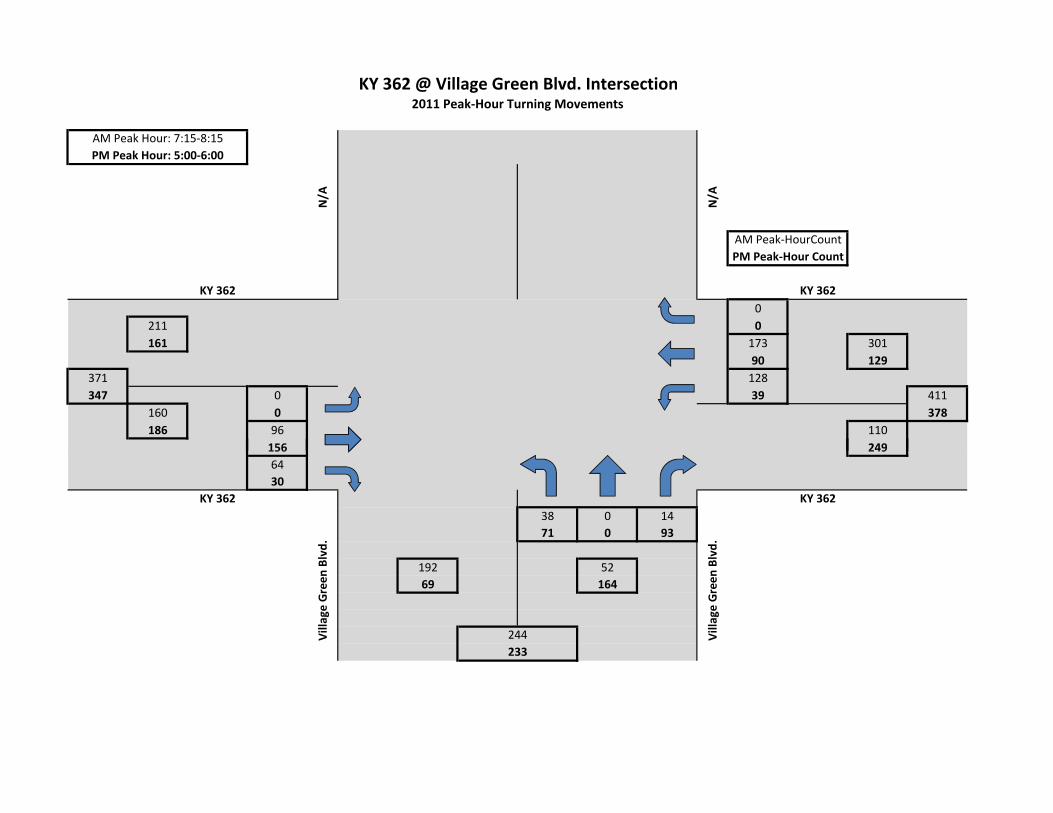
0211 0161 173 301
90 129371 128347 0 39 411
160 0 378186 96 110
156 249
AM Peak‐HourCountPM Peak‐Hour Count
KY 362 @ Village Green Blvd. Intersection2011 Peak‐Hour Turning Movements
AM Peak Hour: 7:15‐8:15PM Peak Hour: 5:00‐6:00
N/A
N/A
KY 362 KY 362
156 2496430
38 0 1471 0 93
192 5269 164
233
KY 362
Village Green
Blvd.
Village Green
Blvd.
244
KY 362

01,675 05,600 1,150 1,600
5,050 5,1003,350 45012,400 0 50 3,600
1,675 0 10,2006,200 1,150 1,600
5,650 5,700
KY 362 @ Village Green Blvd. Intersection2011/2035 Build Turning Movement Estimates
KY 362 KY 362
2011 ADT Estimate2035 ADT Estimate
N/A
N/A
, ,525550
525 0 450550 0 50
975 975600 600
1,200
KY 362 KY 362
Village Green
Blvd.
Village Green
Blvd.
1,950
Note: Location of Willow Run Lane (centroid connector) in model contributes to imbalance

2035 AM Peak‐Hour Estimate2035 PM Peak‐Hour Estimate
0500 0650 450 475
625 6501,250 251,175 0 25 1,100
750 0 1,125525 725 725
475 475
KY 362 @ Village Green Blvd. Intersection2035 Build Peak‐Hour Turning Movement Estimates
N/A
N/A
KY 362 KY 362
2550
50 0 025 0 0
50 5075 25
150
KY 362 KY 362
Village Green
Blvd.
Village Green
Blvd.
150
Note: Location of Willow Run Lane (centroid connector) in model contributes to imbalance

2035 Build ADT Estimates2035 No‐Build ADT Estimates
05,600 01,750 5,050 5,100
1,225 2,80012,400 503,500 0 1,575 10,200
6,200 0 5,6001,750 5,650 5,700
1,225 2,800
KY 362 (Ash Ave.) KY 362 (Ash Ave.)
KY 362 @ Village Green Blvd. Intersection2035 Turning Movement Estimates
N/A
N/A
, ,550525
550 0 50525 0 1,575
600 6002,100 2,100
4,200
Note: Location of Willow Run Lane (centroid connector) in model contributes to imbalance
KY 362 (Ash Ave.) KY 362 (Ash Ave.)
Village Green
Blvd.
Village Green
Blvd.
1,200

0250 0200 200 450
125 300400 250375 0 175 650
175 0 675
2035 AM No‐Build Peak‐Hour Estimates2035 PM No‐Build Peak‐Hour Estimates
N/A
N/A
KY 362 (Ash Ave.) KY 362 (Ash Ave.)
KY 362 @ Village Green Blvd. Intersection2035 NoBuild Peak‐HourTurning Movement Estimates
175 100 225150 3757525
50 0 12575 0 225
325 175200 300
500
Note: Location of Willow Run Lane (centroid connector) in model contributes to imbalance
KY 362 (Ash Ave.) KY 362 (Ash Ave.)
Village Green
Blvd.
Village Green
Blvd.
525

111 4457 113
93 0 1842 0 15
5163 6103 70 75
61 67278 0290 39 0 169
115 107 162187 76 94
80 95
AM Peak‐HourCountPM Peak‐Hour Count
KY 362 @ Hawley Gibson Rd. Intersection2011 Peak‐Hour Turning Movements
AM Peak Hour: 7:15‐8:15 155PM Peak Hour: 4:30‐5:30
Haw
ley Gibson Rd
.
170
Haw
ley Gibson Rd
.
KY 362 (Ash Ave.) KY 362 (Ash Ave.)
80 9500
KY 362 (Ash Ave.)
N/A
N/A
KY 362 (Ash Ave.)

650 6502,950 2,950
550 0 10025 2,900 25
1001,675 254,900 1,125 1,225
950 2,2003,350 09,800 550 1,225 2,450
1,675 25 4,4004,900 1,125 1,225
950 2 200
KY 362 @ Hawley Gibson Rd. Intersection2011/2035 Build Turning Movement Estimates
1,300
KY 362 (Ash Ave.)
2011 ADT Estimate2035 ADT Estimate
Haw
ley Gibson Rd
.
5,900
Haw
ley Gibson Rd
.
KY 362 (Ash Ave.)
950 2,2000
3,925
0 0 03,925 2,900 1,225
0 08,050 8,050
16,100
Old Hen
ry Rd. (2
035)
Old Hen
ry Rd. (2
035)Note: 2035 ADT Estimates adjusted to reflect locations of subdivisions on KY 362 & Old Henry Road
KY 362 (Ash Ave.) KY 362 (Ash Ave.)
0

425 325275 475
2035 AM Peak‐Hour Estimate0 425 0 2035 PM Peak‐Hour Estimate0 275 0
0475 0575 50 125
25 100900 75925 0 75 300
425 0 300350 25 175
25 200
Haw
ley Gibson Rd
.
750
Haw
ley Gibson Rd
.
KY 362 @ Hawley Gibson Rd. Intersection2035 Build Peak‐Hour Turning Movement Estimates
750
KY 362 (Ash Ave.) KY 362 (Ash Ave.)
25 200400325
425 325 150550 475 175
900 900675 1,200
KY 362 (Ash Ave.) KY 362 (Ash Ave.)
1,800
Old Hen
ry Rd. (2
035)
Old Hen
ry Rd. (2
035)
1,875
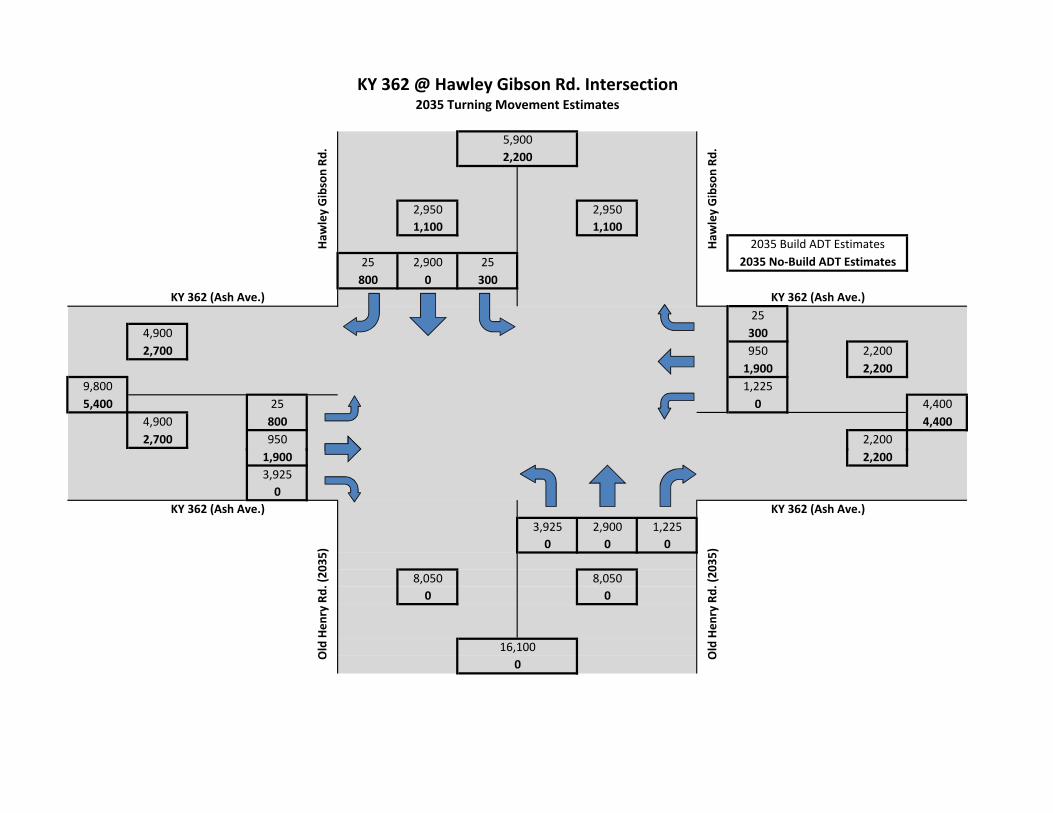
2,950 2,9501,100 1,100
25 2,900 25800 0 300
254,900 3002,700 950 2,200
1,900 2,2009,800 1,2255,400 25 0 4,400
4,900 800 4,4002,700 950 2,200
1 900 2 200
KY 362 @ Hawley Gibson Rd. Intersection2035 Turning Movement Estimates
5,900
Haw
ley Gibson Rd
.
2,200
Haw
ley Gibson Rd
.
2035 Build ADT Estimates2035 No‐Build ADT Estimates
KY 362 (Ash Ave.) KY 362 (Ash Ave.)
1,900 2,2003,9250
3,925 2,900 1,2250 0 0
8,050 8,0500 0
Old Hen
ry Rd. (2
035)
Old Hen
ry Rd. (2
035)
16,1000
KY 362 (Ash Ave.) KY 362 (Ash Ave.)
150 100100 175
125 0 2575 0 25
25225 25175 100 125
100 125425 0475 75 0 275
200 150 300300 125 150
150 175
2035 AM No‐Build Peak‐Hour Estimates2035 PM No‐Build Peak‐Hour Estimates
KY 362 (Ash Ave.) KY 362 (Ash Ave.)
KY 362 @ Hawley Gibson Rd. Intersection2035 No‐Build Peak‐Hour Turning Movement Estimates
250
Haw
ley Gibson Rd
.
275
Haw
ley Gibson Rd
.
150 17500
KY 362 (Ash Ave.) KY 362 (Ash Ave.)
N/A
N/A

Kentucky Member Counties Bullitt Henry Jefferson Oldham Shelby Spencer Trimble Indiana Member Counties Clark Floyd Equal Opportunity Employer
11520 Commonwealth Drive Louisville, KY 40299
502-266-6084 Fax: 502-266-5047
KY TDD 1-800-648-6056 www.kipda.org
Metropolitan Planning Organization Kentucky Designated Area Agency on Aging
To: Paul Davis, KYTC District 5 Brian Meade, KYTC District 5 From: Andy Rush Date: June 16, 2011 Subject: Old Henry Road (KY 3084) Extension Forecasts I have included additional traffic forecasts per your request, in the vicinity of the Old Henry Road (KY 3084) Extension Project. These forecasts can be found in the table and in the maps that follow. Data is provided for the Years 2030 and 2035. There were two additional model run scenarios performed after the PL&G meeting on June 8th. These runs assumed that the modified portion of Old Henry Road will be functionally classified as an urban collector. The first run assumed it will be widened to a 3-lane collector, and the second run assumed a 5-lane collector from Bush Farm Road in Jefferson County to Ash Avenue (KY 362) in Oldham County. Changing the way the Old Henry Road Extension is modeled from an assumed 3-lane divided arterial to a 3-lane collector has the effect of reducing the modeled capacity of the roadway by approximately 30%. Similarly, the 5-lane collector has a modeled capacity that is approximately 65% greater than the modeled capacity of a 3-lane divided arterial. All other assumptions were kept constant from the previous model runs and from the report that I submitted earlier this month to KYTC. Please let me know if you have any questions or if you need any additional information.

StationRecent Count 2030 Build
2030 NoBuild 2035 Build
2035 NoBuild
2030 3‐Lane
Collector
2035 3‐Lane
Collector
2030 5‐Lane
Collector
2035 5‐Lane
CollectorOld Henry Road (KY 3084)
south of Bush Farm 15,161 29,500 21,000 35,100 22,900 27,300 31,900 31,900 38,800Bush Farm to Factory 8,099 23,600 12,300 31,300 13,700 18,600 23,100 27,600 38,100Factory to Reamers 5,736 21,200 6,400 29,900 6,600 17,100 22,800 24,200 35,300Reamers to KY 362 N/A 17,000 N/A 22,200 N/A 12,800 16,000 19,300 26,000
Bush Farm Road
east of Old Henry 8,317 12,500 13,600 13,900 15,500 13,300 15,000 11,900 13,100
Factory Lane
west of Old Henry 3,758 7,200 8,200 8,500 10,100 5,900 6,600 7,800 9,500
Reamers Road
west of Old Henry 2,420 1,300 3,800 1,100 4,300 1,300 1,100 1,500 1,300
Ash Avenue (KY 362)
KY 146 to Old Floydsburg 1,465 8,000 2,900 12,500 3,500 6,500 9,600 8,900 14,300Old Floydsburg to Village Green 3,318 9,400 3,500 12,400 3,500 6,900 8,400 11,300 15,600Village Green to Hawley Gibson 3,552 8,200 5,100 10,200 5,600 4,900 5,300 9,900 13,000
east of Hawley Gibson 2,465 3,900 3,900 4,400 4,400 3,900 4,400 3,900 4,400
Hawley Gibson Road
east of KY 362 1,289 4,300 2,000 5,900 2,200 3,800 5,100 4,700 6,600
Village Green Blvd.
north of Reamers 1,937 1,300 3,600 1,200 4,200 1,300 1,200 1,500 1,400
KY 146
east of Chamberlain 112 18,100 37,500 39,700 45,400 48,800 38,600 47,100 36,300 43,600near Jefferson/Oldham Co. line B01 12,800 13,200 15,400 13,300 16,200 13,900 14,200 12,700 12,700 at Pewee Valley/Crestwood line B08 12,700 15,200 13,700 15,900 14,000 14,800 15,400 15,300 16,100
KY 22
east of I‐265 V28 20,700 36,700 38,300 42,700 45,000 37,100 43,300 36,300 42,100east of Jefferson/Oldham Co. line 500 7,000 29,100 34,000 42,300 51,500 30,200 44,400 28,700 41,600
near Clore Ln. B23 8,970 37,900 38,600 55,400 56,700 38,200 55,900 38,000 55,600
I‐71
south of I‐265 A07 69,000 70,100 70,500 70,400 70,900 70,200 70,500 70,000 70,300north of I‐265 A05 56,600 64,500 67,000 66,800 70,000 65,100 67,500 63,900 66,000north of KY 329 311 50,700 56,400 57,900 58,000 60,000 56,800 58,500 56,100 57,600
I‐265
south of Old Henry B14 56,600 99,700 99,100 115,700 114,800 99,900 116,000 99,600 115,600north of Old Henry B39 52,700 91,800 98,200 106,200 115,700 95,600 111,800 89,600 103,000south of KY 1447 A76 50,800 95,100 99,600 112,200 118,900 96,900 114,800 93,700 110,100south of KY 22 A13 53,500 95,800 100,500 111,700 118,600 97,400 114,000 94,600 109,900south of I‐71 A11 74,800 125,200 128,200 143,400 147,700 126,200 144,800 124,600 142,500
Old Henry Road (KY 3084) Extension Traffic Forecasts
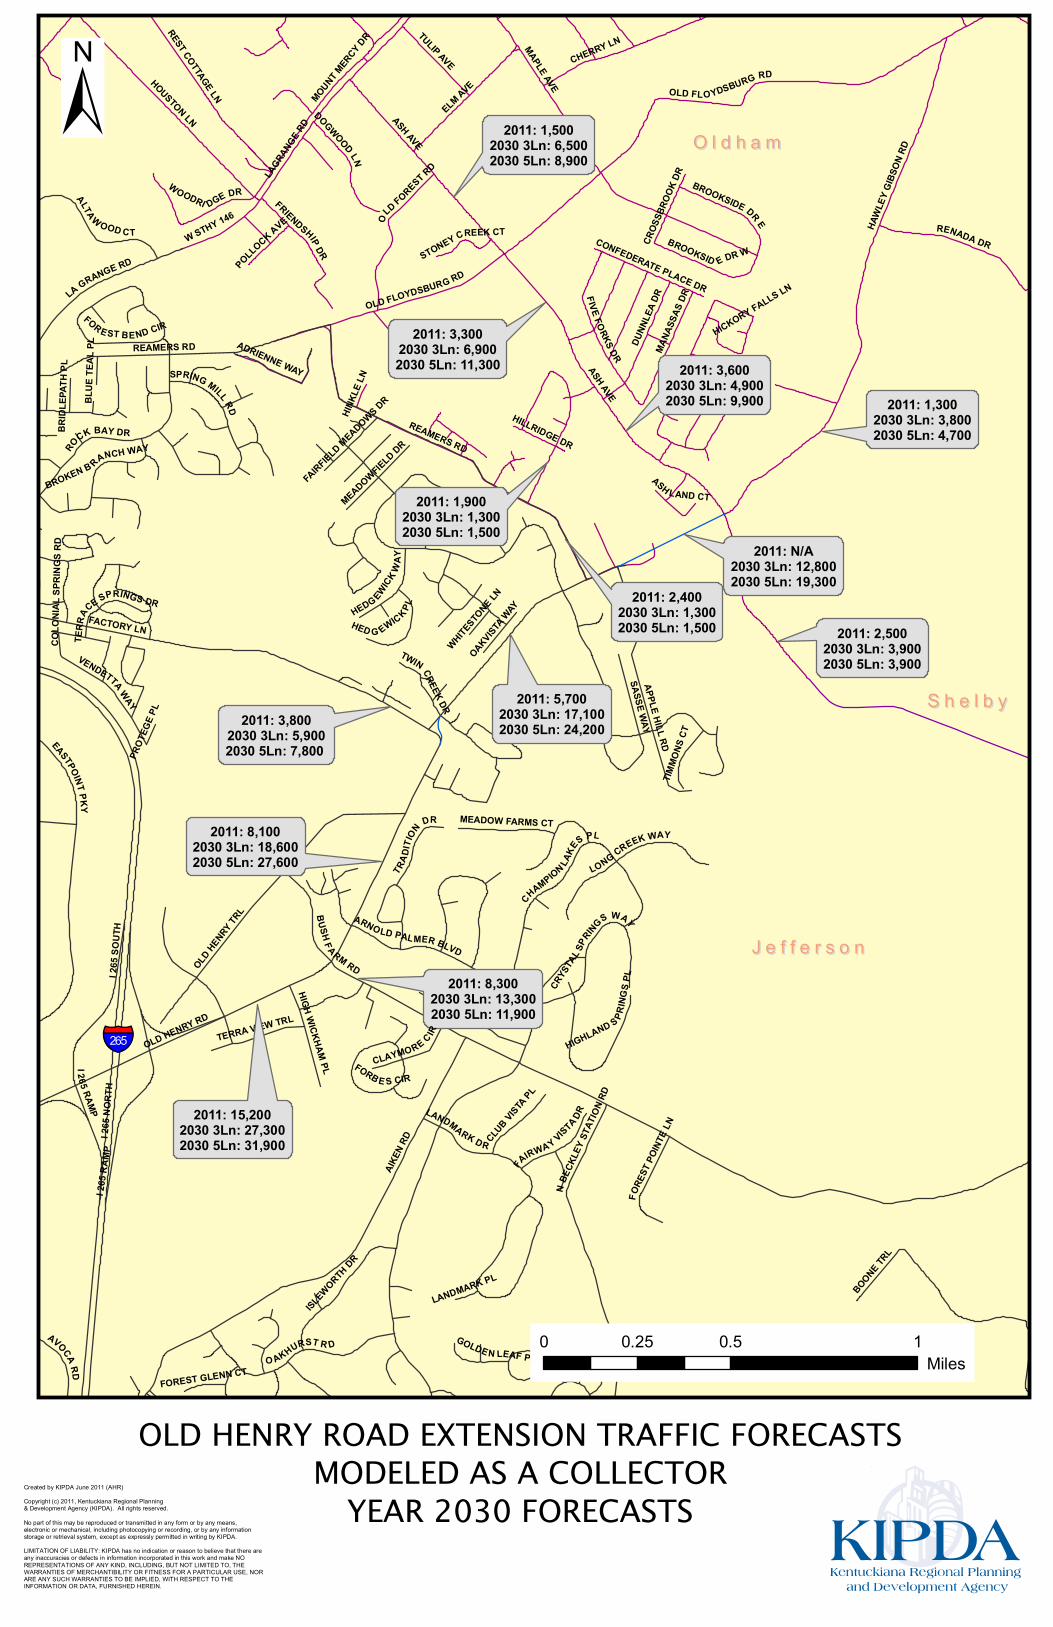
2011: 8,3002030 3Ln: 13,3002030 5Ln: 11,900
2011: 8,1002030 3Ln: 18,6002030 5Ln: 27,600
2011: 3,8002030 3Ln: 5,9002030 5Ln: 7,800
2011: 5,7002030 3Ln: 17,1002030 5Ln: 24,200
2011: 1,3002030 3Ln: 3,8002030 5Ln: 4,700
2011: 2,5002030 3Ln: 3,9002030 5Ln: 3,900
2011: 1,9002030 3Ln: 1,3002030 5Ln: 1,500
2011: 3,6002030 3Ln: 4,9002030 5Ln: 9,900
2011: 3,3002030 3Ln: 6,9002030 5Ln: 11,300
2011: 1,5002030 3Ln: 6,5002030 5Ln: 8,900
2011: N/A2030 3Ln: 12,8002030 5Ln: 19,300
2011: 2,4002030 3Ln: 1,3002030 5Ln: 1,500
AIKEN
RD
I 265
NOR
THI 2
65 S
OUTH
OLD HENRY RD
REAMERS RD
FACTORY LN
ARNOLD PALMER BLVDI 265 RAMP
EASTPOINT PKY
OLD HENRY T
RL BUSH F ARM RD
APPLE HILL RD
BOONE TRL
ROCK BAY DR
O AKHURST R D
N BE
CKLE
Y STA
TION R
D
LA GRANGE RD
TRADI
TION DR
ISLEWORTH DR
VENDETTA WAY
ALTAW OOD CT
LANDMARK DR
LONG CREEK WAY
SASSE WAY
CHAMPION LAKE
S PL
AVOCA RD
TERRA VIEW TRL
HIGH WICKHAM PL
SPRING MILL RD
CLAYMORE C IR
CLUB VISTA PL
BROKEN B RANCH WAY
TIMMO
NS CT
MEADOWFIELD DR
ADRIENNE WAY
MEADOW FARMS CT
HEDGEWICK WAY
FORE
ST PO
INTE L
N
FAIRWAY VISTA DR
FOR E ST BEND CIR
CRYS
TAL S
PRINGS WAY
TWIN CREEK DR
FORB E S CIR
HED G EWICK PL
HIGHLAND S PRIN
GS PL
OAKVISTA WAY
GOLDE N LEAF PL
TERR
ACE SPRINGS DR
FAIRFIELD MEADOWS DR
COLO
NIAL
SPR
INGS
RD
FOREST GLENN CT
BRID
LEPA
TH P
L
BLUE
TEAL
PL
WHITESTO
NE LN
PROT
EGE P
L
LANDMARK PL
I 265
RAM
P
ASH AVE
MAPLE AVE
REAMERS RD
HAWL
EY G
IBSON
RD
OLD FLOYDSBURG RDHOUSTON LN
LAGRA
NGE R
D
ELM AVE
RENADA DR
MOUNT MER
CY DRREST COTTAGE LN
FIVE FORKS DR
DUNN
LEA D
R
CHERRY LNTULIP AVE
OLD FOREST RD
FRIENDSHIP DR
MANA
SSAS
DR
DOGWOOD LN
WOODRI DGE DR
W STHY 146
BROOKSIDE DR E
BROOKSID E DR W
CROS
SBRO
OK DR
HILLRIDGE DR
POLLOCK AVE
ASH LAND CT
STONEY CREEK CT
HICKORY FALLS LN
HINKL
E LN
CONFEDERATE PLACE DROLD FLOYDSBURG RD
ASH AVE
Created by KIPDA June 2011 (AHR)Copyright (c) 2011, Kentuckiana Regional Planning & Development Agency (KIPDA). All rights reserved.No part of this may be reproduced or transmitted in any form or by any means,electronic or mechanical, including photocopying or recording, or by any informationstorage or retrieval system, except as expressly permitted in writing by KIPDA.LIMITATION OF LIABILITY: KIPDA has no indication or reason to believe that there areany inaccuracies or defects in information incorporated in this work and make NOREPRESENTATIONS OF ANY KIND, INCLUDING, BUT NOT LIMITED TO, THEWARRANTIES OF MERCHANTIBILITY OR FITNESS FOR A PARTICULAR USE, NORARE ANY SUCH WARRANTIES TO BE IMPLIED, WITH RESPECT TO THEINFORMATION OR DATA, FURNISHED HEREIN.
OLD HENRY ROAD EXTENSION TRAFFIC FORECASTSMODELED AS A COLLECTOR
YEAR 2030 FORECASTS
±
0 0.5 10.25Miles
§̈¦652
2011: 15,2002030 3Ln: 27,3002030 5Ln: 31,900
J e f f e r s o nJ e f f e r s o n
O l d h a mO l d h a m
S h e l b yS h e l b y

2011: 8,3002035 3Ln: 15,0002035 5Ln: 13,100
2011: 8,1002035 3Ln: 23,1002035 5Ln: 38,100
2011: 3,8002035 3Ln: 6,6002035 5Ln: 9,500
2011: 5,7002035 3Ln: 22,8002035 5Ln: 35,300
2011: 1,3002035 3Ln: 5,1002035 5Ln: 6,600
2011: 2,5002035 3Ln: 4,4002035 5Ln: 4,400
2011: 1,9002035 3Ln: 1,2002035 5Ln: 1,400
2011: 3,6002035 3Ln: 5,3002035 5Ln: 13,000
2011: 3,3002035 3Ln: 8,4002035 5Ln: 15,600
2011: 1,5002035 3Ln: 9,6002035 5Ln: 14,300
2011: N/A2035 3Ln: 16,0002035 5Ln: 26,000
2011: 2,4002035 3Ln: 1,1002035 5Ln: 1,300
AIKEN
RD
I 265
NOR
THI 2
65 S
OUTH
OLD HENRY RD
REAMERS RD
FACTORY LN
ARNOLD PALMER BLVDI 265 RAMP
EASTPOINT PKY
OLD HENRY T
RL BUSH F ARM RD
APPLE HILL RD
BOONE TRL
ROCK BAY DR
O AKHURST R D
N BE
CKLE
Y STA
TION R
D
LA GRANGE RD
TRADI
TION DR
ISLEWORTH DR
VENDETTA WAY
ALTAW OOD CT
LANDMARK DR
LONG CREEK WAY
SASSE WAY
CHAMPION LAKE
S PL
AVOCA RD
TERRA VIEW TRL
HIGH WICKHAM PL
SPRING MILL RD
CLAYMORE C IR
CLUB VISTA PL
BROKEN B RANCH WAY
TIMMO
NS CT
MEADOWFIELD DR
ADRIENNE WAY
MEADOW FARMS CT
HEDGEWICK WAY
FORE
ST PO
INTE L
N
FAIRWAY VISTA DR
FOR E ST BEND CIR
CRYS
TAL S
PRINGS WAY
TWIN CREEK DR
FORB E S CIR
HED G EWICK PL
HIGHLAND S PRIN
GS PL
OAKVISTA WAY
GOLDE N LEAF PL
TERR
ACE SPRINGS DR
FAIRFIELD MEADOWS DR
COLO
NIAL
SPR
INGS
RD
FOREST GLENN CT
BRID
LEPA
TH P
L
BLUE
TEAL
PL
WHITESTO
NE LN
PROT
EGE P
L
LANDMARK PL
I 265
RAM
P
ASH AVE
OLD FLOYD
SBUR
G RD
MAPLE AVE
REAMERS RD
HAWL
EY G
IBSON
RDHOUSTON LN
LAGRA
NGE R
D
ELM AVE
RENADA DR
MOUNT MER
CY DRREST COTTAGE LN
FIVE FORKS DR
DUNN
LEA D
R
CHERRY LNTULIP AVE
OLD FOREST RD
FRIENDSHIP DR
MANA
SSAS
DR
DOGWOOD LN
WOODRI DGE DR
W STHY 146
BROOKSIDE DR E
BROOKSID E DR W
CROS
SBRO
OK DR
HILLRIDGE DR
POLLOCK AVE
ASH LAND CT
STONEY CREEK CT
HICKORY FALLS LN
HINKL
E LN
CONFEDERATE PLACE DR
Created by KIPDA June 2011 (AHR)Copyright (c) 2011, Kentuckiana Regional Planning & Development Agency (KIPDA). All rights reserved.No part of this may be reproduced or transmitted in any form or by any means,electronic or mechanical, including photocopying or recording, or by any informationstorage or retrieval system, except as expressly permitted in writing by KIPDA.LIMITATION OF LIABILITY: KIPDA has no indication or reason to believe that there areany inaccuracies or defects in information incorporated in this work and make NOREPRESENTATIONS OF ANY KIND, INCLUDING, BUT NOT LIMITED TO, THEWARRANTIES OF MERCHANTIBILITY OR FITNESS FOR A PARTICULAR USE, NORARE ANY SUCH WARRANTIES TO BE IMPLIED, WITH RESPECT TO THEINFORMATION OR DATA, FURNISHED HEREIN.
OLD HENRY ROAD EXTENSION TRAFFIC FORECASTSMODELED AS A COLLECTOR
YEAR 2035 FORECASTS
±
0 0.5 10.25Miles
§̈¦652
2011: 15,2002035 3Ln: 31,9002035 5Ln: 38,800
J e f f e r s o nJ e f f e r s o n
O l d h a mO l d h a m
S h e l b yS h e l b y

UV1694
UV1817
UV329
UV841
UV1531
UV1747 UV362
UV1819
UV22
UV146
UV1408
UV1447
UV913
UV3084
UV2840UV1819
UV329
UV362
UV1694
UV146
Created by KIPDA June 2011 (AHR)Copyright (c) 2011, Kentuckiana Regional Planning & Development Agency (KIPDA). All rights reserved.No part of this may be reproduced or transmitted in any form or by any means,electronic or mechanical, including photocopying or recording, or by any informationstorage or retrieval system, except as expressly permitted in writing by KIPDA.LIMITATION OF LIABILITY: KIPDA has no indication or reason to believe that there areany inaccuracies or defects in information incorporated in this work and make NOREPRESENTATIONS OF ANY KIND, INCLUDING, BUT NOT LIMITED TO, THEWARRANTIES OF MERCHANTIBILITY OR FITNESS FOR A PARTICULAR USE, NORARE ANY SUCH WARRANTIES TO BE IMPLIED, WITH RESPECT TO THEINFORMATION OR DATA, FURNISHED HEREIN.
OLD HENRY ROAD EXTENSION TRAFFIC FORECASTSMODELED AS A COLLECTOR
YEAR 2030 FORECASTS
±
0 0.5 1 1.5 2 2.5 3 3.50.25Miles
§̈¦652
§̈¦652
§̈¦71
2011: 56,6002030 3Ln: 65,1002030 5Ln: 63,900
2011: 69,0002030 3Ln: 70,2002030 5Ln: 70,000
2011: 74,8002030 3Ln: 126,2002030 5Ln: 124,600
2011: 53,5002030 3Ln: 97,4002030 5Ln: 94,600
2011: 50,8002030 3Ln: 96,9002030 5Ln: 93,700
2011: 52,7002030 3Ln: 95,6002030 5Ln: 89,600
2011: 56,6002030 3Ln: 99,9002030 5Ln: 99,600
2011: 18,1002030 3Ln: 38,6002030 5Ln: 36,300 2011: 12,800
2030 3Ln: 13,9002030 5Ln: 12,700
2011: 12,7002030 3Ln: 14,8002030 5Ln: 15,300
2011: 9,0002030 3Ln: 38,2002030 5Ln: 38,000
2011: 7,0002030 3Ln: 30,2002030 5Ln: 28,700
2011: 20,7002030 3Ln: 37,1002030 5Ln: 36,300
2011: 50,7002030 3Ln: 56,8002030 5Ln: 56,100
J e f f e r s o nJ e f f e r s o n
O l d h a mO l d h a m

UV1694
UV1817
UV329
UV841
UV1531
UV1747 UV362
UV1819
UV22
UV146
UV1408
UV1447
UV913
UV3084
UV2840UV1819
UV329
UV362
UV1694
UV146
Created by KIPDA June 2011 (AHR)Copyright (c) 2011, Kentuckiana Regional Planning & Development Agency (KIPDA). All rights reserved.No part of this may be reproduced or transmitted in any form or by any means,electronic or mechanical, including photocopying or recording, or by any informationstorage or retrieval system, except as expressly permitted in writing by KIPDA.LIMITATION OF LIABILITY: KIPDA has no indication or reason to believe that there areany inaccuracies or defects in information incorporated in this work and make NOREPRESENTATIONS OF ANY KIND, INCLUDING, BUT NOT LIMITED TO, THEWARRANTIES OF MERCHANTIBILITY OR FITNESS FOR A PARTICULAR USE, NORARE ANY SUCH WARRANTIES TO BE IMPLIED, WITH RESPECT TO THEINFORMATION OR DATA, FURNISHED HEREIN.
OLD HENRY ROAD EXTENSION TRAFFIC FORECASTSMODELED AS A COLLECTOR
YEAR 2035 FORECASTS
±
0 0.5 1 1.5 2 2.5 3 3.50.25Miles
§̈¦652
§̈¦652
§̈¦71
2011: 56,6002035 3Ln: 67,5002035 5Ln: 66,000
2011: 69,0002035 3Ln: 70,5002035 5Ln: 70,300
2011: 74,8002035 3Ln: 144,8002035 5Ln: 142,500
2011: 53,5002035 3Ln: 114,0002035 5Ln: 109,900
2011: 50,8002035 3Ln: 114,8002035 5Ln: 110,100
2011: 52,7002035 3Ln: 111,8002035 5Ln: 103,000
2011: 56,6002035 3Ln: 116,0002035 5Ln: 115,600
2011: 18,1002035 3Ln: 47,1002035 5Ln: 43,600 2011: 12,800
2035 3Ln: 14,2002035 5Ln: 12,700
2011: 12,7002035 3Ln: 15,4002035 5Ln: 16,100
2011: 9,0002035 3Ln: 55,9002035 5Ln: 55,600
2011: 7,0002035 3Ln: 44,4002035 5Ln: 41,600
2011: 20,7002035 3Ln: 43,3002035 5Ln: 42,100
2011: 50,7002035 3Ln: 58,5002035 5Ln: 57,600
J e f f e r s o nJ e f f e r s o n
O l d h a mO l d h a m