appendix f – traffic forecast memorandum studies and reports... · appendix f – traffic...
TRANSCRIPT
GLASGOW SMALL URBAN AREA STUDY BARREN COUNTY
APPENDIX F – TRAFFIC FORECAST MEMORANDUM
Traffic Forecast Memorandum
V:\1785\active\178554021\transportation\LA 6\transportation\planning\report\Final\Appendices
TRAFFIC FORECAST MEMORANDUM Barren County – Glasgow Small Urban Area Study Item No. N/A Project Description
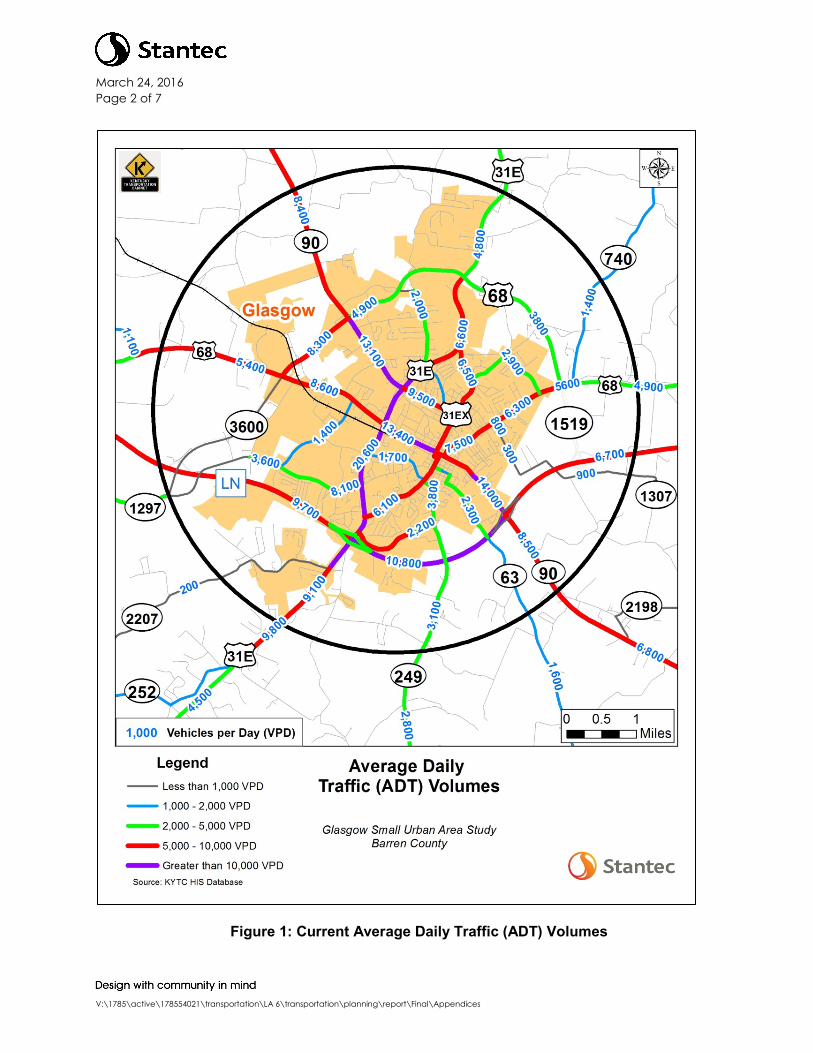
Preliminary traffic forecasts have been developed to assist in the evaluation of improvement concepts for the Small Urban Area (SUA) study for the city of Glasgow, Kentucky in Barren County. The SUA study area includes the city limits of Glasgow which is a little over 38 square miles. The general study area for the project, including KYTC’s most recent average daily traffic (ADT) volumes, is shown on Figure 1. The purpose of the study is to identify and examine transportation issues related to safety and congestion in the city and the surrounding area. The study’s focus and primary goal was to recommend short-term improvements which the KYTC, City of Glasgow, Barren County, and/or private developers can quickly and effectively implement at both an individual intersection level and at an area-wide level. The study also sought to address long-term concerns by examining the future transportation needs and determining options for future improvement projects.
The Division of Planning conducts SUA transportation studies in Kentucky for areas with populations of 5,000 to 50,000. A SUA study provides a thorough examination of an area’s transportation network, including an analysis of existing and future traffic conditions, with the goal of identifying needs and potential solutions to provide a more efficient transportation network. This document summarizes the methodology and preliminary findings for the traffic forecasts.
Warren County Travel Demand Model
Traffic forecasts for the Glasgow SUA were developed from the Warren County Regional Travel Demand Model, which covers Warren County and the six counties surrounding it, including Barren County. The model was completely redeveloped in 2014 based on KYTC’s preferred model structure and contains household and employment information and an updated roadway network for the 2012 base year. As a part of the development of the Glasgow SUA Study, the Glasgow area was further updated to reflect 2015 socioeconomic conditions and roadway updates. Household and employment data for the 2040 forecast year were also revised to more accurately reflect the local development patterns expected to occur.
March 24, 2016 Page 2 of 7
V:\1785\active\178554021\transportation\LA 6\transportation\planning\report\Final\Appendices
Figure 1: Current Average Daily Traffic (ADT) Volumes
March 24, 2016 Page 3 of 7
V:\1785\active\178554021\transportation\LA 6\transportation\planning\report\Final\Appendices
Traffic Analysis Zone (TAZ) and Model Network Revisions
Traffic Analysis Zones (TAZs) form the geographical basis for delineating and organizing the socioeconomic data used by the model to generate the vehicular trips that are assigned to the roadway network. Household and population data, as well as employment and school enrollment, are stored in each zone, with forecast values for households and population used to determine the levels of travel demand throughout the model area. The Warren model is delivered with separate TAZ map files for each model scenario, including the 2012 base year and the 2040 future year.
The TAZ boundaries from the Kentucky Statewide model initially served as the basis for the development of the model’s TAZ boundaries for those zones outside of Warren County, including Barren County. These zones are relatively large and therefore do not necessarily depict the interaction of local trips within a small city the size of Glasgow to the level of detail needed for the SUA. Therefore, KYTC staff redefined the TAZ boundaries, splitting zones to create 46 new TAZs within the general Glasgow SUA study area. Within these redefined zones, households and particularly employment were reapportioned to accurately match their actual locations. These smaller, more defined zones made it possible to represent the distribution of trips between zones more accurately, which meant a better fit of traffic assignments and observed counts on the study area roadway network.
Socioeconomic Data Updates
With an area of 491 square miles, Barren County is the thirteenth largest county in Kentucky. Population projections provided by the Kentucky State Data Center show Barren County has a current population of 44,305 and is anticipated to experience a 20 percent increase in population from 2015 to 2040. Data is not available for individual cities, but Glasgow’s current population of 14,339 is expected to see a similar increase, based on the trend from the 2010 Census to the current estimate.
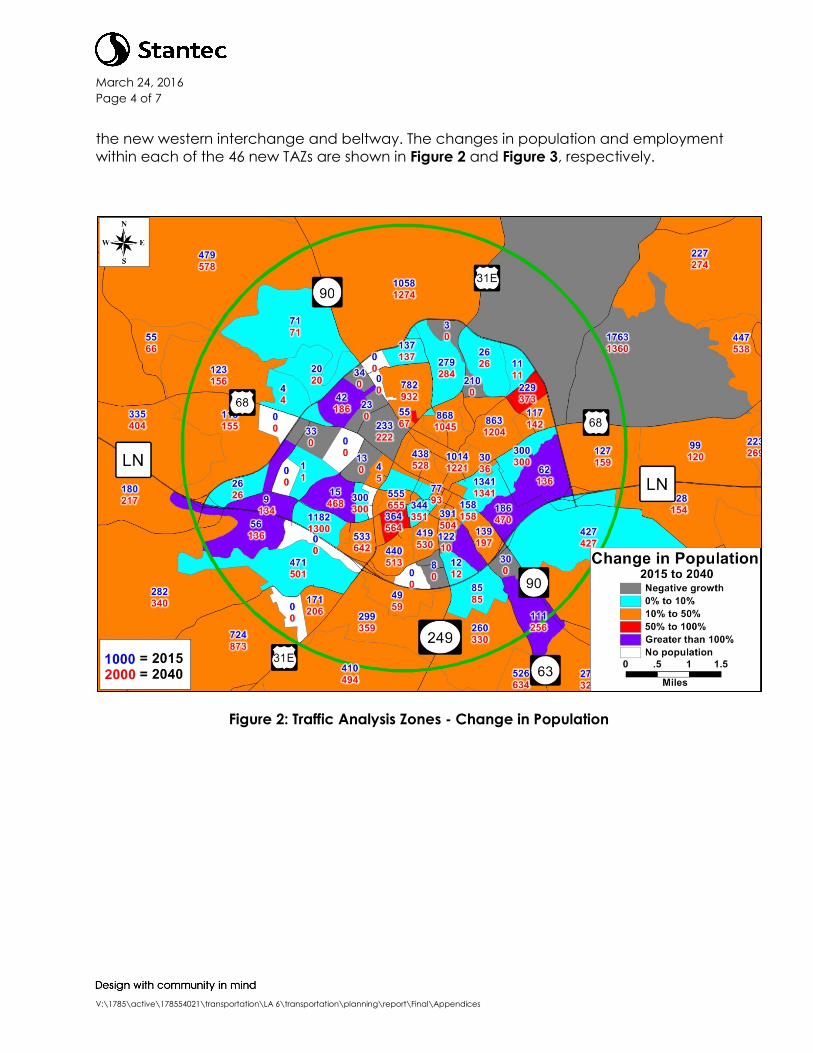
Initially, household growth forecast in Barren County for the 2040 future year model was developed from the county-wide level growth factors calculated from the population forecasts produced by the Kentucky State Data Center. Employment growth was based on a third party forecast using trends from the Bureau of Labor Statistics. The relationship between population growth and employment growth was not well coordinated. The KYTC consulted with local planning staff to update the socioeconomic data for the 2040 future year model within Barren County. The locations of proposed developments were identified and the physical and infrastructure-related constraints influencing the placement of future growth were taken into account in the placement of future households and employment centers. For example, while land is available to the east and northeast near several new school campuses, utilities are not available to support such growth. Water and especially waste water infrastructure will need to be planned and constructed before these areas will develop. In contrast, available land to the west has infrastructure capacity for additional development. As a result, household growth in the 2040 future year was shifted from the east and northeast to the west and south. While the population projections were reasonable, the amount of job growth was tempered and was redirected to grow inside
March 24, 2016 Page 4 of 7
V:\1785\active\178554021\transportation\LA 6\transportation\planning\report\Final\Appendices
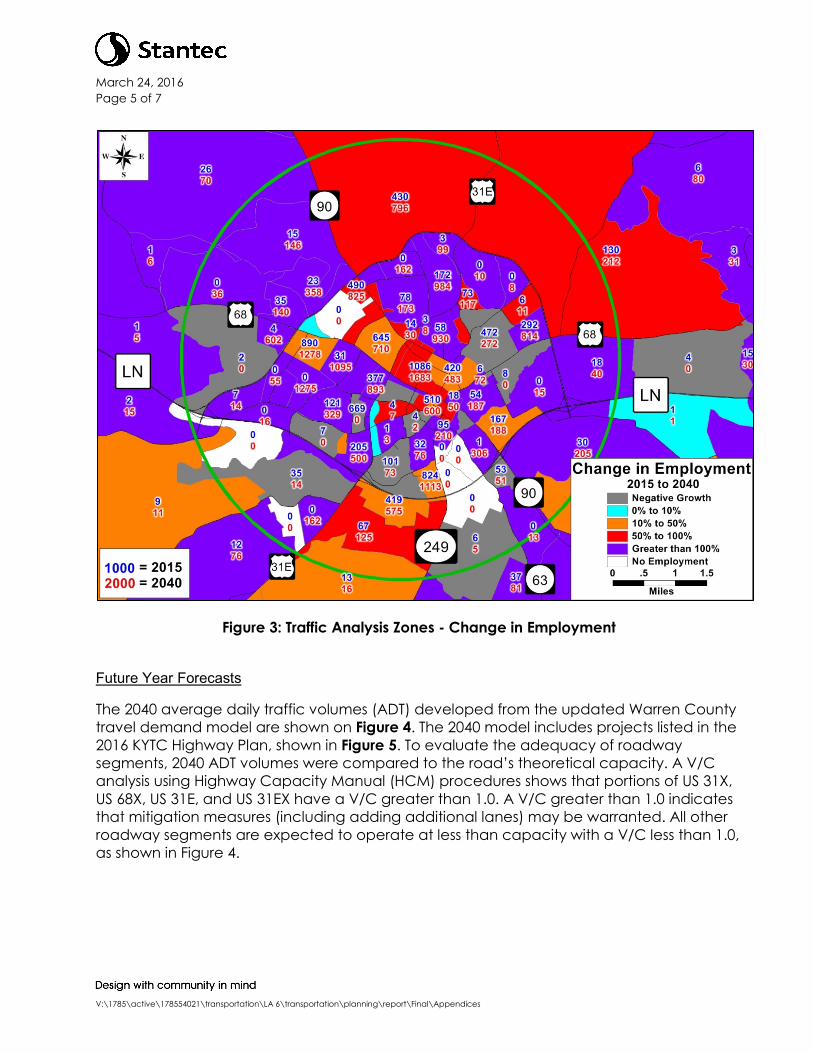
the new western interchange and beltway. The changes in population and employment within each of the 46 new TAZs are shown in Figure 2 and Figure 3, respectively.
Figure 2: Traffic Analysis Zones - Change in Population
March 24, 2016 Page 5 of 7
V:\1785\active\178554021\transportation\LA 6\transportation\planning\report\Final\Appendices
Figure 3: Traffic Analysis Zones - Change in Employment
Future Year Forecasts
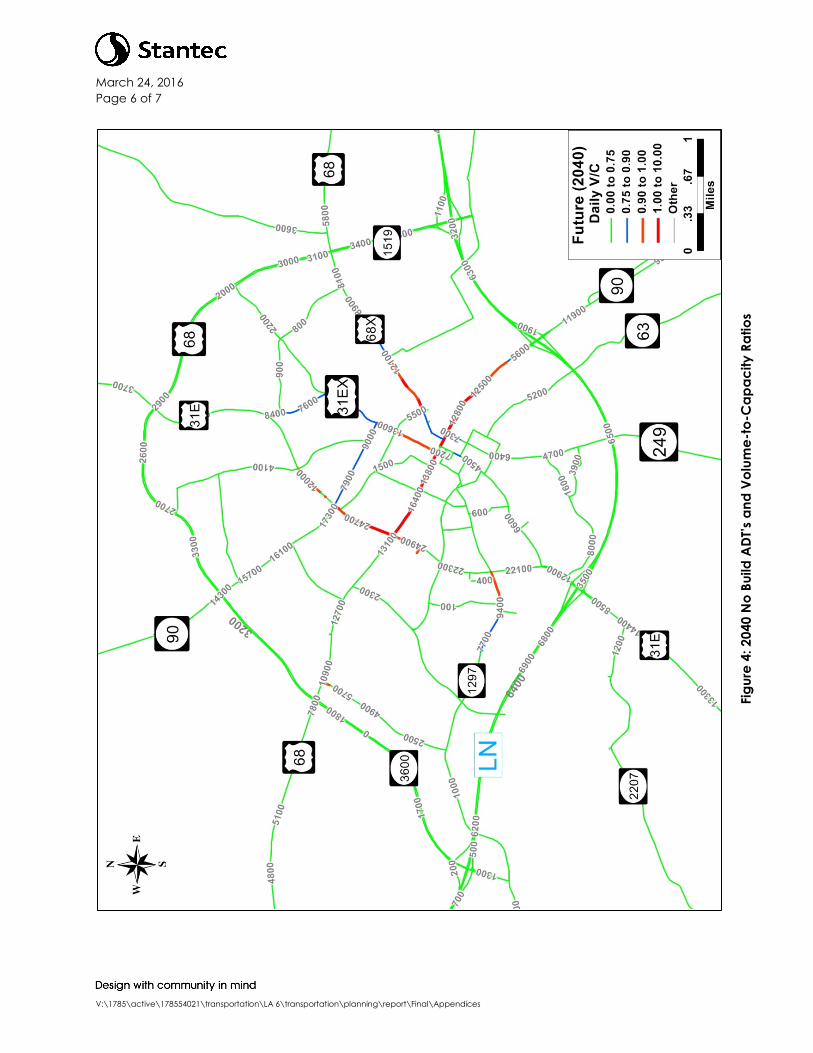
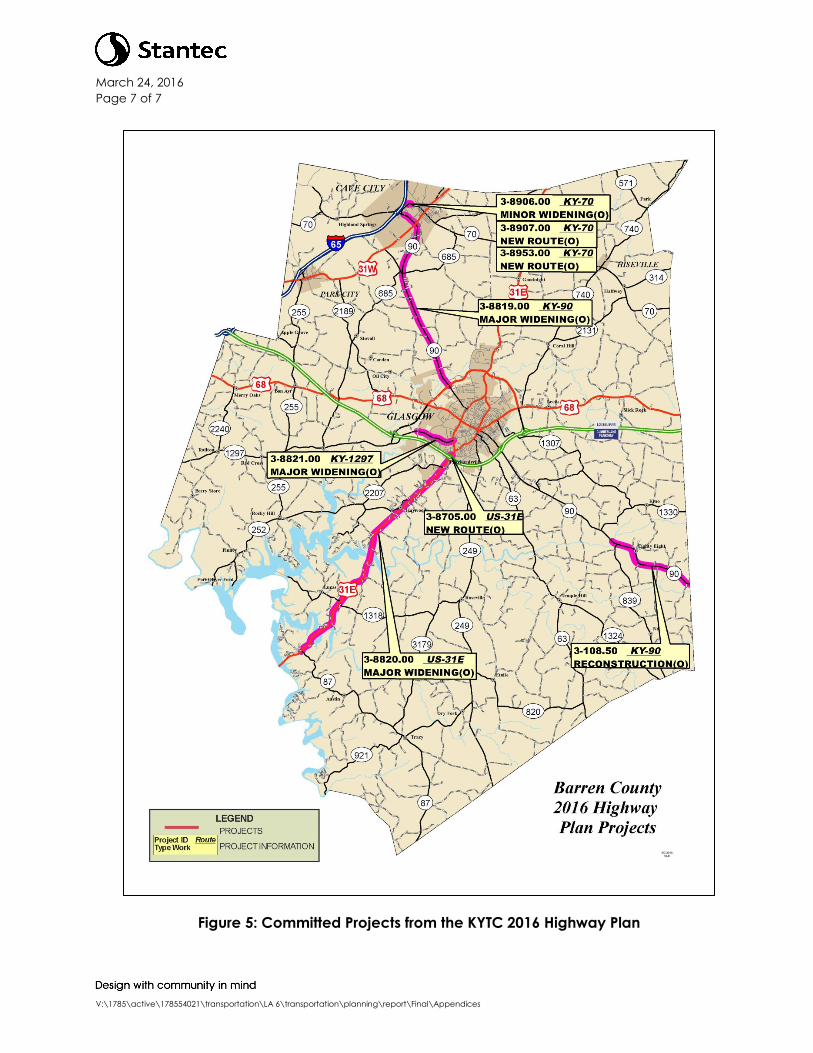
The 2040 average daily traffic volumes (ADT) developed from the updated Warren County travel demand model are shown on Figure 4. The 2040 model includes projects listed in the 2016 KYTC Highway Plan, shown in Figure 5. To evaluate the adequacy of roadway segments, 2040 ADT volumes were compared to the road’s theoretical capacity. A V/C analysis using Highway Capacity Manual (HCM) procedures shows that portions of US 31X, US 68X, US 31E, and US 31EX have a V/C greater than 1.0. A V/C greater than 1.0 indicates that mitigation measures (including adding additional lanes) may be warranted. All other roadway segments are expected to operate at less than capacity with a V/C less than 1.0, as shown in Figure 4.
March 24, 2016 Page 6 of 7
V:\1785\active\178554021\transportation\LA 6\transportation\planning\report\Final\Appendices
Figu
re 4
: 204
0 N
o Bu
ild A
DT’s
and
Vol
ume-
to-C
apac
ity R
atio
s
March 24, 2016 Page 7 of 7
V:\1785\active\178554021\transportation\LA 6\transportation\planning\report\Final\Appendices
Figure 5: Committed Projects from the KYTC 2016 Highway Plan