appendix e short-term traffic analysis intersection ... · v/c ratio 0.38 0.73 0.49 0.67 0.11 0 ......
TRANSCRIPT

Appendix EShort-Term Traffic Analysis Intersection Capacity Analysis

Queues Existing Traffic Conditions-STP OP6: Old Weston Rd & St Clair Ave W Weekday AM Peak Hour
C:\Users\Synchro\Dropbox\LEA\9309\Scenario AM_R02\9309.BASE.AM-OP STP.syn Synchro 8 Report02/04/2015 Page 1
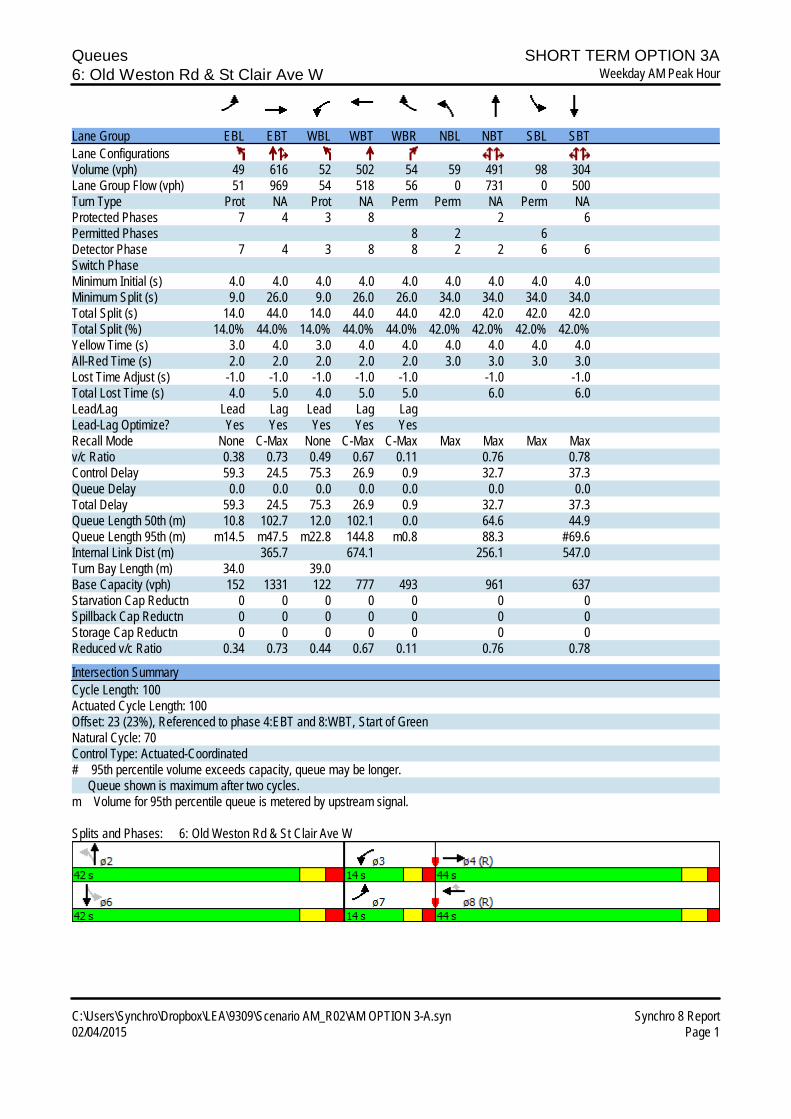
Lane Group EBL EBT WBL WBT WBR NBL NBT SBL SBTLane ConfigurationsVolume (vph) 49 616 52 502 54 59 491 98 304Lane Group Flow (vph) 51 969 54 518 56 0 731 0 500Turn Type Prot NA Prot NA Perm Perm NA Perm NAProtected Phases 7 4 3 8 2 6Permitted Phases 8 2 6Detector Phase 7 4 3 8 8 2 2 6 6Switch PhaseMinimum Initial (s) 4.0 4.0 4.0 4.0 4.0 4.0 4.0 4.0 4.0Minimum Split (s) 9.0 26.0 9.0 26.0 26.0 34.0 34.0 34.0 34.0Total Split (s) 14.0 44.0 14.0 44.0 44.0 42.0 42.0 42.0 42.0Total Split (%) 14.0% 44.0% 14.0% 44.0% 44.0% 42.0% 42.0% 42.0% 42.0%Yellow Time (s) 3.0 4.0 3.0 4.0 4.0 4.0 4.0 4.0 4.0All-Red Time (s) 2.0 2.0 2.0 2.0 2.0 3.0 3.0 3.0 3.0Lost Time Adjust (s) -1.0 -1.0 -1.0 -1.0 -1.0 -1.0 -1.0Total Lost Time (s) 4.0 5.0 4.0 5.0 5.0 6.0 6.0Lead/Lag Lead Lag Lead Lag LagLead-Lag Optimize? Yes Yes Yes Yes YesRecall Mode None C-Max None C-Max C-Max Max Max Max Maxv/c Ratio 0.38 0.73 0.49 0.67 0.11 0.76 0.78Control Delay 52.8 21.6 75.3 26.9 0.9 32.7 37.3Queue Delay 0.0 0.0 0.0 0.0 0.0 0.0 0.0Total Delay 52.8 21.6 75.3 26.9 0.9 32.7 37.3Queue Length 50th (m) 10.7 59.2 12.0 102.1 0.0 64.6 44.9Queue Length 95th (m) m10.7 m43.6 m22.8 144.8 m0.8 88.3 #69.6Internal Link Dist (m) 365.7 674.1 256.1 547.0Turn Bay Length (m) 34.0 39.0Base Capacity (vph) 152 1331 122 777 493 961 637Starvation Cap Reductn 0 0 0 0 0 0 0Spillback Cap Reductn 0 0 0 0 0 0 0Storage Cap Reductn 0 0 0 0 0 0 0Reduced v/c Ratio 0.34 0.73 0.44 0.67 0.11 0.76 0.78
Intersection SummaryCycle Length: 100Actuated Cycle Length: 100Offset: 23 (23%), Referenced to phase 4:EBT and 8:WBT, Start of GreenNatural Cycle: 70Control Type: Actuated-Coordinated# 95th percentile volume exceeds capacity, queue may be longer. Queue shown is maximum after two cycles.m Volume for 95th percentile queue is metered by upstream signal.
Splits and Phases: 6: Old Weston Rd & St Clair Ave W

HCM Signalized Intersection Capacity Analysis Existing Traffic Conditions-STP OP6: Old Weston Rd & St Clair Ave W Weekday AM Peak Hour
C:\Users\Synchro\Dropbox\LEA\9309\Scenario AM_R02\9309.BASE.AM-OP STP.syn Synchro 8 Report02/04/2015 Page 2
Movement EBL EBT EBR WBL WBT WBR NBL NBT NBR SBL SBT SBRLane ConfigurationsVolume (vph) 49 616 324 52 502 54 59 491 159 98 304 83Ideal Flow (vphpl) 1900 1900 1900 1900 1900 1900 1900 1900 1900 1900 1900 1900Lane Width 3.0 3.5 3.0 3.0 3.5 3.0 3.0 3.5 3.0 3.0 3.5 3.0Grade (%) 6% 0% 0% 0%Total Lost time (s) 4.0 5.0 4.0 5.0 5.0 6.0 6.0Lane Util. Factor 1.00 0.95 1.00 1.00 1.00 0.95 0.95Frpb, ped/bikes 1.00 0.96 1.00 1.00 0.73 0.99 0.95Flpb, ped/bikes 1.00 1.00 1.00 1.00 1.00 0.99 1.00Frt 1.00 0.95 1.00 1.00 0.85 0.97 0.97Flt Protected 0.95 1.00 0.95 1.00 1.00 1.00 0.99Satd. Flow (prot) 1527 3015 1221 1842 1036 3095 2900Flt Permitted 0.95 1.00 0.95 1.00 1.00 0.84 0.59Satd. Flow (perm) 1527 3015 1221 1842 1036 2597 1723Peak-hour factor, PHF 0.97 0.97 0.97 0.97 0.97 0.97 0.97 0.97 0.97 0.97 0.97 0.97Adj. Flow (vph) 51 635 334 54 518 56 61 506 164 101 313 86RTOR Reduction (vph) 0 66 0 0 0 33 0 27 0 0 17 0Lane Group Flow (vph) 51 903 0 54 518 23 0 704 0 0 483 0Confl. Peds. (#/hr) 176 60 60 176 145 35 35 145Confl. Bikes (#/hr) 8 3 8 6Heavy Vehicles (%) 7% 5% 5% 38% 2% 6% 15% 8% 0% 15% 10% 10%Bus Blockages (#/hr) 0 0 0 0 0 0 0 8 18 0 7 15Turn Type Prot NA Prot NA Perm Perm NA Perm NAProtected Phases 7 4 3 8 2 6Permitted Phases 8 2 6Actuated Green, G (s) 6.8 40.0 7.0 40.2 40.2 35.0 35.0Effective Green, g (s) 7.8 41.0 8.0 41.2 41.2 36.0 36.0Actuated g/C Ratio 0.08 0.41 0.08 0.41 0.41 0.36 0.36Clearance Time (s) 5.0 6.0 5.0 6.0 6.0 7.0 7.0Vehicle Extension (s) 3.0 3.0 3.0 3.0 3.0 3.0 3.0Lane Grp Cap (vph) 119 1236 97 758 426 934 620v/s Ratio Prot 0.03 c0.30 c0.04 0.28v/s Ratio Perm 0.02 0.27 c0.28v/c Ratio 0.43 0.73 0.56 0.68 0.05 0.75 0.78Uniform Delay, d1 44.0 24.8 44.3 24.1 17.7 28.1 28.5Progression Factor 1.21 0.95 1.44 0.92 0.46 1.00 1.00Incremental Delay, d2 0.2 0.4 5.8 4.3 0.2 5.6 9.3Delay (s) 53.6 23.9 69.6 26.4 8.3 33.7 37.8Level of Service D C E C A C DApproach Delay (s) 25.4 28.5 33.7 37.8Approach LOS C C C D
Intersection SummaryHCM 2000 Control Delay 30.3 HCM 2000 Level of Service CHCM 2000 Volume to Capacity ratio 0.73Actuated Cycle Length (s) 100.0 Sum of lost time (s) 15.0Intersection Capacity Utilization 94.8% ICU Level of Service FAnalysis Period (min) 15c Critical Lane Group
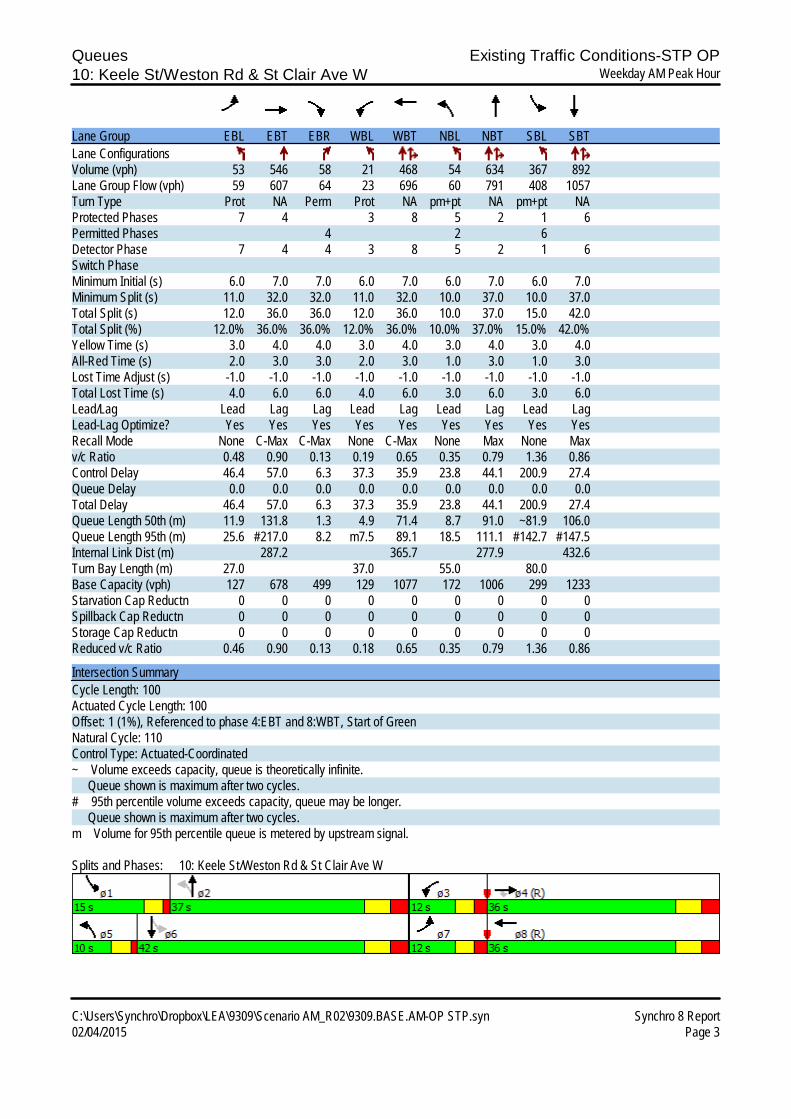
Queues Existing Traffic Conditions-STP OP10: Keele St/Weston Rd & St Clair Ave W Weekday AM Peak Hour
C:\Users\Synchro\Dropbox\LEA\9309\Scenario AM_R02\9309.BASE.AM-OP STP.syn Synchro 8 Report02/04/2015 Page 3
Lane Group EBL EBT EBR WBL WBT NBL NBT SBL SBTLane ConfigurationsVolume (vph) 53 546 58 21 468 54 634 367 892Lane Group Flow (vph) 59 607 64 23 696 60 791 408 1057Turn Type Prot NA Perm Prot NA pm+pt NA pm+pt NAProtected Phases 7 4 3 8 5 2 1 6Permitted Phases 4 2 6Detector Phase 7 4 4 3 8 5 2 1 6Switch PhaseMinimum Initial (s) 6.0 7.0 7.0 6.0 7.0 6.0 7.0 6.0 7.0Minimum Split (s) 11.0 32.0 32.0 11.0 32.0 10.0 37.0 10.0 37.0Total Split (s) 12.0 36.0 36.0 12.0 36.0 10.0 37.0 15.0 42.0Total Split (%) 12.0% 36.0% 36.0% 12.0% 36.0% 10.0% 37.0% 15.0% 42.0%Yellow Time (s) 3.0 4.0 4.0 3.0 4.0 3.0 4.0 3.0 4.0All-Red Time (s) 2.0 3.0 3.0 2.0 3.0 1.0 3.0 1.0 3.0Lost Time Adjust (s) -1.0 -1.0 -1.0 -1.0 -1.0 -1.0 -1.0 -1.0 -1.0Total Lost Time (s) 4.0 6.0 6.0 4.0 6.0 3.0 6.0 3.0 6.0Lead/Lag Lead Lag Lag Lead Lag Lead Lag Lead LagLead-Lag Optimize? Yes Yes Yes Yes Yes Yes Yes Yes YesRecall Mode None C-Max C-Max None C-Max None Max None Maxv/c Ratio 0.48 0.90 0.13 0.19 0.65 0.35 0.79 1.36 0.86Control Delay 46.4 57.0 6.3 37.3 35.9 23.8 44.1 200.9 27.4Queue Delay 0.0 0.0 0.0 0.0 0.0 0.0 0.0 0.0 0.0Total Delay 46.4 57.0 6.3 37.3 35.9 23.8 44.1 200.9 27.4Queue Length 50th (m) 11.9 131.8 1.3 4.9 71.4 8.7 91.0 ~81.9 106.0Queue Length 95th (m) 25.6 #217.0 8.2 m7.5 89.1 18.5 111.1 #142.7 #147.5Internal Link Dist (m) 287.2 365.7 277.9 432.6Turn Bay Length (m) 27.0 37.0 55.0 80.0Base Capacity (vph) 127 678 499 129 1077 172 1006 299 1233Starvation Cap Reductn 0 0 0 0 0 0 0 0 0Spillback Cap Reductn 0 0 0 0 0 0 0 0 0Storage Cap Reductn 0 0 0 0 0 0 0 0 0Reduced v/c Ratio 0.46 0.90 0.13 0.18 0.65 0.35 0.79 1.36 0.86
Intersection SummaryCycle Length: 100Actuated Cycle Length: 100Offset: 1 (1%), Referenced to phase 4:EBT and 8:WBT, Start of GreenNatural Cycle: 110Control Type: Actuated-Coordinated~ Volume exceeds capacity, queue is theoretically infinite. Queue shown is maximum after two cycles.# 95th percentile volume exceeds capacity, queue may be longer. Queue shown is maximum after two cycles.m Volume for 95th percentile queue is metered by upstream signal.
Splits and Phases: 10: Keele St/Weston Rd & St Clair Ave W
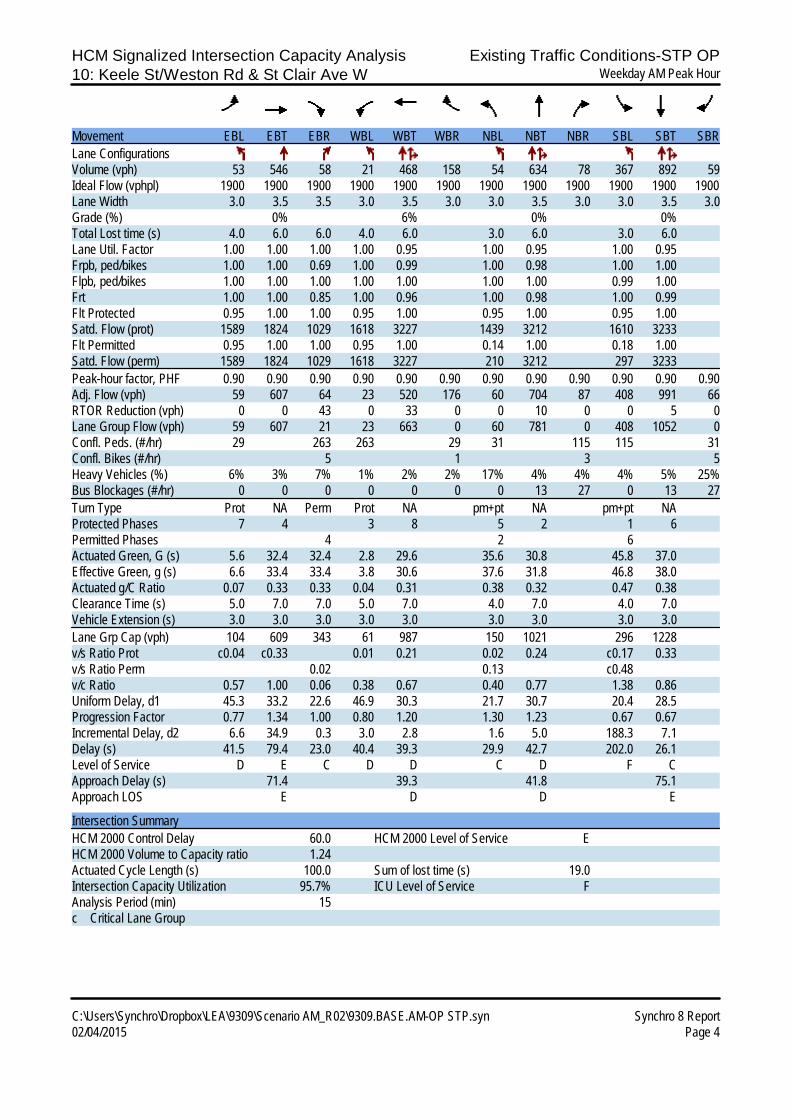
HCM Signalized Intersection Capacity Analysis Existing Traffic Conditions-STP OP10: Keele St/Weston Rd & St Clair Ave W Weekday AM Peak Hour
C:\Users\Synchro\Dropbox\LEA\9309\Scenario AM_R02\9309.BASE.AM-OP STP.syn Synchro 8 Report02/04/2015 Page 4
Movement EBL EBT EBR WBL WBT WBR NBL NBT NBR SBL SBT SBRLane ConfigurationsVolume (vph) 53 546 58 21 468 158 54 634 78 367 892 59Ideal Flow (vphpl) 1900 1900 1900 1900 1900 1900 1900 1900 1900 1900 1900 1900Lane Width 3.0 3.5 3.5 3.0 3.5 3.0 3.0 3.5 3.0 3.0 3.5 3.0Grade (%) 0% 6% 0% 0%Total Lost time (s) 4.0 6.0 6.0 4.0 6.0 3.0 6.0 3.0 6.0Lane Util. Factor 1.00 1.00 1.00 1.00 0.95 1.00 0.95 1.00 0.95Frpb, ped/bikes 1.00 1.00 0.69 1.00 0.99 1.00 0.98 1.00 1.00Flpb, ped/bikes 1.00 1.00 1.00 1.00 1.00 1.00 1.00 0.99 1.00Frt 1.00 1.00 0.85 1.00 0.96 1.00 0.98 1.00 0.99Flt Protected 0.95 1.00 1.00 0.95 1.00 0.95 1.00 0.95 1.00Satd. Flow (prot) 1589 1824 1029 1618 3227 1439 3212 1610 3233Flt Permitted 0.95 1.00 1.00 0.95 1.00 0.14 1.00 0.18 1.00Satd. Flow (perm) 1589 1824 1029 1618 3227 210 3212 297 3233Peak-hour factor, PHF 0.90 0.90 0.90 0.90 0.90 0.90 0.90 0.90 0.90 0.90 0.90 0.90Adj. Flow (vph) 59 607 64 23 520 176 60 704 87 408 991 66RTOR Reduction (vph) 0 0 43 0 33 0 0 10 0 0 5 0Lane Group Flow (vph) 59 607 21 23 663 0 60 781 0 408 1052 0Confl. Peds. (#/hr) 29 263 263 29 31 115 115 31Confl. Bikes (#/hr) 5 1 3 5Heavy Vehicles (%) 6% 3% 7% 1% 2% 2% 17% 4% 4% 4% 5% 25%Bus Blockages (#/hr) 0 0 0 0 0 0 0 13 27 0 13 27Turn Type Prot NA Perm Prot NA pm+pt NA pm+pt NAProtected Phases 7 4 3 8 5 2 1 6Permitted Phases 4 2 6Actuated Green, G (s) 5.6 32.4 32.4 2.8 29.6 35.6 30.8 45.8 37.0Effective Green, g (s) 6.6 33.4 33.4 3.8 30.6 37.6 31.8 46.8 38.0Actuated g/C Ratio 0.07 0.33 0.33 0.04 0.31 0.38 0.32 0.47 0.38Clearance Time (s) 5.0 7.0 7.0 5.0 7.0 4.0 7.0 4.0 7.0Vehicle Extension (s) 3.0 3.0 3.0 3.0 3.0 3.0 3.0 3.0 3.0Lane Grp Cap (vph) 104 609 343 61 987 150 1021 296 1228v/s Ratio Prot c0.04 c0.33 0.01 0.21 0.02 0.24 c0.17 0.33v/s Ratio Perm 0.02 0.13 c0.48v/c Ratio 0.57 1.00 0.06 0.38 0.67 0.40 0.77 1.38 0.86Uniform Delay, d1 45.3 33.2 22.6 46.9 30.3 21.7 30.7 20.4 28.5Progression Factor 0.77 1.34 1.00 0.80 1.20 1.30 1.23 0.67 0.67Incremental Delay, d2 6.6 34.9 0.3 3.0 2.8 1.6 5.0 188.3 7.1Delay (s) 41.5 79.4 23.0 40.4 39.3 29.9 42.7 202.0 26.1Level of Service D E C D D C D F CApproach Delay (s) 71.4 39.3 41.8 75.1Approach LOS E D D E
Intersection SummaryHCM 2000 Control Delay 60.0 HCM 2000 Level of Service EHCM 2000 Volume to Capacity ratio 1.24Actuated Cycle Length (s) 100.0 Sum of lost time (s) 19.0Intersection Capacity Utilization 95.7% ICU Level of Service FAnalysis Period (min) 15c Critical Lane Group

Queues Existing Traffic Conditions6: Old Weston Rd & St Clair Ave W Weekday PM Peak Hour
C:\Users\Synchro\Dropbox\LEA\9309\Scenario PM_R02\9309.Existing.PM.syn Synchro 8 Report02/04/2015 Page 1
Lane Group EBL EBT WBL WBT WBR NBL NBT SBL SBTLane ConfigurationsVolume (vph) 141 443 7 442 183 181 373 84 276Lane Group Flow (vph) 145 815 7 456 189 0 577 0 458Turn Type Prot NA Prot NA Perm Perm NA Perm NAProtected Phases 7 4 3 8 2 6Permitted Phases 8 2 6Detector Phase 7 4 3 8 8 2 2 6 6Switch PhaseMinimum Initial (s) 4.0 4.0 4.0 4.0 4.0 4.0 4.0 4.0 4.0Minimum Split (s) 9.0 26.0 9.0 26.0 26.0 34.0 34.0 34.0 34.0Total Split (s) 14.0 40.0 14.0 40.0 40.0 46.0 46.0 46.0 46.0Total Split (%) 14.0% 40.0% 14.0% 40.0% 40.0% 46.0% 46.0% 46.0% 46.0%Yellow Time (s) 3.0 4.0 3.0 4.0 4.0 4.0 4.0 4.0 4.0All-Red Time (s) 2.0 2.0 2.0 2.0 2.0 3.0 3.0 3.0 3.0Lost Time Adjust (s) -1.0 -1.0 -1.0 -1.0 -1.0 -1.0 -1.0Total Lost Time (s) 4.0 5.0 4.0 5.0 5.0 6.0 6.0Lead/Lag Lead Lag Lead Lag LagLead-Lag Optimize? Yes Yes Yes Yes YesRecall Mode None C-Max None C-Max C-Max Max Max Max Maxv/c Ratio 0.92 0.56 0.06 0.71 0.42 0.64 0.51Control Delay 67.4 11.4 49.4 27.4 9.6 28.3 23.2Queue Delay 0.0 0.0 0.0 0.0 0.0 0.0 0.0Total Delay 67.4 11.4 49.4 27.4 9.6 28.3 23.2Queue Length 50th (m) 31.9 42.3 1.4 49.7 7.7 49.0 33.5Queue Length 95th (m) m32.3 m48.1 m2.4 93.4 m17.3 68.7 49.1Internal Link Dist (m) 365.7 674.1 256.1 547.0Turn Bay Length (m) 34.0 39.0Base Capacity (vph) 157 1451 168 644 452 896 902Starvation Cap Reductn 0 0 0 0 0 0 0Spillback Cap Reductn 0 0 0 0 0 0 0Storage Cap Reductn 0 0 0 0 0 0 0Reduced v/c Ratio 0.92 0.56 0.04 0.71 0.42 0.64 0.51
Intersection SummaryCycle Length: 100Actuated Cycle Length: 100Offset: 69 (69%), Referenced to phase 4:EBT and 8:WBT, Start of GreenNatural Cycle: 70Control Type: Actuated-Coordinatedm Volume for 95th percentile queue is metered by upstream signal.
Splits and Phases: 6: Old Weston Rd & St Clair Ave W

HCM Signalized Intersection Capacity Analysis Existing Traffic Conditions6: Old Weston Rd & St Clair Ave W Weekday PM Peak Hour
C:\Users\Synchro\Dropbox\LEA\9309\Scenario PM_R02\9309.Existing.PM.syn Synchro 8 Report02/04/2015 Page 2
Movement EBL EBT EBR WBL WBT WBR NBL NBT NBR SBL SBT SBRLane ConfigurationsVolume (vph) 141 443 347 7 442 183 181 373 5 84 276 83Ideal Flow (vphpl) 1900 1900 1900 1900 1900 1900 1900 1900 1900 1900 1900 1900Lane Width 3.0 3.5 3.0 3.0 3.5 3.0 3.0 3.5 3.0 3.0 3.5 3.0Grade (%) 6% 0% 0% 0%Total Lost time (s) 4.0 5.0 4.0 5.0 5.0 6.0 6.0Lane Util. Factor 1.00 0.95 1.00 1.00 1.00 0.95 0.95Frpb, ped/bikes 1.00 0.90 1.00 1.00 0.74 1.00 0.97Flpb, ped/bikes 1.00 1.00 1.00 1.00 1.00 0.98 0.98Frt 1.00 0.93 1.00 1.00 0.85 1.00 0.97Flt Protected 0.95 1.00 0.95 1.00 1.00 0.98 0.99Satd. Flow (prot) 1571 2868 1685 1842 1111 3323 3152Flt Permitted 0.95 1.00 0.95 1.00 1.00 0.66 0.69Satd. Flow (perm) 1571 2868 1685 1842 1111 2240 2204Peak-hour factor, PHF 0.97 0.97 0.97 0.97 0.97 0.97 0.97 0.97 0.97 0.97 0.97 0.97Adj. Flow (vph) 145 457 358 7 456 189 187 385 5 87 285 86RTOR Reduction (vph) 0 125 0 0 0 64 0 1 0 0 20 0Lane Group Flow (vph) 145 690 0 7 456 125 0 576 0 0 438 0Confl. Peds. (#/hr) 163 149 149 163 62 307 307 62Confl. Bikes (#/hr) 21 11 18 13Heavy Vehicles (%) 4% 1% 1% 0% 2% 1% 3% 2% 0% 1% 2% 5%Bus Blockages (#/hr) 0 0 0 0 0 0 0 5 10 0 6 12Turn Type Prot NA Prot NA Perm Perm NA Perm NAProtected Phases 7 4 3 8 2 6Permitted Phases 8 2 6Actuated Green, G (s) 9.0 41.6 1.4 34.0 34.0 39.0 39.0Effective Green, g (s) 10.0 42.6 2.4 35.0 35.0 40.0 40.0Actuated g/C Ratio 0.10 0.43 0.02 0.35 0.35 0.40 0.40Clearance Time (s) 5.0 6.0 5.0 6.0 6.0 7.0 7.0Vehicle Extension (s) 3.0 3.0 3.0 3.0 3.0 3.0 3.0Lane Grp Cap (vph) 157 1221 40 644 388 896 881v/s Ratio Prot c0.09 0.24 0.00 c0.25v/s Ratio Perm 0.11 c0.26 0.20v/c Ratio 0.92 0.57 0.17 0.71 0.32 0.64 0.50Uniform Delay, d1 44.6 21.7 47.8 28.1 23.8 24.2 22.5Progression Factor 1.01 0.76 1.13 0.77 0.60 1.00 1.00Incremental Delay, d2 18.4 0.4 1.7 5.2 1.8 3.5 2.0Delay (s) 63.5 16.9 55.6 26.8 16.0 27.8 24.5Level of Service E B E C B C CApproach Delay (s) 23.9 24.0 27.8 24.5Approach LOS C C C C
Intersection SummaryHCM 2000 Control Delay 24.9 HCM 2000 Level of Service CHCM 2000 Volume to Capacity ratio 0.70Actuated Cycle Length (s) 100.0 Sum of lost time (s) 15.0Intersection Capacity Utilization 93.6% ICU Level of Service FAnalysis Period (min) 15c Critical Lane Group

Queues Existing Traffic Conditions10: Keele St/Weston Rd & St Clair Ave W Weekday PM Peak Hour
C:\Users\Synchro\Dropbox\LEA\9309\Scenario PM_R02\9309.Existing.PM.syn Synchro 8 Report02/04/2015 Page 3
Lane Group EBL EBT EBR WBL WBT NBL NBT SBL SBTLane ConfigurationsVolume (vph) 56 475 29 116 535 94 641 268 653Lane Group Flow (vph) 60 505 31 123 628 100 882 285 706Turn Type Prot NA Perm Prot NA pm+pt NA pm+pt NAProtected Phases 7 4 3 8 5 2 1 6Permitted Phases 4 2 6Detector Phase 7 4 4 3 8 5 2 1 6Switch PhaseMinimum Initial (s) 6.0 7.0 7.0 6.0 7.0 6.0 7.0 6.0 7.0Minimum Split (s) 11.0 32.0 32.0 11.0 32.0 10.0 37.0 10.0 37.0Total Split (s) 14.0 37.0 37.0 14.0 37.0 11.0 38.0 11.0 38.0Total Split (%) 14.0% 37.0% 37.0% 14.0% 37.0% 11.0% 38.0% 11.0% 38.0%Yellow Time (s) 3.0 4.0 4.0 3.0 4.0 3.0 4.0 3.0 4.0All-Red Time (s) 2.0 3.0 3.0 2.0 3.0 1.0 3.0 1.0 3.0Lost Time Adjust (s) -1.0 -1.0 -1.0 -1.0 -1.0 -1.0 -1.0 -1.0 -1.0Total Lost Time (s) 4.0 6.0 6.0 4.0 6.0 3.0 6.0 3.0 6.0Lead/Lag Lead Lag Lag Lead Lag Lead Lag Lead LagLead-Lag Optimize? Yes Yes Yes Yes Yes Yes Yes Yes YesRecall Mode Min C-Max C-Max Min C-Max None Max None Maxv/c Ratio 0.40 0.88 0.08 0.77 0.59 0.34 0.88 1.30 0.60Control Delay 50.6 50.6 0.4 88.0 23.5 24.6 46.5 183.4 20.1Queue Delay 0.0 0.0 0.0 0.0 0.0 0.0 0.0 0.0 0.0Total Delay 50.6 50.6 0.4 88.0 23.5 24.6 46.5 183.4 20.1Queue Length 50th (m) 11.6 97.1 0.0 0.0 43.8 11.4 70.9 ~50.6 64.1Queue Length 95th (m) 24.6 #156.1 0.0 m#46.0 54.2 m27.5 #118.7 #103.8 84.3Internal Link Dist (m) 287.2 365.7 277.9 432.6Turn Bay Length (m) 27.0 37.0 55.0 80.0Base Capacity (vph) 165 577 406 160 1069 299 1001 220 1181Starvation Cap Reductn 0 0 0 0 0 0 0 0 0Spillback Cap Reductn 0 0 0 0 0 0 0 0 0Storage Cap Reductn 0 0 0 0 0 0 0 0 0Reduced v/c Ratio 0.36 0.88 0.08 0.77 0.59 0.33 0.88 1.30 0.60
Intersection SummaryCycle Length: 100Actuated Cycle Length: 100Offset: 1 (1%), Referenced to phase 4:EBT and 8:WBT, Start of GreenNatural Cycle: 90Control Type: Actuated-Coordinated~ Volume exceeds capacity, queue is theoretically infinite. Queue shown is maximum after two cycles.# 95th percentile volume exceeds capacity, queue may be longer. Queue shown is maximum after two cycles.m Volume for 95th percentile queue is metered by upstream signal.
Splits and Phases: 10: Keele St/Weston Rd & St Clair Ave W

HCM Signalized Intersection Capacity Analysis Existing Traffic Conditions10: Keele St/Weston Rd & St Clair Ave W Weekday PM Peak Hour
C:\Users\Synchro\Dropbox\LEA\9309\Scenario PM_R02\9309.Existing.PM.syn Synchro 8 Report02/04/2015 Page 4
Movement EBL EBT EBR WBL WBT WBR NBL NBT NBR SBL SBT SBRLane ConfigurationsVolume (vph) 56 475 29 116 535 55 94 641 188 268 653 10Ideal Flow (vphpl) 1900 1900 1900 1900 1900 1900 1900 1900 1900 1900 1900 1900Lane Width 3.0 3.5 3.0 3.0 3.5 3.0 3.0 3.5 3.0 3.0 3.5 3.0Grade (%) 0% 6% 0% 0%Total Lost time (s) 4.0 6.0 6.0 4.0 6.0 3.0 6.0 3.0 6.0Lane Util. Factor 1.00 1.00 1.00 1.00 0.95 1.00 0.95 1.00 0.95Frpb, ped/bikes 1.00 1.00 0.68 1.00 1.00 1.00 0.92 1.00 1.00Flpb, ped/bikes 1.00 1.00 1.00 1.00 1.00 1.00 1.00 0.99 1.00Frt 1.00 1.00 0.85 1.00 0.99 1.00 0.97 1.00 1.00Flt Protected 0.95 1.00 1.00 0.95 1.00 0.95 1.00 0.95 1.00Satd. Flow (prot) 1652 1860 994 1602 3331 1678 3045 1673 3449Flt Permitted 0.95 1.00 1.00 0.95 1.00 0.27 1.00 0.15 1.00Satd. Flow (perm) 1652 1860 994 1602 3331 476 3045 256 3449Peak-hour factor, PHF 0.94 0.94 0.94 0.94 0.94 0.94 0.94 0.94 0.94 0.94 0.94 0.94Adj. Flow (vph) 60 505 31 123 569 59 100 682 200 285 695 11RTOR Reduction (vph) 0 0 22 0 8 0 0 27 0 0 1 0Lane Group Flow (vph) 60 505 9 123 620 0 100 855 0 285 705 0Confl. Peds. (#/hr) 31 303 303 31 56 197 197 56Confl. Bikes (#/hr) 7 3 2 11Heavy Vehicles (%) 2% 1% 3% 2% 2% 2% 0% 3% 2% 0% 2% 10%Bus Blockages (#/hr) 0 0 0 0 0 0 0 8 16 0 5 11Turn Type Prot NA Perm Prot NA pm+pt NA pm+pt NAProtected Phases 7 4 3 8 5 2 1 6Permitted Phases 4 2 6Actuated Green, G (s) 8.1 29.3 29.3 8.9 30.1 37.4 31.8 40.2 33.2Effective Green, g (s) 9.1 30.3 30.3 9.9 31.1 39.4 32.8 42.2 34.2Actuated g/C Ratio 0.09 0.30 0.30 0.10 0.31 0.39 0.33 0.42 0.34Clearance Time (s) 5.0 7.0 7.0 5.0 7.0 4.0 7.0 4.0 7.0Vehicle Extension (s) 3.0 3.0 3.0 3.0 3.0 3.0 3.0 3.0 3.0Lane Grp Cap (vph) 150 563 301 158 1035 266 998 221 1179v/s Ratio Prot 0.04 c0.27 c0.08 0.19 0.02 0.28 c0.10 0.20v/s Ratio Perm 0.01 0.12 c0.44v/c Ratio 0.40 0.90 0.03 0.78 0.60 0.38 0.86 1.29 0.60Uniform Delay, d1 42.9 33.4 24.5 44.0 29.2 20.1 31.4 23.8 27.2Progression Factor 1.00 1.00 1.00 1.46 0.76 1.40 1.21 1.22 0.64Incremental Delay, d2 1.7 19.6 0.2 16.6 2.0 0.7 7.6 157.4 2.0Delay (s) 44.6 52.9 24.7 80.9 24.1 28.8 45.5 186.4 19.5Level of Service D D C F C C D F BApproach Delay (s) 50.6 33.4 43.8 67.5Approach LOS D C D E
Intersection SummaryHCM 2000 Control Delay 49.7 HCM 2000 Level of Service DHCM 2000 Volume to Capacity ratio 1.10Actuated Cycle Length (s) 100.0 Sum of lost time (s) 19.0Intersection Capacity Utilization 88.4% ICU Level of Service EAnalysis Period (min) 15c Critical Lane Group
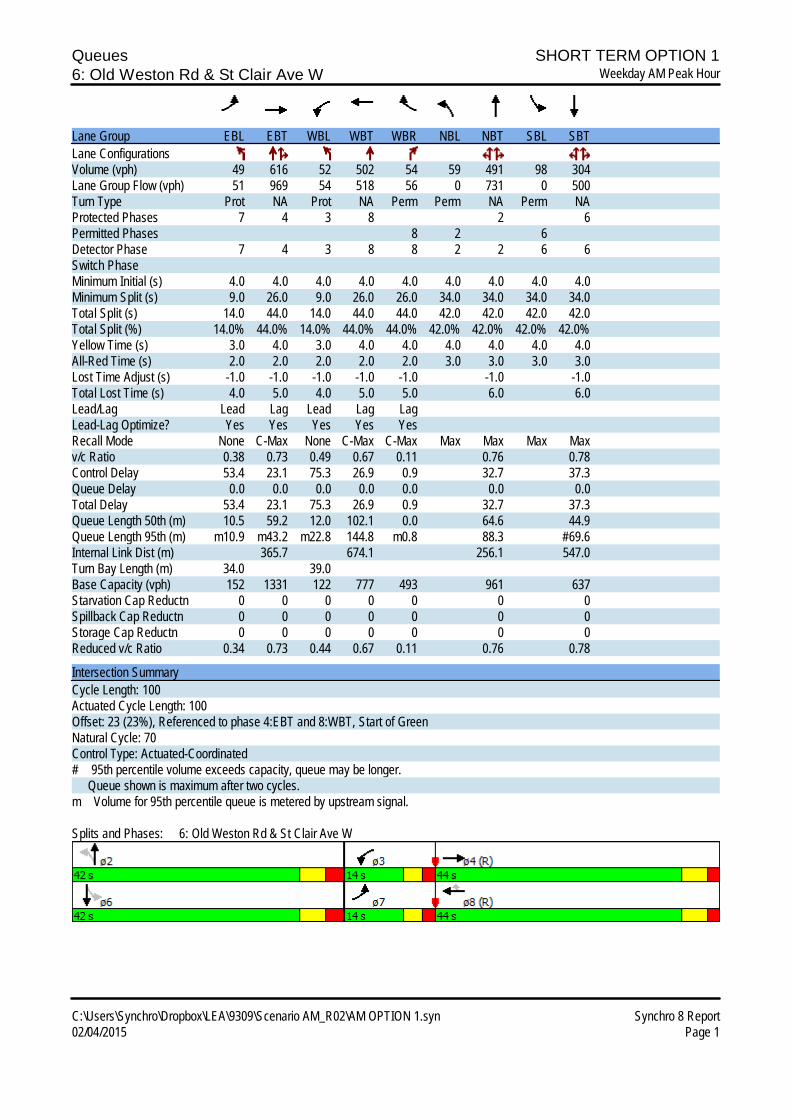
Queues SHORT TERM OPTION 16: Old Weston Rd & St Clair Ave W Weekday AM Peak Hour
C:\Users\Synchro\Dropbox\LEA\9309\Scenario AM_R02\AM OPTION 1.syn Synchro 8 Report02/04/2015 Page 1
Lane Group EBL EBT WBL WBT WBR NBL NBT SBL SBTLane ConfigurationsVolume (vph) 49 616 52 502 54 59 491 98 304Lane Group Flow (vph) 51 969 54 518 56 0 731 0 500Turn Type Prot NA Prot NA Perm Perm NA Perm NAProtected Phases 7 4 3 8 2 6Permitted Phases 8 2 6Detector Phase 7 4 3 8 8 2 2 6 6Switch PhaseMinimum Initial (s) 4.0 4.0 4.0 4.0 4.0 4.0 4.0 4.0 4.0Minimum Split (s) 9.0 26.0 9.0 26.0 26.0 34.0 34.0 34.0 34.0Total Split (s) 14.0 44.0 14.0 44.0 44.0 42.0 42.0 42.0 42.0Total Split (%) 14.0% 44.0% 14.0% 44.0% 44.0% 42.0% 42.0% 42.0% 42.0%Yellow Time (s) 3.0 4.0 3.0 4.0 4.0 4.0 4.0 4.0 4.0All-Red Time (s) 2.0 2.0 2.0 2.0 2.0 3.0 3.0 3.0 3.0Lost Time Adjust (s) -1.0 -1.0 -1.0 -1.0 -1.0 -1.0 -1.0Total Lost Time (s) 4.0 5.0 4.0 5.0 5.0 6.0 6.0Lead/Lag Lead Lag Lead Lag LagLead-Lag Optimize? Yes Yes Yes Yes YesRecall Mode None C-Max None C-Max C-Max Max Max Max Maxv/c Ratio 0.38 0.73 0.49 0.67 0.11 0.76 0.78Control Delay 53.4 23.1 75.3 26.9 0.9 32.7 37.3Queue Delay 0.0 0.0 0.0 0.0 0.0 0.0 0.0Total Delay 53.4 23.1 75.3 26.9 0.9 32.7 37.3Queue Length 50th (m) 10.5 59.2 12.0 102.1 0.0 64.6 44.9Queue Length 95th (m) m10.9 m43.2 m22.8 144.8 m0.8 88.3 #69.6Internal Link Dist (m) 365.7 674.1 256.1 547.0Turn Bay Length (m) 34.0 39.0Base Capacity (vph) 152 1331 122 777 493 961 637Starvation Cap Reductn 0 0 0 0 0 0 0Spillback Cap Reductn 0 0 0 0 0 0 0Storage Cap Reductn 0 0 0 0 0 0 0Reduced v/c Ratio 0.34 0.73 0.44 0.67 0.11 0.76 0.78
Intersection SummaryCycle Length: 100Actuated Cycle Length: 100Offset: 23 (23%), Referenced to phase 4:EBT and 8:WBT, Start of GreenNatural Cycle: 70Control Type: Actuated-Coordinated# 95th percentile volume exceeds capacity, queue may be longer. Queue shown is maximum after two cycles.m Volume for 95th percentile queue is metered by upstream signal.
Splits and Phases: 6: Old Weston Rd & St Clair Ave W

HCM Signalized Intersection Capacity Analysis SHORT TERM OPTION 16: Old Weston Rd & St Clair Ave W Weekday AM Peak Hour
C:\Users\Synchro\Dropbox\LEA\9309\Scenario AM_R02\AM OPTION 1.syn Synchro 8 Report02/04/2015 Page 2
Movement EBL EBT EBR WBL WBT WBR NBL NBT NBR SBL SBT SBRLane ConfigurationsVolume (vph) 49 616 324 52 502 54 59 491 159 98 304 83Ideal Flow (vphpl) 1900 1900 1900 1900 1900 1900 1900 1900 1900 1900 1900 1900Lane Width 3.0 3.5 3.5 3.0 3.5 3.0 3.0 3.5 3.0 3.0 3.5 3.0Grade (%) 6% 0% 0% 0%Total Lost time (s) 4.0 5.0 4.0 5.0 5.0 6.0 6.0Lane Util. Factor 1.00 0.95 1.00 1.00 1.00 0.95 0.95Frpb, ped/bikes 1.00 0.96 1.00 1.00 0.73 0.99 0.95Flpb, ped/bikes 1.00 1.00 1.00 1.00 1.00 0.99 1.00Frt 1.00 0.95 1.00 1.00 0.85 0.97 0.97Flt Protected 0.95 1.00 0.95 1.00 1.00 1.00 0.99Satd. Flow (prot) 1527 3015 1221 1842 1036 3095 2900Flt Permitted 0.95 1.00 0.95 1.00 1.00 0.84 0.59Satd. Flow (perm) 1527 3015 1221 1842 1036 2597 1723Peak-hour factor, PHF 0.97 0.97 0.97 0.97 0.97 0.97 0.97 0.97 0.97 0.97 0.97 0.97Adj. Flow (vph) 51 635 334 54 518 56 61 506 164 101 313 86RTOR Reduction (vph) 0 66 0 0 0 33 0 27 0 0 17 0Lane Group Flow (vph) 51 903 0 54 518 23 0 704 0 0 483 0Confl. Peds. (#/hr) 176 60 60 176 145 35 35 145Confl. Bikes (#/hr) 8 3 8 6Heavy Vehicles (%) 7% 5% 5% 38% 2% 6% 15% 8% 0% 15% 10% 10%Bus Blockages (#/hr) 0 0 0 0 0 0 0 8 18 0 7 15Turn Type Prot NA Prot NA Perm Perm NA Perm NAProtected Phases 7 4 3 8 2 6Permitted Phases 8 2 6Actuated Green, G (s) 6.8 40.0 7.0 40.2 40.2 35.0 35.0Effective Green, g (s) 7.8 41.0 8.0 41.2 41.2 36.0 36.0Actuated g/C Ratio 0.08 0.41 0.08 0.41 0.41 0.36 0.36Clearance Time (s) 5.0 6.0 5.0 6.0 6.0 7.0 7.0Vehicle Extension (s) 3.0 3.0 3.0 3.0 3.0 3.0 3.0Lane Grp Cap (vph) 119 1236 97 758 426 934 620v/s Ratio Prot 0.03 c0.30 c0.04 0.28v/s Ratio Perm 0.02 0.27 c0.28v/c Ratio 0.43 0.73 0.56 0.68 0.05 0.75 0.78Uniform Delay, d1 44.0 24.8 44.3 24.1 17.7 28.1 28.5Progression Factor 1.23 1.01 1.44 0.92 0.46 1.00 1.00Incremental Delay, d2 0.2 0.4 5.8 4.3 0.2 5.6 9.3Delay (s) 54.2 25.5 69.6 26.4 8.3 33.7 37.8Level of Service D C E C A C DApproach Delay (s) 26.9 28.5 33.7 37.8Approach LOS C C C D
Intersection SummaryHCM 2000 Control Delay 30.9 HCM 2000 Level of Service CHCM 2000 Volume to Capacity ratio 0.73Actuated Cycle Length (s) 100.0 Sum of lost time (s) 15.0Intersection Capacity Utilization 94.8% ICU Level of Service FAnalysis Period (min) 15c Critical Lane Group

Queues SHORT TERM OPTION 110: Keele St/Weston Rd & St Clair Ave W Weekday AM Peak Hour
C:\Users\Synchro\Dropbox\LEA\9309\Scenario AM_R02\AM OPTION 1.syn Synchro 8 Report02/04/2015 Page 3
Lane Group EBL EBT EBR WBL WBT NBL NBT SBL SBTLane ConfigurationsVolume (vph) 53 546 58 21 468 54 634 367 892Lane Group Flow (vph) 59 607 64 23 696 60 791 408 1057Turn Type Prot NA Perm Prot NA pm+pt NA pm+pt NAProtected Phases 7 4 3 8 5 2 1 6Permitted Phases 4 2 6Detector Phase 7 4 4 3 8 5 2 1 6Switch PhaseMinimum Initial (s) 6.0 7.0 7.0 6.0 7.0 6.0 7.0 6.0 7.0Minimum Split (s) 11.0 32.0 32.0 11.0 32.0 10.0 37.0 10.0 37.0Total Split (s) 14.0 34.0 34.0 14.0 34.0 10.0 37.0 15.0 42.0Total Split (%) 14.0% 34.0% 34.0% 14.0% 34.0% 10.0% 37.0% 15.0% 42.0%Yellow Time (s) 3.0 4.0 4.0 3.0 4.0 3.0 4.0 3.0 4.0All-Red Time (s) 2.0 3.0 3.0 2.0 3.0 1.0 3.0 1.0 3.0Lost Time Adjust (s) -1.0 -1.0 -1.0 -1.0 -1.0 -1.0 -1.0 -1.0 -1.0Total Lost Time (s) 4.0 6.0 6.0 4.0 6.0 3.0 6.0 3.0 6.0Lead/Lag Lead Lag Lag Lead Lag Lead Lag Lead LagLead-Lag Optimize? Yes Yes Yes Yes Yes Yes Yes Yes YesRecall Mode None C-Max C-Max None C-Max None Max None Maxv/c Ratio 0.41 0.91 0.14 0.18 0.71 0.35 0.78 1.36 0.86Control Delay 40.6 57.9 6.4 35.5 37.8 22.7 42.1 197.8 27.4Queue Delay 0.0 0.0 0.0 0.0 0.0 0.0 0.0 0.0 0.0Total Delay 40.6 57.9 6.4 35.5 37.8 22.7 42.1 197.8 27.4Queue Length 50th (m) 11.7 131.8 1.3 0.0 72.8 8.5 91.0 ~81.1 106.0Queue Length 95th (m) 25.0 #225.1 8.3 m7.2 91.6 18.0 111.1 #141.8 #147.5Internal Link Dist (m) 287.2 365.7 277.9 432.6Turn Bay Length (m) 27.0 37.0 55.0 80.0Base Capacity (vph) 158 668 473 161 978 172 1015 301 1233Starvation Cap Reductn 0 0 0 0 0 0 0 0 0Spillback Cap Reductn 0 0 0 0 0 0 0 0 0Storage Cap Reductn 0 0 0 0 0 0 0 0 0Reduced v/c Ratio 0.37 0.91 0.14 0.14 0.71 0.35 0.78 1.36 0.86
Intersection SummaryCycle Length: 100Actuated Cycle Length: 100Offset: 1 (1%), Referenced to phase 4:EBT and 8:WBT, Start of GreenNatural Cycle: 110Control Type: Actuated-Coordinated~ Volume exceeds capacity, queue is theoretically infinite. Queue shown is maximum after two cycles.# 95th percentile volume exceeds capacity, queue may be longer. Queue shown is maximum after two cycles.m Volume for 95th percentile queue is metered by upstream signal.
Splits and Phases: 10: Keele St/Weston Rd & St Clair Ave W

HCM Signalized Intersection Capacity Analysis SHORT TERM OPTION 110: Keele St/Weston Rd & St Clair Ave W Weekday AM Peak Hour
C:\Users\Synchro\Dropbox\LEA\9309\Scenario AM_R02\AM OPTION 1.syn Synchro 8 Report02/04/2015 Page 4
Movement EBL EBT EBR WBL WBT WBR NBL NBT NBR SBL SBT SBRLane ConfigurationsVolume (vph) 53 546 58 21 468 158 54 634 78 367 892 59Ideal Flow (vphpl) 1900 1900 1900 1900 1900 1900 1900 1900 1900 1900 1900 1900Lane Width 3.0 3.5 3.0 3.0 3.0 3.0 3.0 3.5 3.0 3.0 3.5 3.0Grade (%) 0% 6% 0% 0%Total Lost time (s) 4.0 6.0 6.0 4.0 6.0 3.0 6.0 3.0 6.0Lane Util. Factor 1.00 1.00 1.00 1.00 0.95 1.00 0.95 1.00 0.95Frpb, ped/bikes 1.00 1.00 0.69 1.00 0.99 1.00 0.99 1.00 1.00Flpb, ped/bikes 1.00 1.00 1.00 1.00 1.00 1.00 1.00 1.00 1.00Frt 1.00 1.00 0.85 1.00 0.96 1.00 0.98 1.00 0.99Flt Protected 0.95 1.00 1.00 0.95 1.00 0.95 1.00 0.95 1.00Satd. Flow (prot) 1589 1824 971 1618 3046 1439 3242 1614 3233Flt Permitted 0.95 1.00 1.00 0.95 1.00 0.14 1.00 0.18 1.00Satd. Flow (perm) 1589 1824 971 1618 3046 210 3242 297 3233Peak-hour factor, PHF 0.90 0.90 0.90 0.90 0.90 0.90 0.90 0.90 0.90 0.90 0.90 0.90Adj. Flow (vph) 59 607 64 23 520 176 60 704 87 408 991 66RTOR Reduction (vph) 0 0 43 0 33 0 0 10 0 0 5 0Lane Group Flow (vph) 59 607 21 23 663 0 60 781 0 408 1052 0Confl. Peds. (#/hr) 29 263 263 29 31 115 115 31Confl. Bikes (#/hr) 5 1 3 5Heavy Vehicles (%) 6% 3% 7% 1% 2% 2% 17% 4% 4% 4% 5% 25%Bus Blockages (#/hr) 0 0 0 0 0 0 0 13 27 0 13 27Turn Type Prot NA Perm Prot NA pm+pt NA pm+pt NAProtected Phases 7 4 3 8 5 2 1 6Permitted Phases 4 2 6Actuated Green, G (s) 6.9 31.9 31.9 3.3 28.3 35.6 30.8 45.8 37.0Effective Green, g (s) 7.9 32.9 32.9 4.3 29.3 37.6 31.8 46.8 38.0Actuated g/C Ratio 0.08 0.33 0.33 0.04 0.29 0.38 0.32 0.47 0.38Clearance Time (s) 5.0 7.0 7.0 5.0 7.0 4.0 7.0 4.0 7.0Vehicle Extension (s) 3.0 3.0 3.0 3.0 3.0 3.0 3.0 3.0 3.0Lane Grp Cap (vph) 125 600 319 69 892 150 1030 297 1228v/s Ratio Prot c0.04 c0.33 0.01 0.22 0.02 0.24 c0.16 0.33v/s Ratio Perm 0.02 0.13 c0.48v/c Ratio 0.47 1.01 0.07 0.33 0.74 0.40 0.76 1.37 0.86Uniform Delay, d1 44.1 33.5 23.0 46.5 32.0 21.7 30.7 20.4 28.5Progression Factor 0.76 1.29 1.00 0.78 1.15 1.23 1.17 0.77 0.67Incremental Delay, d2 2.7 38.9 0.4 2.2 4.3 1.6 4.8 186.3 7.1Delay (s) 36.1 82.1 23.4 38.6 41.2 28.3 40.8 201.9 26.1Level of Service D F C D D C D F CApproach Delay (s) 73.2 41.1 39.9 75.0Approach LOS E D D E
Intersection SummaryHCM 2000 Control Delay 60.3 HCM 2000 Level of Service EHCM 2000 Volume to Capacity ratio 1.23Actuated Cycle Length (s) 100.0 Sum of lost time (s) 19.0Intersection Capacity Utilization 95.7% ICU Level of Service FAnalysis Period (min) 15c Critical Lane Group

Queues6: Old Weston Rd & St Clair Ave W 02/04/2015
SHORT TERM OPTION 1 7:00 am 08/10/2014 Weekday PM Peak Hour Synchro 8 ReportPage 1
Lane Group EBL EBT WBL WBT WBR NBL NBT SBL SBTLane ConfigurationsVolume (vph) 130 494 114 386 194 249 323 49 444Lane Group Flow (vph) 134 852 118 398 200 0 641 0 552Turn Type Prot NA Prot NA Perm Perm NA Perm NAProtected Phases 7 4 3 8 2 6Permitted Phases 8 2 6Detector Phase 7 4 3 8 8 2 2 6 6Switch PhaseMinimum Initial (s) 4.0 4.0 4.0 4.0 4.0 4.0 4.0 4.0 4.0Minimum Split (s) 9.0 26.0 9.0 26.0 26.0 34.0 34.0 34.0 34.0Total Split (s) 14.0 40.0 14.0 40.0 40.0 46.0 46.0 46.0 46.0Total Split (%) 14.0% 40.0% 14.0% 40.0% 40.0% 46.0% 46.0% 46.0% 46.0%Yellow Time (s) 3.0 4.0 3.0 4.0 4.0 4.0 4.0 4.0 4.0All-Red Time (s) 2.0 2.0 2.0 2.0 2.0 3.0 3.0 3.0 3.0Lost Time Adjust (s) -1.0 -1.0 -1.0 -1.0 -1.0 -1.0 -1.0Total Lost Time (s) 4.0 5.0 4.0 5.0 5.0 6.0 6.0Lead/Lag Lead Lag Lead Lag LagLead-Lag Optimize? Yes Yes Yes Yes YesRecall Mode None C-Max None C-Max C-Max Max Max Max Maxv/c Ratio 0.85 0.75 0.72 0.62 0.44 0.96dl 0.50Control Delay 50.3 21.3 70.1 28.2 13.4 35.8 24.1Queue Delay 0.0 0.0 0.0 0.0 0.0 0.0 0.0Total Delay 50.3 21.3 70.1 28.2 13.4 35.8 24.1Queue Length 50th (m) 28.8 52.4 25.9 46.0 11.3 58.9 42.8Queue Length 95th (m) m28.1 m50.1 m36.8 m77.0 m19.5 #86.2 59.2Internal Link Dist (m) 365.7 674.1 256.1 547.0Turn Bay Length (m) 34.0 39.0Base Capacity (vph) 157 1137 168 644 452 792 1096Starvation Cap Reductn 0 0 0 0 0 0 0Spillback Cap Reductn 0 0 0 0 0 0 0Storage Cap Reductn 0 0 0 0 0 0 0Reduced v/c Ratio 0.85 0.75 0.70 0.62 0.44 0.81 0.50
Intersection SummaryCycle Length: 100Actuated Cycle Length: 100Offset: 69 (69%), Referenced to phase 4:EBT and 8:WBT, Start of GreenNatural Cycle: 70Control Type: Actuated-Coordinated# 95th percentile volume exceeds capacity, queue may be longer. Queue shown is maximum after two cycles.m Volume for 95th percentile queue is metered by upstream signal.dl Defacto Left Lane. Recode with 1 though lane as a left lane.
Splits and Phases: 6: Old Weston Rd & St Clair Ave W

HCM Signalized Intersection Capacity Analysis6: Old Weston Rd & St Clair Ave W 02/04/2015
SHORT TERM OPTION 1 7:00 am 08/10/2014 Weekday PM Peak Hour Synchro 8 ReportPage 2
Movement EBL EBT EBR WBL WBT WBR NBL NBT NBR SBL SBT SBRLane ConfigurationsVolume (vph) 130 494 333 114 386 194 249 323 49 49 444 42Ideal Flow (vphpl) 1900 1900 1900 1900 1900 1900 1900 1900 1900 1900 1900 1900Lane Width 3.0 3.5 3.0 3.0 3.5 3.0 3.0 3.5 3.0 3.0 3.5 3.0Grade (%) 6% 0% 0% 0%Total Lost time (s) 4.0 5.0 4.0 5.0 5.0 6.0 6.0Lane Util. Factor 1.00 0.95 1.00 1.00 1.00 0.95 0.95Frpb, ped/bikes 1.00 0.90 1.00 1.00 0.74 0.97 0.99Flpb, ped/bikes 1.00 1.00 1.00 1.00 1.00 0.98 0.99Frt 1.00 0.94 1.00 1.00 0.85 0.99 0.99Flt Protected 0.95 1.00 0.95 1.00 1.00 0.98 1.00Satd. Flow (prot) 1571 2911 1685 1842 1111 3201 3326Flt Permitted 0.95 1.00 0.95 1.00 1.00 0.60 0.82Satd. Flow (perm) 1571 2911 1685 1842 1111 1967 2726Peak-hour factor, PHF 0.97 0.97 0.97 0.97 0.97 0.97 0.97 0.97 0.97 0.97 0.97 0.97Adj. Flow (vph) 134 509 343 118 398 200 257 333 51 51 458 43RTOR Reduction (vph) 0 112 0 0 0 64 0 7 0 0 6 0Lane Group Flow (vph) 134 740 0 118 398 136 0 634 0 0 546 0Confl. Peds. (#/hr) 163 149 149 163 62 307 307 62Confl. Bikes (#/hr) 21 11 18 13Heavy Vehicles (%) 4% 1% 1% 0% 2% 1% 3% 2% 0% 1% 2% 5%Bus Blockages (#/hr) 0 0 0 0 0 0 0 5 10 0 6 12Turn Type Prot NA Prot NA Perm Perm NA Perm NAProtected Phases 7 4 3 8 2 6Permitted Phases 8 2 6Actuated Green, G (s) 9.0 34.2 8.8 34.0 34.0 39.0 39.0Effective Green, g (s) 10.0 35.2 9.8 35.0 35.0 40.0 40.0Actuated g/C Ratio 0.10 0.35 0.10 0.35 0.35 0.40 0.40Clearance Time (s) 5.0 6.0 5.0 6.0 6.0 7.0 7.0Vehicle Extension (s) 3.0 3.0 3.0 3.0 3.0 3.0 3.0Lane Grp Cap (vph) 157 1024 165 644 388 786 1090v/s Ratio Prot c0.09 c0.25 0.07 0.22v/s Ratio Perm 0.12 c0.32 0.20v/c Ratio 0.85 0.72 0.72 0.62 0.35 0.96dl 0.50Uniform Delay, d1 44.3 28.2 43.7 27.0 24.1 26.6 22.5Progression Factor 0.97 0.92 1.18 0.91 0.86 1.00 1.00Incremental Delay, d2 4.3 0.4 10.1 3.2 1.8 8.7 1.6Delay (s) 47.0 26.2 61.8 27.6 22.6 35.3 24.2Level of Service D C E C C D CApproach Delay (s) 29.0 31.8 35.3 24.2Approach LOS C C D C
Intersection SummaryHCM 2000 Control Delay 30.2 HCM 2000 Level of Service CHCM 2000 Volume to Capacity ratio 0.78Actuated Cycle Length (s) 100.0 Sum of lost time (s) 15.0Intersection Capacity Utilization 96.0% ICU Level of Service FAnalysis Period (min) 15dl Defacto Left Lane. Recode with 1 though lane as a left lane.c Critical Lane Group

Queues10: Keele St/Weston Rd & St Clair Ave W 02/04/2015
SHORT TERM OPTION 1 7:00 am 08/10/2014 Weekday PM Peak Hour Synchro 8 ReportPage 3
Lane Group EBL EBT EBR WBL WBT NBL NBT SBL SBTLane ConfigurationsVolume (vph) 99 498 36 50 470 96 665 374 601Lane Group Flow (vph) 105 530 38 53 683 102 801 398 689Turn Type Prot NA Perm Prot NA pm+pt NA pm+pt NAProtected Phases 7 4 3 8 5 2 1 6Permitted Phases 4 2 6Detector Phase 7 4 4 3 8 5 2 1 6Switch PhaseMinimum Initial (s) 6.0 7.0 7.0 6.0 7.0 6.0 7.0 6.0 7.0Minimum Split (s) 11.0 32.0 32.0 11.0 32.0 10.0 37.0 10.0 37.0Total Split (s) 11.0 34.0 34.0 11.0 34.0 10.0 37.0 18.0 45.0Total Split (%) 11.0% 34.0% 34.0% 11.0% 34.0% 10.0% 37.0% 18.0% 45.0%Yellow Time (s) 3.0 4.0 4.0 3.0 4.0 3.0 4.0 3.0 4.0All-Red Time (s) 2.0 3.0 3.0 2.0 3.0 1.0 3.0 1.0 3.0Lost Time Adjust (s) -1.0 -1.0 -1.0 -1.0 -1.0 -1.0 -1.0 -1.0 -1.0Total Lost Time (s) 4.0 6.0 6.0 4.0 6.0 3.0 6.0 3.0 6.0Lead/Lag Lead Lag Lag Lead Lag Lead Lag Lead LagLead-Lag Optimize? Yes Yes Yes Yes Yes Yes Yes Yes YesRecall Mode Min C-Max C-Max Min C-Max None Max None Maxv/c Ratio 0.91 1.02 0.09 0.47 0.77 0.29 0.78 1.11 0.49Control Delay 111.4 81.4 0.4 73.2 30.0 19.6 40.8 100.7 13.9Queue Delay 0.0 0.0 0.0 0.0 0.0 0.0 0.0 0.0 0.0Total Delay 111.4 81.4 0.4 73.2 30.0 19.6 40.8 100.7 13.9Queue Length 50th (m) 21.7 ~111.4 0.0 0.0 63.3 9.8 59.2 ~62.2 54.8Queue Length 95th (m) #54.3 #179.6 0.0 m0.0 m74.4 26.6 97.1 #122.6 45.9Internal Link Dist (m) 287.2 365.7 277.9 432.6Turn Bay Length (m) 27.0 37.0 55.0 80.0Base Capacity (vph) 115 520 411 112 886 348 1024 359 1395Starvation Cap Reductn 0 0 0 0 0 0 0 0 0Spillback Cap Reductn 0 0 0 0 0 0 0 0 0Storage Cap Reductn 0 0 0 0 0 0 0 0 0Reduced v/c Ratio 0.91 1.02 0.09 0.47 0.77 0.29 0.78 1.11 0.49
Intersection SummaryCycle Length: 100Actuated Cycle Length: 100Offset: 1 (1%), Referenced to phase 4:EBT and 8:WBT, Start of GreenNatural Cycle: 100Control Type: Actuated-Coordinated~ Volume exceeds capacity, queue is theoretically infinite. Queue shown is maximum after two cycles.# 95th percentile volume exceeds capacity, queue may be longer. Queue shown is maximum after two cycles.m Volume for 95th percentile queue is metered by upstream signal.
Splits and Phases: 10: Keele St/Weston Rd & St Clair Ave W
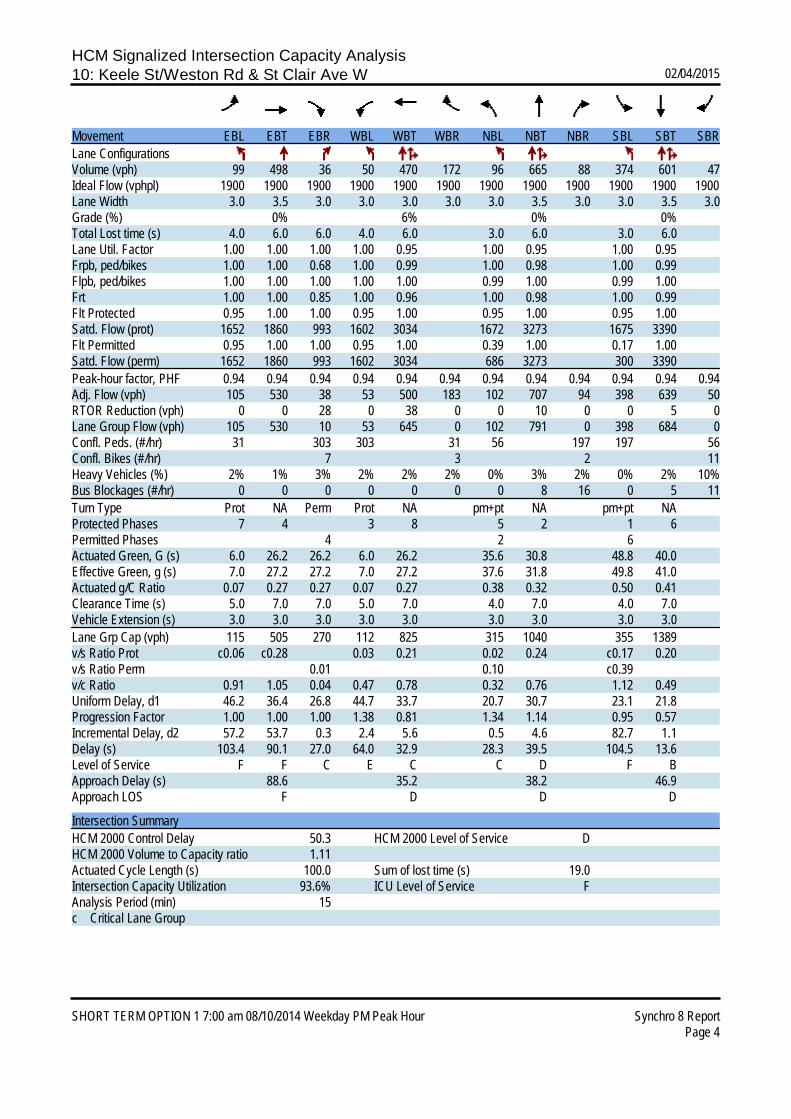
HCM Signalized Intersection Capacity Analysis10: Keele St/Weston Rd & St Clair Ave W 02/04/2015
SHORT TERM OPTION 1 7:00 am 08/10/2014 Weekday PM Peak Hour Synchro 8 ReportPage 4
Movement EBL EBT EBR WBL WBT WBR NBL NBT NBR SBL SBT SBRLane ConfigurationsVolume (vph) 99 498 36 50 470 172 96 665 88 374 601 47Ideal Flow (vphpl) 1900 1900 1900 1900 1900 1900 1900 1900 1900 1900 1900 1900Lane Width 3.0 3.5 3.0 3.0 3.0 3.0 3.0 3.5 3.0 3.0 3.5 3.0Grade (%) 0% 6% 0% 0%Total Lost time (s) 4.0 6.0 6.0 4.0 6.0 3.0 6.0 3.0 6.0Lane Util. Factor 1.00 1.00 1.00 1.00 0.95 1.00 0.95 1.00 0.95Frpb, ped/bikes 1.00 1.00 0.68 1.00 0.99 1.00 0.98 1.00 0.99Flpb, ped/bikes 1.00 1.00 1.00 1.00 1.00 0.99 1.00 0.99 1.00Frt 1.00 1.00 0.85 1.00 0.96 1.00 0.98 1.00 0.99Flt Protected 0.95 1.00 1.00 0.95 1.00 0.95 1.00 0.95 1.00Satd. Flow (prot) 1652 1860 993 1602 3034 1672 3273 1675 3390Flt Permitted 0.95 1.00 1.00 0.95 1.00 0.39 1.00 0.17 1.00Satd. Flow (perm) 1652 1860 993 1602 3034 686 3273 300 3390Peak-hour factor, PHF 0.94 0.94 0.94 0.94 0.94 0.94 0.94 0.94 0.94 0.94 0.94 0.94Adj. Flow (vph) 105 530 38 53 500 183 102 707 94 398 639 50RTOR Reduction (vph) 0 0 28 0 38 0 0 10 0 0 5 0Lane Group Flow (vph) 105 530 10 53 645 0 102 791 0 398 684 0Confl. Peds. (#/hr) 31 303 303 31 56 197 197 56Confl. Bikes (#/hr) 7 3 2 11Heavy Vehicles (%) 2% 1% 3% 2% 2% 2% 0% 3% 2% 0% 2% 10%Bus Blockages (#/hr) 0 0 0 0 0 0 0 8 16 0 5 11Turn Type Prot NA Perm Prot NA pm+pt NA pm+pt NAProtected Phases 7 4 3 8 5 2 1 6Permitted Phases 4 2 6Actuated Green, G (s) 6.0 26.2 26.2 6.0 26.2 35.6 30.8 48.8 40.0Effective Green, g (s) 7.0 27.2 27.2 7.0 27.2 37.6 31.8 49.8 41.0Actuated g/C Ratio 0.07 0.27 0.27 0.07 0.27 0.38 0.32 0.50 0.41Clearance Time (s) 5.0 7.0 7.0 5.0 7.0 4.0 7.0 4.0 7.0Vehicle Extension (s) 3.0 3.0 3.0 3.0 3.0 3.0 3.0 3.0 3.0Lane Grp Cap (vph) 115 505 270 112 825 315 1040 355 1389v/s Ratio Prot c0.06 c0.28 0.03 0.21 0.02 0.24 c0.17 0.20v/s Ratio Perm 0.01 0.10 c0.39v/c Ratio 0.91 1.05 0.04 0.47 0.78 0.32 0.76 1.12 0.49Uniform Delay, d1 46.2 36.4 26.8 44.7 33.7 20.7 30.7 23.1 21.8Progression Factor 1.00 1.00 1.00 1.38 0.81 1.34 1.14 0.95 0.57Incremental Delay, d2 57.2 53.7 0.3 2.4 5.6 0.5 4.6 82.7 1.1Delay (s) 103.4 90.1 27.0 64.0 32.9 28.3 39.5 104.5 13.6Level of Service F F C E C C D F BApproach Delay (s) 88.6 35.2 38.2 46.9Approach LOS F D D D
Intersection SummaryHCM 2000 Control Delay 50.3 HCM 2000 Level of Service DHCM 2000 Volume to Capacity ratio 1.11Actuated Cycle Length (s) 100.0 Sum of lost time (s) 19.0Intersection Capacity Utilization 93.6% ICU Level of Service FAnalysis Period (min) 15c Critical Lane Group

Queues SHORT TERM OPTION 26: Old Weston Rd & St Clair Ave W Weekday AM Peak Hour
C:\Users\Synchro\Dropbox\LEA\9309\Scenario AM_R02\AM OPTION 2.syn Synchro 8 Report02/04/2015 Page 1
Lane Group EBL EBT WBL WBT WBR NBL NBT SBL SBTLane ConfigurationsVolume (vph) 49 616 52 502 54 59 491 98 304Lane Group Flow (vph) 51 969 54 518 56 0 731 0 500Turn Type Prot NA Prot NA Perm Perm NA Perm NAProtected Phases 7 4 3 8 2 6Permitted Phases 8 2 6Detector Phase 7 4 3 8 8 2 2 6 6Switch PhaseMinimum Initial (s) 4.0 4.0 4.0 4.0 4.0 4.0 4.0 4.0 4.0Minimum Split (s) 9.0 26.0 9.0 26.0 26.0 34.0 34.0 34.0 34.0Total Split (s) 11.0 47.0 11.0 47.0 47.0 42.0 42.0 42.0 42.0Total Split (%) 11.0% 47.0% 11.0% 47.0% 47.0% 42.0% 42.0% 42.0% 42.0%Yellow Time (s) 3.0 4.0 3.0 4.0 4.0 4.0 4.0 4.0 4.0All-Red Time (s) 2.0 2.0 2.0 2.0 2.0 3.0 3.0 3.0 3.0Lost Time Adjust (s) -1.0 -1.0 -1.0 -1.0 -1.0 -1.0 -1.0Total Lost Time (s) 4.0 5.0 4.0 5.0 5.0 6.0 6.0Lead/Lag Lead Lag Lead Lag LagLead-Lag Optimize? Yes Yes Yes Yes YesRecall Mode None C-Max None C-Max C-Max Max Max Max Maxv/c Ratio 0.49 0.69 0.64 0.64 0.11 0.76 0.78Control Delay 55.8 21.1 92.1 23.9 0.9 32.7 37.3Queue Delay 0.0 0.0 0.0 0.0 0.0 0.0 0.0Total Delay 55.8 21.1 92.1 23.9 0.9 32.7 37.3Queue Length 50th (m) 10.9 58.5 12.0 96.2 0.0 64.6 44.9Queue Length 95th (m) m11.0 m43.6 m#26.7 142.4 m0.8 88.3 #69.6Internal Link Dist (m) 365.7 674.1 256.1 547.0Turn Bay Length (m) 34.0 39.0Base Capacity (vph) 106 1398 85 814 512 961 637Starvation Cap Reductn 0 0 0 0 0 0 0Spillback Cap Reductn 0 0 0 0 0 0 0Storage Cap Reductn 0 0 0 0 0 0 0Reduced v/c Ratio 0.48 0.69 0.64 0.64 0.11 0.76 0.78
Intersection SummaryCycle Length: 100Actuated Cycle Length: 100Offset: 23 (23%), Referenced to phase 4:EBT and 8:WBT, Start of GreenNatural Cycle: 70Control Type: Actuated-Coordinated# 95th percentile volume exceeds capacity, queue may be longer. Queue shown is maximum after two cycles.m Volume for 95th percentile queue is metered by upstream signal.
Splits and Phases: 6: Old Weston Rd & St Clair Ave W

HCM Signalized Intersection Capacity Analysis SHORT TERM OPTION 26: Old Weston Rd & St Clair Ave W Weekday AM Peak Hour
C:\Users\Synchro\Dropbox\LEA\9309\Scenario AM_R02\AM OPTION 2.syn Synchro 8 Report02/04/2015 Page 2
Movement EBL EBT EBR WBL WBT WBR NBL NBT NBR SBL SBT SBRLane ConfigurationsVolume (vph) 49 616 324 52 502 54 59 491 159 98 304 83Ideal Flow (vphpl) 1900 1900 1900 1900 1900 1900 1900 1900 1900 1900 1900 1900Lane Width 3.0 3.5 3.0 3.0 3.5 3.0 3.0 3.5 3.0 3.0 3.5 3.0Grade (%) 6% 0% 0% 0%Total Lost time (s) 4.0 5.0 4.0 5.0 5.0 6.0 6.0Lane Util. Factor 1.00 0.95 1.00 1.00 1.00 0.95 0.95Frpb, ped/bikes 1.00 0.96 1.00 1.00 0.73 0.99 0.95Flpb, ped/bikes 1.00 1.00 1.00 1.00 1.00 0.99 1.00Frt 1.00 0.95 1.00 1.00 0.85 0.97 0.97Flt Protected 0.95 1.00 0.95 1.00 1.00 1.00 0.99Satd. Flow (prot) 1527 3016 1221 1842 1036 3095 2900Flt Permitted 0.95 1.00 0.95 1.00 1.00 0.84 0.59Satd. Flow (perm) 1527 3016 1221 1842 1036 2597 1723Peak-hour factor, PHF 0.97 0.97 0.97 0.97 0.97 0.97 0.97 0.97 0.97 0.97 0.97 0.97Adj. Flow (vph) 51 635 334 54 518 56 61 506 164 101 313 86RTOR Reduction (vph) 0 67 0 0 0 32 0 27 0 0 17 0Lane Group Flow (vph) 51 902 0 54 518 24 0 704 0 0 483 0Confl. Peds. (#/hr) 176 60 60 176 145 35 35 145Confl. Bikes (#/hr) 8 3 8 6Heavy Vehicles (%) 7% 5% 5% 38% 2% 6% 15% 8% 0% 15% 10% 10%Bus Blockages (#/hr) 0 0 0 0 0 0 0 8 18 0 7 15Turn Type Prot NA Prot NA Perm Perm NA Perm NAProtected Phases 7 4 3 8 2 6Permitted Phases 8 2 6Actuated Green, G (s) 4.8 42.2 4.8 42.2 42.2 35.0 35.0Effective Green, g (s) 5.8 43.2 5.8 43.2 43.2 36.0 36.0Actuated g/C Ratio 0.06 0.43 0.06 0.43 0.43 0.36 0.36Clearance Time (s) 5.0 6.0 5.0 6.0 6.0 7.0 7.0Vehicle Extension (s) 3.0 3.0 3.0 3.0 3.0 3.0 3.0Lane Grp Cap (vph) 88 1302 70 795 447 934 620v/s Ratio Prot 0.03 c0.30 c0.04 0.28v/s Ratio Perm 0.02 0.27 c0.28v/c Ratio 0.58 0.69 0.77 0.65 0.05 0.75 0.78Uniform Delay, d1 45.9 23.0 46.4 22.5 16.5 28.1 28.5Progression Factor 1.19 1.02 1.43 0.89 0.52 1.00 1.00Incremental Delay, d2 0.8 0.3 35.3 3.6 0.2 5.6 9.3Delay (s) 55.7 23.7 101.7 23.6 8.7 33.7 37.8Level of Service E C F C A C DApproach Delay (s) 25.3 29.0 33.7 37.8Approach LOS C C C D
Intersection SummaryHCM 2000 Control Delay 30.4 HCM 2000 Level of Service CHCM 2000 Volume to Capacity ratio 0.73Actuated Cycle Length (s) 100.0 Sum of lost time (s) 15.0Intersection Capacity Utilization 94.8% ICU Level of Service FAnalysis Period (min) 15c Critical Lane Group

Queues SHORT TERM OPTION 210: Keele St/Weston Rd & St Clair Ave W Weekday AM Peak Hour
C:\Users\Synchro\Dropbox\LEA\9309\Scenario AM_R02\AM OPTION 2.syn Synchro 8 Report02/04/2015 Page 3
Lane Group EBL EBT EBR WBL WBT NBL NBT SBL SBTLane ConfigurationsVolume (vph) 53 546 58 21 468 54 634 367 892Lane Group Flow (vph) 59 607 64 23 696 60 791 408 1057Turn Type Prot NA Perm Prot NA pm+pt NA pm+pt NAProtected Phases 7 4 3 8 5 2 1 6Permitted Phases 4 2 6Detector Phase 7 4 4 3 8 5 2 1 6Switch PhaseMinimum Initial (s) 6.0 7.0 7.0 6.0 7.0 6.0 7.0 6.0 7.0Minimum Split (s) 11.0 32.0 32.0 11.0 32.0 10.0 37.0 10.0 37.0Total Split (s) 11.0 37.0 37.0 11.0 37.0 10.0 37.0 15.0 42.0Total Split (%) 11.0% 37.0% 37.0% 11.0% 37.0% 10.0% 37.0% 15.0% 42.0%Yellow Time (s) 3.0 4.0 4.0 3.0 4.0 3.0 4.0 3.0 4.0All-Red Time (s) 2.0 3.0 3.0 2.0 3.0 1.0 3.0 1.0 3.0Lost Time Adjust (s) -1.0 -1.0 -1.0 -1.0 -1.0 -1.0 -1.0 -1.0 -1.0Total Lost Time (s) 4.0 6.0 6.0 4.0 6.0 3.0 6.0 3.0 6.0Lead/Lag Lead Lag Lag Lead Lag Lead Lag Lead LagLead-Lag Optimize? Yes Yes Yes Yes Yes Yes Yes Yes YesRecall Mode None C-Max C-Max None C-Max None Max None Maxv/c Ratio 0.53 0.88 0.13 0.20 0.67 0.35 0.79 1.36 0.86Control Delay 52.2 56.1 6.4 39.1 35.8 24.3 44.9 200.6 27.4Queue Delay 0.0 0.0 0.0 0.0 0.0 0.0 0.0 0.0 0.0Total Delay 52.2 56.1 6.4 39.1 35.8 24.3 44.9 200.6 27.4Queue Length 50th (m) 12.1 131.8 1.3 4.8 70.5 8.9 91.0 ~82.7 106.0Queue Length 95th (m) #28.9 #213.0 8.3 m8.0 89.2 18.8 111.1 #142.7 #147.5Internal Link Dist (m) 287.2 365.7 277.9 432.6Turn Bay Length (m) 27.0 37.0 55.0 80.0Base Capacity (vph) 111 686 480 113 1043 172 1006 299 1233Starvation Cap Reductn 0 0 0 0 0 0 0 0 0Spillback Cap Reductn 0 0 0 0 0 0 0 0 0Storage Cap Reductn 0 0 0 0 0 0 0 0 0Reduced v/c Ratio 0.53 0.88 0.13 0.20 0.67 0.35 0.79 1.36 0.86
Intersection SummaryCycle Length: 100Actuated Cycle Length: 100Offset: 1 (1%), Referenced to phase 4:EBT and 8:WBT, Start of GreenNatural Cycle: 110Control Type: Actuated-Coordinated~ Volume exceeds capacity, queue is theoretically infinite. Queue shown is maximum after two cycles.# 95th percentile volume exceeds capacity, queue may be longer. Queue shown is maximum after two cycles.m Volume for 95th percentile queue is metered by upstream signal.
Splits and Phases: 10: Keele St/Weston Rd & St Clair Ave W
HCM Signalized Intersection Capacity Analysis SHORT TERM OPTION 210: Keele St/Weston Rd & St Clair Ave W Weekday AM Peak Hour
C:\Users\Synchro\Dropbox\LEA\9309\Scenario AM_R02\AM OPTION 2.syn Synchro 8 Report02/04/2015 Page 4
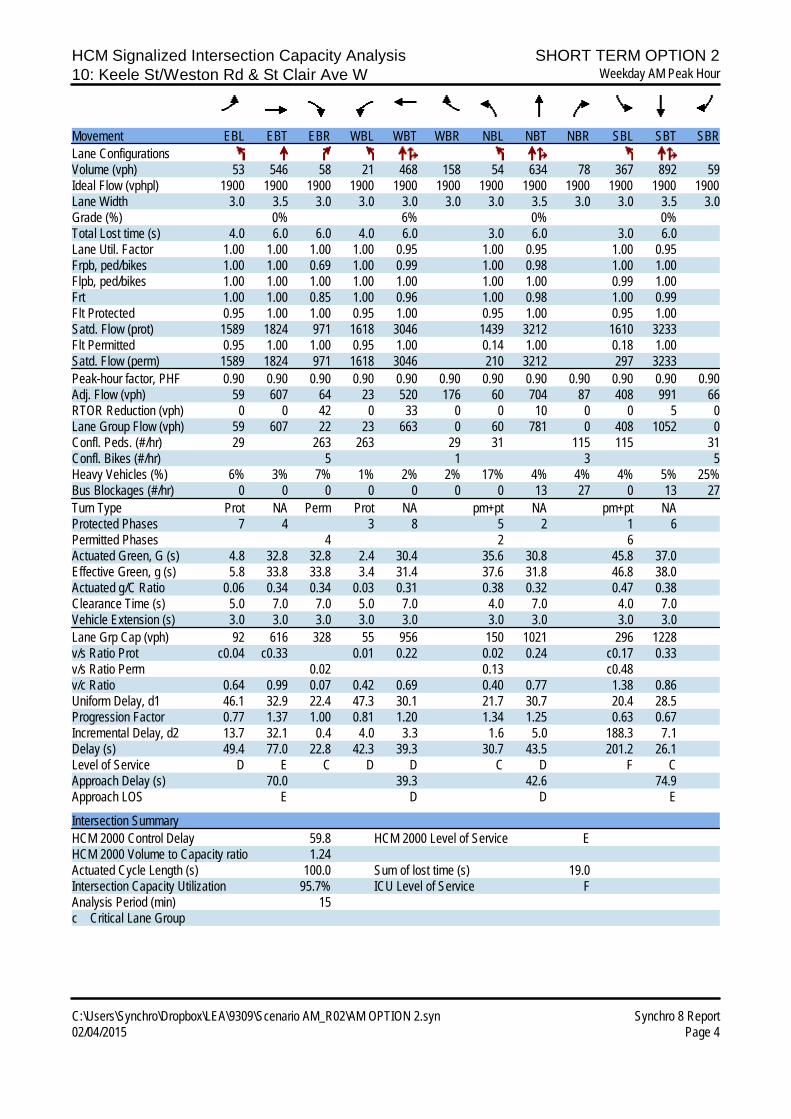
Movement EBL EBT EBR WBL WBT WBR NBL NBT NBR SBL SBT SBRLane ConfigurationsVolume (vph) 53 546 58 21 468 158 54 634 78 367 892 59Ideal Flow (vphpl) 1900 1900 1900 1900 1900 1900 1900 1900 1900 1900 1900 1900Lane Width 3.0 3.5 3.0 3.0 3.0 3.0 3.0 3.5 3.0 3.0 3.5 3.0Grade (%) 0% 6% 0% 0%Total Lost time (s) 4.0 6.0 6.0 4.0 6.0 3.0 6.0 3.0 6.0Lane Util. Factor 1.00 1.00 1.00 1.00 0.95 1.00 0.95 1.00 0.95Frpb, ped/bikes 1.00 1.00 0.69 1.00 0.99 1.00 0.98 1.00 1.00Flpb, ped/bikes 1.00 1.00 1.00 1.00 1.00 1.00 1.00 0.99 1.00Frt 1.00 1.00 0.85 1.00 0.96 1.00 0.98 1.00 0.99Flt Protected 0.95 1.00 1.00 0.95 1.00 0.95 1.00 0.95 1.00Satd. Flow (prot) 1589 1824 971 1618 3046 1439 3212 1610 3233Flt Permitted 0.95 1.00 1.00 0.95 1.00 0.14 1.00 0.18 1.00Satd. Flow (perm) 1589 1824 971 1618 3046 210 3212 297 3233Peak-hour factor, PHF 0.90 0.90 0.90 0.90 0.90 0.90 0.90 0.90 0.90 0.90 0.90 0.90Adj. Flow (vph) 59 607 64 23 520 176 60 704 87 408 991 66RTOR Reduction (vph) 0 0 42 0 33 0 0 10 0 0 5 0Lane Group Flow (vph) 59 607 22 23 663 0 60 781 0 408 1052 0Confl. Peds. (#/hr) 29 263 263 29 31 115 115 31Confl. Bikes (#/hr) 5 1 3 5Heavy Vehicles (%) 6% 3% 7% 1% 2% 2% 17% 4% 4% 4% 5% 25%Bus Blockages (#/hr) 0 0 0 0 0 0 0 13 27 0 13 27Turn Type Prot NA Perm Prot NA pm+pt NA pm+pt NAProtected Phases 7 4 3 8 5 2 1 6Permitted Phases 4 2 6Actuated Green, G (s) 4.8 32.8 32.8 2.4 30.4 35.6 30.8 45.8 37.0Effective Green, g (s) 5.8 33.8 33.8 3.4 31.4 37.6 31.8 46.8 38.0Actuated g/C Ratio 0.06 0.34 0.34 0.03 0.31 0.38 0.32 0.47 0.38Clearance Time (s) 5.0 7.0 7.0 5.0 7.0 4.0 7.0 4.0 7.0Vehicle Extension (s) 3.0 3.0 3.0 3.0 3.0 3.0 3.0 3.0 3.0Lane Grp Cap (vph) 92 616 328 55 956 150 1021 296 1228v/s Ratio Prot c0.04 c0.33 0.01 0.22 0.02 0.24 c0.17 0.33v/s Ratio Perm 0.02 0.13 c0.48v/c Ratio 0.64 0.99 0.07 0.42 0.69 0.40 0.77 1.38 0.86Uniform Delay, d1 46.1 32.9 22.4 47.3 30.1 21.7 30.7 20.4 28.5Progression Factor 0.77 1.37 1.00 0.81 1.20 1.34 1.25 0.63 0.67Incremental Delay, d2 13.7 32.1 0.4 4.0 3.3 1.6 5.0 188.3 7.1Delay (s) 49.4 77.0 22.8 42.3 39.3 30.7 43.5 201.2 26.1Level of Service D E C D D C D F CApproach Delay (s) 70.0 39.3 42.6 74.9Approach LOS E D D E
Intersection SummaryHCM 2000 Control Delay 59.8 HCM 2000 Level of Service EHCM 2000 Volume to Capacity ratio 1.24Actuated Cycle Length (s) 100.0 Sum of lost time (s) 19.0Intersection Capacity Utilization 95.7% ICU Level of Service FAnalysis Period (min) 15c Critical Lane Group

Queues SHORT TERM OPTION 26: Old Weston Rd & St Clair Ave W Weekday PM Peak Hour
C:\Users\Synchro\Dropbox\LEA\9309\Scenario PM_R02\PM OPTION 2.syn Synchro 8 Report02/04/2015 Page 1
Lane Group EBL EBT WBL WBT WBR NBL NBT SBL SBTLane ConfigurationsVolume (vph) 130 494 114 386 194 249 323 49 444Lane Group Flow (vph) 134 852 118 398 200 0 641 0 552Turn Type Prot NA Prot NA Perm Perm NA Perm NAProtected Phases 7 4 3 8 2 6Permitted Phases 8 2 6Detector Phase 7 4 3 8 8 2 2 6 6Switch PhaseMinimum Initial (s) 4.0 4.0 4.0 4.0 4.0 4.0 4.0 4.0 4.0Minimum Split (s) 9.0 26.0 9.0 26.0 26.0 34.0 34.0 34.0 34.0Total Split (s) 14.0 40.0 14.0 40.0 40.0 46.0 46.0 46.0 46.0Total Split (%) 14.0% 40.0% 14.0% 40.0% 40.0% 46.0% 46.0% 46.0% 46.0%Yellow Time (s) 3.0 4.0 3.0 4.0 4.0 4.0 4.0 4.0 4.0All-Red Time (s) 2.0 2.0 2.0 2.0 2.0 3.0 3.0 3.0 3.0Lost Time Adjust (s) -1.0 -1.0 -1.0 -1.0 -1.0 -1.0 -1.0Total Lost Time (s) 4.0 5.0 4.0 5.0 5.0 6.0 6.0Lead/Lag Lead Lag Lead Lag LagLead-Lag Optimize? Yes Yes Yes Yes YesRecall Mode None C-Max None C-Max C-Max Max Max Max Maxv/c Ratio 0.85 0.75 0.72 0.62 0.44 0.96dl 0.50Control Delay 50.2 21.3 70.1 28.2 13.4 35.8 24.1Queue Delay 0.0 0.0 0.0 0.0 0.0 0.0 0.0Total Delay 50.2 21.3 70.1 28.2 13.4 35.8 24.1Queue Length 50th (m) 28.8 52.4 25.9 46.0 11.3 58.9 42.8Queue Length 95th (m) m28.1 m49.7 m36.8 m77.0 m19.5 #86.2 59.2Internal Link Dist (m) 365.7 674.1 256.1 547.0Turn Bay Length (m) 34.0 39.0Base Capacity (vph) 157 1137 168 644 452 792 1096Starvation Cap Reductn 0 0 0 0 0 0 0Spillback Cap Reductn 0 0 0 0 0 0 0Storage Cap Reductn 0 0 0 0 0 0 0Reduced v/c Ratio 0.85 0.75 0.70 0.62 0.44 0.81 0.50
Intersection SummaryCycle Length: 100Actuated Cycle Length: 100Offset: 69 (69%), Referenced to phase 4:EBT and 8:WBT, Start of GreenNatural Cycle: 70Control Type: Actuated-Coordinated# 95th percentile volume exceeds capacity, queue may be longer. Queue shown is maximum after two cycles.m Volume for 95th percentile queue is metered by upstream signal.dl Defacto Left Lane. Recode with 1 though lane as a left lane.
Splits and Phases: 6: Old Weston Rd & St Clair Ave W

HCM Signalized Intersection Capacity Analysis SHORT TERM OPTION 26: Old Weston Rd & St Clair Ave W Weekday PM Peak Hour
C:\Users\Synchro\Dropbox\LEA\9309\Scenario PM_R02\PM OPTION 2.syn Synchro 8 Report02/04/2015 Page 2
Movement EBL EBT EBR WBL WBT WBR NBL NBT NBR SBL SBT SBRLane ConfigurationsVolume (vph) 130 494 333 114 386 194 249 323 49 49 444 42Ideal Flow (vphpl) 1900 1900 1900 1900 1900 1900 1900 1900 1900 1900 1900 1900Lane Width 3.0 3.5 3.0 3.0 3.5 3.0 3.0 3.5 3.0 3.0 3.5 3.0Grade (%) 6% 0% 0% 0%Total Lost time (s) 4.0 5.0 4.0 5.0 5.0 6.0 6.0Lane Util. Factor 1.00 0.95 1.00 1.00 1.00 0.95 0.95Frpb, ped/bikes 1.00 0.90 1.00 1.00 0.74 0.97 0.99Flpb, ped/bikes 1.00 1.00 1.00 1.00 1.00 0.98 0.99Frt 1.00 0.94 1.00 1.00 0.85 0.99 0.99Flt Protected 0.95 1.00 0.95 1.00 1.00 0.98 1.00Satd. Flow (prot) 1571 2911 1685 1842 1111 3201 3326Flt Permitted 0.95 1.00 0.95 1.00 1.00 0.60 0.82Satd. Flow (perm) 1571 2911 1685 1842 1111 1967 2726Peak-hour factor, PHF 0.97 0.97 0.97 0.97 0.97 0.97 0.97 0.97 0.97 0.97 0.97 0.97Adj. Flow (vph) 134 509 343 118 398 200 257 333 51 51 458 43RTOR Reduction (vph) 0 112 0 0 0 64 0 7 0 0 6 0Lane Group Flow (vph) 134 740 0 118 398 136 0 634 0 0 546 0Confl. Peds. (#/hr) 163 149 149 163 62 307 307 62Confl. Bikes (#/hr) 21 11 18 13Heavy Vehicles (%) 4% 1% 1% 0% 2% 1% 3% 2% 0% 1% 2% 5%Bus Blockages (#/hr) 0 0 0 0 0 0 0 5 10 0 6 12Turn Type Prot NA Prot NA Perm Perm NA Perm NAProtected Phases 7 4 3 8 2 6Permitted Phases 8 2 6Actuated Green, G (s) 9.0 34.2 8.8 34.0 34.0 39.0 39.0Effective Green, g (s) 10.0 35.2 9.8 35.0 35.0 40.0 40.0Actuated g/C Ratio 0.10 0.35 0.10 0.35 0.35 0.40 0.40Clearance Time (s) 5.0 6.0 5.0 6.0 6.0 7.0 7.0Vehicle Extension (s) 3.0 3.0 3.0 3.0 3.0 3.0 3.0Lane Grp Cap (vph) 157 1024 165 644 388 786 1090v/s Ratio Prot c0.09 c0.25 0.07 0.22v/s Ratio Perm 0.12 c0.32 0.20v/c Ratio 0.85 0.72 0.72 0.62 0.35 0.96dl 0.50Uniform Delay, d1 44.3 28.2 43.7 27.0 24.1 26.6 22.5Progression Factor 0.96 0.92 1.18 0.91 0.86 1.00 1.00Incremental Delay, d2 4.3 0.4 10.1 3.2 1.8 8.7 1.6Delay (s) 47.0 26.2 61.8 27.6 22.6 35.3 24.2Level of Service D C E C C D CApproach Delay (s) 29.0 31.8 35.3 24.2Approach LOS C C D C
Intersection SummaryHCM 2000 Control Delay 30.2 HCM 2000 Level of Service CHCM 2000 Volume to Capacity ratio 0.78Actuated Cycle Length (s) 100.0 Sum of lost time (s) 15.0Intersection Capacity Utilization 96.0% ICU Level of Service FAnalysis Period (min) 15dl Defacto Left Lane. Recode with 1 though lane as a left lane.c Critical Lane Group

Queues SHORT TERM OPTION 210: Keele St/Weston Rd & St Clair Ave W Weekday PM Peak Hour
C:\Users\Synchro\Dropbox\LEA\9309\Scenario PM_R02\PM OPTION 2.syn Synchro 8 Report02/04/2015 Page 3
Lane Group EBL EBT EBR WBL WBT NBL NBT SBL SBTLane ConfigurationsVolume (vph) 99 498 36 50 470 96 665 374 601Lane Group Flow (vph) 105 530 38 53 683 102 801 398 689Turn Type Prot NA Perm Prot NA pm+pt NA pm+pt NAProtected Phases 7 4 3 8 5 2 1 6Permitted Phases 4 2 6Detector Phase 7 4 4 3 8 5 2 1 6Switch PhaseMinimum Initial (s) 6.0 7.0 7.0 6.0 7.0 6.0 7.0 6.0 7.0Minimum Split (s) 11.0 32.0 32.0 11.0 32.0 10.0 37.0 10.0 37.0Total Split (s) 11.0 34.0 34.0 11.0 34.0 10.0 37.0 18.0 45.0Total Split (%) 11.0% 34.0% 34.0% 11.0% 34.0% 10.0% 37.0% 18.0% 45.0%Yellow Time (s) 3.0 4.0 4.0 3.0 4.0 3.0 4.0 3.0 4.0All-Red Time (s) 2.0 3.0 3.0 2.0 3.0 1.0 3.0 1.0 3.0Lost Time Adjust (s) -1.0 -1.0 -1.0 -1.0 -1.0 -1.0 -1.0 -1.0 -1.0Total Lost Time (s) 4.0 6.0 6.0 4.0 6.0 3.0 6.0 3.0 6.0Lead/Lag Lead Lag Lag Lead Lag Lead Lag Lead LagLead-Lag Optimize? Yes Yes Yes Yes Yes Yes Yes Yes YesRecall Mode Min C-Max C-Max Min C-Max None Max None Maxv/c Ratio 0.91 1.02 0.09 0.47 0.77 0.29 0.80 1.12 0.49Control Delay 111.4 81.4 0.4 73.2 30.0 19.6 41.4 105.6 13.9Queue Delay 0.0 0.0 0.0 0.0 0.0 0.0 0.0 0.0 0.0Total Delay 111.4 81.4 0.4 73.2 30.0 19.6 41.4 105.6 13.9Queue Length 50th (m) 21.7 ~111.4 0.0 0.0 63.3 9.8 59.2 ~63.6 54.8Queue Length 95th (m) #54.3 #179.6 0.0 m0.0 m74.4 26.6 97.1 #124.0 45.9Internal Link Dist (m) 287.2 365.7 277.9 432.6Turn Bay Length (m) 27.0 37.0 55.0 80.0Base Capacity (vph) 115 520 411 112 886 348 1007 355 1395Starvation Cap Reductn 0 0 0 0 0 0 0 0 0Spillback Cap Reductn 0 0 0 0 0 0 0 0 0Storage Cap Reductn 0 0 0 0 0 0 0 0 0Reduced v/c Ratio 0.91 1.02 0.09 0.47 0.77 0.29 0.80 1.12 0.49
Intersection SummaryCycle Length: 100Actuated Cycle Length: 100Offset: 1 (1%), Referenced to phase 4:EBT and 8:WBT, Start of GreenNatural Cycle: 100Control Type: Actuated-Coordinated~ Volume exceeds capacity, queue is theoretically infinite. Queue shown is maximum after two cycles.# 95th percentile volume exceeds capacity, queue may be longer. Queue shown is maximum after two cycles.m Volume for 95th percentile queue is metered by upstream signal.
Splits and Phases: 10: Keele St/Weston Rd & St Clair Ave W

HCM Signalized Intersection Capacity Analysis SHORT TERM OPTION 210: Keele St/Weston Rd & St Clair Ave W Weekday PM Peak Hour
C:\Users\Synchro\Dropbox\LEA\9309\Scenario PM_R02\PM OPTION 2.syn Synchro 8 Report02/04/2015 Page 4
Movement EBL EBT EBR WBL WBT WBR NBL NBT NBR SBL SBT SBRLane ConfigurationsVolume (vph) 99 498 36 50 470 172 96 665 88 374 601 47Ideal Flow (vphpl) 1900 1900 1900 1900 1900 1900 1900 1900 1900 1900 1900 1900Lane Width 3.0 3.5 3.0 3.0 3.0 3.0 3.0 3.5 3.0 3.0 3.5 3.0Grade (%) 0% 6% 0% 0%Total Lost time (s) 4.0 6.0 6.0 4.0 6.0 3.0 6.0 3.0 6.0Lane Util. Factor 1.00 1.00 1.00 1.00 0.95 1.00 0.95 1.00 0.95Frpb, ped/bikes 1.00 1.00 0.68 1.00 0.99 1.00 0.96 1.00 0.99Flpb, ped/bikes 1.00 1.00 1.00 1.00 1.00 0.99 1.00 0.99 1.00Frt 1.00 1.00 0.85 1.00 0.96 1.00 0.98 1.00 0.99Flt Protected 0.95 1.00 1.00 0.95 1.00 0.95 1.00 0.95 1.00Satd. Flow (prot) 1652 1860 993 1602 3034 1672 3219 1669 3390Flt Permitted 0.95 1.00 1.00 0.95 1.00 0.39 1.00 0.17 1.00Satd. Flow (perm) 1652 1860 993 1602 3034 686 3219 298 3390Peak-hour factor, PHF 0.94 0.94 0.94 0.94 0.94 0.94 0.94 0.94 0.94 0.94 0.94 0.94Adj. Flow (vph) 105 530 38 53 500 183 102 707 94 398 639 50RTOR Reduction (vph) 0 0 28 0 38 0 0 10 0 0 5 0Lane Group Flow (vph) 105 530 10 53 645 0 102 791 0 398 684 0Confl. Peds. (#/hr) 31 303 303 31 56 197 197 56Confl. Bikes (#/hr) 7 3 2 11Heavy Vehicles (%) 2% 1% 3% 2% 2% 2% 0% 3% 2% 0% 2% 10%Bus Blockages (#/hr) 0 0 0 0 0 0 0 8 16 0 5 11Turn Type Prot NA Perm Prot NA pm+pt NA pm+pt NAProtected Phases 7 4 3 8 5 2 1 6Permitted Phases 4 2 6Actuated Green, G (s) 6.0 26.2 26.2 6.0 26.2 35.6 30.8 48.8 40.0Effective Green, g (s) 7.0 27.2 27.2 7.0 27.2 37.6 31.8 49.8 41.0Actuated g/C Ratio 0.07 0.27 0.27 0.07 0.27 0.38 0.32 0.50 0.41Clearance Time (s) 5.0 7.0 7.0 5.0 7.0 4.0 7.0 4.0 7.0Vehicle Extension (s) 3.0 3.0 3.0 3.0 3.0 3.0 3.0 3.0 3.0Lane Grp Cap (vph) 115 505 270 112 825 315 1023 354 1389v/s Ratio Prot c0.06 c0.28 0.03 0.21 0.02 0.25 c0.17 0.20v/s Ratio Perm 0.01 0.10 c0.39v/c Ratio 0.91 1.05 0.04 0.47 0.78 0.32 0.77 1.12 0.49Uniform Delay, d1 46.2 36.4 26.8 44.7 33.7 20.7 30.8 23.1 21.8Progression Factor 1.00 1.00 1.00 1.38 0.81 1.34 1.14 0.94 0.57Incremental Delay, d2 57.2 53.7 0.3 2.4 5.6 0.5 4.9 83.9 1.1Delay (s) 103.4 90.1 27.0 64.0 32.9 28.3 40.0 105.7 13.6Level of Service F F C E C C D F BApproach Delay (s) 88.6 35.2 38.7 47.3Approach LOS F D D D
Intersection SummaryHCM 2000 Control Delay 50.6 HCM 2000 Level of Service DHCM 2000 Volume to Capacity ratio 1.12Actuated Cycle Length (s) 100.0 Sum of lost time (s) 19.0Intersection Capacity Utilization 93.6% ICU Level of Service FAnalysis Period (min) 15c Critical Lane Group
Queues SHORT TERM OPTION 3A6: Old Weston Rd & St Clair Ave W Weekday AM Peak Hour
C:\Users\Synchro\Dropbox\LEA\9309\Scenario AM_R02\AM OPTION 3-A.syn Synchro 8 Report02/04/2015 Page 1
Lane Group EBL EBT WBL WBT WBR NBL NBT SBL SBTLane ConfigurationsVolume (vph) 49 616 52 502 54 59 491 98 304Lane Group Flow (vph) 51 969 54 518 56 0 731 0 500Turn Type Prot NA Prot NA Perm Perm NA Perm NAProtected Phases 7 4 3 8 2 6Permitted Phases 8 2 6Detector Phase 7 4 3 8 8 2 2 6 6Switch PhaseMinimum Initial (s) 4.0 4.0 4.0 4.0 4.0 4.0 4.0 4.0 4.0Minimum Split (s) 9.0 26.0 9.0 26.0 26.0 34.0 34.0 34.0 34.0Total Split (s) 14.0 44.0 14.0 44.0 44.0 42.0 42.0 42.0 42.0Total Split (%) 14.0% 44.0% 14.0% 44.0% 44.0% 42.0% 42.0% 42.0% 42.0%Yellow Time (s) 3.0 4.0 3.0 4.0 4.0 4.0 4.0 4.0 4.0All-Red Time (s) 2.0 2.0 2.0 2.0 2.0 3.0 3.0 3.0 3.0Lost Time Adjust (s) -1.0 -1.0 -1.0 -1.0 -1.0 -1.0 -1.0Total Lost Time (s) 4.0 5.0 4.0 5.0 5.0 6.0 6.0Lead/Lag Lead Lag Lead Lag LagLead-Lag Optimize? Yes Yes Yes Yes YesRecall Mode None C-Max None C-Max C-Max Max Max Max Maxv/c Ratio 0.38 0.73 0.49 0.67 0.11 0.76 0.78Control Delay 59.3 24.5 75.3 26.9 0.9 32.7 37.3Queue Delay 0.0 0.0 0.0 0.0 0.0 0.0 0.0Total Delay 59.3 24.5 75.3 26.9 0.9 32.7 37.3Queue Length 50th (m) 10.8 102.7 12.0 102.1 0.0 64.6 44.9Queue Length 95th (m) m14.5 m47.5 m22.8 144.8 m0.8 88.3 #69.6Internal Link Dist (m) 365.7 674.1 256.1 547.0Turn Bay Length (m) 34.0 39.0Base Capacity (vph) 152 1331 122 777 493 961 637Starvation Cap Reductn 0 0 0 0 0 0 0Spillback Cap Reductn 0 0 0 0 0 0 0Storage Cap Reductn 0 0 0 0 0 0 0Reduced v/c Ratio 0.34 0.73 0.44 0.67 0.11 0.76 0.78
Intersection SummaryCycle Length: 100Actuated Cycle Length: 100Offset: 23 (23%), Referenced to phase 4:EBT and 8:WBT, Start of GreenNatural Cycle: 70Control Type: Actuated-Coordinated# 95th percentile volume exceeds capacity, queue may be longer. Queue shown is maximum after two cycles.m Volume for 95th percentile queue is metered by upstream signal.
Splits and Phases: 6: Old Weston Rd & St Clair Ave W

HCM Signalized Intersection Capacity Analysis SHORT TERM OPTION 3A6: Old Weston Rd & St Clair Ave W Weekday AM Peak Hour
C:\Users\Synchro\Dropbox\LEA\9309\Scenario AM_R02\AM OPTION 3-A.syn Synchro 8 Report02/04/2015 Page 2
Movement EBL EBT EBR WBL WBT WBR NBL NBT NBR SBL SBT SBRLane ConfigurationsVolume (vph) 49 616 324 52 502 54 59 491 159 98 304 83Ideal Flow (vphpl) 1900 1900 1900 1900 1900 1900 1900 1900 1900 1900 1900 1900Lane Width 3.0 3.5 3.0 3.0 3.5 3.0 3.0 3.5 3.0 3.0 3.5 3.0Grade (%) 6% 0% 0% 0%Total Lost time (s) 4.0 5.0 4.0 5.0 5.0 6.0 6.0Lane Util. Factor 1.00 0.95 1.00 1.00 1.00 0.95 0.95Frpb, ped/bikes 1.00 0.96 1.00 1.00 0.73 0.99 0.95Flpb, ped/bikes 1.00 1.00 1.00 1.00 1.00 0.99 1.00Frt 1.00 0.95 1.00 1.00 0.85 0.97 0.97Flt Protected 0.95 1.00 0.95 1.00 1.00 1.00 0.99Satd. Flow (prot) 1527 3015 1221 1842 1036 3095 2900Flt Permitted 0.95 1.00 0.95 1.00 1.00 0.84 0.59Satd. Flow (perm) 1527 3015 1221 1842 1036 2597 1723Peak-hour factor, PHF 0.97 0.97 0.97 0.97 0.97 0.97 0.97 0.97 0.97 0.97 0.97 0.97Adj. Flow (vph) 51 635 334 54 518 56 61 506 164 101 313 86RTOR Reduction (vph) 0 66 0 0 0 33 0 27 0 0 17 0Lane Group Flow (vph) 51 903 0 54 518 23 0 704 0 0 483 0Confl. Peds. (#/hr) 176 60 60 176 145 35 35 145Confl. Bikes (#/hr) 8 3 8 6Heavy Vehicles (%) 7% 5% 5% 38% 2% 6% 15% 8% 0% 15% 10% 10%Bus Blockages (#/hr) 0 0 0 0 0 0 0 8 18 0 7 15Turn Type Prot NA Prot NA Perm Perm NA Perm NAProtected Phases 7 4 3 8 2 6Permitted Phases 8 2 6Actuated Green, G (s) 6.8 40.0 7.0 40.2 40.2 35.0 35.0Effective Green, g (s) 7.8 41.0 8.0 41.2 41.2 36.0 36.0Actuated g/C Ratio 0.08 0.41 0.08 0.41 0.41 0.36 0.36Clearance Time (s) 5.0 6.0 5.0 6.0 6.0 7.0 7.0Vehicle Extension (s) 3.0 3.0 3.0 3.0 3.0 3.0 3.0Lane Grp Cap (vph) 119 1236 97 758 426 934 620v/s Ratio Prot 0.03 c0.30 c0.04 0.28v/s Ratio Perm 0.02 0.27 c0.28v/c Ratio 0.43 0.73 0.56 0.68 0.05 0.75 0.78Uniform Delay, d1 44.0 24.8 44.3 24.1 17.7 28.1 28.5Progression Factor 1.27 1.00 1.44 0.92 0.46 1.00 1.00Incremental Delay, d2 1.4 2.2 5.8 4.3 0.2 5.6 9.3Delay (s) 57.5 27.0 69.6 26.4 8.3 33.7 37.8Level of Service E C E C A C DApproach Delay (s) 28.5 28.5 33.7 37.8Approach LOS C C C D
Intersection SummaryHCM 2000 Control Delay 31.4 HCM 2000 Level of Service CHCM 2000 Volume to Capacity ratio 0.73Actuated Cycle Length (s) 100.0 Sum of lost time (s) 15.0Intersection Capacity Utilization 94.8% ICU Level of Service FAnalysis Period (min) 15c Critical Lane Group

Queues SHORT TERM OPTION 3A10: Keele St/Weston Rd & St Clair Ave W Weekday AM Peak Hour
C:\Users\Synchro\Dropbox\LEA\9309\Scenario AM_R02\AM OPTION 3-A.syn Synchro 8 Report02/04/2015 Page 3
Lane Group EBL EBT WBL WBT NBL NBT SBL SBTLane ConfigurationsVolume (vph) 53 546 21 468 54 634 367 892Lane Group Flow (vph) 59 671 23 696 60 791 408 1057Turn Type Prot NA Prot NA pm+pt NA pm+pt NAProtected Phases 7 4 3 8 5 2 1 6Permitted Phases 2 6Detector Phase 7 4 3 8 5 2 1 6Switch PhaseMinimum Initial (s) 6.0 7.0 6.0 7.0 6.0 7.0 6.0 7.0Minimum Split (s) 11.0 32.0 11.0 32.0 10.0 37.0 10.0 37.0Total Split (s) 11.0 32.0 11.0 32.0 10.0 37.0 20.0 47.0Total Split (%) 11.0% 32.0% 11.0% 32.0% 10.0% 37.0% 20.0% 47.0%Yellow Time (s) 3.0 4.0 3.0 4.0 3.0 4.0 3.0 4.0All-Red Time (s) 2.0 3.0 2.0 3.0 1.0 3.0 1.0 3.0Lost Time Adjust (s) -1.0 -1.0 -1.0 -1.0 -1.0 -1.0 -1.0 -1.0Total Lost Time (s) 4.0 6.0 4.0 6.0 3.0 6.0 3.0 6.0Lead/Lag Lead Lag Lead Lag Lead Lag Lead LagLead-Lag Optimize? Yes Yes Yes Yes Yes Yes Yes YesRecall Mode None C-Max None C-Max None Max None Maxv/c Ratio 0.53 0.62 0.20 0.78 0.30 0.78 1.07 0.76Control Delay 52.2 38.3 38.7 41.0 19.7 44.6 81.5 18.8Queue Delay 0.0 0.0 0.0 0.0 0.0 0.0 0.0 0.0Total Delay 52.2 38.3 38.7 41.0 19.7 44.6 81.5 18.8Queue Length 50th (m) 12.1 71.2 4.9 73.3 8.2 91.0 ~63.9 96.8Queue Length 95th (m) #28.9 95.6 m7.7 #98.5 17.3 111.1 #123.8 124.4Internal Link Dist (m) 287.2 365.7 277.9 432.6Turn Bay Length (m) 27.0 37.0 55.0 80.0Base Capacity (vph) 111 1084 113 891 203 1015 382 1395Starvation Cap Reductn 0 0 0 0 0 0 0 0Spillback Cap Reductn 0 0 0 0 0 0 0 0Storage Cap Reductn 0 0 0 0 0 0 0 0Reduced v/c Ratio 0.53 0.62 0.20 0.78 0.30 0.78 1.07 0.76
Intersection SummaryCycle Length: 100Actuated Cycle Length: 100Offset: 1 (1%), Referenced to phase 4:EBT and 8:WBT, Start of GreenNatural Cycle: 100Control Type: Actuated-Coordinated~ Volume exceeds capacity, queue is theoretically infinite. Queue shown is maximum after two cycles.# 95th percentile volume exceeds capacity, queue may be longer. Queue shown is maximum after two cycles.m Volume for 95th percentile queue is metered by upstream signal.
Splits and Phases: 10: Keele St/Weston Rd & St Clair Ave W

HCM Signalized Intersection Capacity Analysis SHORT TERM OPTION 3A10: Keele St/Weston Rd & St Clair Ave W Weekday AM Peak Hour
C:\Users\Synchro\Dropbox\LEA\9309\Scenario AM_R02\AM OPTION 3-A.syn Synchro 8 Report02/04/2015 Page 4
Movement EBL EBT EBR WBL WBT WBR NBL NBT NBR SBL SBT SBRLane ConfigurationsVolume (vph) 53 546 58 21 468 158 54 634 78 367 892 59Ideal Flow (vphpl) 1900 1900 1900 1900 1900 1900 1900 1900 1900 1900 1900 1900Lane Width 3.0 3.5 3.0 3.0 3.0 3.0 3.0 3.5 3.0 3.0 3.5 3.0Grade (%) 0% 6% 0% 0%Total Lost time (s) 4.0 6.0 4.0 6.0 3.0 6.0 3.0 6.0Lane Util. Factor 1.00 0.95 1.00 0.95 1.00 0.95 1.00 0.95Frpb, ped/bikes 1.00 0.97 1.00 0.99 1.00 0.99 1.00 1.00Flpb, ped/bikes 1.00 1.00 1.00 1.00 1.00 1.00 1.00 1.00Frt 1.00 0.99 1.00 0.96 1.00 0.98 1.00 0.99Flt Protected 0.95 1.00 0.95 1.00 0.95 1.00 0.95 1.00Satd. Flow (prot) 1589 3303 1618 3046 1438 3242 1614 3233Flt Permitted 0.95 1.00 0.95 1.00 0.20 1.00 0.18 1.00Satd. Flow (perm) 1589 3303 1618 3046 303 3242 297 3233Peak-hour factor, PHF 0.90 0.90 0.90 0.90 0.90 0.90 0.90 0.90 0.90 0.90 0.90 0.90Adj. Flow (vph) 59 607 64 23 520 176 60 704 87 408 991 66RTOR Reduction (vph) 0 8 0 0 33 0 0 10 0 0 5 0Lane Group Flow (vph) 59 663 0 23 663 0 60 781 0 408 1052 0Confl. Peds. (#/hr) 29 263 263 29 31 115 115 31Confl. Bikes (#/hr) 5 1 3 5Heavy Vehicles (%) 6% 3% 7% 1% 2% 2% 17% 4% 4% 4% 5% 25%Bus Blockages (#/hr) 0 0 0 0 0 0 0 13 27 0 13 27Turn Type Prot NA Prot NA pm+pt NA pm+pt NAProtected Phases 7 4 3 8 5 2 1 6Permitted Phases 2 6Actuated Green, G (s) 4.8 27.8 2.4 25.4 35.6 30.8 50.8 42.0Effective Green, g (s) 5.8 28.8 3.4 26.4 37.6 31.8 51.8 43.0Actuated g/C Ratio 0.06 0.29 0.03 0.26 0.38 0.32 0.52 0.43Clearance Time (s) 5.0 7.0 5.0 7.0 4.0 7.0 4.0 7.0Vehicle Extension (s) 3.0 3.0 3.0 3.0 3.0 3.0 3.0 3.0Lane Grp Cap (vph) 92 951 55 804 179 1030 377 1390v/s Ratio Prot c0.04 0.20 0.01 c0.22 0.02 0.24 c0.18 0.33v/s Ratio Perm 0.11 c0.38v/c Ratio 0.64 0.70 0.42 0.82 0.34 0.76 1.08 0.76Uniform Delay, d1 46.1 31.7 47.3 34.6 20.7 30.7 23.5 24.1Progression Factor 0.77 1.21 0.80 1.11 1.31 1.25 0.68 0.61Incremental Delay, d2 13.7 4.0 3.9 7.4 1.0 4.8 67.8 3.5Delay (s) 49.4 42.5 41.9 45.9 28.2 43.2 83.7 18.3Level of Service D D D D C D F BApproach Delay (s) 43.1 45.8 42.1 36.5Approach LOS D D D D
Intersection SummaryHCM 2000 Control Delay 40.8 HCM 2000 Level of Service DHCM 2000 Volume to Capacity ratio 0.99Actuated Cycle Length (s) 100.0 Sum of lost time (s) 19.0Intersection Capacity Utilization 87.8% ICU Level of Service EAnalysis Period (min) 15c Critical Lane Group
Queues SHORT TERM OPTION 3-A6: Old Weston Rd & St Clair Ave W Weekday PM Peak Hour
C:\Users\Synchro\Dropbox\LEA\9309\Scenario PM_R02\PM OPTION 3 A.syn Synchro 8 Report02/04/2015 Page 1
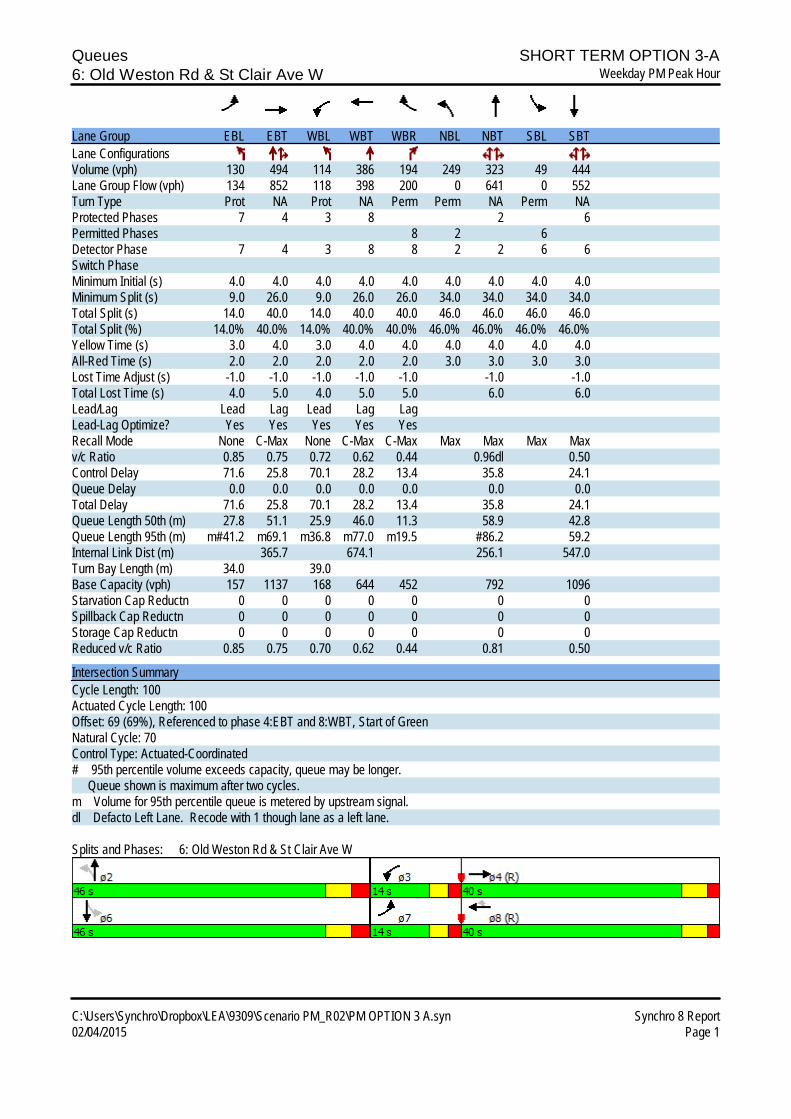
Lane Group EBL EBT WBL WBT WBR NBL NBT SBL SBTLane ConfigurationsVolume (vph) 130 494 114 386 194 249 323 49 444Lane Group Flow (vph) 134 852 118 398 200 0 641 0 552Turn Type Prot NA Prot NA Perm Perm NA Perm NAProtected Phases 7 4 3 8 2 6Permitted Phases 8 2 6Detector Phase 7 4 3 8 8 2 2 6 6Switch PhaseMinimum Initial (s) 4.0 4.0 4.0 4.0 4.0 4.0 4.0 4.0 4.0Minimum Split (s) 9.0 26.0 9.0 26.0 26.0 34.0 34.0 34.0 34.0Total Split (s) 14.0 40.0 14.0 40.0 40.0 46.0 46.0 46.0 46.0Total Split (%) 14.0% 40.0% 14.0% 40.0% 40.0% 46.0% 46.0% 46.0% 46.0%Yellow Time (s) 3.0 4.0 3.0 4.0 4.0 4.0 4.0 4.0 4.0All-Red Time (s) 2.0 2.0 2.0 2.0 2.0 3.0 3.0 3.0 3.0Lost Time Adjust (s) -1.0 -1.0 -1.0 -1.0 -1.0 -1.0 -1.0Total Lost Time (s) 4.0 5.0 4.0 5.0 5.0 6.0 6.0Lead/Lag Lead Lag Lead Lag LagLead-Lag Optimize? Yes Yes Yes Yes YesRecall Mode None C-Max None C-Max C-Max Max Max Max Maxv/c Ratio 0.85 0.75 0.72 0.62 0.44 0.96dl 0.50Control Delay 71.6 25.8 70.1 28.2 13.4 35.8 24.1Queue Delay 0.0 0.0 0.0 0.0 0.0 0.0 0.0Total Delay 71.6 25.8 70.1 28.2 13.4 35.8 24.1Queue Length 50th (m) 27.8 51.1 25.9 46.0 11.3 58.9 42.8Queue Length 95th (m) m#41.2 m69.1 m36.8 m77.0 m19.5 #86.2 59.2Internal Link Dist (m) 365.7 674.1 256.1 547.0Turn Bay Length (m) 34.0 39.0Base Capacity (vph) 157 1137 168 644 452 792 1096Starvation Cap Reductn 0 0 0 0 0 0 0Spillback Cap Reductn 0 0 0 0 0 0 0Storage Cap Reductn 0 0 0 0 0 0 0Reduced v/c Ratio 0.85 0.75 0.70 0.62 0.44 0.81 0.50
Intersection SummaryCycle Length: 100Actuated Cycle Length: 100Offset: 69 (69%), Referenced to phase 4:EBT and 8:WBT, Start of GreenNatural Cycle: 70Control Type: Actuated-Coordinated# 95th percentile volume exceeds capacity, queue may be longer. Queue shown is maximum after two cycles.m Volume for 95th percentile queue is metered by upstream signal.dl Defacto Left Lane. Recode with 1 though lane as a left lane.
Splits and Phases: 6: Old Weston Rd & St Clair Ave W

HCM Signalized Intersection Capacity Analysis SHORT TERM OPTION 3-A6: Old Weston Rd & St Clair Ave W Weekday PM Peak Hour
C:\Users\Synchro\Dropbox\LEA\9309\Scenario PM_R02\PM OPTION 3 A.syn Synchro 8 Report02/04/2015 Page 2
Movement EBL EBT EBR WBL WBT WBR NBL NBT NBR SBL SBT SBRLane ConfigurationsVolume (vph) 130 494 333 114 386 194 249 323 49 49 444 42Ideal Flow (vphpl) 1900 1900 1900 1900 1900 1900 1900 1900 1900 1900 1900 1900Lane Width 3.0 3.5 3.0 3.0 3.5 3.0 3.0 3.5 3.0 3.0 3.5 3.0Grade (%) 6% 0% 0% 0%Total Lost time (s) 4.0 5.0 4.0 5.0 5.0 6.0 6.0Lane Util. Factor 1.00 0.95 1.00 1.00 1.00 0.95 0.95Frpb, ped/bikes 1.00 0.90 1.00 1.00 0.74 0.97 0.99Flpb, ped/bikes 1.00 1.00 1.00 1.00 1.00 0.98 0.99Frt 1.00 0.94 1.00 1.00 0.85 0.99 0.99Flt Protected 0.95 1.00 0.95 1.00 1.00 0.98 1.00Satd. Flow (prot) 1571 2911 1685 1842 1111 3201 3326Flt Permitted 0.95 1.00 0.95 1.00 1.00 0.60 0.82Satd. Flow (perm) 1571 2911 1685 1842 1111 1967 2726Peak-hour factor, PHF 0.97 0.97 0.97 0.97 0.97 0.97 0.97 0.97 0.97 0.97 0.97 0.97Adj. Flow (vph) 134 509 343 118 398 200 257 333 51 51 458 43RTOR Reduction (vph) 0 112 0 0 0 64 0 7 0 0 6 0Lane Group Flow (vph) 134 740 0 118 398 136 0 634 0 0 546 0Confl. Peds. (#/hr) 163 149 149 163 62 307 307 62Confl. Bikes (#/hr) 21 11 18 13Heavy Vehicles (%) 4% 1% 1% 0% 2% 1% 3% 2% 0% 1% 2% 5%Bus Blockages (#/hr) 0 0 0 0 0 0 0 5 10 0 6 12Turn Type Prot NA Prot NA Perm Perm NA Perm NAProtected Phases 7 4 3 8 2 6Permitted Phases 8 2 6Actuated Green, G (s) 9.0 34.2 8.8 34.0 34.0 39.0 39.0Effective Green, g (s) 10.0 35.2 9.8 35.0 35.0 40.0 40.0Actuated g/C Ratio 0.10 0.35 0.10 0.35 0.35 0.40 0.40Clearance Time (s) 5.0 6.0 5.0 6.0 6.0 7.0 7.0Vehicle Extension (s) 3.0 3.0 3.0 3.0 3.0 3.0 3.0Lane Grp Cap (vph) 157 1024 165 644 388 786 1090v/s Ratio Prot c0.09 c0.25 0.07 0.22v/s Ratio Perm 0.12 c0.32 0.20v/c Ratio 0.85 0.72 0.72 0.62 0.35 0.96dl 0.50Uniform Delay, d1 44.3 28.2 43.7 27.0 24.1 26.6 22.5Progression Factor 0.95 1.01 1.18 0.91 0.86 1.00 1.00Incremental Delay, d2 22.0 2.6 10.1 3.2 1.8 8.7 1.6Delay (s) 64.3 31.2 61.8 27.6 22.6 35.3 24.2Level of Service E C E C C D CApproach Delay (s) 35.7 31.8 35.3 24.2Approach LOS D C D C
Intersection SummaryHCM 2000 Control Delay 32.4 HCM 2000 Level of Service CHCM 2000 Volume to Capacity ratio 0.78Actuated Cycle Length (s) 100.0 Sum of lost time (s) 15.0Intersection Capacity Utilization 96.0% ICU Level of Service FAnalysis Period (min) 15dl Defacto Left Lane. Recode with 1 though lane as a left lane.c Critical Lane Group

Queues SHORT TERM OPTION 3-A10: Keele St/Weston Rd & St Clair Ave W Weekday PM Peak Hour
C:\Users\Synchro\Dropbox\LEA\9309\Scenario PM_R02\PM OPTION 3 A.syn Synchro 8 Report02/04/2015 Page 3
Lane Group EBL EBT WBL WBT NBL NBT SBL SBTLane ConfigurationsVolume (vph) 99 498 50 470 96 665 374 601Lane Group Flow (vph) 105 568 53 683 102 801 398 689Turn Type Prot NA Prot NA pm+pt NA pm+pt NAProtected Phases 7 4 3 8 5 2 1 6Permitted Phases 2 6Detector Phase 7 4 3 8 5 2 1 6Switch PhaseMinimum Initial (s) 6.0 7.0 6.0 7.0 6.0 7.0 6.0 7.0Minimum Split (s) 11.0 32.0 11.0 32.0 10.0 37.0 10.0 37.0Total Split (s) 11.0 32.0 11.0 32.0 10.0 37.0 20.0 47.0Total Split (%) 11.0% 32.0% 11.0% 32.0% 10.0% 37.0% 20.0% 47.0%Yellow Time (s) 3.0 4.0 3.0 4.0 3.0 4.0 3.0 4.0All-Red Time (s) 2.0 3.0 2.0 3.0 1.0 3.0 1.0 3.0Lost Time Adjust (s) -1.0 -1.0 -1.0 -1.0 -1.0 -1.0 -1.0 -1.0Total Lost Time (s) 4.0 6.0 4.0 6.0 3.0 6.0 3.0 6.0Lead/Lag Lead Lag Lead Lag Lead Lag Lead LagLead-Lag Optimize? Yes Yes Yes Yes Yes Yes Yes YesRecall Mode Min C-Max Min C-Max None Max None Maxv/c Ratio 0.91 0.64 0.47 0.83 0.29 0.78 1.01 0.47Control Delay 111.4 36.2 73.2 32.7 18.5 40.8 69.7 12.2Queue Delay 0.0 0.0 0.0 0.0 0.0 0.0 0.0 0.0Total Delay 111.4 36.2 73.2 32.7 18.5 40.8 69.7 12.2Queue Length 50th (m) 21.7 53.4 0.0 64.1 9.4 59.2 ~22.7 51.2Queue Length 95th (m) #54.3 72.1 m0.0 m#79.9 25.7 97.1 #115.1 30.5Internal Link Dist (m) 287.2 365.7 277.9 432.6Turn Bay Length (m) 27.0 37.0 55.0 80.0Base Capacity (vph) 115 894 112 826 348 1024 393 1463Starvation Cap Reductn 0 0 0 0 0 0 0 0Spillback Cap Reductn 0 0 0 0 0 0 0 0Storage Cap Reductn 0 0 0 0 0 0 0 0Reduced v/c Ratio 0.91 0.64 0.47 0.83 0.29 0.78 1.01 0.47
Intersection SummaryCycle Length: 100Actuated Cycle Length: 100Offset: 1 (1%), Referenced to phase 4:EBT and 8:WBT, Start of GreenNatural Cycle: 90Control Type: Actuated-Coordinated~ Volume exceeds capacity, queue is theoretically infinite. Queue shown is maximum after two cycles.# 95th percentile volume exceeds capacity, queue may be longer. Queue shown is maximum after two cycles.m Volume for 95th percentile queue is metered by upstream signal.
Splits and Phases: 10: Keele St/Weston Rd & St Clair Ave W

HCM Signalized Intersection Capacity Analysis SHORT TERM OPTION 3-A10: Keele St/Weston Rd & St Clair Ave W Weekday PM Peak Hour
C:\Users\Synchro\Dropbox\LEA\9309\Scenario PM_R02\PM OPTION 3 A.syn Synchro 8 Report02/04/2015 Page 4
Movement EBL EBT EBR WBL WBT WBR NBL NBT NBR SBL SBT SBRLane ConfigurationsVolume (vph) 99 498 36 50 470 172 96 665 88 374 601 47Ideal Flow (vphpl) 1900 1900 1900 1900 1900 1900 1900 1900 1900 1900 1900 1900Lane Width 3.0 3.5 3.0 3.0 3.0 3.0 3.0 3.5 3.0 3.0 3.5 3.0Grade (%) 0% 6% 0% 0%Total Lost time (s) 4.0 6.0 4.0 6.0 3.0 6.0 3.0 6.0Lane Util. Factor 1.00 0.95 1.00 0.95 1.00 0.95 1.00 0.95Frpb, ped/bikes 1.00 0.98 1.00 0.99 1.00 0.98 1.00 0.99Flpb, ped/bikes 1.00 1.00 1.00 1.00 0.99 1.00 0.99 1.00Frt 1.00 0.99 1.00 0.96 1.00 0.98 1.00 0.99Flt Protected 0.95 1.00 0.95 1.00 0.95 1.00 0.95 1.00Satd. Flow (prot) 1652 3419 1602 3033 1672 3273 1675 3390Flt Permitted 0.95 1.00 0.95 1.00 0.39 1.00 0.17 1.00Satd. Flow (perm) 1652 3419 1602 3033 686 3273 300 3390Peak-hour factor, PHF 0.94 0.94 0.94 0.94 0.94 0.94 0.94 0.94 0.94 0.94 0.94 0.94Adj. Flow (vph) 105 530 38 53 500 183 102 707 94 398 639 50RTOR Reduction (vph) 0 5 0 0 38 0 0 10 0 0 6 0Lane Group Flow (vph) 105 563 0 53 645 0 102 791 0 398 683 0Confl. Peds. (#/hr) 31 303 303 31 56 197 197 56Confl. Bikes (#/hr) 7 3 2 11Heavy Vehicles (%) 2% 1% 3% 2% 2% 2% 0% 3% 2% 0% 2% 10%Bus Blockages (#/hr) 0 0 0 0 0 0 0 8 16 0 5 11Turn Type Prot NA Prot NA pm+pt NA pm+pt NAProtected Phases 7 4 3 8 5 2 1 6Permitted Phases 2 6Actuated Green, G (s) 6.0 24.2 6.0 24.2 35.6 30.8 50.8 42.0Effective Green, g (s) 7.0 25.2 7.0 25.2 37.6 31.8 51.8 43.0Actuated g/C Ratio 0.07 0.25 0.07 0.25 0.38 0.32 0.52 0.43Clearance Time (s) 5.0 7.0 5.0 7.0 4.0 7.0 4.0 7.0Vehicle Extension (s) 3.0 3.0 3.0 3.0 3.0 3.0 3.0 3.0Lane Grp Cap (vph) 115 861 112 764 315 1040 389 1457v/s Ratio Prot c0.06 0.16 0.03 c0.21 0.02 0.24 c0.17 0.20v/s Ratio Perm 0.10 c0.36v/c Ratio 0.91 0.65 0.47 0.84 0.32 0.76 1.02 0.47Uniform Delay, d1 46.2 33.5 44.7 35.5 20.7 30.7 24.0 20.3Progression Factor 1.00 1.00 1.38 0.77 1.33 1.14 0.95 0.54Incremental Delay, d2 57.2 3.8 2.4 8.6 0.5 4.6 49.6 1.0Delay (s) 103.4 37.3 64.0 36.0 28.2 39.5 72.5 12.0Level of Service F D E D C D E BApproach Delay (s) 47.6 38.0 38.2 34.1Approach LOS D D D C
Intersection SummaryHCM 2000 Control Delay 38.7 HCM 2000 Level of Service DHCM 2000 Volume to Capacity ratio 0.99Actuated Cycle Length (s) 100.0 Sum of lost time (s) 19.0Intersection Capacity Utilization 88.7% ICU Level of Service EAnalysis Period (min) 15c Critical Lane Group

Queues SHORT TERM OPTION 3B6: Old Weston Rd & St Clair Ave W 02/04/2015
C:\Users\Synchro\Dropbox\LEA\9309\Scenario AM_R02\AM OPTION 3-B.syn Synchro 8 Report02/04/2015 Page 1
Lane Group EBL EBT WBL WBT WBR NBL NBT SBL SBTLane ConfigurationsVolume (vph) 49 616 52 502 54 59 491 98 304Lane Group Flow (vph) 51 969 54 518 56 0 731 0 500Turn Type Prot NA Prot NA Perm Perm NA Perm NAProtected Phases 7 4 3 8 2 6Permitted Phases 8 2 6Detector Phase 7 4 3 8 8 2 2 6 6Switch PhaseMinimum Initial (s) 4.0 4.0 4.0 4.0 4.0 4.0 4.0 4.0 4.0Minimum Split (s) 9.0 26.0 9.0 26.0 26.0 34.0 34.0 34.0 34.0Total Split (s) 14.0 44.0 14.0 44.0 44.0 42.0 42.0 42.0 42.0Total Split (%) 14.0% 44.0% 14.0% 44.0% 44.0% 42.0% 42.0% 42.0% 42.0%Yellow Time (s) 3.0 4.0 3.0 4.0 4.0 4.0 4.0 4.0 4.0All-Red Time (s) 2.0 2.0 2.0 2.0 2.0 3.0 3.0 3.0 3.0Lost Time Adjust (s) -1.0 -1.0 -1.0 -1.0 -1.0 -1.0 -1.0Total Lost Time (s) 4.0 5.0 4.0 5.0 5.0 6.0 6.0Lead/Lag Lead Lag Lead Lag LagLead-Lag Optimize? Yes Yes Yes Yes YesRecall Mode None C-Max None C-Max C-Max Max Max Max Maxv/c Ratio 0.38 0.73 0.49 0.67 0.11 0.76 0.78Control Delay 60.4 25.1 75.3 26.9 0.9 32.7 37.3Queue Delay 0.0 0.0 0.0 0.0 0.0 0.0 0.0Total Delay 60.4 25.1 75.3 26.9 0.9 32.7 37.3Queue Length 50th (m) 10.9 102.6 12.0 102.1 0.0 64.6 44.9Queue Length 95th (m) m16.2 m47.0 m22.8 144.8 m0.8 88.3 #69.6Internal Link Dist (m) 365.7 674.1 256.1 547.0Turn Bay Length (m) 34.0 39.0Base Capacity (vph) 152 1331 122 777 493 961 637Starvation Cap Reductn 0 0 0 0 0 0 0Spillback Cap Reductn 0 0 0 0 0 0 0Storage Cap Reductn 0 0 0 0 0 0 0Reduced v/c Ratio 0.34 0.73 0.44 0.67 0.11 0.76 0.78
Intersection SummaryCycle Length: 100Actuated Cycle Length: 100Offset: 23 (23%), Referenced to phase 4:EBT and 8:WBT, Start of GreenNatural Cycle: 70Control Type: Actuated-Coordinated# 95th percentile volume exceeds capacity, queue may be longer. Queue shown is maximum after two cycles.m Volume for 95th percentile queue is metered by upstream signal.
Splits and Phases: 6: Old Weston Rd & St Clair Ave W

HCM Signalized Intersection Capacity Analysis SHORT TERM OPTION 3B6: Old Weston Rd & St Clair Ave W 02/04/2015
C:\Users\Synchro\Dropbox\LEA\9309\Scenario AM_R02\AM OPTION 3-B.syn Synchro 8 Report02/04/2015 Page 2
Movement EBL EBT EBR WBL WBT WBR NBL NBT NBR SBL SBT SBRLane ConfigurationsVolume (vph) 49 616 324 52 502 54 59 491 159 98 304 83Ideal Flow (vphpl) 1900 1900 1900 1900 1900 1900 1900 1900 1900 1900 1900 1900Lane Width 3.0 3.5 3.0 3.0 3.5 3.0 3.0 3.5 3.0 3.0 3.5 3.0Grade (%) 6% 0% 0% 0%Total Lost time (s) 4.0 5.0 4.0 5.0 5.0 6.0 6.0Lane Util. Factor 1.00 0.95 1.00 1.00 1.00 0.95 0.95Frpb, ped/bikes 1.00 0.96 1.00 1.00 0.73 0.99 0.95Flpb, ped/bikes 1.00 1.00 1.00 1.00 1.00 0.99 1.00Frt 1.00 0.95 1.00 1.00 0.85 0.97 0.97Flt Protected 0.95 1.00 0.95 1.00 1.00 1.00 0.99Satd. Flow (prot) 1527 3015 1221 1842 1036 3095 2900Flt Permitted 0.95 1.00 0.95 1.00 1.00 0.84 0.59Satd. Flow (perm) 1527 3015 1221 1842 1036 2597 1723Peak-hour factor, PHF 0.97 0.97 0.97 0.97 0.97 0.97 0.97 0.97 0.97 0.97 0.97 0.97Adj. Flow (vph) 51 635 334 54 518 56 61 506 164 101 313 86RTOR Reduction (vph) 0 66 0 0 0 33 0 27 0 0 17 0Lane Group Flow (vph) 51 903 0 54 518 23 0 704 0 0 483 0Confl. Peds. (#/hr) 176 60 60 176 145 35 35 145Confl. Bikes (#/hr) 8 3 8 6Heavy Vehicles (%) 7% 5% 5% 38% 2% 6% 15% 8% 0% 15% 10% 10%Bus Blockages (#/hr) 0 0 0 0 0 0 0 8 18 0 7 15Turn Type Prot NA Prot NA Perm Perm NA Perm NAProtected Phases 7 4 3 8 2 6Permitted Phases 8 2 6Actuated Green, G (s) 6.8 40.0 7.0 40.2 40.2 35.0 35.0Effective Green, g (s) 7.8 41.0 8.0 41.2 41.2 36.0 36.0Actuated g/C Ratio 0.08 0.41 0.08 0.41 0.41 0.36 0.36Clearance Time (s) 5.0 6.0 5.0 6.0 6.0 7.0 7.0Vehicle Extension (s) 3.0 3.0 3.0 3.0 3.0 3.0 3.0Lane Grp Cap (vph) 119 1236 97 758 426 934 620v/s Ratio Prot 0.03 c0.30 c0.04 0.28v/s Ratio Perm 0.02 0.27 c0.28v/c Ratio 0.43 0.73 0.56 0.68 0.05 0.75 0.78Uniform Delay, d1 44.0 24.8 44.3 24.1 17.7 28.1 28.5Progression Factor 1.29 1.01 1.44 0.92 0.46 1.00 1.00Incremental Delay, d2 1.6 2.5 5.8 4.3 0.2 5.6 9.3Delay (s) 58.4 27.7 69.6 26.4 8.3 33.7 37.8Level of Service E C E C A C DApproach Delay (s) 29.2 28.5 33.7 37.8Approach LOS C C C D
Intersection SummaryHCM 2000 Control Delay 31.7 HCM 2000 Level of Service CHCM 2000 Volume to Capacity ratio 0.73Actuated Cycle Length (s) 100.0 Sum of lost time (s) 15.0Intersection Capacity Utilization 94.8% ICU Level of Service FAnalysis Period (min) 15c Critical Lane Group

Queues SHORT TERM OPTION 3B10: Keele St/Weston Rd & St Clair Ave W 02/04/2015
C:\Users\Synchro\Dropbox\LEA\9309\Scenario AM_R02\AM OPTION 3-B.syn Synchro 8 Report02/04/2015 Page 3
Lane Group EBT EBR WBL WBT NBL NBT SBL SBTLane ConfigurationsVolume (vph) 546 58 21 468 54 634 367 892Lane Group Flow (vph) 607 64 23 696 60 791 408 1057Turn Type NA Perm Prot NA pm+pt NA pm+pt NAProtected Phases 4 3 4 5 2 1 6Permitted Phases 4 2 6Detector Phase 4 4 3 4 5 2 1 6Switch PhaseMinimum Initial (s) 7.0 7.0 6.0 7.0 6.0 7.0 6.0 7.0Minimum Split (s) 32.0 32.0 11.0 32.0 10.0 37.0 10.0 37.0Total Split (s) 32.0 32.0 11.0 32.0 10.0 37.0 20.0 47.0Total Split (%) 32.0% 32.0% 11.0% 32.0% 10.0% 37.0% 20.0% 47.0%Yellow Time (s) 4.0 4.0 3.0 4.0 3.0 4.0 3.0 4.0All-Red Time (s) 3.0 3.0 2.0 3.0 1.0 3.0 1.0 3.0Lost Time Adjust (s) -1.0 -1.0 -1.0 -1.0 -1.0 -1.0 -1.0 -1.0Total Lost Time (s) 6.0 6.0 4.0 6.0 3.0 6.0 3.0 6.0Lead/Lag Lag Lag Lead Lag Lead Lag Lead LagLead-Lag Optimize? Yes Yes Yes Yes Yes Yes Yes YesRecall Mode C-Max C-Max None C-Max None Max None Maxv/c Ratio 0.54 0.15 0.20 0.64 0.30 0.78 1.07 0.76Control Delay 36.9 6.6 38.7 33.6 19.7 44.6 80.7 18.0Queue Delay 0.0 0.0 0.0 0.0 0.0 0.0 0.0 0.0Total Delay 36.9 6.6 38.7 33.6 19.7 44.6 80.7 18.0Queue Length 50th (m) 64.2 1.4 4.9 64.7 8.2 91.0 ~63.4 96.7Queue Length 95th (m) 87.9 8.4 m7.7 92.0 17.3 111.1 #123.8 124.4Internal Link Dist (m) 287.2 365.7 277.9 432.6Turn Bay Length (m) 37.0 55.0 80.0Base Capacity (vph) 1130 441 113 1082 203 1015 382 1395Starvation Cap Reductn 0 0 0 0 0 0 0 0Spillback Cap Reductn 0 0 0 0 0 0 0 0Storage Cap Reductn 0 0 0 0 0 0 0 0Reduced v/c Ratio 0.54 0.15 0.20 0.64 0.30 0.78 1.07 0.76
Intersection SummaryCycle Length: 100Actuated Cycle Length: 100Offset: 1 (1%), Referenced to phase 4:EBWB and 8:, Start of GreenNatural Cycle: 100Control Type: Actuated-Coordinated~ Volume exceeds capacity, queue is theoretically infinite. Queue shown is maximum after two cycles.# 95th percentile volume exceeds capacity, queue may be longer. Queue shown is maximum after two cycles.m Volume for 95th percentile queue is metered by upstream signal.
Splits and Phases: 10: Keele St/Weston Rd & St Clair Ave W

HCM Signalized Intersection Capacity Analysis SHORT TERM OPTION 3B10: Keele St/Weston Rd & St Clair Ave W 02/04/2015
C:\Users\Synchro\Dropbox\LEA\9309\Scenario AM_R02\AM OPTION 3-B.syn Synchro 8 Report02/04/2015 Page 4
Movement EBL EBT EBR WBL WBT WBR NBL NBT NBR SBL SBT SBRLane ConfigurationsVolume (vph) 0 546 58 21 468 158 54 634 78 367 892 59Ideal Flow (vphpl) 1900 1900 1900 1900 1900 1900 1900 1900 1900 1900 1900 1900Lane Width 3.0 3.5 3.0 3.0 3.5 3.0 3.0 3.5 3.0 3.0 3.5 3.0Grade (%) 0% 6% 0% 0%Total Lost time (s) 6.0 6.0 4.0 6.0 3.0 6.0 3.0 6.0Lane Util. Factor 0.95 1.00 1.00 0.95 1.00 0.95 1.00 0.95Frpb, ped/bikes 1.00 0.69 1.00 0.99 1.00 0.99 1.00 1.00Flpb, ped/bikes 1.00 1.00 1.00 1.00 1.00 1.00 1.00 1.00Frt 1.00 0.85 1.00 0.96 1.00 0.98 1.00 0.99Flt Protected 1.00 1.00 0.95 1.00 0.95 1.00 0.95 1.00Satd. Flow (prot) 3466 971 1618 3227 1438 3242 1614 3233Flt Permitted 1.00 1.00 0.95 1.00 0.20 1.00 0.18 1.00Satd. Flow (perm) 3466 971 1618 3227 303 3242 297 3233Peak-hour factor, PHF 0.90 0.90 0.90 0.90 0.90 0.90 0.90 0.90 0.90 0.90 0.90 0.90Adj. Flow (vph) 0 607 64 23 520 176 60 704 87 408 991 66RTOR Reduction (vph) 0 0 46 0 32 0 0 10 0 0 5 0Lane Group Flow (vph) 0 607 18 23 664 0 60 781 0 408 1052 0Confl. Peds. (#/hr) 29 263 263 29 31 115 115 31Confl. Bikes (#/hr) 5 1 3 5Heavy Vehicles (%) 6% 3% 7% 1% 2% 2% 17% 4% 4% 4% 5% 25%Bus Blockages (#/hr) 0 0 0 0 0 0 0 13 27 0 13 27Turn Type NA Perm Prot NA pm+pt NA pm+pt NAProtected Phases 4 3 4 5 2 1 6Permitted Phases 4 2 6Actuated Green, G (s) 27.8 27.8 2.4 27.8 35.6 30.8 50.8 42.0Effective Green, g (s) 28.8 28.8 3.4 28.8 37.6 31.8 51.8 43.0Actuated g/C Ratio 0.29 0.29 0.03 0.29 0.38 0.32 0.52 0.43Clearance Time (s) 7.0 7.0 5.0 7.0 4.0 7.0 4.0 7.0Vehicle Extension (s) 3.0 3.0 3.0 3.0 3.0 3.0 3.0 3.0Lane Grp Cap (vph) 998 279 55 929 179 1030 377 1390v/s Ratio Prot 0.18 c0.01 c0.21 0.02 0.24 c0.18 0.33v/s Ratio Perm 0.02 0.11 c0.38v/c Ratio 0.61 0.07 0.42 0.71 0.34 0.76 1.08 0.76Uniform Delay, d1 30.7 25.8 47.3 31.9 20.7 30.7 23.5 24.1Progression Factor 1.21 1.00 0.80 1.11 1.31 1.25 0.64 0.58Incremental Delay, d2 2.7 0.4 3.9 3.6 1.0 4.8 67.6 3.5Delay (s) 39.9 26.3 41.9 39.0 28.2 43.2 82.7 17.4Level of Service D C D D C D F BApproach Delay (s) 38.6 39.1 42.1 35.6Approach LOS D D D D
Intersection SummaryHCM 2000 Control Delay 38.3 HCM 2000 Level of Service DHCM 2000 Volume to Capacity ratio 0.96Actuated Cycle Length (s) 100.0 Sum of lost time (s) 19.0Intersection Capacity Utilization 79.5% ICU Level of Service DAnalysis Period (min) 15c Critical Lane Group

Queues SHORT TERM OPTION 3-B6: Old Weston Rd & St Clair Ave W Weekday PM Peak Hour
C:\Users\Synchro\Dropbox\LEA\9309\Scenario PM_R02\PM OPTION 3 B.syn Synchro 8 Report02/04/2015 Page 1
Lane Group EBL EBT WBL WBT WBR NBL NBT SBL SBTLane ConfigurationsVolume (vph) 130 494 114 386 194 249 323 49 444Lane Group Flow (vph) 134 852 118 398 200 0 641 0 552Turn Type Prot NA Prot NA Perm Perm NA Perm NAProtected Phases 7 4 3 8 2 6Permitted Phases 8 2 6Detector Phase 7 4 3 8 8 2 2 6 6Switch PhaseMinimum Initial (s) 4.0 4.0 4.0 4.0 4.0 4.0 4.0 4.0 4.0Minimum Split (s) 9.0 26.0 9.0 26.0 26.0 34.0 34.0 34.0 34.0Total Split (s) 14.0 40.0 14.0 40.0 40.0 46.0 46.0 46.0 46.0Total Split (%) 14.0% 40.0% 14.0% 40.0% 40.0% 46.0% 46.0% 46.0% 46.0%Yellow Time (s) 3.0 4.0 3.0 4.0 4.0 4.0 4.0 4.0 4.0All-Red Time (s) 2.0 2.0 2.0 2.0 2.0 3.0 3.0 3.0 3.0Lost Time Adjust (s) -1.0 -1.0 -1.0 -1.0 -1.0 -1.0 -1.0Total Lost Time (s) 4.0 5.0 4.0 5.0 5.0 6.0 6.0Lead/Lag Lead Lag Lead Lag LagLead-Lag Optimize? Yes Yes Yes Yes YesRecall Mode None C-Max None C-Max C-Max Max Max Max Maxv/c Ratio 0.85 0.75 0.72 0.62 0.44 0.96dl 0.50Control Delay 73.5 26.3 70.1 28.2 13.4 35.8 24.1Queue Delay 0.0 0.0 0.0 0.0 0.0 0.0 0.0Total Delay 73.5 26.3 70.1 28.2 13.4 35.8 24.1Queue Length 50th (m) 27.8 52.1 25.9 46.0 11.3 58.9 42.8Queue Length 95th (m) m#44.1 m69.5 m36.8 m77.0 m19.5 #86.2 59.2Internal Link Dist (m) 365.7 674.1 256.1 547.0Turn Bay Length (m) 34.0 39.0Base Capacity (vph) 157 1137 168 644 452 792 1096Starvation Cap Reductn 0 0 0 0 0 0 0Spillback Cap Reductn 0 0 0 0 0 0 0Storage Cap Reductn 0 0 0 0 0 0 0Reduced v/c Ratio 0.85 0.75 0.70 0.62 0.44 0.81 0.50
Intersection SummaryCycle Length: 100Actuated Cycle Length: 100Offset: 69 (69%), Referenced to phase 4:EBT and 8:WBT, Start of GreenNatural Cycle: 70Control Type: Actuated-Coordinated# 95th percentile volume exceeds capacity, queue may be longer. Queue shown is maximum after two cycles.m Volume for 95th percentile queue is metered by upstream signal.dl Defacto Left Lane. Recode with 1 though lane as a left lane.
Splits and Phases: 6: Old Weston Rd & St Clair Ave W

HCM Signalized Intersection Capacity Analysis SHORT TERM OPTION 3-B6: Old Weston Rd & St Clair Ave W Weekday PM Peak Hour
C:\Users\Synchro\Dropbox\LEA\9309\Scenario PM_R02\PM OPTION 3 B.syn Synchro 8 Report02/04/2015 Page 2
Movement EBL EBT EBR WBL WBT WBR NBL NBT NBR SBL SBT SBRLane ConfigurationsVolume (vph) 130 494 333 114 386 194 249 323 49 49 444 42Ideal Flow (vphpl) 1900 1900 1900 1900 1900 1900 1900 1900 1900 1900 1900 1900Lane Width 3.0 3.5 3.0 3.0 3.5 3.0 3.0 3.5 3.0 3.0 3.5 3.0Grade (%) 6% 0% 0% 0%Total Lost time (s) 4.0 5.0 4.0 5.0 5.0 6.0 6.0Lane Util. Factor 1.00 0.95 1.00 1.00 1.00 0.95 0.95Frpb, ped/bikes 1.00 0.90 1.00 1.00 0.74 0.97 0.99Flpb, ped/bikes 1.00 1.00 1.00 1.00 1.00 0.98 0.99Frt 1.00 0.94 1.00 1.00 0.85 0.99 0.99Flt Protected 0.95 1.00 0.95 1.00 1.00 0.98 1.00Satd. Flow (prot) 1571 2911 1685 1842 1111 3201 3326Flt Permitted 0.95 1.00 0.95 1.00 1.00 0.60 0.82Satd. Flow (perm) 1571 2911 1685 1842 1111 1967 2726Peak-hour factor, PHF 0.97 0.97 0.97 0.97 0.97 0.97 0.97 0.97 0.97 0.97 0.97 0.97Adj. Flow (vph) 134 509 343 118 398 200 257 333 51 51 458 43RTOR Reduction (vph) 0 112 0 0 0 64 0 7 0 0 6 0Lane Group Flow (vph) 134 740 0 118 398 136 0 634 0 0 546 0Confl. Peds. (#/hr) 163 149 149 163 62 307 307 62Confl. Bikes (#/hr) 21 11 18 13Heavy Vehicles (%) 4% 1% 1% 0% 2% 1% 3% 2% 0% 1% 2% 5%Bus Blockages (#/hr) 0 0 0 0 0 0 0 5 10 0 6 12Turn Type Prot NA Prot NA Perm Perm NA Perm NAProtected Phases 7 4 3 8 2 6Permitted Phases 8 2 6Actuated Green, G (s) 9.0 34.2 8.8 34.0 34.0 39.0 39.0Effective Green, g (s) 10.0 35.2 9.8 35.0 35.0 40.0 40.0Actuated g/C Ratio 0.10 0.35 0.10 0.35 0.35 0.40 0.40Clearance Time (s) 5.0 6.0 5.0 6.0 6.0 7.0 7.0Vehicle Extension (s) 3.0 3.0 3.0 3.0 3.0 3.0 3.0Lane Grp Cap (vph) 157 1024 165 644 388 786 1090v/s Ratio Prot c0.09 c0.25 0.07 0.22v/s Ratio Perm 0.12 c0.32 0.20v/c Ratio 0.85 0.72 0.72 0.62 0.35 0.96dl 0.50Uniform Delay, d1 44.3 28.2 43.7 27.0 24.1 26.6 22.5Progression Factor 0.96 1.03 1.18 0.91 0.86 1.00 1.00Incremental Delay, d2 23.3 2.8 10.1 3.2 1.8 8.7 1.6Delay (s) 66.0 31.7 61.8 27.6 22.6 35.3 24.2Level of Service E C E C C D CApproach Delay (s) 36.4 31.8 35.3 24.2Approach LOS D C D C
Intersection SummaryHCM 2000 Control Delay 32.7 HCM 2000 Level of Service CHCM 2000 Volume to Capacity ratio 0.78Actuated Cycle Length (s) 100.0 Sum of lost time (s) 15.0Intersection Capacity Utilization 96.0% ICU Level of Service FAnalysis Period (min) 15dl Defacto Left Lane. Recode with 1 though lane as a left lane.c Critical Lane Group

Queues SHORT TERM OPTION 3-B10: Keele St/Weston Rd & St Clair Ave W Weekday PM Peak Hour
C:\Users\Synchro\Dropbox\LEA\9309\Scenario PM_R02\PM OPTION 3 B.syn Synchro 8 Report02/04/2015 Page 3
Lane Group EBT EBR WBL WBT NBL NBT SBL SBTLane ConfigurationsVolume (vph) 498 36 50 470 96 665 374 601Lane Group Flow (vph) 530 38 53 683 102 801 398 689Turn Type NA Perm Prot NA pm+pt NA pm+pt NAProtected Phases 4 3 4 5 2 1 6Permitted Phases 4 2 6Detector Phase 4 4 3 4 5 2 1 6Switch PhaseMinimum Initial (s) 7.0 7.0 6.0 7.0 6.0 7.0 6.0 7.0Minimum Split (s) 32.0 32.0 11.0 32.0 10.0 37.0 10.0 37.0Total Split (s) 32.0 32.0 11.0 32.0 10.0 37.0 20.0 47.0Total Split (%) 32.0% 32.0% 11.0% 32.0% 10.0% 37.0% 20.0% 47.0%Yellow Time (s) 4.0 4.0 3.0 4.0 3.0 4.0 3.0 4.0All-Red Time (s) 3.0 3.0 2.0 3.0 1.0 3.0 1.0 3.0Lost Time Adjust (s) -1.0 -1.0 -1.0 -1.0 -1.0 -1.0 -1.0 -1.0Total Lost Time (s) 6.0 6.0 4.0 6.0 3.0 6.0 3.0 6.0Lead/Lag Lag Lag Lead Lag Lead Lag Lead LagLead-Lag Optimize? Yes Yes Yes Yes Yes Yes Yes YesRecall Mode C-Max C-Max Min C-Max None Max None Maxv/c Ratio 0.58 0.10 0.47 0.83 0.29 0.78 1.01 0.47Control Delay 35.2 0.5 73.2 32.7 18.5 40.8 72.4 10.7Queue Delay 0.0 0.0 0.0 0.0 0.0 0.0 0.0 0.0Total Delay 35.2 0.5 73.2 32.7 18.5 40.8 72.4 10.7Queue Length 50th (m) 49.6 0.0 0.0 64.1 9.4 59.2 ~34.1 21.4Queue Length 95th (m) 67.1 0.0 m0.0 m#79.9 25.7 97.1 #115.1 30.5Internal Link Dist (m) 287.2 365.7 277.9 432.6Turn Bay Length (m) 37.0 55.0 80.0Base Capacity (vph) 919 395 112 826 348 1024 393 1463Starvation Cap Reductn 0 0 0 0 0 0 0 0Spillback Cap Reductn 0 0 0 0 0 0 0 0Storage Cap Reductn 0 0 0 0 0 0 0 0Reduced v/c Ratio 0.58 0.10 0.47 0.83 0.29 0.78 1.01 0.47
Intersection SummaryCycle Length: 100Actuated Cycle Length: 100Offset: 1 (1%), Referenced to phase 4:EBWB and 8:, Start of GreenNatural Cycle: 90Control Type: Actuated-Coordinated~ Volume exceeds capacity, queue is theoretically infinite. Queue shown is maximum after two cycles.# 95th percentile volume exceeds capacity, queue may be longer. Queue shown is maximum after two cycles.m Volume for 95th percentile queue is metered by upstream signal.
Splits and Phases: 10: Keele St/Weston Rd & St Clair Ave W

HCM Signalized Intersection Capacity Analysis SHORT TERM OPTION 3-B10: Keele St/Weston Rd & St Clair Ave W Weekday PM Peak Hour
C:\Users\Synchro\Dropbox\LEA\9309\Scenario PM_R02\PM OPTION 3 B.syn Synchro 8 Report02/04/2015 Page 4
Movement EBL EBT EBR WBL WBT WBR NBL NBT NBR SBL SBT SBRLane ConfigurationsVolume (vph) 0 498 36 50 470 172 96 665 88 374 601 47Ideal Flow (vphpl) 1900 1900 1900 1900 1900 1900 1900 1900 1900 1900 1900 1900Lane Width 3.0 3.5 3.0 3.0 3.0 3.0 3.0 3.5 3.0 3.0 3.5 3.0Grade (%) 0% 6% 0% 0%Total Lost time (s) 6.0 6.0 4.0 6.0 3.0 6.0 3.0 6.0Lane Util. Factor 0.95 1.00 1.00 0.95 1.00 0.95 1.00 0.95Frpb, ped/bikes 1.00 0.68 1.00 0.99 1.00 0.98 1.00 0.99Flpb, ped/bikes 1.00 1.00 1.00 1.00 0.99 1.00 0.99 1.00Frt 1.00 0.85 1.00 0.96 1.00 0.98 1.00 0.99Flt Protected 1.00 1.00 0.95 1.00 0.95 1.00 0.95 1.00Satd. Flow (prot) 3535 993 1602 3033 1672 3273 1675 3390Flt Permitted 1.00 1.00 0.95 1.00 0.39 1.00 0.17 1.00Satd. Flow (perm) 3535 993 1602 3033 686 3273 300 3390Peak-hour factor, PHF 0.94 0.94 0.94 0.94 0.94 0.94 0.94 0.94 0.94 0.94 0.94 0.94Adj. Flow (vph) 0 530 38 53 500 183 102 707 94 398 639 50RTOR Reduction (vph) 0 0 28 0 38 0 0 10 0 0 6 0Lane Group Flow (vph) 0 530 10 53 645 0 102 791 0 398 683 0Confl. Peds. (#/hr) 31 303 303 31 56 197 197 56Confl. Bikes (#/hr) 7 3 2 11Heavy Vehicles (%) 2% 1% 3% 2% 2% 2% 0% 3% 2% 0% 2% 10%Bus Blockages (#/hr) 0 0 0 0 0 0 0 8 16 0 5 11Turn Type NA Perm Prot NA pm+pt NA pm+pt NAProtected Phases 4 3 4 5 2 1 6Permitted Phases 4 2 6Actuated Green, G (s) 24.2 24.2 6.0 24.2 35.6 30.8 50.8 42.0Effective Green, g (s) 25.2 25.2 7.0 25.2 37.6 31.8 51.8 43.0Actuated g/C Ratio 0.25 0.25 0.07 0.25 0.38 0.32 0.52 0.43Clearance Time (s) 7.0 7.0 5.0 7.0 4.0 7.0 4.0 7.0Vehicle Extension (s) 3.0 3.0 3.0 3.0 3.0 3.0 3.0 3.0Lane Grp Cap (vph) 890 250 112 764 315 1040 389 1457v/s Ratio Prot 0.15 c0.03 c0.21 0.02 0.24 c0.17 0.20v/s Ratio Perm 0.01 0.10 c0.36v/c Ratio 0.60 0.04 0.47 0.84 0.32 0.76 1.02 0.47Uniform Delay, d1 32.9 28.2 44.7 35.5 20.7 30.7 24.0 20.3Progression Factor 1.00 1.00 1.38 0.77 1.33 1.14 1.14 0.46Incremental Delay, d2 2.9 0.3 2.4 8.6 0.5 4.6 49.1 1.0Delay (s) 35.8 28.5 64.0 36.0 28.2 39.5 76.5 10.4Level of Service D C E D C D E BApproach Delay (s) 35.4 38.0 38.2 34.6Approach LOS D D D C
Intersection SummaryHCM 2000 Control Delay 36.5 HCM 2000 Level of Service DHCM 2000 Volume to Capacity ratio 0.95Actuated Cycle Length (s) 100.0 Sum of lost time (s) 19.0Intersection Capacity Utilization 88.2% ICU Level of Service EAnalysis Period (min) 15c Critical Lane Group

Queues SHORT TERM OPTION 4 & 56: Old Weston Rd & St Clair Ave W Weekday AM Peak Hour
C:\Users\Synchro\Dropbox\LEA\9309\Scenario AM_R04\AM OPTION 4 & 5.syn Synchro 8 Report01/04/2015 Page 1
Lane Group EBL EBT WBL WBT WBR NBL NBT SBL SBTLane ConfigurationsVolume (vph) 49 616 52 502 54 59 491 98 304Lane Group Flow (vph) 51 969 0 572 56 0 731 0 500Turn Type Prot NA Perm NA Perm Perm NA Perm NAProtected Phases 7 4 8 2 6Permitted Phases 8 8 2 6Detector Phase 7 4 8 8 8 2 2 6 6Switch PhaseMinimum Initial (s) 4.0 4.0 4.0 4.0 4.0 4.0 4.0 4.0 4.0Minimum Split (s) 9.0 26.0 26.0 26.0 26.0 34.0 34.0 34.0 34.0Total Split (s) 11.0 53.0 42.0 42.0 42.0 47.0 47.0 47.0 47.0Total Split (%) 11.0% 53.0% 42.0% 42.0% 42.0% 47.0% 47.0% 47.0% 47.0%Yellow Time (s) 3.0 4.0 4.0 4.0 4.0 4.0 4.0 4.0 4.0All-Red Time (s) 2.0 2.0 2.0 2.0 2.0 3.0 3.0 3.0 3.0Lost Time Adjust (s) -1.0 -1.0 -1.0 -1.0 -1.0 -1.0Total Lost Time (s) 4.0 5.0 5.0 5.0 6.0 6.0Lead/Lag Lead Lag Lag LagLead-Lag Optimize? Yes Yes Yes YesRecall Mode None C-Max C-Max C-Max C-Max Max Max Max Maxv/c Ratio 0.49 0.64 0.58 0.12 0.65 0.65Control Delay 62.6 17.1 25.1 1.0 25.6 27.2Queue Delay 0.0 0.0 0.0 0.0 0.0 0.0Total Delay 62.6 17.1 25.1 1.0 25.6 27.2Queue Length 50th (m) 10.7 47.1 59.0 0.0 58.2 39.8Queue Length 95th (m) m11.4 m52.5 78.7 m0.8 79.4 59.3Internal Link Dist (m) 365.7 674.1 256.1 547.0Turn Bay Length (m) 34.0 39.0Base Capacity (vph) 106 1515 978 466 1117 764Starvation Cap Reductn 0 0 0 0 0 0Spillback Cap Reductn 0 0 0 0 0 0Storage Cap Reductn 0 0 0 0 0 0Reduced v/c Ratio 0.48 0.64 0.58 0.12 0.65 0.65
Intersection SummaryCycle Length: 100Actuated Cycle Length: 100Offset: 23 (23%), Referenced to phase 4:EBT and 8:WBTL, Start of GreenNatural Cycle: 70Control Type: Actuated-Coordinatedm Volume for 95th percentile queue is metered by upstream signal.
Splits and Phases: 6: Old Weston Rd & St Clair Ave W

HCM Signalized Intersection Capacity Analysis SHORT TERM OPTION 4 & 56: Old Weston Rd & St Clair Ave W Weekday AM Peak Hour
C:\Users\Synchro\Dropbox\LEA\9309\Scenario AM_R04\AM OPTION 4 & 5.syn Synchro 8 Report01/04/2015 Page 2
Movement EBL EBT EBR WBL WBT WBR NBL NBT NBR SBL SBT SBRLane ConfigurationsVolume (vph) 49 616 324 52 502 54 59 491 159 98 304 83Ideal Flow (vphpl) 1900 1900 1900 1900 1900 1900 1900 1900 1900 1900 1900 1900Lane Width 3.0 3.5 3.0 3.0 3.5 3.0 3.0 3.5 3.0 3.0 3.5 3.0Grade (%) 6% 0% 0% 0%Total Lost time (s) 4.0 5.0 5.0 5.0 6.0 6.0Lane Util. Factor 1.00 0.95 0.95 1.00 0.95 0.95Frpb, ped/bikes 1.00 0.96 1.00 0.73 0.99 0.97Flpb, ped/bikes 1.00 1.00 1.00 1.00 0.99 1.00Frt 1.00 0.95 1.00 0.85 0.97 0.97Flt Protected 0.95 1.00 1.00 1.00 1.00 0.99Satd. Flow (prot) 1527 3016 3223 1036 3108 2961Flt Permitted 0.95 1.00 0.77 1.00 0.85 0.61Satd. Flow (perm) 1527 3016 2496 1036 2662 1822Peak-hour factor, PHF 0.97 0.97 0.97 0.97 0.97 0.97 0.97 0.97 0.97 0.97 0.97 0.97Adj. Flow (vph) 51 635 334 54 518 56 61 506 164 101 313 86RTOR Reduction (vph) 0 68 0 0 0 35 0 27 0 0 18 0Lane Group Flow (vph) 51 901 0 0 572 21 0 704 0 0 482 0Confl. Peds. (#/hr) 176 60 60 176 145 35 35 145Confl. Bikes (#/hr) 8 3 8 6Heavy Vehicles (%) 7% 5% 5% 38% 2% 6% 15% 8% 0% 15% 10% 10%Bus Blockages (#/hr) 0 0 0 0 21 0 0 8 18 0 7 15Turn Type Prot NA Perm NA Perm Perm NA Perm NAProtected Phases 7 4 8 2 6Permitted Phases 8 8 2 6Actuated Green, G (s) 4.8 47.0 37.2 37.2 40.0 40.0Effective Green, g (s) 5.8 48.0 38.2 38.2 41.0 41.0Actuated g/C Ratio 0.06 0.48 0.38 0.38 0.41 0.41Clearance Time (s) 5.0 6.0 6.0 6.0 7.0 7.0Vehicle Extension (s) 3.0 3.0 3.0 3.0 3.0 3.0Lane Grp Cap (vph) 88 1447 953 395 1091 747v/s Ratio Prot 0.03 c0.30v/s Ratio Perm 0.23 0.02 0.26 c0.26v/c Ratio 0.58 0.62 0.60 0.05 0.65 0.65Uniform Delay, d1 45.9 19.3 24.8 19.5 23.7 23.7Progression Factor 1.26 0.98 0.91 0.44 1.00 1.00Incremental Delay, d2 2.9 0.6 2.4 0.2 3.0 4.3Delay (s) 60.9 19.5 24.9 8.8 26.6 27.9Level of Service E B C A C CApproach Delay (s) 21.6 23.5 26.6 27.9Approach LOS C C C C
Intersection SummaryHCM 2000 Control Delay 24.4 HCM 2000 Level of Service CHCM 2000 Volume to Capacity ratio 0.66Actuated Cycle Length (s) 100.0 Sum of lost time (s) 15.0Intersection Capacity Utilization 108.9% ICU Level of Service GAnalysis Period (min) 15c Critical Lane Group

Queues SHORT TERM OPTION 4 & 510: Keele St/Weston Rd & St Clair Ave W Weekday AM Peak Hour
C:\Users\Synchro\Dropbox\LEA\9309\Scenario AM_R04\AM OPTION 4 & 5.syn Synchro 8 Report01/04/2015 Page 3
Lane Group EBL EBT EBR WBL WBT WBR NBL NBT SBL SBTLane ConfigurationsVolume (vph) 53 546 58 21 468 158 54 634 367 892Lane Group Flow (vph) 59 607 64 23 520 176 60 791 408 1057Turn Type Prot NA Perm Perm NA Perm pm+pt NA pm+pt NAProtected Phases 7 4 8 5 2 1 6Permitted Phases 4 8 8 2 6Detector Phase 7 4 4 8 8 8 5 2 1 6Switch PhaseMinimum Initial (s) 4.0 7.0 7.0 7.0 7.0 7.0 6.0 7.0 6.0 7.0Minimum Split (s) 11.0 32.0 32.0 32.0 32.0 32.0 10.0 37.0 10.0 37.0Total Split (s) 11.0 43.0 43.0 32.0 32.0 32.0 10.0 37.0 20.0 47.0Total Split (%) 11.0% 43.0% 43.0% 32.0% 32.0% 32.0% 10.0% 37.0% 20.0% 47.0%Yellow Time (s) 3.0 4.0 4.0 4.0 4.0 4.0 3.0 4.0 3.0 4.0All-Red Time (s) 2.0 3.0 3.0 3.0 3.0 3.0 1.0 3.0 1.0 3.0Lost Time Adjust (s) -1.0 -1.0 -1.0 -1.0 -1.0 -1.0 -1.0 -1.0 -1.0 -1.0Total Lost Time (s) 4.0 6.0 6.0 6.0 6.0 6.0 3.0 6.0 3.0 6.0Lead/Lag Lead Lag Lag Lag Lead Lag Lead LagLead-Lag Optimize? Yes Yes Yes Yes Yes Yes Yes YesRecall Mode None C-Max C-Max C-Max C-Max C-Max None Max None Maxv/c Ratio 0.54 0.90 0.15 0.33 0.54 0.34 0.30 0.79 1.07 0.76Control Delay 52.7 53.7 9.3 47.0 38.0 17.8 19.2 44.1 84.1 18.8Queue Delay 0.0 0.0 0.0 0.0 0.0 0.0 0.0 0.0 0.0 0.0Total Delay 52.7 53.7 9.3 47.0 38.0 17.8 19.2 44.1 84.1 18.8Queue Length 50th (m) 12.1 132.9 2.5 4.4 55.8 18.1 8.0 91.0 ~63.9 96.8Queue Length 95th (m) #28.9 #188.6 11.2 m7.9 71.6 m33.6 17.1 111.1 #124.6 124.4Internal Link Dist (m) 287.2 365.7 277.9 432.6Turn Bay Length (m) 27.0 37.0 37.0 55.0 80.0Base Capacity (vph) 111 674 441 69 957 518 203 1006 380 1395Starvation Cap Reductn 0 0 0 0 0 0 0 0 0 0Spillback Cap Reductn 0 0 0 0 0 0 0 0 0 0Storage Cap Reductn 0 0 0 0 0 0 0 0 0 0Reduced v/c Ratio 0.53 0.90 0.15 0.33 0.54 0.34 0.30 0.79 1.07 0.76
Intersection SummaryCycle Length: 100Actuated Cycle Length: 100Offset: 0 (0%), Referenced to phase 4:EBT and 8:WBTL, Start of GreenNatural Cycle: 100Control Type: Actuated-Coordinated~ Volume exceeds capacity, queue is theoretically infinite. Queue shown is maximum after two cycles.# 95th percentile volume exceeds capacity, queue may be longer. Queue shown is maximum after two cycles.m Volume for 95th percentile queue is metered by upstream signal.
Splits and Phases: 10: Keele St/Weston Rd & St Clair Ave W

HCM Signalized Intersection Capacity Analysis SHORT TERM OPTION 4 & 510: Keele St/Weston Rd & St Clair Ave W Weekday AM Peak Hour
C:\Users\Synchro\Dropbox\LEA\9309\Scenario AM_R04\AM OPTION 4 & 5.syn Synchro 8 Report01/04/2015 Page 4
Movement EBL EBT EBR WBL WBT WBR NBL NBT NBR SBL SBT SBRLane ConfigurationsVolume (vph) 53 546 58 21 468 158 54 634 78 367 892 59Ideal Flow (vphpl) 1900 1900 1900 1900 1900 1900 1900 1900 1900 1900 1900 1900Lane Width 3.0 3.5 3.0 3.0 3.5 3.0 3.0 3.5 3.0 3.0 3.5 3.0Grade (%) 0% 6% 0% 0%Total Lost time (s) 4.0 6.0 6.0 6.0 6.0 6.0 3.0 6.0 3.0 6.0Lane Util. Factor 1.00 1.00 1.00 1.00 0.95 1.00 1.00 0.95 1.00 0.95Frpb, ped/bikes 1.00 1.00 0.69 1.00 1.00 0.95 1.00 0.98 1.00 1.00Flpb, ped/bikes 1.00 1.00 1.00 0.91 1.00 1.00 1.00 1.00 0.99 1.00Frt 1.00 1.00 0.85 1.00 1.00 0.85 1.00 0.98 1.00 0.99Flt Protected 0.95 1.00 1.00 0.95 1.00 1.00 0.95 1.00 0.95 1.00Satd. Flow (prot) 1589 1824 971 1477 3395 1366 1438 3212 1610 3233Flt Permitted 0.95 1.00 1.00 0.16 1.00 1.00 0.20 1.00 0.18 1.00Satd. Flow (perm) 1589 1824 971 249 3395 1366 303 3212 297 3233Peak-hour factor, PHF 0.90 0.90 0.90 0.90 0.90 0.90 0.90 0.90 0.90 0.90 0.90 0.90Adj. Flow (vph) 59 607 64 23 520 176 60 704 87 408 991 66RTOR Reduction (vph) 0 0 41 0 0 130 0 10 0 0 5 0Lane Group Flow (vph) 59 607 23 23 520 46 60 781 0 408 1052 0Confl. Peds. (#/hr) 29 263 263 29 31 115 115 31Confl. Bikes (#/hr) 5 1 3 5Heavy Vehicles (%) 6% 3% 7% 1% 2% 2% 17% 4% 4% 4% 5% 25%Bus Blockages (#/hr) 0 0 0 0 0 0 0 13 27 0 13 27Turn Type Prot NA Perm Perm NA Perm pm+pt NA pm+pt NAProtected Phases 7 4 8 5 2 1 6Permitted Phases 4 8 8 2 6Actuated Green, G (s) 4.8 35.2 35.2 25.4 25.4 25.4 35.6 30.8 50.8 42.0Effective Green, g (s) 5.8 36.2 36.2 26.4 26.4 26.4 37.6 31.8 51.8 43.0Actuated g/C Ratio 0.06 0.36 0.36 0.26 0.26 0.26 0.38 0.32 0.52 0.43Clearance Time (s) 5.0 7.0 7.0 7.0 7.0 7.0 4.0 7.0 4.0 7.0Vehicle Extension (s) 3.0 3.0 3.0 3.0 3.0 3.0 3.0 3.0 3.0 3.0Lane Grp Cap (vph) 92 660 351 65 896 360 179 1021 377 1390v/s Ratio Prot 0.04 c0.33 0.15 0.02 0.24 c0.18 0.33v/s Ratio Perm 0.02 0.09 0.03 0.11 c0.38v/c Ratio 0.64 0.92 0.07 0.35 0.58 0.13 0.34 0.77 1.08 0.76Uniform Delay, d1 46.1 30.5 20.9 29.9 32.0 28.0 20.7 30.7 23.6 24.1Progression Factor 0.77 1.21 1.00 1.09 1.15 3.89 1.27 1.23 0.71 0.61Incremental Delay, d2 13.7 19.4 0.3 12.2 2.3 0.6 1.0 5.0 67.8 3.5Delay (s) 49.3 56.3 21.2 44.9 39.0 109.7 27.4 42.7 84.7 18.3Level of Service D E C D D F C D F BApproach Delay (s) 52.6 56.5 41.6 36.8Approach LOS D E D D
Intersection SummaryHCM 2000 Control Delay 44.7 HCM 2000 Level of Service DHCM 2000 Volume to Capacity ratio 1.10Actuated Cycle Length (s) 100.0 Sum of lost time (s) 19.0Intersection Capacity Utilization 98.2% ICU Level of Service FAnalysis Period (min) 15c Critical Lane Group

Queues SHORT TERM OPTION 4 & 56: Old Weston Rd & St Clair Ave W Weekday PM Peak Hour
C:\Users\Synchro\Dropbox\LEA\9309\Scenario PM_R04\PM OPTION 4 & 5.syn Synchro 8 Report01/04/2015 Page 1
Lane Group EBL EBT WBL WBT WBR NBL NBT SBL SBTLane ConfigurationsVolume (vph) 130 494 114 386 194 249 323 49 444Lane Group Flow (vph) 134 852 0 516 200 0 641 0 552Turn Type Prot NA Perm NA Perm Perm NA Perm NAProtected Phases 7 4 8 2 6Permitted Phases 8 8 2 6Detector Phase 7 4 8 8 8 2 2 6 6Switch PhaseMinimum Initial (s) 4.0 4.0 4.0 4.0 4.0 4.0 4.0 4.0 4.0Minimum Split (s) 9.0 26.0 26.0 26.0 26.0 34.0 34.0 34.0 34.0Total Split (s) 14.0 50.0 36.0 36.0 36.0 50.0 50.0 50.0 50.0Total Split (%) 14.0% 50.0% 36.0% 36.0% 36.0% 50.0% 50.0% 50.0% 50.0%Yellow Time (s) 3.0 4.0 4.0 4.0 4.0 4.0 4.0 4.0 4.0All-Red Time (s) 2.0 2.0 2.0 2.0 2.0 3.0 3.0 3.0 3.0Lost Time Adjust (s) -1.0 -1.0 -1.0 -1.0 -1.0 -1.0Total Lost Time (s) 4.0 5.0 5.0 5.0 6.0 6.0Lead/Lag Lead Lag Lag LagLead-Lag Optimize? Yes Yes Yes YesRecall Mode None C-Max C-Max C-Max C-Max Max Max Max Maxv/c Ratio 0.85 0.60 0.79 0.49 0.72 0.45Control Delay 68.6 17.2 34.2 14.1 28.3 20.6Queue Delay 0.0 0.0 0.0 0.0 0.0 0.0Total Delay 68.6 17.2 34.2 14.1 28.3 20.6Queue Length 50th (m) 27.3 50.2 35.5 11.3 54.1 39.3Queue Length 95th (m) m31.9 m69.3 #64.3 m19.5 77.2 54.4Internal Link Dist (m) 365.7 674.1 256.1 547.0Turn Bay Length (m) 34.0 39.0Base Capacity (vph) 157 1416 653 411 886 1231Starvation Cap Reductn 0 0 0 0 0 0Spillback Cap Reductn 0 0 0 0 0 0Storage Cap Reductn 0 0 0 0 0 0Reduced v/c Ratio 0.85 0.60 0.79 0.49 0.72 0.45
Intersection SummaryCycle Length: 100Actuated Cycle Length: 100Offset: 69 (69%), Referenced to phase 4:EBT and 8:WBTL, Start of GreenNatural Cycle: 70Control Type: Actuated-Coordinated# 95th percentile volume exceeds capacity, queue may be longer. Queue shown is maximum after two cycles.m Volume for 95th percentile queue is metered by upstream signal.
Splits and Phases: 6: Old Weston Rd & St Clair Ave W

HCM Signalized Intersection Capacity Analysis SHORT TERM OPTION 4 & 56: Old Weston Rd & St Clair Ave W Weekday PM Peak Hour
C:\Users\Synchro\Dropbox\LEA\9309\Scenario PM_R04\PM OPTION 4 & 5.syn Synchro 8 Report01/04/2015 Page 2
Movement EBL EBT EBR WBL WBT WBR NBL NBT NBR SBL SBT SBRLane ConfigurationsVolume (vph) 130 494 333 114 386 194 249 323 49 49 444 42Ideal Flow (vphpl) 1900 1900 1900 1900 1900 1900 1900 1900 1900 1900 1900 1900Lane Width 3.0 3.5 3.0 3.0 3.5 3.0 3.0 3.5 3.0 3.0 3.5 3.0Grade (%) 6% 0% 0% 0%Total Lost time (s) 4.0 5.0 5.0 5.0 6.0 6.0Lane Util. Factor 1.00 0.95 0.95 1.00 0.95 0.95Frpb, ped/bikes 1.00 0.90 1.00 0.74 0.97 0.99Flpb, ped/bikes 1.00 1.00 0.98 1.00 0.99 0.99Frt 1.00 0.94 1.00 0.85 0.99 0.99Flt Protected 0.95 1.00 0.99 1.00 0.98 1.00Satd. Flow (prot) 1571 2913 3291 1110 3225 3340Flt Permitted 0.95 1.00 0.63 1.00 0.61 0.83Satd. Flow (perm) 1571 2913 2108 1110 2000 2785Peak-hour factor, PHF 0.97 0.97 0.97 0.97 0.97 0.97 0.97 0.97 0.97 0.97 0.97 0.97Adj. Flow (vph) 134 509 343 118 398 200 257 333 51 51 458 43RTOR Reduction (vph) 0 105 0 0 0 68 0 6 0 0 6 0Lane Group Flow (vph) 134 747 0 0 516 132 0 635 0 0 546 0Confl. Peds. (#/hr) 163 149 149 163 62 307 307 62Confl. Bikes (#/hr) 21 11 18 13Heavy Vehicles (%) 4% 1% 1% 0% 2% 1% 3% 2% 0% 1% 2% 5%Bus Blockages (#/hr) 0 0 0 0 19 0 0 5 10 0 6 12Turn Type Prot NA Perm NA Perm Perm NA Perm NAProtected Phases 7 4 8 2 6Permitted Phases 8 8 2 6Actuated Green, G (s) 9.0 44.0 30.0 30.0 43.0 43.0Effective Green, g (s) 10.0 45.0 31.0 31.0 44.0 44.0Actuated g/C Ratio 0.10 0.45 0.31 0.31 0.44 0.44Clearance Time (s) 5.0 6.0 6.0 6.0 7.0 7.0Vehicle Extension (s) 3.0 3.0 3.0 3.0 3.0 3.0Lane Grp Cap (vph) 157 1310 653 344 880 1225v/s Ratio Prot c0.09 0.26v/s Ratio Perm c0.24 0.12 c0.32 0.20v/c Ratio 0.85 0.57 0.79 0.38 0.72 0.45Uniform Delay, d1 44.3 20.3 31.5 27.0 23.0 19.5Progression Factor 0.99 1.03 0.84 0.77 1.00 1.00Incremental Delay, d2 18.5 0.8 6.9 2.3 5.1 1.2Delay (s) 62.2 21.8 33.3 23.1 28.1 20.7Level of Service E C C C C CApproach Delay (s) 27.3 30.5 28.1 20.7Approach LOS C C C C
Intersection SummaryHCM 2000 Control Delay 27.0 HCM 2000 Level of Service CHCM 2000 Volume to Capacity ratio 0.76Actuated Cycle Length (s) 100.0 Sum of lost time (s) 15.0Intersection Capacity Utilization 107.2% ICU Level of Service GAnalysis Period (min) 15c Critical Lane Group

Queues SHORT TERM OPTION 4 & 510: Keele St/Weston Rd & St Clair Ave W Weekday PM Peak Hour
C:\Users\Synchro\Dropbox\LEA\9309\Scenario PM_R04\PM OPTION 4 & 5.syn Synchro 8 Report01/04/2015 Page 3
Lane Group EBL EBT EBR WBL WBT WBR NBL NBT SBL SBTLane ConfigurationsVolume (vph) 99 498 36 50 470 172 96 665 374 601Lane Group Flow (vph) 105 530 38 53 500 183 102 801 398 689Turn Type pm+pt NA Perm Perm NA Perm pm+pt NA pm+pt NAProtected Phases 7 4 8 5 2 1 6Permitted Phases 4 4 8 8 2 6Detector Phase 7 4 4 8 8 8 5 2 1 6Switch PhaseMinimum Initial (s) 4.0 7.0 7.0 7.0 7.0 7.0 6.0 7.0 6.0 7.0Minimum Split (s) 11.0 32.0 32.0 32.0 32.0 32.0 10.0 37.0 10.0 37.0Total Split (s) 11.0 43.0 43.0 32.0 32.0 32.0 10.0 37.0 20.0 47.0Total Split (%) 11.0% 43.0% 43.0% 32.0% 32.0% 32.0% 10.0% 37.0% 20.0% 47.0%Yellow Time (s) 3.0 4.0 4.0 4.0 4.0 4.0 3.0 4.0 3.0 4.0All-Red Time (s) 1.0 3.0 3.0 3.0 3.0 3.0 1.0 3.0 1.0 3.0Lost Time Adjust (s) -1.0 -1.0 -1.0 -1.0 -1.0 -1.0 -1.0 -1.0 -1.0 -1.0Total Lost Time (s) 3.0 6.0 6.0 6.0 6.0 6.0 3.0 6.0 3.0 6.0Lead/Lag Lead Lag Lag Lag Lead Lag Lead LagLead-Lag Optimize? Yes Yes Yes Yes Yes Yes Yes YesRecall Mode None C-Max C-Max C-Max C-Max C-Max None Max None Maxv/c Ratio 0.35 0.77 0.08 0.46 0.55 0.36 0.29 0.80 1.02 0.47Control Delay 22.7 36.8 0.4 36.7 26.8 4.7 18.8 41.9 74.2 12.2Queue Delay 0.0 0.0 0.0 0.0 0.0 0.0 0.0 0.0 0.0 0.0Total Delay 22.7 36.8 0.4 36.7 26.8 4.7 18.8 41.9 74.2 12.2Queue Length 50th (m) 13.5 93.9 0.0 6.3 34.0 3.0 9.4 60.0 ~27.1 46.1Queue Length 95th (m) 25.0 136.1 0.0 m10.6 m49.7 m5.6 26.1 99.2 #116.6 25.7Internal Link Dist (m) 287.2 365.7 277.9 432.6Turn Bay Length (m) 27.0 37.0 37.0 55.0 80.0Base Capacity (vph) 305 688 450 114 903 515 348 1007 389 1463Starvation Cap Reductn 0 0 0 0 0 0 0 0 0 0Spillback Cap Reductn 0 0 0 0 0 0 0 0 0 0Storage Cap Reductn 0 0 0 0 0 0 0 0 0 0Reduced v/c Ratio 0.34 0.77 0.08 0.46 0.55 0.36 0.29 0.80 1.02 0.47
Intersection SummaryCycle Length: 100Actuated Cycle Length: 100Offset: 0 (0%), Referenced to phase 4:EBTL and 8:WBTL, Start of GreenNatural Cycle: 90Control Type: Actuated-Coordinated~ Volume exceeds capacity, queue is theoretically infinite. Queue shown is maximum after two cycles.# 95th percentile volume exceeds capacity, queue may be longer. Queue shown is maximum after two cycles.m Volume for 95th percentile queue is metered by upstream signal.
Splits and Phases: 10: Keele St/Weston Rd & St Clair Ave W

HCM Signalized Intersection Capacity Analysis SHORT TERM OPTION 4 & 510: Keele St/Weston Rd & St Clair Ave W Weekday PM Peak Hour
C:\Users\Synchro\Dropbox\LEA\9309\Scenario PM_R04\PM OPTION 4 & 5.syn Synchro 8 Report01/04/2015 Page 4
Movement EBL EBT EBR WBL WBT WBR NBL NBT NBR SBL SBT SBRLane ConfigurationsVolume (vph) 99 498 36 50 470 172 96 665 88 374 601 47Ideal Flow (vphpl) 1900 1900 1900 1900 1900 1900 1900 1900 1900 1900 1900 1900Lane Width 3.0 3.5 3.0 3.0 3.0 3.0 3.0 3.5 3.0 3.0 3.5 3.0Grade (%) 0% 6% 0% 0%Total Lost time (s) 3.0 6.0 6.0 6.0 6.0 6.0 3.0 6.0 3.0 6.0Lane Util. Factor 1.00 1.00 1.00 1.00 0.95 1.00 1.00 0.95 1.00 0.95Frpb, ped/bikes 1.00 1.00 0.68 1.00 1.00 0.95 1.00 0.96 1.00 0.99Flpb, ped/bikes 1.00 1.00 1.00 0.88 1.00 1.00 0.99 1.00 0.99 1.00Frt 1.00 1.00 0.85 1.00 1.00 0.85 1.00 0.98 1.00 0.99Flt Protected 0.95 1.00 1.00 0.95 1.00 1.00 0.95 1.00 0.95 1.00Satd. Flow (prot) 1645 1860 994 1415 3204 1361 1672 3219 1669 3390Flt Permitted 0.32 1.00 1.00 0.27 1.00 1.00 0.39 1.00 0.17 1.00Satd. Flow (perm) 549 1860 994 407 3204 1361 686 3219 298 3390Peak-hour factor, PHF 0.94 0.94 0.94 0.94 0.94 0.94 0.94 0.94 0.94 0.94 0.94 0.94Adj. Flow (vph) 105 530 38 53 500 183 102 707 94 398 639 50RTOR Reduction (vph) 0 0 24 0 0 134 0 10 0 0 6 0Lane Group Flow (vph) 105 530 14 53 500 49 102 791 0 398 683 0Confl. Peds. (#/hr) 31 303 303 31 56 197 197 56Confl. Bikes (#/hr) 7 3 2 11Heavy Vehicles (%) 2% 1% 3% 2% 2% 2% 0% 3% 2% 0% 2% 10%Bus Blockages (#/hr) 0 0 0 0 0 0 0 8 16 0 5 11Turn Type pm+pt NA Perm Perm NA Perm pm+pt NA pm+pt NAProtected Phases 7 4 8 5 2 1 6Permitted Phases 4 4 8 8 2 6Actuated Green, G (s) 35.2 35.2 35.2 25.6 25.6 25.6 35.6 30.8 50.8 42.0Effective Green, g (s) 36.2 36.2 36.2 26.6 26.6 26.6 37.6 31.8 51.8 43.0Actuated g/C Ratio 0.36 0.36 0.36 0.27 0.27 0.27 0.38 0.32 0.52 0.43Clearance Time (s) 4.0 7.0 7.0 7.0 7.0 7.0 4.0 7.0 4.0 7.0Vehicle Extension (s) 3.0 3.0 3.0 3.0 3.0 3.0 3.0 3.0 3.0 3.0Lane Grp Cap (vph) 271 673 359 108 852 362 315 1023 387 1457v/s Ratio Prot 0.03 c0.28 0.16 0.02 0.25 c0.17 0.20v/s Ratio Perm 0.11 0.01 0.13 0.04 0.10 c0.36v/c Ratio 0.39 0.79 0.04 0.49 0.59 0.13 0.32 0.77 1.03 0.47Uniform Delay, d1 22.3 28.5 20.6 31.0 31.9 27.9 20.7 30.8 24.0 20.3Progression Factor 1.00 1.00 1.00 0.79 0.79 0.71 1.36 1.15 1.02 0.54Incremental Delay, d2 0.9 9.1 0.2 10.7 2.1 0.5 0.5 4.9 51.2 1.0Delay (s) 23.2 37.5 20.8 35.2 27.4 20.3 28.7 40.5 75.6 12.0Level of Service C D C D C C C D E BApproach Delay (s) 34.3 26.2 39.2 35.3Approach LOS C C D D
Intersection SummaryHCM 2000 Control Delay 34.2 HCM 2000 Level of Service CHCM 2000 Volume to Capacity ratio 0.99Actuated Cycle Length (s) 100.0 Sum of lost time (s) 18.0Intersection Capacity Utilization 96.1% ICU Level of Service FAnalysis Period (min) 15c Critical Lane Group

Queues SHORT TERM OPTION 4 & 66: Old Weston Rd & St Clair Ave W Weekday AM Peak Hour
F:\9309\Traffic\Synchro\Scenario AM_R04\AM OPTION 4 & 6.syn Synchro 8 Report02/04/2015 Page 1
Lane Group EBL EBT WBL WBT WBR NBL NBT SBL SBTLane ConfigurationsVolume (vph) 49 616 52 502 54 59 491 98 304Lane Group Flow (vph) 51 969 0 572 56 0 731 0 500Turn Type Prot NA Perm NA Perm Perm NA Perm NAProtected Phases 7 4 8 2 6Permitted Phases 8 8 2 6Detector Phase 7 4 8 8 8 2 2 6 6Switch PhaseMinimum Initial (s) 4.0 4.0 4.0 4.0 4.0 4.0 4.0 4.0 4.0Minimum Split (s) 9.0 26.0 26.0 26.0 26.0 34.0 34.0 34.0 34.0Total Split (s) 11.0 53.0 42.0 42.0 42.0 47.0 47.0 47.0 47.0Total Split (%) 11.0% 53.0% 42.0% 42.0% 42.0% 47.0% 47.0% 47.0% 47.0%Yellow Time (s) 3.0 4.0 4.0 4.0 4.0 4.0 4.0 4.0 4.0All-Red Time (s) 2.0 2.0 2.0 2.0 2.0 3.0 3.0 3.0 3.0Lost Time Adjust (s) -1.0 -1.0 -1.0 -1.0 -1.0 -1.0Total Lost Time (s) 4.0 5.0 5.0 5.0 6.0 6.0Lead/Lag Lead Lag Lag LagLead-Lag Optimize? Yes Yes Yes YesRecall Mode None C-Max C-Max C-Max C-Max Max Max Max Maxv/c Ratio 0.49 0.64 0.58 0.12 0.65 0.65Control Delay 56.3 15.0 25.1 1.0 25.6 27.2Queue Delay 0.0 0.0 0.0 0.0 0.0 0.0Total Delay 56.3 15.0 25.1 1.0 25.6 27.2Queue Length 50th (m) 10.8 49.1 59.0 0.0 58.2 39.8Queue Length 95th (m) m11.1 m43.2 78.7 m0.8 79.4 59.3Internal Link Dist (m) 365.7 674.1 256.1 547.0Turn Bay Length (m) 34.0 39.0Base Capacity (vph) 106 1515 978 466 1117 764Starvation Cap Reductn 0 0 0 0 0 0Spillback Cap Reductn 0 0 0 0 0 0Storage Cap Reductn 0 0 0 0 0 0Reduced v/c Ratio 0.48 0.64 0.58 0.12 0.65 0.65
Intersection SummaryCycle Length: 100Actuated Cycle Length: 100Offset: 23 (23%), Referenced to phase 4:EBT and 8:WBTL, Start of GreenNatural Cycle: 70Control Type: Actuated-Coordinatedm Volume for 95th percentile queue is metered by upstream signal.
Splits and Phases: 6: Old Weston Rd & St Clair Ave W

HCM Signalized Intersection Capacity Analysis SHORT TERM OPTION 4 & 66: Old Weston Rd & St Clair Ave W Weekday AM Peak Hour
F:\9309\Traffic\Synchro\Scenario AM_R04\AM OPTION 4 & 6.syn Synchro 8 Report02/04/2015 Page 2
Movement EBL EBT EBR WBL WBT WBR NBL NBT NBR SBL SBT SBRLane ConfigurationsVolume (vph) 49 616 324 52 502 54 59 491 159 98 304 83Ideal Flow (vphpl) 1900 1900 1900 1900 1900 1900 1900 1900 1900 1900 1900 1900Lane Width 3.0 3.5 3.0 3.0 3.5 3.0 3.0 3.5 3.0 3.0 3.5 3.0Grade (%) 6% 0% 0% 0%Total Lost time (s) 4.0 5.0 5.0 5.0 6.0 6.0Lane Util. Factor 1.00 0.95 0.95 1.00 0.95 0.95Frpb, ped/bikes 1.00 0.96 1.00 0.73 0.99 0.97Flpb, ped/bikes 1.00 1.00 1.00 1.00 0.99 1.00Frt 1.00 0.95 1.00 0.85 0.97 0.97Flt Protected 0.95 1.00 1.00 1.00 1.00 0.99Satd. Flow (prot) 1527 3016 3223 1036 3108 2961Flt Permitted 0.95 1.00 0.77 1.00 0.85 0.61Satd. Flow (perm) 1527 3016 2496 1036 2662 1822Peak-hour factor, PHF 0.97 0.97 0.97 0.97 0.97 0.97 0.97 0.97 0.97 0.97 0.97 0.97Adj. Flow (vph) 51 635 334 54 518 56 61 506 164 101 313 86RTOR Reduction (vph) 0 68 0 0 0 35 0 27 0 0 18 0Lane Group Flow (vph) 51 901 0 0 572 21 0 704 0 0 482 0Confl. Peds. (#/hr) 176 60 60 176 145 35 35 145Confl. Bikes (#/hr) 8 3 8 6Heavy Vehicles (%) 7% 5% 5% 38% 2% 6% 15% 8% 0% 15% 10% 10%Bus Blockages (#/hr) 0 0 0 0 21 0 0 8 18 0 7 15Turn Type Prot NA Perm NA Perm Perm NA Perm NAProtected Phases 7 4 8 2 6Permitted Phases 8 8 2 6Actuated Green, G (s) 4.8 47.0 37.2 37.2 40.0 40.0Effective Green, g (s) 5.8 48.0 38.2 38.2 41.0 41.0Actuated g/C Ratio 0.06 0.48 0.38 0.38 0.41 0.41Clearance Time (s) 5.0 6.0 6.0 6.0 7.0 7.0Vehicle Extension (s) 3.0 3.0 3.0 3.0 3.0 3.0Lane Grp Cap (vph) 88 1447 953 395 1091 747v/s Ratio Prot 0.03 c0.30v/s Ratio Perm 0.23 0.02 0.26 c0.26v/c Ratio 0.58 0.62 0.60 0.05 0.65 0.65Uniform Delay, d1 45.9 19.3 24.8 19.5 23.7 23.7Progression Factor 1.20 0.88 0.91 0.44 1.00 1.00Incremental Delay, d2 0.8 0.2 2.4 0.2 3.0 4.3Delay (s) 56.1 17.2 24.9 8.8 26.6 27.9Level of Service E B C A C CApproach Delay (s) 19.2 23.5 26.6 27.9Approach LOS B C C C
Intersection SummaryHCM 2000 Control Delay 23.5 HCM 2000 Level of Service CHCM 2000 Volume to Capacity ratio 0.66Actuated Cycle Length (s) 100.0 Sum of lost time (s) 15.0Intersection Capacity Utilization 108.9% ICU Level of Service GAnalysis Period (min) 15c Critical Lane Group

Queues SHORT TERM OPTION 4 & 610: Keele St/Weston Rd & St Clair Ave W Weekday AM Peak Hour
F:\9309\Traffic\Synchro\Scenario AM_R04\AM OPTION 4 & 6.syn Synchro 8 Report02/04/2015 Page 3
Lane Group EBL EBT EBR WBL WBT NBL NBT SBL SBTLane ConfigurationsVolume (vph) 53 546 58 21 468 54 634 367 892Lane Group Flow (vph) 59 607 64 23 696 60 791 408 1057Turn Type Prot NA Perm Prot NA pm+pt NA pm+pt NAProtected Phases 7 4 3 8 5 2 1 6Permitted Phases 4 2 6Detector Phase 7 4 4 3 8 5 2 1 6Switch PhaseMinimum Initial (s) 4.0 7.0 7.0 6.0 7.0 6.0 7.0 6.0 7.0Minimum Split (s) 11.0 32.0 32.0 11.0 32.0 10.0 37.0 10.0 37.0Total Split (s) 11.0 37.0 37.0 11.0 37.0 10.0 37.0 15.0 42.0Total Split (%) 11.0% 37.0% 37.0% 11.0% 37.0% 10.0% 37.0% 15.0% 42.0%Yellow Time (s) 3.0 4.0 4.0 3.0 4.0 3.0 4.0 3.0 4.0All-Red Time (s) 2.0 3.0 3.0 2.0 3.0 1.0 3.0 1.0 3.0Lost Time Adjust (s) -1.0 -1.0 -1.0 -1.0 -1.0 -1.0 -1.0 -1.0 -1.0Total Lost Time (s) 4.0 6.0 6.0 4.0 6.0 3.0 6.0 3.0 6.0Lead/Lag Lead Lag Lag Lead Lag Lead Lag Lead LagLead-Lag Optimize? Yes Yes Yes Yes Yes Yes Yes Yes YesRecall Mode None C-Max C-Max None C-Max None Max None Maxv/c Ratio 0.54 0.88 0.13 0.20 0.67 0.35 0.79 1.36 0.86Control Delay 52.7 55.5 6.3 40.1 38.8 23.8 44.1 200.9 27.4Queue Delay 0.0 0.0 0.0 0.0 0.0 0.0 0.0 0.0 0.0Total Delay 52.7 55.5 6.3 40.1 38.8 23.8 44.1 200.9 27.4Queue Length 50th (m) 12.1 131.8 1.3 5.0 73.8 8.7 91.0 ~81.9 106.0Queue Length 95th (m) #28.9 #213.0 8.3 m8.6 91.8 18.5 111.1 #142.7 #147.5Internal Link Dist (m) 287.2 365.7 277.9 432.6Turn Bay Length (m) 27.0 37.0 55.0 80.0Base Capacity (vph) 111 686 480 113 1043 172 1006 299 1233Starvation Cap Reductn 0 0 0 0 0 0 0 0 0Spillback Cap Reductn 0 0 0 0 0 0 0 0 0Storage Cap Reductn 0 0 0 0 0 0 0 0 0Reduced v/c Ratio 0.53 0.88 0.13 0.20 0.67 0.35 0.79 1.36 0.86
Intersection SummaryCycle Length: 100Actuated Cycle Length: 100Offset: 0 (0%), Referenced to phase 4:EBT and 8:WBT, Start of GreenNatural Cycle: 110Control Type: Actuated-Coordinated~ Volume exceeds capacity, queue is theoretically infinite. Queue shown is maximum after two cycles.# 95th percentile volume exceeds capacity, queue may be longer. Queue shown is maximum after two cycles.m Volume for 95th percentile queue is metered by upstream signal.
Splits and Phases: 10: Keele St/Weston Rd & St Clair Ave W
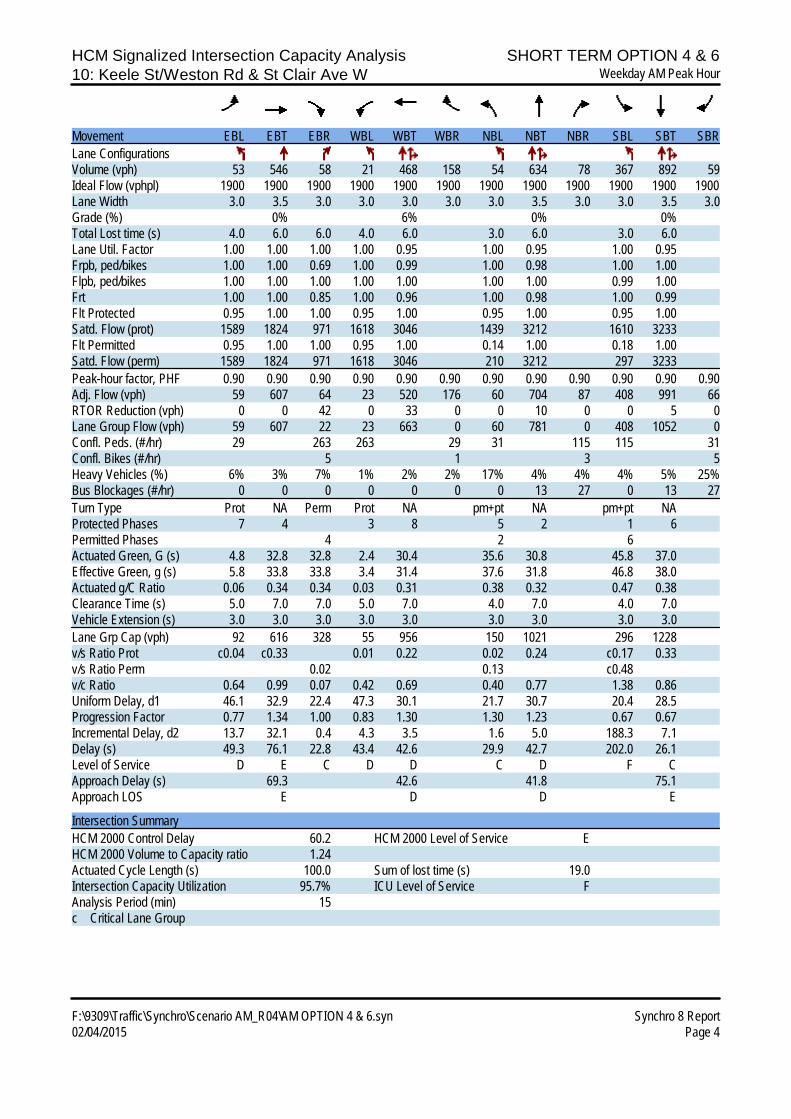
HCM Signalized Intersection Capacity Analysis SHORT TERM OPTION 4 & 610: Keele St/Weston Rd & St Clair Ave W Weekday AM Peak Hour
F:\9309\Traffic\Synchro\Scenario AM_R04\AM OPTION 4 & 6.syn Synchro 8 Report02/04/2015 Page 4
Movement EBL EBT EBR WBL WBT WBR NBL NBT NBR SBL SBT SBRLane ConfigurationsVolume (vph) 53 546 58 21 468 158 54 634 78 367 892 59Ideal Flow (vphpl) 1900 1900 1900 1900 1900 1900 1900 1900 1900 1900 1900 1900Lane Width 3.0 3.5 3.0 3.0 3.0 3.0 3.0 3.5 3.0 3.0 3.5 3.0Grade (%) 0% 6% 0% 0%Total Lost time (s) 4.0 6.0 6.0 4.0 6.0 3.0 6.0 3.0 6.0Lane Util. Factor 1.00 1.00 1.00 1.00 0.95 1.00 0.95 1.00 0.95Frpb, ped/bikes 1.00 1.00 0.69 1.00 0.99 1.00 0.98 1.00 1.00Flpb, ped/bikes 1.00 1.00 1.00 1.00 1.00 1.00 1.00 0.99 1.00Frt 1.00 1.00 0.85 1.00 0.96 1.00 0.98 1.00 0.99Flt Protected 0.95 1.00 1.00 0.95 1.00 0.95 1.00 0.95 1.00Satd. Flow (prot) 1589 1824 971 1618 3046 1439 3212 1610 3233Flt Permitted 0.95 1.00 1.00 0.95 1.00 0.14 1.00 0.18 1.00Satd. Flow (perm) 1589 1824 971 1618 3046 210 3212 297 3233Peak-hour factor, PHF 0.90 0.90 0.90 0.90 0.90 0.90 0.90 0.90 0.90 0.90 0.90 0.90Adj. Flow (vph) 59 607 64 23 520 176 60 704 87 408 991 66RTOR Reduction (vph) 0 0 42 0 33 0 0 10 0 0 5 0Lane Group Flow (vph) 59 607 22 23 663 0 60 781 0 408 1052 0Confl. Peds. (#/hr) 29 263 263 29 31 115 115 31Confl. Bikes (#/hr) 5 1 3 5Heavy Vehicles (%) 6% 3% 7% 1% 2% 2% 17% 4% 4% 4% 5% 25%Bus Blockages (#/hr) 0 0 0 0 0 0 0 13 27 0 13 27Turn Type Prot NA Perm Prot NA pm+pt NA pm+pt NAProtected Phases 7 4 3 8 5 2 1 6Permitted Phases 4 2 6Actuated Green, G (s) 4.8 32.8 32.8 2.4 30.4 35.6 30.8 45.8 37.0Effective Green, g (s) 5.8 33.8 33.8 3.4 31.4 37.6 31.8 46.8 38.0Actuated g/C Ratio 0.06 0.34 0.34 0.03 0.31 0.38 0.32 0.47 0.38Clearance Time (s) 5.0 7.0 7.0 5.0 7.0 4.0 7.0 4.0 7.0Vehicle Extension (s) 3.0 3.0 3.0 3.0 3.0 3.0 3.0 3.0 3.0Lane Grp Cap (vph) 92 616 328 55 956 150 1021 296 1228v/s Ratio Prot c0.04 c0.33 0.01 0.22 0.02 0.24 c0.17 0.33v/s Ratio Perm 0.02 0.13 c0.48v/c Ratio 0.64 0.99 0.07 0.42 0.69 0.40 0.77 1.38 0.86Uniform Delay, d1 46.1 32.9 22.4 47.3 30.1 21.7 30.7 20.4 28.5Progression Factor 0.77 1.34 1.00 0.83 1.30 1.30 1.23 0.67 0.67Incremental Delay, d2 13.7 32.1 0.4 4.3 3.5 1.6 5.0 188.3 7.1Delay (s) 49.3 76.1 22.8 43.4 42.6 29.9 42.7 202.0 26.1Level of Service D E C D D C D F CApproach Delay (s) 69.3 42.6 41.8 75.1Approach LOS E D D E
Intersection SummaryHCM 2000 Control Delay 60.2 HCM 2000 Level of Service EHCM 2000 Volume to Capacity ratio 1.24Actuated Cycle Length (s) 100.0 Sum of lost time (s) 19.0Intersection Capacity Utilization 95.7% ICU Level of Service FAnalysis Period (min) 15c Critical Lane Group
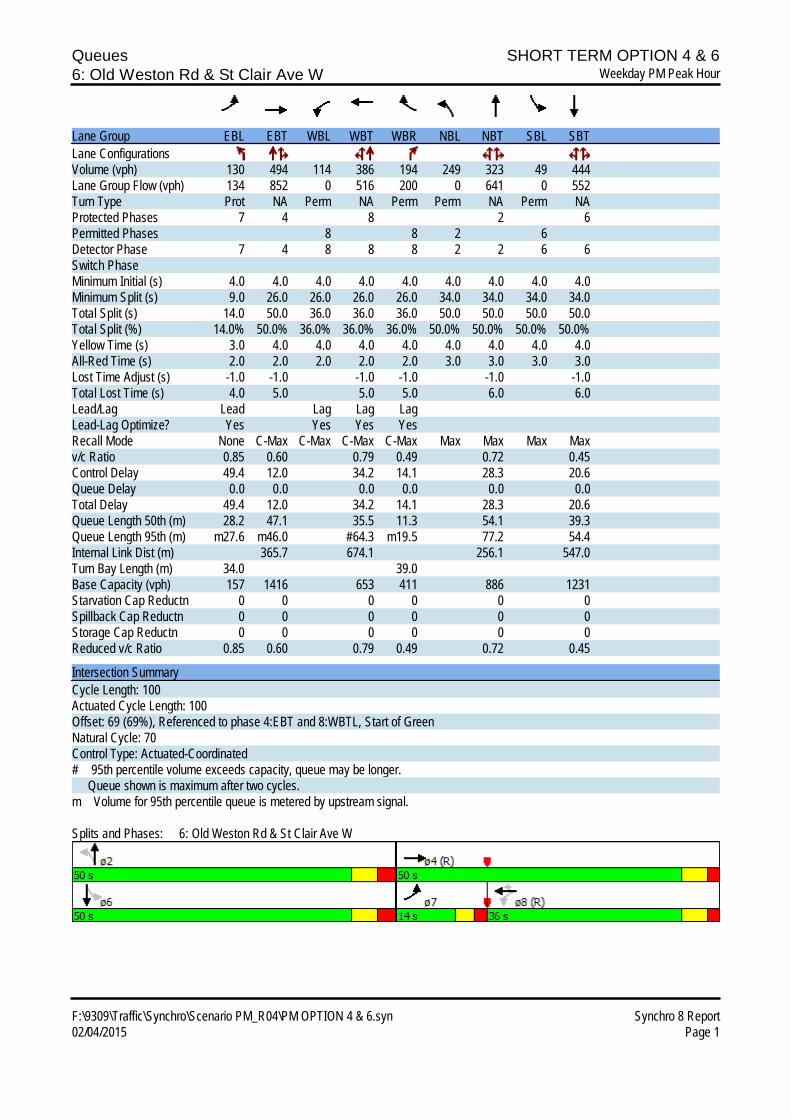
Queues SHORT TERM OPTION 4 & 66: Old Weston Rd & St Clair Ave W Weekday PM Peak Hour
F:\9309\Traffic\Synchro\Scenario PM_R04\PM OPTION 4 & 6.syn Synchro 8 Report02/04/2015 Page 1
Lane Group EBL EBT WBL WBT WBR NBL NBT SBL SBTLane ConfigurationsVolume (vph) 130 494 114 386 194 249 323 49 444Lane Group Flow (vph) 134 852 0 516 200 0 641 0 552Turn Type Prot NA Perm NA Perm Perm NA Perm NAProtected Phases 7 4 8 2 6Permitted Phases 8 8 2 6Detector Phase 7 4 8 8 8 2 2 6 6Switch PhaseMinimum Initial (s) 4.0 4.0 4.0 4.0 4.0 4.0 4.0 4.0 4.0Minimum Split (s) 9.0 26.0 26.0 26.0 26.0 34.0 34.0 34.0 34.0Total Split (s) 14.0 50.0 36.0 36.0 36.0 50.0 50.0 50.0 50.0Total Split (%) 14.0% 50.0% 36.0% 36.0% 36.0% 50.0% 50.0% 50.0% 50.0%Yellow Time (s) 3.0 4.0 4.0 4.0 4.0 4.0 4.0 4.0 4.0All-Red Time (s) 2.0 2.0 2.0 2.0 2.0 3.0 3.0 3.0 3.0Lost Time Adjust (s) -1.0 -1.0 -1.0 -1.0 -1.0 -1.0Total Lost Time (s) 4.0 5.0 5.0 5.0 6.0 6.0Lead/Lag Lead Lag Lag LagLead-Lag Optimize? Yes Yes Yes YesRecall Mode None C-Max C-Max C-Max C-Max Max Max Max Maxv/c Ratio 0.85 0.60 0.79 0.49 0.72 0.45Control Delay 49.4 12.0 34.2 14.1 28.3 20.6Queue Delay 0.0 0.0 0.0 0.0 0.0 0.0Total Delay 49.4 12.0 34.2 14.1 28.3 20.6Queue Length 50th (m) 28.2 47.1 35.5 11.3 54.1 39.3Queue Length 95th (m) m27.6 m46.0 #64.3 m19.5 77.2 54.4Internal Link Dist (m) 365.7 674.1 256.1 547.0Turn Bay Length (m) 34.0 39.0Base Capacity (vph) 157 1416 653 411 886 1231Starvation Cap Reductn 0 0 0 0 0 0Spillback Cap Reductn 0 0 0 0 0 0Storage Cap Reductn 0 0 0 0 0 0Reduced v/c Ratio 0.85 0.60 0.79 0.49 0.72 0.45
Intersection SummaryCycle Length: 100Actuated Cycle Length: 100Offset: 69 (69%), Referenced to phase 4:EBT and 8:WBTL, Start of GreenNatural Cycle: 70Control Type: Actuated-Coordinated# 95th percentile volume exceeds capacity, queue may be longer. Queue shown is maximum after two cycles.m Volume for 95th percentile queue is metered by upstream signal.
Splits and Phases: 6: Old Weston Rd & St Clair Ave W

HCM Signalized Intersection Capacity Analysis SHORT TERM OPTION 4 & 66: Old Weston Rd & St Clair Ave W Weekday PM Peak Hour
F:\9309\Traffic\Synchro\Scenario PM_R04\PM OPTION 4 & 6.syn Synchro 8 Report02/04/2015 Page 2
Movement EBL EBT EBR WBL WBT WBR NBL NBT NBR SBL SBT SBRLane ConfigurationsVolume (vph) 130 494 333 114 386 194 249 323 49 49 444 42Ideal Flow (vphpl) 1900 1900 1900 1900 1900 1900 1900 1900 1900 1900 1900 1900Lane Width 3.0 3.5 3.0 3.0 3.5 3.0 3.0 3.5 3.0 3.0 3.5 3.0Grade (%) 6% 0% 0% 0%Total Lost time (s) 4.0 5.0 5.0 5.0 6.0 6.0Lane Util. Factor 1.00 0.95 0.95 1.00 0.95 0.95Frpb, ped/bikes 1.00 0.90 1.00 0.74 0.97 0.99Flpb, ped/bikes 1.00 1.00 0.98 1.00 0.99 0.99Frt 1.00 0.94 1.00 0.85 0.99 0.99Flt Protected 0.95 1.00 0.99 1.00 0.98 1.00Satd. Flow (prot) 1571 2913 3291 1110 3225 3340Flt Permitted 0.95 1.00 0.63 1.00 0.61 0.83Satd. Flow (perm) 1571 2913 2108 1110 2000 2785Peak-hour factor, PHF 0.97 0.97 0.97 0.97 0.97 0.97 0.97 0.97 0.97 0.97 0.97 0.97Adj. Flow (vph) 134 509 343 118 398 200 257 333 51 51 458 43RTOR Reduction (vph) 0 105 0 0 0 68 0 6 0 0 6 0Lane Group Flow (vph) 134 747 0 0 516 132 0 635 0 0 546 0Confl. Peds. (#/hr) 163 149 149 163 62 307 307 62Confl. Bikes (#/hr) 21 11 18 13Heavy Vehicles (%) 4% 1% 1% 0% 2% 1% 3% 2% 0% 1% 2% 5%Bus Blockages (#/hr) 0 0 0 0 19 0 0 5 10 0 6 12Turn Type Prot NA Perm NA Perm Perm NA Perm NAProtected Phases 7 4 8 2 6Permitted Phases 8 8 2 6Actuated Green, G (s) 9.0 44.0 30.0 30.0 43.0 43.0Effective Green, g (s) 10.0 45.0 31.0 31.0 44.0 44.0Actuated g/C Ratio 0.10 0.45 0.31 0.31 0.44 0.44Clearance Time (s) 5.0 6.0 6.0 6.0 7.0 7.0Vehicle Extension (s) 3.0 3.0 3.0 3.0 3.0 3.0Lane Grp Cap (vph) 157 1310 653 344 880 1225v/s Ratio Prot c0.09 0.26v/s Ratio Perm c0.24 0.12 c0.32 0.20v/c Ratio 0.85 0.57 0.79 0.38 0.72 0.45Uniform Delay, d1 44.3 20.3 31.5 27.0 23.0 19.5Progression Factor 0.94 0.74 0.84 0.77 1.00 1.00Incremental Delay, d2 4.3 0.2 6.9 2.3 5.1 1.2Delay (s) 46.0 15.3 33.3 23.1 28.1 20.7Level of Service D B C C C CApproach Delay (s) 19.5 30.5 28.1 20.7Approach LOS B C C C
Intersection SummaryHCM 2000 Control Delay 24.3 HCM 2000 Level of Service CHCM 2000 Volume to Capacity ratio 0.76Actuated Cycle Length (s) 100.0 Sum of lost time (s) 15.0Intersection Capacity Utilization 107.2% ICU Level of Service GAnalysis Period (min) 15c Critical Lane Group

Queues SHORT TERM OPTION 4 & 610: Keele St/Weston Rd & St Clair Ave W Weekday PM Peak Hour
F:\9309\Traffic\Synchro\Scenario PM_R04\PM OPTION 4 & 6.syn Synchro 8 Report02/04/2015 Page 3
Lane Group EBL EBT EBR WBL WBT NBL NBT SBL SBTLane ConfigurationsVolume (vph) 99 498 36 50 470 96 665 374 601Lane Group Flow (vph) 105 530 38 53 683 102 801 398 689Turn Type Prot NA Perm Prot NA pm+pt NA pm+pt NAProtected Phases 7 4 3 8 5 2 1 6Permitted Phases 4 2 6Detector Phase 7 4 4 3 8 5 2 1 6Switch PhaseMinimum Initial (s) 4.0 7.0 7.0 6.0 7.0 6.0 7.0 6.0 7.0Minimum Split (s) 11.0 32.0 32.0 11.0 32.0 10.0 37.0 10.0 37.0Total Split (s) 11.0 34.0 34.0 11.0 34.0 10.0 37.0 18.0 45.0Total Split (%) 11.0% 34.0% 34.0% 11.0% 34.0% 10.0% 37.0% 18.0% 45.0%Yellow Time (s) 3.0 4.0 4.0 3.0 4.0 3.0 4.0 3.0 4.0All-Red Time (s) 2.0 3.0 3.0 2.0 3.0 1.0 3.0 1.0 3.0Lost Time Adjust (s) -1.0 -1.0 -1.0 -1.0 -1.0 -1.0 -1.0 -1.0 -1.0Total Lost Time (s) 4.0 6.0 6.0 4.0 6.0 3.0 6.0 3.0 6.0Lead/Lag Lead Lag Lag Lead Lag Lead Lag Lead LagLead-Lag Optimize? Yes Yes Yes Yes Yes Yes Yes Yes YesRecall Mode None C-Max C-Max Min C-Max None Max None Maxv/c Ratio 0.91 1.02 0.09 0.47 0.77 0.29 0.80 1.12 0.49Control Delay 111.4 81.4 0.4 72.1 29.2 19.9 41.9 106.5 13.9Queue Delay 0.0 0.0 0.0 0.0 0.0 0.0 0.0 0.0 0.0Total Delay 111.4 81.4 0.4 72.1 29.2 19.9 41.9 106.5 13.9Queue Length 50th (m) 21.7 ~111.4 0.0 11.8 51.8 9.8 60.0 ~63.6 54.8Queue Length 95th (m) #54.3 #179.6 0.0 m16.6 68.8 27.0 99.2 #124.0 41.2Internal Link Dist (m) 287.2 365.7 277.9 432.6Turn Bay Length (m) 27.0 37.0 55.0 80.0Base Capacity (vph) 115 520 411 112 886 348 1007 355 1395Starvation Cap Reductn 0 0 0 0 0 0 0 0 0Spillback Cap Reductn 0 0 0 0 0 0 0 0 0Storage Cap Reductn 0 0 0 0 0 0 0 0 0Reduced v/c Ratio 0.91 1.02 0.09 0.47 0.77 0.29 0.80 1.12 0.49
Intersection SummaryCycle Length: 100Actuated Cycle Length: 100Offset: 0 (0%), Referenced to phase 4:EBT and 8:WBT, Start of GreenNatural Cycle: 100Control Type: Actuated-Coordinated~ Volume exceeds capacity, queue is theoretically infinite. Queue shown is maximum after two cycles.# 95th percentile volume exceeds capacity, queue may be longer. Queue shown is maximum after two cycles.m Volume for 95th percentile queue is metered by upstream signal.
Splits and Phases: 10: Keele St/Weston Rd & St Clair Ave W

HCM Signalized Intersection Capacity Analysis SHORT TERM OPTION 4 & 610: Keele St/Weston Rd & St Clair Ave W Weekday PM Peak Hour
F:\9309\Traffic\Synchro\Scenario PM_R04\PM OPTION 4 & 6.syn Synchro 8 Report02/04/2015 Page 4
Movement EBL EBT EBR WBL WBT WBR NBL NBT NBR SBL SBT SBRLane ConfigurationsVolume (vph) 99 498 36 50 470 172 96 665 88 374 601 47Ideal Flow (vphpl) 1900 1900 1900 1900 1900 1900 1900 1900 1900 1900 1900 1900Lane Width 3.0 3.5 3.0 3.0 3.0 3.0 3.0 3.5 3.0 3.0 3.5 3.0Grade (%) 0% 6% 0% 0%Total Lost time (s) 4.0 6.0 6.0 4.0 6.0 3.0 6.0 3.0 6.0Lane Util. Factor 1.00 1.00 1.00 1.00 0.95 1.00 0.95 1.00 0.95Frpb, ped/bikes 1.00 1.00 0.68 1.00 0.99 1.00 0.96 1.00 0.99Flpb, ped/bikes 1.00 1.00 1.00 1.00 1.00 0.99 1.00 0.99 1.00Frt 1.00 1.00 0.85 1.00 0.96 1.00 0.98 1.00 0.99Flt Protected 0.95 1.00 1.00 0.95 1.00 0.95 1.00 0.95 1.00Satd. Flow (prot) 1652 1860 993 1602 3034 1672 3219 1669 3390Flt Permitted 0.95 1.00 1.00 0.95 1.00 0.39 1.00 0.17 1.00Satd. Flow (perm) 1652 1860 993 1602 3034 686 3219 298 3390Peak-hour factor, PHF 0.94 0.94 0.94 0.94 0.94 0.94 0.94 0.94 0.94 0.94 0.94 0.94Adj. Flow (vph) 105 530 38 53 500 183 102 707 94 398 639 50RTOR Reduction (vph) 0 0 28 0 38 0 0 10 0 0 5 0Lane Group Flow (vph) 105 530 10 53 645 0 102 791 0 398 684 0Confl. Peds. (#/hr) 31 303 303 31 56 197 197 56Confl. Bikes (#/hr) 7 3 2 11Heavy Vehicles (%) 2% 1% 3% 2% 2% 2% 0% 3% 2% 0% 2% 10%Bus Blockages (#/hr) 0 0 0 0 0 0 0 8 16 0 5 11Turn Type Prot NA Perm Prot NA pm+pt NA pm+pt NAProtected Phases 7 4 3 8 5 2 1 6Permitted Phases 4 2 6Actuated Green, G (s) 6.0 26.2 26.2 6.0 26.2 35.6 30.8 48.8 40.0Effective Green, g (s) 7.0 27.2 27.2 7.0 27.2 37.6 31.8 49.8 41.0Actuated g/C Ratio 0.07 0.27 0.27 0.07 0.27 0.38 0.32 0.50 0.41Clearance Time (s) 5.0 7.0 7.0 5.0 7.0 4.0 7.0 4.0 7.0Vehicle Extension (s) 3.0 3.0 3.0 3.0 3.0 3.0 3.0 3.0 3.0Lane Grp Cap (vph) 115 505 270 112 825 315 1023 354 1389v/s Ratio Prot c0.06 c0.28 0.03 0.21 0.02 0.25 c0.17 0.20v/s Ratio Perm 0.01 0.10 c0.39v/c Ratio 0.91 1.05 0.04 0.47 0.78 0.32 0.77 1.12 0.49Uniform Delay, d1 46.2 36.4 26.8 44.7 33.7 20.7 30.8 23.1 21.8Progression Factor 1.00 1.00 1.00 1.37 0.80 1.36 1.15 1.01 0.57Incremental Delay, d2 57.2 53.7 0.3 2.2 5.2 0.5 4.9 83.9 1.1Delay (s) 103.4 90.1 27.0 63.6 32.1 28.8 40.5 107.2 13.6Level of Service F F C E C C D F BApproach Delay (s) 88.6 34.4 39.2 47.8Approach LOS F C D D
Intersection SummaryHCM 2000 Control Delay 50.7 HCM 2000 Level of Service DHCM 2000 Volume to Capacity ratio 1.12Actuated Cycle Length (s) 100.0 Sum of lost time (s) 19.0Intersection Capacity Utilization 93.6% ICU Level of Service FAnalysis Period (min) 15c Critical Lane Group