appendix e risk analysis - delta revision e risk analysis ... levee probability of failure, (%)...
TRANSCRIPT

Sacramento and San Joaquin River Basins 1 Technical StudiesComprehensive Study, California December 2002
APPENDIX E
RISK ANALYSIS
INTRODUCTION
Risk describes the chance that some undesirable event will occur, resulting in exposure toinjury or loss. Risk is typically associated with an acceptable standard or desired level ofreliability. In flood damage reduction studies, the acceptable level of flood risk is oftenexpressed as level of protection or performance. Uncertainty is an expression of doubt in theaccuracy of knowledge or information. Flood damage reduction studies regularly useestimated information, such as stream flow records or stage predicted by hydraulic models,with varying degrees of accuracy or reliability. Risk and uncertainty are related in that flooddamage reduction studies rely on an estimation of flood risk that is based on uncertaininformation. Uncertainty is also associated with environmental conditions and assumptionsthat could affect the success of ecosystem restoration efforts.
The Corps of Engineers historical approach to flood damage reduction planning hasaccounted for uncertainty by using safety factors, freeboard, worst-case scenarios, and otherprocedures that acknowledge uncertainty, but do not explicitly quantify it. This wasnecessary because of a lack in precision in predicting the complex interaction of hydrologic,hydraulic, and economic functions and because of the complexities of the requiredmathematics. An example of this traditional approach is the use of freeboard in projects thatinvolved the construction of levees. Levees were designed based on a best estimate of theheight required to contain a given flood; this height was then augmented by a standardincrement of levee height, or freeboard, to account for uncertainty in hydrology andhydraulics. Unfortunately, the standard freeboard approach could not be tailored to localizedconditions, did not consider the levee system as a whole, did not provide a consistent level ofprotection from project to project, and may have added unnecessary costs to some projects.
Today, advances in statistical hydrology and high-speed computerized analysis tools havemade it possible to explicitly account for uncertainty. The Comprehensive Study has adopteda risk analysis approach that utilizes the Hydrologic Engineering Center’s Flood DamageAssessment (HEC-FDA) computer model to analytically incorporate considerations of riskand uncertainty to express engineering and economic performance in terms of probabilitydistributions. This appendix presents the risk analysis methodology used for this study toevaluate without-project (baseline) and with-project flood risk and economic damages.
TRADITIONAL RISK ANALYSIS APPROACH
Traditional risk analyses rely on information in the form of discharge-frequency, stage-frequency, and stage-damage functions identified at index points. The index points representthe link or interrelation between flood conditions and damages in an area or reach. They arethe location where hydrology, hydraulics, geotechnical considerations, and types of damage
Appendix ERisk Analysis
Sacramento and San Joaquin River Basins 2 Technical StudiesComprehensive Study, California December 2002
are equated to flood damages or flood risk. The discharge-frequency, stage-frequency, stage-damage functions, and geotechnical probability of failure curves describe the hydrologic,hydraulic, geotechnical, and economic conditions at each index point. A certain degree ofuncertainty is inherent in these functions, ranging from deficiencies in hydrologic datarecords or the ability of a hydraulic model to accurately estimate stage in a complex riversystem.
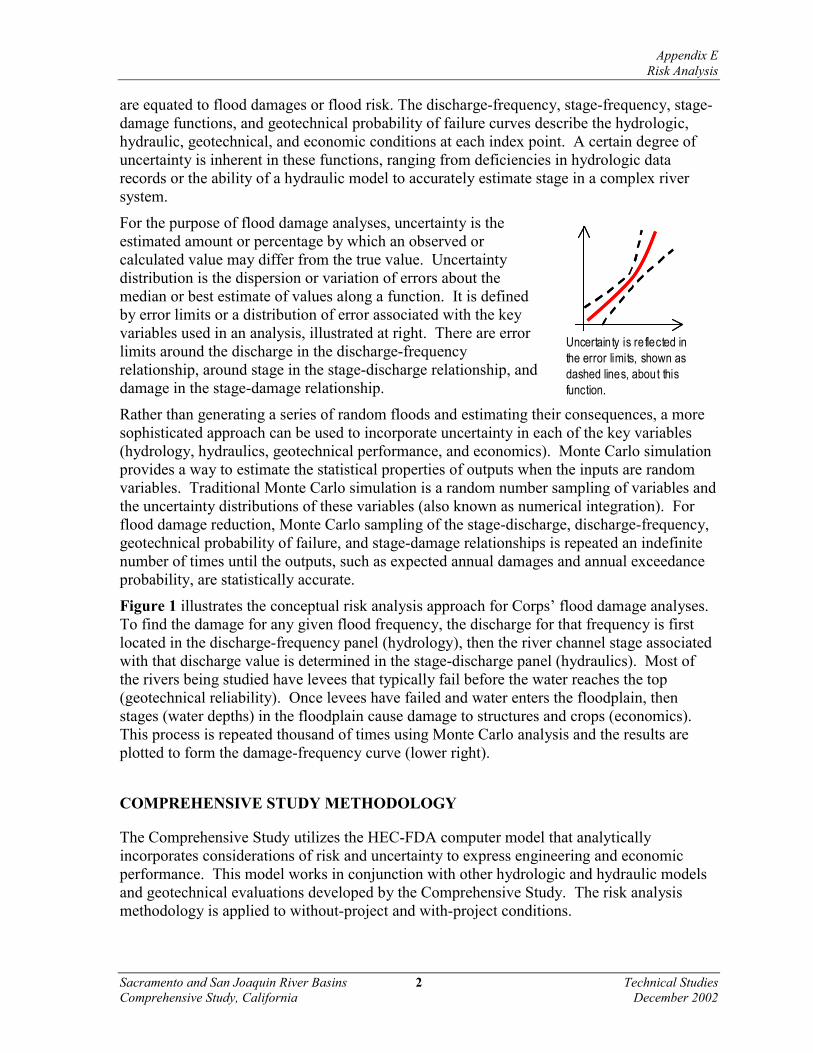
For the purpose of flood damage analyses, uncertainty is theestimated amount or percentage by which an observed orcalculated value may differ from the true value. Uncertaintydistribution is the dispersion or variation of errors about themedian or best estimate of values along a function. It is definedby error limits or a distribution of error associated with the keyvariables used in an analysis, illustrated at right. There are errorlimits around the discharge in the discharge-frequencyrelationship, around stage in the stage-discharge relationship, anddamage in the stage-damage relationship.
Rather than generating a series of random floods and estimating their consequences, a moresophisticated approach can be used to incorporate uncertainty in each of the key variables(hydrology, hydraulics, geotechnical performance, and economics). Monte Carlo simulationprovides a way to estimate the statistical properties of outputs when the inputs are randomvariables. Traditional Monte Carlo simulation is a random number sampling of variables andthe uncertainty distributions of these variables (also known as numerical integration). Forflood damage reduction, Monte Carlo sampling of the stage-discharge, discharge-frequency,geotechnical probability of failure, and stage-damage relationships is repeated an indefinitenumber of times until the outputs, such as expected annual damages and annual exceedanceprobability, are statistically accurate.
Figure 1 illustrates the conceptual risk analysis approach for Corps’ flood damage analyses.To find the damage for any given flood frequency, the discharge for that frequency is firstlocated in the discharge-frequency panel (hydrology), then the river channel stage associatedwith that discharge value is determined in the stage-discharge panel (hydraulics). Most ofthe rivers being studied have levees that typically fail before the water reaches the top(geotechnical reliability). Once levees have failed and water enters the floodplain, thenstages (water depths) in the floodplain cause damage to structures and crops (economics).This process is repeated thousand of times using Monte Carlo analysis and the results areplotted to form the damage-frequency curve (lower right).
COMPREHENSIVE STUDY METHODOLOGY
The Comprehensive Study utilizes the HEC-FDA computer model that analyticallyincorporates considerations of risk and uncertainty to express engineering and economicperformance. This model works in conjunction with other hydrologic and hydraulic modelsand geotechnical evaluations developed by the Comprehensive Study. The risk analysismethodology is applied to without-project and with-project conditions.
Uncertainty is reflected in the error limits, shown as dashed lines, about this function.

Appendix ERisk Analysis
Sacramento and San Joaquin River Basins 3 Technical StudiesComprehensive Study, California December 2002
FIGURE 1 –THE CONCEPTUAL RISK ANALYSIS MODEL
The risk analysis methodology used by the Comprehensive Study deviates slightly from thetraditional methodology. The Monte Carlo simulation starts with a random number samplingof the stage-frequency, geotechnical probability of failure, and stage-damage relationships.However, there are no discharge-frequency relationships in the Monte Carlo simulations. Thehydraulic model directly creates the stage-frequency relationships and uncertaintydistributions at index points in the channel from five flood event hydrographs (events with a10%, 2%, 1%, 0.5%, and 0.2% chance of occurring in any year) input into the hydraulicmodel. The exception is the Hamilton City Project, which uses the traditional methodology.Descriptions of the hydraulic models and other technical tools related to risk analysis areprovided later in this document.
There are numerous uncertainties associated with flood damage reduction studies related toboth natural systems (variations in climate, stream flow, river stage, etc) and engineeredsystems (reliability of levees, flood gates, etc). These uncertainties are shown in Figure 1 as“error bands” located above and below the hydrologic, hydraulic and economics curves.1Some of the important uncertainties specific to the Comprehensive Study include:
Hydrologic. Uncertainty factors include hydrologic data record lengths that are often short ordo not exist, precipitation-runoff computational methods that are not precisely known, andimprecise knowledge of the effectiveness of flow regulation (reservoir operations). Thehydrologic data record length, or period of record, is the number of years for which asystematic record of peak discharges is available at a given stream gage. This parameterdirectly influences the uncertainty associated with the frequency-discharge function and 1 There are multiple uncertainties in the geotechnical probability of failure curves. The resultant curve used inthis analysis reflects the uncertainty of whether a levee either has catastrophic failure or performs poorly duringrandom periods of high flows.
Source: Adapted from Moser (1997)
Disc
harg
e (Q
)
Stage (H, channel)
Stage (H, floodplain)
Disc
harg
e (Q
)
Exceedence Probability (p)
Exceedence Probability (p)
Dam
age
(D)
Dam
age
(D)
2. Hydraulics
4. Economics
1. Hydrology
Typical Levee
Probability of Failure, (%)
Stag
e, H
, cha
nnel
3. Geotechnical
EAD =D(p)dp�
Disc
harg
e (Q
)
Stage (H, channel)
Stage (H, floodplain)
Disc
harg
e (Q
)
Exceedence Probability (p)
Exceedence Probability (p)
Dam
age
(D)
Dam
age
(D)
2. Hydraulics
4. Economics
1. Hydrology
Typical Levee
Probability of Failure, (%)
Stag
e, H
, cha
nnel
3. Geotechnical
EAD =D(p)dp�
EAD =D(p)dp�

Appendix ERisk Analysis
Sacramento and San Joaquin River Basins 4 Technical StudiesComprehensive Study, California December 2002
consequently the project performance statistics discussed later in this report. Becausehydrologic studies are most often based on statistical analyses of available gage data, alonger period of record implies less uncertainty associated with this function. For theComprehensive Study, the hydrologic periods of record were identified for each economicimpact area.
Hydraulics. Uncertainty arising from the use of simplified models to describe complexhydraulic phenomena, including the lack of detailed geometric data, potential misalignmentsor misrepresentations of hydraulic structures, channel bed material variability, and errors inestimating slope and roughness factors.
Geotechnical. Uncertainty in the geotechnical performance of flood control structures duringloading from random events, such as flood flows and earthquakes, affect levee performance.Other uncertainties may include geotechnical parameters such as soil and permeability valuesused in the analysis, mathematical simplifications in the analysis models, frequency andmagnitude of physical changes or failure events, and unseen features such as rodent burrows,cracks within the levee, or other localized defects.
Economics. Uncertainty concerning land uses, depth/damage relationships, structure/contentvalues, structure locations, first floor elevations, floodwater velocity, the amount of debrisand mud, flood duration, warning time, and response of floodplain inhabitants.
Impact Areas and Index PointsBecause the Comprehensive Study floodplains cover over 2.2 million acres (about 3,400square miles), the floodplains were divided into smaller impact areas to facilitate theanalysis. These were delineated based primarily upon flooding characteristics (floodorigination and flow patterns) and land uses within the 0.2% (1 in 500) floodplain. Withinthe Sacramento River Basin, 68 impact areas were identified covering just over 1.5 millionacres. In the smaller San Joaquin Basin, 42 impact areas were identified covering about654,000 acres. The impact areas are shown in Figures 2 and 3 and summarized in Tables 1and 2.
One index point was assigned to represent each impact area. Each index point is locatedalong the river or waterway that has the greatest influence on flooding in a particular impactarea. The index points are the location where data from the hydraulic models is passed to therisk analysis in order to calculate project performance and economic damages within eachimpact area.

Appendix ERisk Analysis
Sacramento and San Joaquin River Basins 5 Technical StudiesComprehensive Study, California December 2002
FIGURE 2 – SACRAMENTO RIVER BASIN ECONOMIC IMPACT AREAS

Appendix ERisk Analysis
Sacramento and San Joaquin River Basins 6 Technical StudiesComprehensive Study, California December 2002
FIGURE 3 – SAN JOAQUIN RIVER BASIN ECONOMIC IMPACT AREAS

Appendix ERisk Analysis
Sacramento and San Joaquin River Basins 7 Technical StudiesComprehensive Study, California December 2002
TABLE 1SACRAMENTO RIVER BASIN IMPACT AREAS
ImpactAreaNo. Impact Area Name
Area inAcres
ImpactAreaNo. Impact Area Name
Area inAcres
Upper Sacramento ReachUS 1 Redding 3,358 US 4 Los Molinos 28,162US 2 Anderson 3,374 US 5 Red Bluff 2,243US 3 Bend 9,503 US 6 Tehama 132
Subtotal 46,774Sacramento River Basin
1 Woodson Bridge East 28,873 32 Rec Dist 70-1660 66,6582 Woodson Bridge West 6,423 33 Meridian 2353 Hamilton City 434 34 Rec Dist 1500 East 66,3514 Capay 9,645 35 Elkhorn 13,2875 Butte Basin 182,862 36 Natomas 73,1096 Butte City 50 37 Rio Linda 10,4577 Colusa Basin North 87,530 38 West Sacramento 6,0868 Colusa 4,318 39 Rec Dist 900 6,8619 Colusa Basin South 130,730 40 Sacramento 66,701
10 Grimes 73 41 Rec Dist 302 5,78411 Rec Dist 1500 West 65,401 42 Rec Dist 999 29,91312 Sycamore Slough 7,905 43 Clarksburg 44613 Knight's Landing 745 44 Stone Lake 24,02714 Ridge Cut (North) 3,338 45 Hood 19315 Ridge Cut (South) 7,962 46 Merritt Island 4,47516 Rec Dist 2035 13,069 47 Rec Dist 551 9,13617 East of Davis 9,000 48 Courtland 34618 Honcut 29,667 49 Sutter Island 2,49219 Sutter Buttes North 38,873 50 Grand Island 16,16120 Gridley 1,120 51 Locke 69221 Sutter Buttes East 63,675 52 Walnut Grove 48222 Live Oak 2,030 53 Tyler Island 8,73623 District 10 12,274 54 Andrus Island 14,82924 Levee Dist. #1 148,893 55 Ryer Island 11,97925 Yuba City 24,392 56 Prospect Island 1,61826 Marysville 1,425 57 Twitchell Island 3,84227 Linda-Olivehurst 15,819 58 Sherman Island 10,22628 Rec Dist 384 12,582 59 Moore 11,95229 Best Slough 12,265 60 Cache Slough 15,84730 Rec Dist 1001 72,679 61 Hastings 4,59131 Sutter Buttes South 11,159 62 Lindsey Slough 7,493
Subtotal 1,500,226Total Acreage: 1,547,000

Appendix ERisk Analysis
Sacramento and San Joaquin River Basins 8 Technical StudiesComprehensive Study, California December 2002
TABLE 2SAN JOAQUIN RIVER BASIN IMPACT AREAS
ImpactAreaNo. Impact Area Name
Area inAcres
ImpactAreaNo. Impact Area Name
Area inAcres
1 Fresno 9,922 22 Orestimba 4,7032 Fresno Slough East 43,928 23 Tuolumne South 7,1983 Fresno Slough West 7,236 24 Tuolumne River 4,8644 Mendota 1,506 25 Modesto 3,5555 Chowchilla Bypass 48,982 26 3 Amigos 3,6496 Lone Willow Slough 74,608 27 Stanislaus South 9,5177 Mendota North 3,050 28 Stanislaus North 17,3908 Firebaugh 668 29 Banta Carbona 5,1499 Salt Slough 142,265 30 Paradise Cut 7,751
10 Dos Palos 2,169 31 Stewart Tract 4,89811 Fresno River 5,282 32 East Lathrop 1,54612 Berenda Slough 33,194 33 Lathrop/ Sharpe 3,02513 Ash Slough 16,784 34 French Camp 12,16314 Sandy Mush 11,755 35 Moss Tract 2,05915 Turner Island 15,310 36 Roberts Island 18,18716 Bear Creek 16,626 37 Rough and Ready Island 1,36017 Deep Slough 2,074 38 Drexler Tract 5,51618 West Bear Creek 28,075 39 Union Island 23,86519 Fremont Ford 8,008 40 Southeast Union Island 1,21820 Merced River 7,308 41 Fabian Tract 6,55621 Merced River North 23,659 42 RD 1007 7,611
Total Acreage: 654,189
MODELING TOOLS
The Comprehensive Study has developed a suite of models and other technical tools thatwork together to evaluate ecosystem restoration and flood management conditions in theSacramento and San Joaquin River basins. These tools include hydrologic data and modelsof reservoir operations, geotechnical failure models for levees, hydraulic models of riverchannels and floodplains, flood damage analysis models for economic and projectperformance evaluation, a geographic information system (GIS) for data management andevaluation, and an ecosystem function model. Detailed descriptions of these tools can befound in other appendices to the Technical Support Document. While no model is a perfectrepresentation of actual conditions, the models developed for this study are of sufficientdetail to provide appropriate results for a systematic flood damage analysis of the two basins.The models that are directly related to the risk analysis are described briefly below.
Hydraulic ModelsThe hydraulic models compute water surface elevation, delineate flooding extent, and trackhow flood volume changes as a flood moves through the river system. UNET and FLO-2D

Appendix ERisk Analysis
Sacramento and San Joaquin River Basins 9 Technical StudiesComprehensive Study, California December 2002
hydraulic models were used to characterize baseline conditions, develop an understanding ofhow the overall flood management system functions, delineate flood inundation areas, andanalyze the effects of various alternative scenarios and measures. The hydraulic modelsprovide information to the flood damage analysis and ecosystem function models. A detaileddescription of the hydraulic models is included in Appendix D – Hydraulic TechnicalDocumentation. A brief summary of the models is provided below.
UNETThis model is designed to simulate unsteady flow through a full network of open channels,weirs, bypasses and storage areas. The model’s representation of channel geometry andalignment is based on topography from existing data, and bathymetric and aerial surveysperformed by the Comprehensive Study between 1995 and 2000. Two models, one in theSacramento River basin and one in the San Joaquin River basin, cover the main stemchannels and their major tributaries, from their confluences upstream to either the majorregulating reservoirs or where the channel becomes entrenched. The UNET models simulatethe effects of weirs and overflows, bridges, and levees, including levee failure. Stage-frequency curves, the primary output related to risk analysis, are developed at index points bysimulating multiple flood events in UNET and extracting peak river stages.
FLO-2DFLO-2D was used to model overbank flows, which are comprised of flows that travel out ofstream channels and across the topography of the floodplain. Out-of-bank flows aregenerated in UNET, either from overtopping or levee failure, and passed to thecorresponding grid elements in FLO-2D to delineate the floodplain. FLO-2D has thecapability of modeling both one-dimensional channel flow and two-dimensional overbankflow2. In the Sacramento River system, FLO-2D was run in overbank areas only, exclusiveof the channel. Channel areas in Sacramento River Basin are clearly defined; therefore,overbank flows occur less often. In the San Joaquin River Basin, channels are less welldefined and have minimal capacity, making overbank flows more common. For this reason,FLO-2D was run over almost the entire San Joaquin River Basin, for both channel andoverbanks. FLO-2D provides information on floodplain extent that is used to generate landuse and structural inventories for the economic analysis. GIS was used in conjunction withFLO-2D to generate flood depths in the economic impact areas for the five modeled floodevents.
Flood Damage Analysis Tools
HEC-FDAHEC-FDA is the principal tool used by the Corps to calculate flood damage risks. The HEC-FDA model performs the Monte Carlo random sampling of the discharge-frequency, stage-discharge, geotechnical probability of failure, and damage-stage relationships and their
2 The two-dimensional flow capability of FLO-2D allows it to track water that is moving in any of the eightcompass directions (North, Northeast, East, Southeast, etc).

Appendix ERisk Analysis
Sacramento and San Joaquin River Basins 10 Technical StudiesComprehensive Study, California December 2002
respective uncertainty distributions. This model is used to determine expected annualdamages (EAD) and project performance statistics for proposed concepts and alternativeplans, which are used in plan formulation. Project performance statistics include the annualexceedance probability (AEP), or the expected annual probability of flooding in any givenyear; the long-term risk of flooding over a 10-, 25-, or 50-year period; and the conditionalnon-exceedance (CNE) probability for specific events (the probability of passing specificflood events). Although HEC-FDA was designed to estimate urban flood damage, it wasadapted to include agricultural analyses for the Comprehensive Study.
@RISKStage-damage curves were generated outside the HEC-FDA program using @RISK.Because flood flows can originate from outside an impact area (overland flow from anupstream levee break, for example), it was desirable to link flood damage to flood depths atparcels regardless of the source of flooding. A good example of this is in the Colusa Basinalong the western portion of the Sacramento Valley. Floodwater can breakout along the rightbank of the Sacramento River along the northern portion of the SAC 7 impact area, then flowsouth for 40 or 50 miles. As it flows south, it can influence flooding in the SAC 8 and SAC9 impact areas. Thus, flood damage in SAC 8 and SAC 9 cannot be reliably linked to riverstages within or adjacent to those impact areas, as HEC-FDA would do. @RISK was used todevelop the stage-damage curves using parcel and depth information developed in GIS, andthe completed curves were input into HEC-FDA. The @RISK model incorporated keyeconomic uncertainty factors, including structural value, content value, foundation heightnumber of stories, and depth-damage relationships that are described in more detail inAppendix F – Economics Technical Documentation.
Upper Sacramento Spreadsheet AnalysisA different methodology was used to estimate flood damages for the Upper SacramentoReach. Hydraulic modeling in this reach was performed using HEC-RAS rather than UNET;thus, the stage-frequency curves required by HEC-FDA were not developed. In addition,only three flood events were modeled (events with a 2%, 1%, and 0.5% chance of occurringin any given year), rather than the eight events modeled in the remainder of the SacramentoRiver Basin. Estimated expected annual damage was based upon flood depths for these threeevents at the individual parcels, and he computations were performed using spreadsheetsrater than within HEC-FDA. Consequently, project performance statistics were notdeveloped for this reach. This approach was satisfactory for the purpose of preliminarybasin-wide flood damage calculations, but future studies should employ more detailedhydraulic modeling and risk analysis techniques.
GISAlthough not an economics program, the use of geographic information system (GIS)software allowed efficient identification of thousands of structures within the floodplainswhere digitized parcel maps were available. Where possible, corresponding data required forflood damage analysis (frequencies and depths of events at specific parcels, improvementvalues, etc.) were also developed using GIS.
Appendix ERisk Analysis
Sacramento and San Joaquin River Basins 11 Technical StudiesComprehensive Study, California December 2002
Ecosystem Function ModelThe Ecosystem Function Model (EFM) was developed by the Comprehensive Study topredict changes in the quality and extent of riparian and aquatic habitats resulting fromchanges to the flood management system. These indicators include changes in the extent ofsuitable riparian and seasonally inundated aquatic habitats, key river channel conditions, andrates of ecosystem processes that may not be manifested for years to come. Currently, theEFM does not provide for risk analysis. For more information on the EFM, refer to AppendixF – Ecosystem Functions Model.
TECHNICAL CONSIDERATIONS AND ASSUMPTIONS
The results of the risk analysis are affected by technical considerations and assumptionsregarding the input to HEC-FDA. For example, the geotechnical studies developedrelationships that characterized the reliability of the levees, which were utilized to triggerlevee failures in the hydraulic models, which ultimately affected the stage-frequency curvesused in the risk analysis. The following section discusses the key technical evaluations andapproaches that affected the risk analysis.
Hydrologic StudiesThe development of the without-project hydrology involved updating natural flow-frequencyrelationships in the river basins, historical storm analysis, modeling storm centerings in thebasins to reflect the combination of several flood events that can shape a floodplain, anddevelopment of flood hydrographs for seven flood frequencies (10%, 2%, 1%, 0.5%, and0.2% chance of occurring in any year) for input into the reservoir simulation and hydraulicmodels. A hypothetical storm centering method was developed to position an n-year floodevent at a particular location in the river system. Uncertainty factors that may affect thehydrology are gage record lengths that may be short or not exist where needed, precipitation-runoff computation methods are inaccurate, and the effectiveness of flood flow regulationmeasures is not precisely known. Period of record is one of the inputs to HEC-FDA thataccounts for uncertainty. A detailed description of the development of the synthetichydrology, flood centerings, and reservoir operation models is included in Appendix B –Synthetic Hydrology Documentation and Appendix C – Reservoir Operations Modeling.
Geotechnical EvaluationThe potential for flooding along the Sacramento and San Joaquin Rivers and their maintributaries is highly dependent on the earthen structures, or levees, that protect much of theCentral Valley. High levees essentially function as long dams, but they lack the inherentsafety features that well-constructed dams possess, such as spillways, outlets, and internaldrains. Levees may fail for geotechnical reasons before they are overtopped by flood flows.Floodwaters need only encounter one weak point in a particular reach to potentially cause abreach that could result in the loss of life or property.
There are various factors that can contribute to the geotechnical failure of levees. Floodwatervelocities can be highly erosive as they move along levees, which are typically unprotectedfrom scour. The interior soils and construction of levees can vary significantly and older

Appendix ERisk Analysis
Sacramento and San Joaquin River Basins 12 Technical StudiesComprehensive Study, California December 2002
levees may not conform to modern design standards. High hydraulic gradients during floodscan force seepage through levee foundation materials with high hydraulic conductivity(permeability), such as loose sand. Increased water flow through these materials can migrate,or erode, material from the levee or foundation, creating unstable conditions that can quicklylead to total or significant structural failure. These failure modes are exacerbated byextended periods of high flood flows.
Most of the levees of concern in the Sacramento and San Joaquin river systems are neitherowned nor maintained by the Corps or other Federal agencies. The one exception is the rightbank levee of the Sacramento Deep Water Ship Channel, which is maintained under amemorandum of understanding between the COE and the California State Department ofWater Resources (DWR). All others are either privately owned and maintained or owned bythe State, which typically delegates maintenance responsibilities to local levee andreclamation districts.
Risk analysis incorporates the chance of levee failure, typically expressed through ageotechnical reliability model, often expressed as a probability of failure curve. This modelleads to a relationship between water elevation (stage) and the probability that the levee willfail, which is then applied to individual reaches of levees. This procedure assumes thatdamages can accrue in one of two ways: either the river stage becomes high enough toovertop the levee, or the stage rises high enough to cause geotechnical failure of the levee.The development of probability of failure curves is discussed in Attachment E.1 to thisappendix, and summarized below.
Technical ApproachLevees can fail for many reasons and it is difficult to predict exactly where they will fail.Past flood events in the Central Valley have shown that levees often fail in the mostunpredictable areas or at stages well below the design water surface. In other cases, stage hasexceeded the design water surface without breaching or without significant damages. Thegeotechnical performance of a levee depends on local soil conditions and constructionmaterials and methods. These conditions are generally not known in detail during the initialstart of a planning study. The geotechnical reliability model is generally a good first step infulfilling the practical needs of planning studies and risk analyses when detailed geotechnicalinformation is not yet known.
The Corps traditional geotechnical reliability model defines a simple relationship betweentwo stages on the levee: the probable failure point (PFP) and the probable non-failure point(PNP) (USACE, 1991b). By definition, the probable failure point is the stage or heightassociated with a high probability of levee failure, an 85 percent chance. Likewise, theprobable non-failure point is the stage height associated with a low probability of leveefailure, a 15 percent chance. These points are typically assessed for local conditions andchange from reach to reach. However, in some instances these reaches can be many miles inlength.
This simple model is still widely used by the Corps. However, the model was updated toreflect a broader understanding of geotechnical performance (USACE, 1999b). The updatedmodel considers the risk of multiple modes of failures including underseepage, through-seepage, and strength instability. The results of a series of iterations comparing stage-

Appendix ERisk Analysis
Sacramento and San Joaquin River Basins 13 Technical StudiesComprehensive Study, California December 2002
frequency functions with levee performance (derived from either PNP/PFP relationships or acomposite probability of geotechnical levee reliability) are combined to form a risk-frequency curve. This curve shows the risk of levee failure as a function of stage.
Levee Evaluation To assess the differences between an existing levee and a levee with proposed improvements,the engineering assessment of levee reliability must be quantified in a probabilistic form.However, geotechnical engineers are typically more knowledgeable of deterministic methodsthan probabilistic methods3. In addition, they are generally more experienced designing astructure within an appropriate factor of safety, rather than making numerical assessments ofthe condition of existing structures. For this study, the following key points provide amethodology for defining levee performance in probabilistic terms:
� Where possible, review the primary modes of failure, such as seepage or overtopping.
� Develop reliability curves for levees or geotechnical probability of failure functions thatare simple and sufficient for use where data is limited, but reflect a geotechnicalunderstanding of the underlying mechanics and uncertainty in the governing parameters
� Test and illustrate these procedures through comparison with existing or on-going studyanalyses.
AssumptionsCombined Probability Functions - Once a conditional probability of failure function has beenobtained for each considered failure mode, they are combined to determine the totalgeotechnical conditional probability of failure of all modes as a function of floodwaterelevation. As a first approximation, it may be assumed that each of the failure modes isindependent: underseepage, slope stability, through-seepage and internal erosion. However,conditions that increase the probability of failure for one mode are likely to increase theprobability of failure for another. Detailed research to better quantify such possiblecorrelation is beyond the scope of the Comprehensive Study. Assuming independencesimplifies the mathematics for geotechnical and economic analysis. For underseepage, theprobability of levee failure at a specific water surface elevation is correlated to theprobability of developing an upward gradient sufficient to cause heaving or boiling. Forslope stability, the probability of failure is taken as the probability that the factor of safety isless than unity. For through-seepage and internal erosion, the probability of failure is basedon past performance function.
Flood Duration - The probability of levee failure increases with the duration of flooding, asextended periods of high water increase pore pressures within the levee embankment and thelikelihood of damaging erosion. For simplicity, the analysis methodology assumes that the
3 A deterministic analysis utilizes design equations with safety factors that have been calibrated (typicallythrough past experience or experiment) to provide a target level of safety. The probabilistic approach to designalso uses the basic deterministic equations but in a more-comprehensive analysis in which uncertainty isquantified by probability distributions. The probabilistic approach measures the variation of risks of failurewith variations in design parameters and properties of materials, making it possible to determine the robustnessor reliability of a design

Appendix ERisk Analysis
Sacramento and San Joaquin River Basins 14 Technical StudiesComprehensive Study, California December 2002
flood has been of sufficient duration that steady-state seepage conditions have developed inpervious substratum materials and pervious embankment materials, but no pore pressureadjustment has occurred in impervious clayey foundation and embankment materials.
Judgmental Evaluation - Levees under evaluation are typically inspected in the field. Duringsuch inspections, it is likely that the inspection team will encounter other conditions orfeatures in addition to the aforementioned failure modes that may compromise the reliabilityof the levee during a flood event. These might include animal burrows, cracks, roots, or poormaintenance practices that can impede detection of defects or execution of flood-fightingactivities. To provide a mathematical means to quantify such information, one may develop ajudgment-based conditional probability function by answering the following question:
Discounting the likelihood of failure accounted for in the quantitative analyses, butconsidering observed conditions, what would an experienced levee engineer consider theprobability of failure of this levee for a range of water elevations?
While this may appear to be conjecture, leaving out such information may fail to account forthe obvious.
Levee Reliability EvaluationFor the Comprehensive Study, the locations and likelihood of initial levee failure were basedon an analysis of weak points in the levee system as determined by a reconnaissance-levelgeotechnical assessment of levee stability. To locate these weak points, the PNP and the PFPwere defined for levees within each impact area. The PNP and PFP were based on the resultsof field investigations, past levee stability calculations, engineering judgment, and leveeperformance during the 1997 and 1998 flood events. To more clearly define the geotechnicalconditional probability of failure curve for the 2,000 miles of levees evaluated in this study,additional probability of failure points were defined for the 3-, 50- and 100- percentprobabilities of failure.
For levees within the San Joaquin River basin, very little geotechnical information wasavailable. Consequently, the State of California Department of Water Resources conductedan in-depth reconnaissance field inspection. The field survey delineated historic problemareas and potential problem areas through discussions with levee maintenance personnel, on-site evaluations, cross sectional data, remnants of sand bag rings constructed during floods tocontrol boils and seepage, and engineering judgment. From this knowledge, conditionalprobabilities of failure curves were generated. Three levee curves characterize the reliabilityof the levees in the San Joaquin River basin; these curves typically depict the levees asbehaving similar to sand levees.
For levees within the Sacramento River basin, geotechnical information was gathered fromvarious system evaluation reports:
� Initial system evaluation reports submitted by the Mark Group in 1988 and 1989� Flood Control System Evaluation reports of 1992, 1993, and 1994; and � Supplemental evaluation reports from 1996, 2000, and 2001.
On-going flood management projects in construction, nearing construction, or recentlycompleted were also referenced. Engineering judgment, based primarily on past-experienceduring the 1997 and 1998 flood events, contributed significantly to the development of the

Appendix ERisk Analysis
Sacramento and San Joaquin River Basins 15 Technical StudiesComprehensive Study, California December 2002
levee curves. Since levees in the Sacramento River basin are constructed of a variety oflevee material ranging in composition from loose sand to engineered pervious andimpervious materials, geotechnical probability of failure curves were created to reflect avariety of levee materials. Three geotechnical probability of failure curves were generatedrepresenting strongly constructed levees, generally of clay or sandy clay, and four probabilityof failure curves were generated for poorer quality constructed levees and some non-projector privately maintained levees.
The probability of failure curves, illustrated in Figures 4 and 5, reflect both known andunknown inherent levee deficiencies in the San Joaquin and Sacramento River basins. Thecurves used in each basin reflect a range of levee performance conditions, from good(represented by curves indicating failure near the top of the levee) to poor (represented bycurves indicating failure near the bottom of the levee). Development of the curves is furtherdiscussed in Attachment E1 to this appendix.
The geotechnical conditional probabilities of failure curves are based primarily onengineering judgment. These curves represent the results of a qualitative approach toevaluating the major aspects of levee integrity for very large flood control systems. A singleconditional probability of failure curve was assigned to an entire reach of levee based on theweakest point in that reach. Tables 3 and 4 summarize the geotechnical probability offailure curves applied to each reach of the Sacramento River and San Joaquin River basins.

Appendix ERisk Analysis
Sacramento and San Joaquin River Basins 16 Technical StudiesComprehensive Study, California December 2002
FIGURE 4 - CONDITIONAL GEOTECHNICAL PROBABILITY OF FAILURE CURVES FORTYPICAL SACRAMENTO RIVER BASIN PROJECT LEVEES
0
2
4
6
8
10
12-70 -60 -50 -40 -30 -20 -10 0 10 20 30 40 50 60 70 80 90 100
Pr(f), % Probability of Failure
0
2
4
6
8
10
12-70 -60 -50 -40 -30 -20 -10 0 10 20 30 40 50 60 70 80 90 100
Pr(f), % Probability of FailureTypical Sand Levee
Typical Clay Levee
Dis
tanc
e Fr
om T
op o
f Lev
ee, F
eet
Dis
tanc
e fro
m T
op o
f Lev
ee, F
eet
S1
S2
S3 S4
C3
C1
C2
Appendix ERisk Analysis
Sacramento and San Joaquin River Basins 17 Technical StudiesComprehensive Study, California December 2002
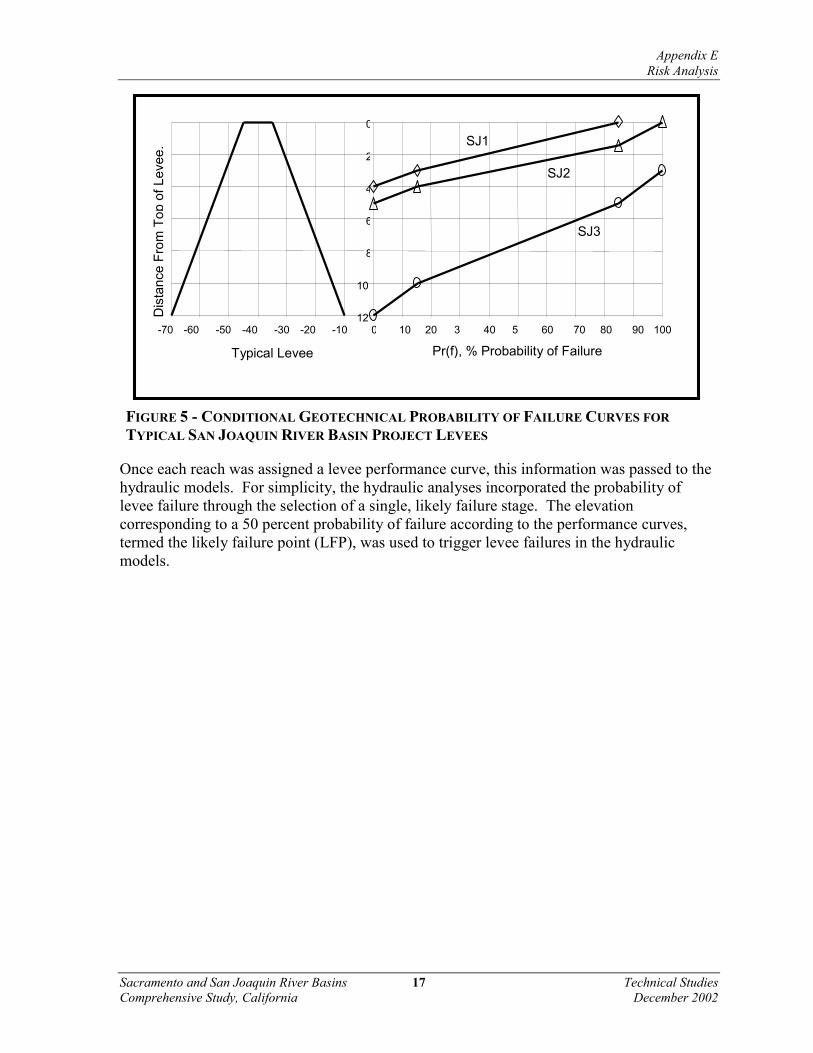
FIGURE 5 - CONDITIONAL GEOTECHNICAL PROBABILITY OF FAILURE CURVES FORTYPICAL SAN JOAQUIN RIVER BASIN PROJECT LEVEES
Once each reach was assigned a levee performance curve, this information was passed to thehydraulic models. For simplicity, the hydraulic analyses incorporated the probability oflevee failure through the selection of a single, likely failure stage. The elevationcorresponding to a 50 percent probability of failure according to the performance curves,termed the likely failure point (LFP), was used to trigger levee failures in the hydraulicmodels.
0
2
4
6
8
10
12-70 -60 -50 -40 -30 -20 -10 0 10 20 3 40 5 60 70 80 90 100
Pr(f), % Probability of FailureTypical Levee
SJ1
SJ2
SJ3
Dis
tanc
e Fr
om T
op o
f Lev
ee,

Appendix ERisk Analysis
Sacramento and San Joaquin River Basins 18 Technical StudiesComprehensive Study, California December 2002
TABLE 3ASSIGNMENT BY REACH OF SACRAMENTO RIVER BASIN
CONDITIONAL PROBABILITY OF FAILURE CURVES Selected
P(f)b ModelReachNo.
ReachDescription River
Miles
DesignCapacity a
(cfs) LBc RBc
1 Shasta Dam to Red Bluff 315 –245 No LeveesRed Bluff to Chico Landing 245 - 194Sacramento River
Red Bluff to Elder Creek 245 - 230.5 N/A No leveesElder Creek to Deer Creek 230.5 - 220 N/A No levees
Deer Creek to Chico Landing 220 - 194 N/A No levees Tributaries
Elder Creek N/A C2 C2
2
Deer Creek N/A C2 C2Chico Landing to Colusa 194 - 146Sacramento River
Chico Landing to head of east levee 194 - 176 N/A No levee S3East Levee head to Moulton Weir 176 - 158.5 150,000 S2 S2
Moulton Weir to Colusa Weir 158.5 - 146 110,000 S2 S2 Tributaries
Mud Creek N/A C1 C1 Butte Creek 3,000 C1 C1
3
Cherokee Canal 12,500 S3 S3
Colusa to Verona 146 - 80Sacramento River
Colusa Weir to Butte Slough 146 - 138 65,000 S3 S4Butte Slough to Tisdale Weir 138 - 119 66,000 S3 S4
Tisdale Weir to Knights Landing 119 - 90 30,000 S3 S3Knights Landing to Verona 90 - 80 30,000 S2 S3
Tributaries Colusa Basin Drainage Canal 20,000
Tisdale Bypass 38,000 S3 S3Sutter Bypass
Butte Slough to Wadsworth Canal 150,000 C3 C3Wadsworth Canal to Tisdale Bypass 155,000 C2 C2
Tisdale Bypass to Feather River 180,000 C2 C2Feather River to Verona 380,000 S3 C2
Feather River Oroville to Mouth of Yuba River 210,000 S2 S2
Mouth of Yuba River to Bear River 300,000 S2 S2Bear River to Yolo Bypass 320,000 S3 S2
Tributaries Yuba River 0-5 120,000 S2 S3
4
Bear River 0-3 40,000 S2 S2

Appendix ERisk Analysis
Sacramento and San Joaquin River Basins 19 Technical StudiesComprehensive Study, California December 2002
TABLE 3 (CONT.)Selected
P(f)b ModelReachNo.
Measure ReachDescription River
Miles
DesignCapacity, Qa
LBa RBa
Verona To Steamboat Slough 80 - 32.3Sacramento River
Verona to Sacramento Weir 80 - 63 107,000 S2 S4
Sacramento Weir to American River 63 - 60107,000 -108000 S2 S2
American River to Elk Slough 60 - 42107,000 -110,000 S2 S2
Elk Slough to Sutter Slough 42 - 34 110,000 S3 S3Head of Sutter Sl. to Steamboat Sl. 34 - 32.3 84,500 S3 S3
Tributaries Natomas Cross Canal 0 – 5 22,000 C2 C3
American River 115,000 S3 S2Yolo Bypass
Verona to Knight’s Landing Ridge Cut 343,000 S4 S3Knight’s Landing Ridge Cut to Cache Ck 362,000 S3 S3
Cache Creek to Sacramento Weir 377,000 C3 C3Sacramento Weir to Putah Creek 480,000 C3 C3
Putah Creek to Miner Slough 490,000 C3 C3Miner Slough to Cache Slough 579,000 C3 C3
Cache Creek to Mouth Old River N/A C3 C3 Tributaries
Knight’s Landing Ridge Cut 0 - 6 20,000 S3 S3 Cache Creek N/A S-3 S-3
Willow Slough 0 - 7 6,000 C3 C3 Putah Creek 2 - 7 62,000 C3 C3
Miner Slough 0 - 2 10,000 S4 S4
5
Cache Slough 0 - 5 N/A S4 S4Steamboat Slough To Collinsville 32.3 - 0Sacramento River
Steamboat Sl. to head of Georgiana Sl. 26.5 – 32.3 56,500 S3 S3Georgiana Sl. to Cache Sl. – Junction Pt 14 – 26.5 35,900 S3 S3
Cache Sl. to 3-mile Sl. 9 - 14 N/A S4 N/A3-Mile Slough to Collinsville 0 - 9 N/A S4 N/A
Tributaries Elk Slough 0 – 9 25,500 S3 S3
3-Mile Slough 0 - 3 65,000 S4 S4 Steamboat Slough 0 – 6.5 43,500 S2 S3
Sutter Slough - Steamboat to Miner 0 – 2.5 15,500 S3 S3 Sutter Slough - Miner to Sacramento River 2.5 – 7 25,500 S4 S3
6
Georgiana Slough 0 - 10 20,600 S4 S4Notesa) Estimated design flow capacity per DWR (May 1985)b) P(f) = Conditional Probability of Failure c) LB = Left Bank, RB = Right Bank

Appendix ERisk Analysis
Sacramento and San Joaquin River Basins 20 Technical StudiesComprehensive Study, California December 2002
TABLE 4ASSIGNMENT BY REACH OF SAN JOAQUIN RIVER BASIN
CONDITIONAL PROBABILITY OF FAILURE CURVES
ReachNo.
ReachDescription River
Miles
DesignCapacity a
(cfs)
SelectedP(f)b Model
Mendota Dam to Friant Dam 205 To 286 San Joaquin River 2,500 – 8,000 SJ1
A
Fresno Slough & James Bypass 4,750 SJ1Sand Slough Control Structure to MendotaDam
168 to 205
San Joaquin River 4,500 SJ2Chowchilla Bypass / Eastside Bypass 5,500 – 17,000 SJ2 Tributaries
Fresno River – San Joaquin to Road 18 5,000 SJ2Berenda Slough - San Joaquin to Route 152 2,000 SJ2
B
Ash Slough - San Joaquin to Route 152 5,000 SJ2Merced River to Sand Slough Control Structure 118 to 168San Joaquin River
Merced River to Eastside Bypass 26,000 SJ2Eastside Bypass to Control Structure 1,500-10,000 SJ2
Eastside Bypass 13,500 – 16,500 SJ2Deep Slough 18,500 SJ2Bear Creek 7,000 SJ2
C
Mariposa Bypass 8,500 SJ2Stanislaus River to Merced River 75 to 118San Joaquin River 45,000 – 46,000 SJ3Merced River 6,000 SJ2Tuolumne River 15,000 SJ3
Dry Creek N/A SJ3
D
Stanislaus River 8,000 SJ3Deep Ship Channel to Stanislaus River 40 to 75San Joaquin River 37,000 – 52,000 SJ3Tributaries
Paradise Cut – Old River to San Joaquin River 15,000 SJ3Old River - Tracy Boulevard to San Joaquin
River - SJ3
Grant Line Canal - Tracy Blvd to Doughty Cut - SJ3Doughty Cut - Grant Line Canal to Old River - SJ3
E
Middle River - Victoria Canal to Old River - SJ3Notes:a) Estimated design flow capacity per DWR (May 1985)b) P(f) = Conditional Probability of Failure (applies to both left and right bank levees) .

Appendix ERisk Analysis
Sacramento and San Joaquin River Basins 21 Technical StudiesComprehensive Study, California December 2002
Key Findings and ConsiderationsIt should be noted that the geotechnical probability of failure curves should only be used forcomparative economic and project performance analyses of the flood control systems. Theydo not necessarily represent actual deterministic conditional probability of failure functions,which are only achieved through extensive evaluations of site-specific conditions, pastperformance, and analytical modeling in accordance with acceptable engineering manualsand regulations. Wherever possible, geotechnical information from more detailed studieswas used in estimating levee performance. For example, the probability of levee failurecurves for the American River were derived from the Corps’ American River Study andapproximate the levee performance resulting from that study. Other examples where existinginformation greatly influenced the probability of failure curves that were used in this studyinclude the Corps’ Marysville / Yuba City study and on-going levee reconstruction workeither in-progress or authorized for construction.
The frequency of flood events and other physical stressors can also affect levee integrity.Physical conditions will naturally change over time and may lead to unsatisfactoryperformance. Hence, the geotechnical probability of failure function for any of the leveeswithin the study area is time-dependent and subject to change.
Use of the LFP to trigger levee failures does not account for flood fighting and otheremergency work that occurs during actual flood events. Flood fighting efforts can, and have,significantly reduced flood damages in some areas. However, these efforts often inducehigher stages and pass higher flows to downstream reaches, resulting in subsequent leveefailures. This is especially true for more frequent flood events. Very large flood events, onthe other hand, generate flows that overwhelm the flood system to such an extent that floodfighting becomes ineffective. Alternative formulation generally does not assume floodfighting as part of a plan because there is no guarantee that it would occur at the rightlocations or be effective in contributing to the success of a Federal flood managementproject. In summary, for plan formulation purposes, it is important to recognize that floodfighting occurs and can be effective; however, it is not considered in the ComprehensiveStudy geotechnical evaluation and, therefore, should not be included in comparison ofexisting and with-project damages and resulting benefits. Furthermore, geotechnicalconditions are not static, and the geotechnical data used in developing projects should be re-evaluated and updated whenever information becomes available. It is anticipated that thegeotechnical levee performance curves and their application in the basins will change asadditional technical evaluations are performed.
Hydraulic StudiesAs described previously, two hydraulic models were used jointly to simulate the hydraulicsof the river basins. UNET was used to simulate in-channel flows, flows leaving the riverchannels through failure points in the levees or overtopping, and routing of the flows throughthe overbanks. FLO-2D was used to simulate overbank and floodplain flows in order todelineate floodplains for various frequency events.
Flood discharge hydrographs for a range of possible storm centerings, with 10%, 2%, 1%,0.5%, and 0.2% chance of occurring in any year, were explicitly modeled. Flows with lessthan a 10% chance of occurring in any year were not modeled because they typically remain

Appendix ERisk Analysis
Sacramento and San Joaquin River Basins 22 Technical StudiesComprehensive Study, California December 2002
in the banks and do not cause serious economic damage on a system-wide basis. UNET wasused to develop flow-frequency and stage-frequency relationships within the damage reachesat breakout points in the river channel, but not in the floodplain.
River System ModelingA series of hydrographs representing a range of frequencies and a suite of storm centeringswere used as input to the UNET model. As described previously, the LFP profile wasdeveloped for levees in the Sacramento and San Joaquin River Basins on a reach-by-reachbasis. Levee failure was simulated in UNET when the water surface elevation reached theLFP for a given levee. Levee failure is simulated by UNET as a levee breach. This failuremethod was adopted for UNET because levees tend to fail before they overtop, and flood-fight efforts and intentional breaching often prevent catastrophic failures of long sections oflevee. Flow through a levee breach is then routed into floodplain storage areas by UNET.
Within any given impact area, there could be multiple failure points or breakout points. Thenumber and location of breakout points can vary depending upon the frequency of the floodand the storm runoff centering. As would be expected, the more frequent events generallyhad fewer breakout points. Stage-frequency and discharge-frequency relationships, includingerror distributions, are developed at the 104 index points based on UNET output. Ratingtables relating frequency, discharge, and stage at the index points are included in Appendix D– Hydraulic Technical Documentation.
Composite Flood Plain – Composite floodplains were developed for floods with a 10%, 2%,1%, 0.5%, and 0.2% chance of occurring in any year in the Sacramento and San JoaquinRiver Basins. The composite floodplains developed for the purpose of this study are nottraditional design-event floodplains, but represent combined floodplains from the regionalstorm runoff centerings developed by the Comprehensive Study. FLO-2D was used todelineate flood flows into overbank and floodplain areas for the purpose of delineatingfloodplains for each of the 5 flood frequencies. Stage-damage relationships in the floodplainwere linked to stage-frequency relationships in the channel through frequency.
In many reaches, simulated stages were substantially below the LFP, especially indownstream reaches. This was due to the progressive loss of floodwater through multiplebreaches, a result of the LFP failure methodology. After failure, the water surface elevationremains relatively constant for all higher flood frequencies because flows are escaping intothe floodplain through the levee break, causing the stage-frequency curves to tail over orflatten at the LFP elevation. Monte Carlo sampling in HEC-FDA requires a stage-frequencycurve that covers a full range of potential flood frequencies. Consequently, two sets ofsimulations were required to construct the stage-frequency curves in reaches with levees: onethat assumes levee failures occur and one that assumes all flow is contained within thechannel (termed infinite channel). The portion of the curve below the LFP is developedusing the LFP-failure simulations and the upper portion of the curve above the frequency oflevee failure is formed using the infinite channel simulation. HEC-FDA samples theresulting hybrid stage-frequency curve, shown in Figure 6, in reaches that have levees.

Appendix ERisk Analysis
Sacramento and San Joaquin River Basins 23 Technical StudiesComprehensive Study, California December 2002
FIGURE 6 – DEVELOPMENT OF HYBRID STAGE-FREQUENCY CURVE
Key Findings and ConsiderationsThe levee failure methodology can significantly influence simulated flood flows. Themethodology was chosen to provide a conservative simulation of potential flooding extent forsystem-wide hydraulic and economic evaluations. It does not represent conditions thatwould occur during an actual flood event, when flood fighting and other emergency actionsare likely to take place and fewer failures are likely to occur. While the LFP represents a50% probability of geotechnical failure, a levee failure is triggered in UNET every time thesimulated water surface reaches the LFP (failure is triggered in UNET 100% of the time the
Exceedence Frequency per 100 years
2 5 10 20 50
100 200
500 1000 36
38
40
42
44
46
48
50
52
54
56
58
60
62
64
Return Frequency in Years
Stag
e in
Fee
t
Base Conditions
Infinite Channel
Hybrid Curve
.15 2 1 .5 .22050 40 3099 95 90 80 70 60 10
LFP
TOL
The infinite channel curve is translated down at the frequency of failure to meet the baseline curve, thus forming the upper end of the hybrid curve
Levee fails in UNET when the stage reaches the LFP; the water surface remains constant for larger flood events due to the levee break.

Appendix ERisk Analysis
Sacramento and San Joaquin River Basins 24 Technical StudiesComprehensive Study, California December 2002
LFP is reached). In some cases, the cumulative effect of multiple upstream failures canreduce the volume of flow in downstream reaches, or large breaches can produce pronouncedreductions in stage. These effects are less pronounced in the San Joaquin basin where floodvolumes are relatively smaller, levees tend to be shorter, and overbank flooding occurs morefrequently than in the Sacramento River basin. While this levee failure methodology isappropriate for the basin-wide risk analyses performed by the Comprehensive Study, itshould be considered when interpreting UNET results and may not be suitable for otherapplications or detailed studies.
PROJECT PERFORMANCE
The three primary project performance or flood risk results reported by HEC-FDA are annualexceedence probability, long-term risk, and conditional non-exceedence probability.
Annual Exceedence Probability (AEP) Annual exceedence probability is a measure of the likelihood that an area will be flooded inany given year, considering the full range of floods that can occur and all sources ofuncertainty. AEP is typically expressed as a fractional or percentage probability. Forexample, the 0.01 exceedence probability flood has one chance in a hundred or a 1% chanceof occurring in a given year. The 1% exceedence flood event is often termed the 100-yearevent (by taking the inverse of 0.01), but it does not statistically represent an event that willoccur once in 100 years. Over a very long period of time (many thousands of years) the 1%exceedance event would occur, on average, about once every 100 years; however, over thatextended period it could occur several times during a given century, or not at all.
Long Term Risk (LTR) Long-term risk is the probability of damages occurring during a specified period of time.LTR is reported by HEC-FDA for 10-year, 25-year, and 50-year time periods. For example,a value of 0.850 for the 25-year reporting period reflects an 85% chance of flooding during a25-year period.
Conditional Non-Exceedence Probability by Events (CNE)Conditional non-exceedence is the probability of safely containing an event with a knownfrequency, should that event occur. CNE is reported by HEC-FDA for the 10%, 4%, 2%,1%, 0.5%, and 0.2% exceedence floods. For example, a value of 0.04 for the 2% eventcorresponds to a four percent chance of passing the 2% exceedence flood.
Although these measures of performance and risk seem similar, there are distinct differencesbetween them. AEP accumulates all the uncertainties into a single probability, whereas CNEis conditional on the severity of the flood event. Further, while AEP describes the likelihoodthat flooding will occur, CNE describes the likelihood that flooding will not occur during agiven year (NRC 2000). Other agencies also use these measures of risk in floodmanagement. For example, FEMA uses conditional non-exceedence in its certificationcriteria for levees, requiring a 90% or higher probability of containing the 1% event.

Appendix ERisk Analysis
Sacramento and San Joaquin River Basins 25 Technical StudiesComprehensive Study, California December 2002
Existing ConditionPreliminary project performance statistics have been developed in the Sacramento and SanJoaquin River basins for the existing condition. The results are summarized by impact areain Tables 5 and 6. The annual exceedence probability was generally lower (indicating alower risk of flooding) in the Sacramento River Basin than in the San Joaquin River Basin.This can be attributed primarily to the higher level of flood protection that the SacramentoRiver Flood Control Project was designed to provide. The San Joaquin River Flood ControlProject was generally designed to convey smaller, late-season snowmelt floods.
TABLE 5EXISTING CONDITION PROJECT PERFORMANCE STATISTICS FOR THE
SACRAMENTO RIVER BASIN
Long Term Risk Conditional Non-Exceedance Probability by Flood EventImpact
AreaImpact Area
Name
AnnualExceedanceProbability(Expected)
10Years
25Years
50Years 10% 4% 2% 1% 0.4% 0.2%
SAC01 Woodson Br East 0.1400 0.7778 0.9767 0.9995 0.2356 0.0075 0.0000 0.0000 0.0000 0.0000SAC02 Woodson Br West 0.1870 0.8734 0.9943 1.0000 0.0659 0.0010 0.0000 0.0000 0.0000 0.0000SAC03 Hamilton City 0.4860 0.9987 1.0000 1.0000 0.0000 0.0000 0.0000 0.0000 0.0000 0.0000SAC04 Capay 0.4860 0.9987 1.0000 1.0000 0.0000 0.0000 0.0000 0.0000 0.0000 0.0000SAC05 Butte Basin 0.1550 0.8141 0.9851 0.9998 0.0403 0.0018 0.0000 0.0000 0.0000 0.0000SAC06 Butte City 0.1540 0.8129 0.9849 0.9998 0.0406 0.0014 0.0000 0.0000 0.0000 0.0000SAC07 Colusa Basin North 0.4380 0.9969 1.0000 1.0000 0.0000 0.0000 0.0000 0.0000 0.0000 0.0000SAC08 Colusa 0.3690 0.9901 1.0000 1.0000 0.4862 0.4038 0.3225 0.2288 0.0031 0.0000SAC09 Colusa Basin South 0.5190 0.9993 1.0000 1.0000 0.3382 0.1163 0.0027 0.0000 0.0000 0.0000SAC10 Grimes 0.5180 0.9993 1.0000 1.0000 0.3390 0.1176 0.0029 0.0000 0.0000 0.0000SAC11 Rec Dist 1500 West 0.2540 0.9467 0.9993 1.0000 0.5042 0.0648 0.0100 0.0000 0.0000 0.0000SAC12 Sycamore Slough 0.1140 0.7002 0.9508 0.9976 0.7133 0.3165 0.1750 0.0267 0.0000 0.0000SAC13 Knight's Landing 0.0700 0.5155 0.8366 0.9733 0.8227 0.3948 0.2753 0.0871 0.0000 0.0000SAC14 Ridge Cut North 0.1250 0.7368 0.9645 0.9987 0.6217 0.5669 0.5167 0.3437 0.0012 0.0000SAC15 Ridge Cut South 0.0740 0.5368 0.8540 0.9787 0.6901 0.3614 0.2567 0.1196 0.0000 0.0000SAC16 RD2035 0.0790 0.5631 0.8738 0.9841 0.6859 0.5905 0.5481 0.5300 0.0620 0.0000SAC 17 East of Davis 0.0400 0.3380 0.6435 0.8729 1.0000 0.5463 0.0021 0.0000 0.0000 0.0000SAC18 Honcut 0.0260 0.2346 0.4874 0.7372 1.0000 0.7576 0.4562 0.1972 0.0707 0.0210SAC19 Sutter Buttes North 0.0010 0.0135 0.0330 0.0656 1.0000 0.9951 0.9950 0.9949 0.9159 0.3912SAC20 Gridley 0.0010 0.0116 0.0288 0.0568 1.0000 0.9950 0.9949 0.9948 0.9152 0.3920SAC21 Sutter Buttes East 0.0030 0.0280 0.0685 0.1323 1.0000 1.0000 1.0000 1.0000 0.9188 0.0991SAC22 Live Oak 0.0030 0.0301 0.0736 0.1418 1.0000 1.0000 1.0000 1.0000 0.8653 0.0973SAC23 District 10 0.0030 0.0298 0.0729 0.1405 1.0000 1.0000 1.0000 0.9969 0.8612 0.0638SAC24 Levee District 1 0.0760 0.5476 0.8623 0.9810 0.6772 0.3377 0.2594 0.0863 0.0000 0.0000SAC25 Yuba City 0.0100 0.0979 0.2271 0.4027 1.0000 0.9119 0.8764 0.8074 0.2296 0.0019SAC26 Marysville 0.0050 0.0486 0.1172 0.2207 1.0000 0.9897 0.9813 0.9552 0.6036 0.0064SAC27 Linda-Olivehurst 0.0360 0.3100 0.6045 0.8436 0.9880 0.5989 0.3015 0.0983 0.0345 0.0131SAC28 RD784 0.0100 0.0992 0.2299 0.4070 1.0000 0.9287 0.8673 0.7864 0.2069 0.0000SAC29 Best Slough 0.0650 0.4889 0.8132 0.9651 0.7299 0.4256 0.2106 0.0734 0.0721 0.0713SAC30 RD1001 0.0790 0.5594 0.8711 0.9834 0.6472 0.4960 0.4421 0.3209 0.0035 0.0000SAC31 Sutter Buttes South 0.0380 0.3204 0.6193 0.8550 0.8694 0.7214 0.5960 0.4835 0.0351 0.0000SAC32 RD70/1660 0.0400 0.3353 0.6398 0.8702 0.8524 0.7122 0.5850 0.4680 0.3564 0.0981SAC33 Meridian 0.0420 0.3478 0.6564 0.8820 0.8525 0.7123 0.5849 0.4406 0.0237 0.0000SAC34 RD1500 East 0.2550 0.9472 0.9994 1.0000 0.5031 0.0644 0.0102 0.0000 0.0000 0.0000SAC35 Elkhorn 0.4990 0.9990 1.0000 1.0000 0.0023 0.0000 0.0000 0.0000 0.0000 0.0000SAC36 Natomas 0.0200 0.1869 0.4039 0.6447 0.9924 0.8062 0.6539 0.6029 0.0126 0.0000

Appendix ERisk Analysis
Sacramento and San Joaquin River Basins 26 Technical StudiesComprehensive Study, California December 2002
TABLE 5 (CONT.)
Long Term Risk Conditional Non-Exceedance Probability by Flood EventImpact
AreaImpact Area
Name
AnnualExceedanceProbability(Expected)
10Years
25Years
50Years 10% 4% 2% 1% 0.4% 0.2%
SAC37 Rio Linda 0.0060 0.0608 0.1452 0.2693 1.0000 1.0000 1.0000 1.0000 0.0190 0.0000SAC38 West Sacramento 0.0070 0.0691 0.1639 0.3009 1.0000 1.0000 0.9967 0.9808 0.0208 0.0000SAC39 RD900 0.0050 0.0493 0.1186 0.2232 1.0000 1.0000 1.0000 1.0000 0.2393 0.0089SAC40 Sacramento 0.0100 0.0918 0.2140 0.3823 0.9837 0.9826 0.9819 0.9517 0.0000 0.0000SAC41 RD302 0.0060 0.0606 0.1446 0.2684 1.0000 1.0000 1.0000 0.9971 0.0684 0.0021SAC42 RD999 0.1220 0.7276 0.9613 0.9985 0.6032 0.5683 0.5521 0.4847 0.0216 0.0000SAC43 Clarksburg 0.1220 0.7276 0.9613 0.9985 0.6032 0.5683 0.5521 0.4847 0.0216 0.0000SAC44 Stone Lake 0.1000 0.6508 0.9280 0.9948 0.5882 0.5004 0.4865 0.3488 0.0000 0.0000SAC45 Hood 0.1000 0.6509 0.9280 0.9948 0.5894 0.4877 0.4752 0.3502 0.0000 0.0000SAC46 Merritt Island 0.1510 0.8054 0.9833 0.9997 0.4893 0.0727 0.0212 0.0045 0.0000 0.0000SAC47 RD551 0.0370 0.3172 0.6148 0.8516 0.8188 0.7555 0.6821 0.5548 0.0069 0.0000SAC48 Courtland 0.0370 0.3176 0.6153 0.8520 0.8179 0.7549 0.6815 0.5543 0.0063 0.0000SAC49 Sutter Island 0.1050 0.6694 0.9372 0.9961 0.6025 0.0000 0.0000 0.0000 0.0000 0.0000SAC50 Grand Island 0.1160 0.7075 0.9537 0.9979 0.6188 0.0000 0.0000 0.0000 0.0000 0.0000SAC51 Locke 0.0260 0.2305 0.4807 0.7303 0.9744 0.7931 0.7163 0.1445 0.0000 0.0000SAC52 Walnut Grove 0.0340 0.2951 0.5829 0.8260 0.9113 0.6957 0.5171 0.5104 0.0000 0.0000SAC53 Tyler Island 0.8490 1.0000 1.0000 1.0000 0.0023 0.0000 0.0000 0.0000 0.0000 0.0000SAC54 Andrus Island 0.6710 1.0000 1.0000 1.0000 0.1599 0.1209 0.0605 0.0000 0.0000 0.0000SAC55 Ryer Island 0.1310 0.7557 0.9705 0.9991 0.4556 0.0000 0.0000 0.0000 0.0000 0.0000SAC56 Prospect Island 0.3130 0.9766 0.9999 1.0000 0.0000 0.0000 0.0000 0.0000 0.0000 0.0000SAC57 Twitchell Island 0.3050 0.9736 0.9999 1.0000 0.6120 0.5493 0.4936 0.1944 0.0000 0.0013SAC58 Sherman Island 0.5810 0.9998 1.0000 1.0000 0.2837 0.2558 0.2267 0.1897 0.0000 0.0000SAC59 Moore 0.1260 0.7407 0.9658 0.9988 0.0225 0.0000 0.0000 0.0000 0.0000 0.0000SAC60 Cache Slough 0.0660 0.4949 0.8187 0.9671 0.9600 0.0343 0.0044 0.0174 0.0000 0.0000SAC61 Hastings 0.3370 0.9835 1.0000 1.0000 0.0000 0.0000 0.0000 0.0000 0.0000 0.0000SAC62 Lindsey Slough 0.0130 0.1215 0.2766 0.4767 1.0000 1.0000 0.7375 0.5036 0.0030 0.0000

Appendix ERisk Analysis
Sacramento and San Joaquin River Basins 27 Technical StudiesComprehensive Study, California December 2002
TABLE 6EXISTING CONDITION PROJECT PERFORMANCE STATISTICS FOR THE SAN
JOAQUIN RIVER BASIN
Long Term Risk Conditional Non-Exceedance Probability by Flood EventImpact
AreaImpact Area
Name
AnnualExceedanceProbability(Expected)
10Years
25Years
50Years 10% 4% 2% 1% 0.4% 0.2%
SJ 01 Fresno 0.0170 0.1548 0.3433 0.5688 0.9976 0.9976 0.9521 0.0003 0.0000 0.0000SJ 02 Fresno Slough East 0.0280 0.2436 0.5023 0.7523 0.9942 0.9690 0.1795 0.0001 0.0000 0.0000SJ 03 Fresno Sl West 0.4970 0.9990 1.0000 1.0000 0.4937 0.2502 0.2477 0.2452 0.0000 0.0000SJ 04 Mendota 0.3280 0.9813 1.0000 1.0000 0.4531 0.2857 0.2834 0.2787 0.0000 0.0000SJ 05 Chowchilla Bypass 0.0340 0.2940 0.5812 0.8246 0.9630 0.8810 0.0955 0.0001 0.0000 0.0000SJ 06 Lone Willow Sl 0.1110 0.6912 0.9470 0.9972 0.7092 0.0001 0.0000 0.0000 0.0000 0.0000SJ 07 Mendota North 0.0900 0.6112 0.9057 0.9911 0.5920 0.3008 0.2874 0.2780 0.0017 0.0000SJ 08 Firebaugh 0.0700 0.5150 0.8362 0.9732 0.7395 0.5397 0.0034 0.0033 0.0000 0.0000SJ 09 Salt Slough 0.1390 0.7750 0.9760 0.9994 0.4292 0.1704 0.1293 0.1243 0.0000 0.0000SJ 10 Dos Palos 0.1380 0.7738 0.9757 0.9994 0.4323 0.1852 0.1084 0.1062 0.0000 0.0000SJ 11 Fresno River 0.1320 0.7562 0.9707 0.9991 0.5144 0.1665 0.1154 0.1092 0.0000 0.0000SJ 12 Berenda Slough 0.4500 0.9975 1.0000 1.0000 0.0015 0.0001 0.0001 0.0001 0.0000 0.0000SJ 13 Ash Slough 0.3030 0.9731 0.9999 1.0000 0.1014 0.0001 0.0000 0.0000 0.0000 0.0000SJ 14 Sandy Mush 0.0910 0.6158 0.9085 0.9916 0.5706 0.5680 0.4708 0.0000 0.0000 0.0000SJ 15 Turner Island 0.1310 0.7535 0.9698 0.9991 0.5362 0.0028 0.0000 0.0000 0.0000 0.0000SJ 16 Bear Creek 0.0550 0.4342 0.7592 0.9420 0.8674 0.5322 0.4780 0.1019 0.0000 0.0000SJ 17 Deep Slough 0.0650 0.4900 0.8143 0.9655 0.7933 0.5318 0.3788 0.0000 0.0000 0.0000SJ 18 West Bear Creek 0.1310 0.7535 0.9698 0.9991 0.4464 0.1465 0.0168 0.0000 0.0000 0.0000SJ 19 Fremont Ford 0.2370 0.9330 0.9988 1.0000 0.2019 0.0000 0.0000 0.0000 0.0000 0.0000SJ 20 Merced River 0.1680 0.8414 0.9900 0.9999 0.3111 0.3036 0.0000 0.0000 0.0000 0.0000SJ 21 Merced R. North 0.5460 0.9996 1.0000 1.0000 0.0000 0.0000 0.0000 0.0002 0.0000 0.0001SJ 22 Orestimba 0.0090 0.0851 0.1994 0.3590 0.9972 0.9972 0.9811 0.7473 0.0000 0.0000SJ 23 Tuolumne South 0.3070 0.9743 0.9999 1.0000 0.2981 0.0271 0.0000 0.0000 0.0004 0.0000SJ 24 Tuolumne River 0.0060 0.0623 0.1486 0.2752 0.9974 0.9974 0.9974 0.9902 0.0559 0.0000SJ 25 Modesto 0.0130 0.1225 0.2788 0.4799 0.9974 0.9974 0.9974 0.0393 0.0000 0.0000SJ 26 3 Amigos 0.8540 1.0000 1.0000 1.0000 0.0000 0.0000 0.0000 0.0000 0.0000 0.0000SJ 27 Stanislaus South 0.6260 0.9999 1.0000 1.0000 0.0000 0.0000 0.0000 0.0000 0.0000 0.0000SJ 28 Stanislaus North 0.3140 0.9770 0.9999 1.0000 0.0032 0.0000 0.0000 0.0000 0.0001 0.0000SJ 29 Banta Carbona 0.2720 0.9580 0.9996 1.0000 0.2236 0.0174 0.0000 0.0000 0.0000 0.0000SJ 30 Paradise Cut 0.3120 0.9764 0.9999 1.0000 0.3025 0.0037 0.0000 0.0000 0.0000 0.0000SJ 31 Stewart Tract 0.3120 0.9762 0.9999 1.0000 0.2721 0.0146 0.0000 0.0000 0.0000 0.0000SJ 32 East Lathrop 0.3080 0.9749 0.9999 1.0000 0.2397 0.0272 0.0096 0.0002 0.0000 0.0000SJ 33 Lathrop/Sharpe 0.2220 0.9192 0.9981 1.0000 0.2542 0.0009 0.0005 0.0000 0.0000 0.0000SJ 34 French Camp 0.2220 0.9191 0.9981 1.0000 0.2542 0.0009 0.0005 0.0000 0.0000 0.0000SJ 35 Moss Tract 0.2230 0.9203 0.9982 1.0000 0.2435 0.0340 0.0006 0.0000 0.0000 0.0000SJ 36 Roberts Island 0.3720 0.9905 1.0000 1.0000 0.2193 0.0050 0.0000 0.0000 0.0000 0.0000SJ 37 Rough & Ready Is 0.2470 0.9417 0.9992 1.0000 0.1780 0.0721 0.0155 0.0000 0.0000 0.0000SJ 38 Drexler Tract 0.3540 0.9874 1.0000 1.0000 0.2380 0.0290 0.0000 0.0000 0.0000 0.0000SJ 39 Union Island 0.3210 0.9793 0.9999 1.0000 0.2405 0.0600 0.0003 0.0000 0.0000 0.0000SJ 40 SE Union Island 0.2180 0.9147 0.9979 1.0000 0.2462 0.0297 0.0037 0.0000 0.0000 0.0000SJ 41 Fabian Tract 0.2240 0.9205 0.9982 1.0000 0.2259 0.0119 0.0001 0.0000 0.0000 0.0000SJ 42 RD 1007 0.2140 0.9097 0.9975 1.0000 0.2516 0.0181 0.0002 0.0000 0.0000 0.0000

Appendix ERisk Analysis
Sacramento and San Joaquin River Basins 28 Technical StudiesComprehensive Study, California December 2002
Future Without-Project and With-Project ConditionProject performance statistics have not yet been developed for future without-projectconditions. The Corps’ future without project condition only includes those projects thathave been authorized for construction; projects that are in various stage of planning but havenot been authorized are not considered. Examples of projects that may affect flood risk inthe future without-project condition include: authorized flood management construction inthe American River Basin, authorized levee improvements that are part of the SacramentoRiver Flood Control Project System Evaluation, and the ongoing Sacramento BankProtection Project.
Project performance statistics can also be used to formulate and compare alternative plans.Although no alternative plans were developed by the Comprehensive Study, HEC-FDA wasused to calculate project performance statistics for various basin-wide modeling scenariosand evaluations. The purpose of these basin-wide evaluations was two-fold: (1) to develop agreater understanding of the river systems and how various types of flood damage reductionand environmental restoration measures could affect project performance, and (2) to test andrefine the technical evaluation process, including risk analysis, and identify any problems orlimitations.
Generating hybrid stage-frequency curves from the hydraulic models and passing this data toHEC-FDA is one of the most time-consuming steps in the basin-wide evaluation process.During conceptual planning stages, it may not be necessary or time-efficient to examine allof the index points and damage areas. Instead, the study developed a procedure in which theindex points and damage areas were grouped into larger, “bubble” areas for quick, initialanalysis. Nine of these bubble areas were delineated in the Sacramento River basin andseven in the San Joaquin River basin. One index point was chosen to represent all damageareas within a given bubble area. The index point was chosen based on several factorsincluding stage conditions, topography, initial breakout, and significance of damages caused.The hydrology and reservoir operation steps of the evaluation process do not change, andhydrographs from all frequency events are still run through UNET. However, fewer stage-frequency curves are developed and iterations are stopped when the HEC-FDA risk resultsare within an acceptable margin of the desired targets. Although this process does not permitthe calculation of economic damages, it was believed that if project performance wasimproved over existing conditions for most (if not all) of the representative locations, then itcould reasonably expected that flood damages would also be reduced for the entire basin.Because not all index points are evaluated in the expedited analysis, there is a potential toover- or underestimate the success of an evaluation in meeting its goals. Thus, the expeditedanalysis process is limited to conceptual planning.
Figure 7 shows an example project performance comparison for a hypothetical impact area.The top panel compares annual exceedence probabilities for existing conditions with twoalternative plans. Both alternative plans have lower annual exceedence than for existingconditions, thus both represent an improvement. Similarly, long-term risk is lower for bothplans compared to existing conditions. Both plans also have improved non-exceedencevalues (i.e., the ability to pass specific events) for the 10-, 25-, and 50-return frequencyevents, although values for the 100- year return frequency event are slightly less than existingconditions.

Appendix ERisk Analysis
Sacramento and San Joaquin River Basins 29 Technical StudiesComprehensive Study, California December 2002
FIGURE 7 – EXAMPLE OF PROJECT PERFORMANCE COMPARISON BETWEEN ALTERNATIVEPLANS
EXPECTED ANNUAL DAMAGES
In a risk analysis, expected annual damages is defined as the average or mean of all possiblevalues of damage determined by Monte Carlo sampling of discharge-exceedence probability,stage-discharge, and stage-damage relationships and their associated uncertainties. It iscalculated as the integral of the damage-probability function, as shown in Figure 1. Adetailed description of the economic analysis is included in Appendix F – EconomicTechnical Documentation. A brief overview of the key elements and results of the economicanalysis are included below.
HEC-FDA Input ParametersDamage Categories - Damage categories used in the Comprehensive Study economicanalysis include: residential, mobile homes, commercial, industrial, public / semi-public,farmsteads, crops, and others (including damage to autos, roads, traffic disruption, andemergency response costs, primarily within urbanized areas).
Land Use/Structural Inventories - GIS was used to develop crop and other land useinventories for both basins utilizing DWR digitized land use files. GIS was also used todevelop the structural inventories using digitized county parcel map files, geocoding of streetaddresses, or by physically comparing floodplain maps with county assessor parcel maps.
Structural and Contents Values - Parcels were linked to assessor data files to obtain structuralimprovement values and other information. Adjustments were made to the assessed values toreflect October 2001 prices. Publicly owned parcels, which are not assessed property taxes,are not currently included in the structural inventories but work is underway to assignimprovement values by applying construction factors. Contents values were assigned based
Conditional Non-Exceedence
10% 4% 2% 1% 0.4% 0.2%Flood Event (Exceedence)
Annual Exceedence Probability
0.00
0.05
0.10
0.15
Plans
Prob
abili
ty ExistingPlan 1Plan 2
Long-Term Risk
0.000.200.400.600.801.00
10 25 50Period in Years
Prob
abili
ty
ExistingPlan 1Plan 2
0.000.200.400.600.801.00
Prob
abili
ty
Conditional Non-Exceedence
10% 4% 2% 1% 0.4% 0.2%Flood Event (Exceedence)
Annual Exceedence Probability
0.00
0.05
0.10
0.15
Plans
Prob
abili
ty ExistingPlan 1Plan 2
ExistingPlan 1Plan 2
Long-Term Risk
0.000.200.400.600.801.00
10 25 50Period in Years
Prob
abili
ty
ExistingPlan 1Plan 2
ExistingPlan 1Plan 2
0.000.200.400.600.801.00
Prob
abili
ty

Appendix ERisk Analysis
Sacramento and San Joaquin River Basins 30 Technical StudiesComprehensive Study, California December 2002
upon percentages developed by previous Corps studies: residential and mobile homes, 50%;commercial, 100%, industrial, 150%, public/semi-public, 50%; and farmsteads, 65%.
Urban Depth-Damage Relationships - Damage generally increases as depth of floodingincreases. Generic residential depth-damage functions developed by the Corps’ Institute forWater Resources were used in the Comprehensive Study. For other urban damagecategories, depth-damage functions developed by the Sacramento District and based uponFEMA information were used.
Agricultural Depth-Damage Relationships - About 1.9 million acres out of the total 2.2million acres in the study area is in agricultural production, making crop damage analysis animportant element in the Comprehensive Study. Although over 100 different crops aregrown within the area, only predominant crop types were evaluated to facilitate the analysis:row crops, fruit crops, alfalfa, mixed pasture, rice, truck crops, and vine crops. The types ofagricultural flood damage being evaluated include direct production costs incurred prior toflooding, the net value of crop, the depreciated value of perennial crops, and clean-up andrehabilitation costs, with consideration for the seasonality and duration of flooding.
Existing ConditionExisting condition expected annual damages exceed $280 million (October 2001 price levels)for both basins combined. Most of the damage is expected to occur in the Sacramento RiverBasin (about $251 million EAD) compared to the San Joaquin River Basin (about $31million EAD). The distribution of damage within the two basins is significantly different,with urban structural damage representing about 77 percent of total Sacramento River BasinEAD compared to about 39 percent within the San Joaquin River Basin. Refer to Appendix F– Economics Technical Documentation for a detailed accounting of economic damages.
Future Without-Project ConditionThe estimation of existing condition expected annual damage is only part of the “without-project” analysis. A complete analysis should take into account future development likely tooccur over the planning horizon. “Future without project” population and economicdevelopment levels, and associated flood damage, have not been estimated at this time.
Alternative or With-Project Economic EvaluationsEconomic analyses are performed for proposed alternative plans in the same manner asdescribed for the existing and future without project conditions. Plan components aresimulated using the hydrology, hydraulics, and geotechnical tools and this information ispassed to HEC-FDA for a determination of EAD. The with-project EAD can then becompared with the existing condition and future without-project EAD to estimate the benefitsof the alternative plan. Because no alternative plans were developed by the ComprehensiveStudy, no with-project economic evaluations were performed.

Appendix ERisk Analysis
Sacramento and San Joaquin River Basins 31 Technical StudiesComprehensive Study, California December 2002
ENVIRONMENTAL RESTORATION
Uncertainty is also associated with the environmental restoration element of theComprehensive Study. Like flood damage reduction studies, environmental restorationprojects also rely on information and analytical methods associated with varying degrees ofuncertainty and reliability. For example, the Ecosystem Function Model developed by theComprehensive Study uses hydrologic data, topography, and simplified algorithms to guidethe formulation of ecosystem restoration plans. There is uncertainty in the gage data uponwhich the hydrology was developed, accuracy of mapping, and ability of the algorithms toaddress ecological complexity. It may be possible to incorporate risk and uncertainty infuture enhancements of the EFM. For example, a relationship between flow duration andacres of habitat could become part of a Monte Carlo simulation. Similar to the stage-damagerelationships used in HEC-FDA, several different stage-acres of habitat curves could becreated for each distinct type of habitat (i.e. riparian wetlands, seasonal wetlands, uplands,etc).
Formal risk analyses are uncommon in environmental restoration projects and the Corpscurrently does not have a standard approach or model. Although risk analysis forenvironmental restoration cannot be quantified at this time, it can be incorporated into projectformulation through the development of plans that are flexible or provide the opportunity foradjustment in the future. The Comprehensive Study has advocated adaptive management asone method of addressing the uncertainties associated with the success of environmentalrestoration.
SUMMARY & CONCLUSIONS
The risk analysis performed by the Comprehensive Study provides economic damages andproject performance information suitable for basin-wide flood management and ecosystemrestoration planning in the Sacramento and San Joaquin River basins. The models and othertechnical tools developed by the Comprehensive Study, including the HEC-FDA model, areexpected to continue to be updated and improved as they are utilized by future projects.Future work related to risk analysis will likely involve the collection of additional economicdata, and evaluation of future without-project conditions.
The Comprehensive Study seeks to address two critical problems affecting Central Valleyriver systems and their floodplains - ecosystem restoration and flood damage reduction -through a watershed-based approach that requires continued input and involvement across abroad range of public interest groups. Upon evaluating the risk analysis practices of theCorps of Engineers, The National Resource Council’s Committee on Risk-Based Analysisfor Flood Damage Reduction made the following statement that supports the planningstrategy adopted by the Comprehensive Study:
“The Corps’s risk analysis techniques and flood damage reduction studies will produce theirgreatest benefits if these techniques and studies are executed within a comprehensiveplanning paradigm and framework designed to make the best social, economic, andenvironmental uses of the nation’s floodplain resources.” – Risk Analysis and Uncertainty inFlood Damage Reduction Studies, NRC 2000

Appendix ERisk Analysis
Sacramento and San Joaquin River Basins 32 Technical StudiesComprehensive Study, California December 2002
REFERENCES
CA Department of Water Resources, Division of Flood Management, “Multi-ObjectiveApproaches to Floodplain Management on a Watershed Basis”, various draft reports.
Moser, David A (1997) “The Use of Risk Analysis By The U.S. Army Corps of Engineers,”Proceedings of a Hydrology & Hydraulics Workshop on Risk Based Analysis forFlood Damage Reduction Studies hosted by U.S. Army Corps of Engineers, 22October 1997
NRC (2000) Risk Analysis and Uncertainty in Flood Damage Reduction Studies, NationalResearch Council, National Academy Press, Washington DC
USACE (2000 a) Design and Construction of Levees, EM 1110-2-1913, U.S. Army Corps ofEngineers (HQUSACE), Washington DC
USACE (2000 b), Planning Guidance Notebook, ER 1105-2-100, U.S. Army Corps ofEngineers (HQUSACE), Washington DC, 22 April 2000.
USACE (1998) HEC-FDA Flood Damage Reduction Analysis, User’s Manual CPD-72,Version 1, U.S. Army Corps of Engineers, Hydrologic Engineering Center, Davis CA
USACE (1996 a) Engineering and Design – Risk-Based Analysis for flood DamageReduction Studies, EM 1110-2-1619, U.S. Army Corps of Engineers (HQUSACE),Washington DC
USACE (1996 b) Risk Based Analysis for the Evaluation of Hydrology/Hydraulics,Geotechnical Stability and Economics in Flood Damage Reduction Studies, ER 1105-2-101, U.S. Army Corps of Engineers (HQUSACE), Washington DC
USACE (1996 c) Risk-Based Analysis for Flood Damage Reduction Studies, EM 1110-2-1619, U.S. Army Corps of Engineers (HQUSACE), Washington DC
USACE, “Depth-Damage Functions for Corps of Engineers Flood Damage ReductionStudies,” Institute for Water Resources, U.S. Army Corps of Engineers, WashingtonDC
USWRC (1995) Engineering and Design – Introduction to Probability and ReliabilityMethods for Use in Geotechnical Engineering, ETL 1110-2-547, United States WaterResources Council
USWRC (1983) Economic and Environmental Principles and Guidelines for Water andRelated Land Resources Implementation Studies, United States Water ResourcesCouncil